
ABSTRACT
Extreme weather and climate-related events affect human health by causing death, injury, and illness, as well as having large socioeconomic impacts. Climate change has caused changes in extreme event frequency, intensity, and geographic distribution, and will continue to be a driver for change in the future. Some of these events include heat waves, droughts, wildfires, dust storms, flooding rains, coastal flooding, storm surges, and hurricanes. The pathways connecting extreme events to health outcomes and economic losses can be diverse and complex. The difficulty in predicting these relationships comes from the local societal and environmental factors that affect disease burden. More information is needed about the impacts of climate change on public health and economies to effectively plan for and adapt to climate change. This paper describes some of the ways extreme events are changing and provides examples of the potential impacts on human health and infrastructure. It also identifies key research gaps to be addressed to improve the resilience of public health to extreme events in the future.
Implications: Extreme weather and climate events affect human health by causing death, injury, and illness, as well as having large socioeconomic impacts. Climate change has caused changes in extreme event frequency, intensity, and geographic distribution, and will continue to be a driver for change in the future. Some of these events include heat waves, droughts, wildfires, flooding rains, coastal flooding, surges, and hurricanes. The pathways connecting extreme events to health outcomes and economic losses can be diverse and complex. The difficulty in predicting these relationships comes from the local societal and environmental factors that affect disease burden.
Introduction
Extreme weather and climate-related events are known to cause essential infrastructure failures, economic losses, and population displacements, leading to a variety of resulting health issues (Bell et al. Citation2016). While there is no single definition of an extreme event, for the purposes of this paper they are considered weather and climate-related events that rarely occur at a given location or have significant socioeconomic impacts. Weather and climate both contribute to extreme events, and over the last century the frequency and intensity of some extreme events have changed (Field Citation2012; Melillo, Richmond, and Yohe Citation2014; Stocker et al. Citation2013). The National Climate Assessment states that “human-induced climate change is projected to continue, and it will accelerate significantly if global emissions of heat-trapping gases continue to increase” (Field Citation2012; Melillo, Richmond, and Yohe Citation2014; Stocker et al. Citation2013). Thus, past exposure to extremes may not be a predictor of future risk. Understanding the observed changes to date and expectations of future extreme event risk are critical in developing public health systems resilient to extremes.
This paper focuses on key extreme events for which the changes in frequency, intensity, and geographic distribution have been linked to anthropogenic climate change. These events include heat waves, droughts, wildfires, dust storms, flooding rains, hurricanes, coastal flooding, and storm surge. Other extreme events have significant public health consequences but there is a lack of sufficient understanding of how climate change is related to these events (such as for tornadoes). Included are descriptions of observed and projected changes in extreme events and general health effects, providing a concept of observed associations and potential mechanisms, and exemplified by specific events. The paper concludes with an identification of research gaps and innovative research approaches, both of which have public health implications for improving resiliency to extreme events. The focus of this paper is on the United States; however, international examples are incorporated as an illustration of key events.
Infrastructure impacts
Extreme events can overburden or disrupt essential infrastructure access and functionality. Essential infrastructure includes public health facilities, transportation infrastructure such as roads and trains, energy grids, and water treatment. Depending on the severity and location of the extreme event, infrastructural systems can either act as a safeguard against excess health impacts or exacerbate potential health threats (Srinivasan, O’Fallon, and Dearry Citation2003). Disruptions of essential infrastructure can impede evacuation from hazardous areas, slow the delivery of essential health care, and add burden to individuals experiencing an extreme event (Deshmukh, Oh, and Hastak Citation2011; Skinner, Yantzi, and Rosenberg Citation2009). In addition, many infrastructure systems are reliant on one another, risking a cascading failure resulting from the disruption or failure of one system leading to the disruption of other interconnected systems (Bell et al. Citation2016). A commonly occurring cascading failure is when loss of electricity subsequently leads to failures in hospital facilities, public transportation, and water and sewage treatment systems (Klinger, Landeg, and Murray Citation2014). This was exemplified by the 2003 blackout related to a heat wave in the northeastern United States that led to failure of hospital emergency generators, untreated sewage, and food contamination from loss of refrigeration (Freese et al. Citation2006; Kile et al. Citation2005; Klein et al. Citation2007; Prezant et al. Citation2005), increasing the incidence of total mortality and gastrointestinal illnesses in New York City (Anderson and Bell Citation2012; Beatty et al. Citation2006; Lin et al. Citation2011). Although cascading failures can be local, it is important to understand that these failures can extend beyond the location of the extreme event to systems of the surrounding area.
Not all infrastructure is built to compensate for local extreme event magnitude and severity, increasing risk of failure during an extreme event. Current infrastructure in many communities is designed to perform at a capacity assuming historical weather patterns, though as the frequency and intensity of extreme events shift, the performance capabilities are compromised (Dell et al. 2014; Fennell et al. Citation2015). For example, dams designed for a certain maximum precipitation estimate may be underengineered, given that extreme precipitation events are becoming more intense (Groisman et al. Citation2005). These discrepancies between past, present, and future extremes can cause failures that potentially lead to negative health outcomes.
Economic loss
Just as extreme events can disrupt infrastructure, they can also cause catastrophic economic losses. A report series by the National Oceanic and Atmospheric Administration (NOAA) on U.S. billion-dollar disasters assesses the total, direct losses from numerous disasters, including hurricanes, floods, drought and heat waves, severe local storms (i.e., tornado, hail, and straight-line wind damage), wildfires, crop freeze events, and winter storms (National Centers for Environmental Information [NCEI] Citation2017). These loss estimates reflect only the direct effects of events on constitute total losses, both insured and uninsured. The insured and uninsured direct loss components include physical damage to residential, commercial, and government/municipal buildings, material assets within a building, time element losses (i.e., businesses interruption), vehicles, boats, offshore energy platforms, public infrastructure (i.e., roads, bridges, buildings), and agricultural assets (i.e., crops, livestock, timber). These disaster cost assessments incorporate input from a variety of public and private data sources (Smith and Katz Citation2013).
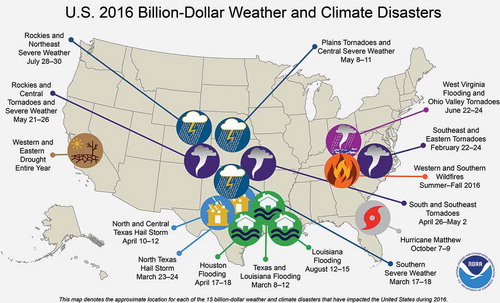
Since 1980, the United States has sustained more than 200 extreme event disasters in which the overall damage costs reached or exceeded US$1 billion, including adjustments based on the present Consumer Price Index (CPI). This section only reports the CPI adjusted costs. The cumulative costs of these events exceed $1.1 trillion (NCEI Citation2017). Just in 2016, there were 15 extreme events with losses exceeding $1 billion across the United States. These events included a drought, a wildfire, four inland floods (i.e., nontropical), eight severe storms, and a hurricane (), resulting in 138 fatalities and $46 billion in total, direct costs (NCEI Citation2017). The year 2016 had the second highest annual number of U.S. billion-dollar disasters, behind 2011, in which 16 events occurred. In recent years, the United States has experienced a higher frequency of billion-dollar inland flood events, and 2016 doubled the previous annual record, set in 1980, for number of billion-dollar inland flood events. Inland flood events are particularly costly, as a high percentage of the damage is uninsured (Smith and Matthews Citation2015).
Figure 1. The location and type of the 15 weather and climate disasters in 2016 with losses exceeding $1 billion (NCEI Citation2017).
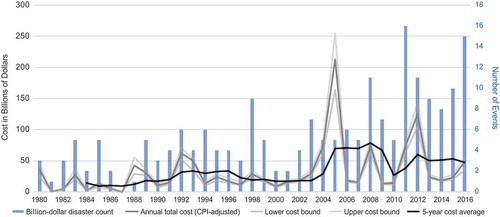
There has been a rising number of events that cause significant amounts of damage in the United States. During 1980–2016, the annual average number of billion-dollar events was 5.5. For the most recent 5 years (2012–2016), the annual average is 10.6 events. The year 2005 was the costliest since 1980 due to the combined impacts of Hurricanes Katrina, Rita, Wilma, and Dennis, as losses exceed $200 billion. The year 2012 was the second costliest year due to the historic U.S. drought costing $30 billion, Hurricane Sandy costing $65 billion, and other billion-dollar events creating losses in excess of $120 billion (). Once the damage costs are assessed for 2017, these rankings may change.
Figure 2. Time series showing the number (bar height) and type (bar color) of billion-dollar weather and climate disasters in the United States since 1980. The gray line shows total annual costs. The black line shows the running 5-year average. All cost lines CPI-adjusted to 2016 dollars (NCEI Citation2017).
It is important to note that increases in damage costs over recent years are also affected by increased development in vulnerable areas. Coasts and floodplains are particularly at risk to extreme events, and have also seen growth in population and infrastructure over the last several decades (Moser et al. Citation2014). Increases in population and material wealth may exacerbate the damage costs of an extreme event. Additionally, minimum standards of building codes are not always sufficient to reduce significant damage from extreme events (Zoraster Citation2010).
Hurricanes tend to result in the costliest damages in the United States. During 1980–2016, hurricanes caused $560.1 billion worth of damage and had the highest average event cost at $16 billion per event. Drought ($223.8 billion), severe storms ($180.1 billion), and inland flooding ($110.7 billion) have resulted in the second, third, and fourth highest levels of damage costs. Severe storms have caused the highest number of billion-dollar disaster events (83), while the average event cost is the lowest at $2.2 billion. Hurricanes and inland flooding represent the second and third most frequent event types, 35 and 26, respectively, as of January 2017.
The distribution of fatalities by disaster type is similar to the cost distribution. Hurricanes are responsible for the highest number of deaths (3,210 between 1980 and 2016), followed by drought and heat-wave events (2,993) and severe storms (1,546). Over the last several decades, U.S. disaster event costs have increased while deaths have generally decreased, in part due to greater awareness and preparation for extreme events. However, there have been notable outliers to the trend of lower fatalities, such as Hurricane Katrina (~1,833 deaths) and the severe tornado outbreaks of 2011 (~550 deaths).
It remains difficult to quantify how much of the rising costs of extreme events is due to demographic and economic changes, and what role climate change has played. However, there are qualitative linkages to economic impacts. For example, for Superstorm Sandy, the storm surge that caused the majority of the economic damage was likely made worse by climate-change-induced sea-level rise (Sweet et al. 2016). Similarly, there is evidence linking increases in wildfires in the western United States to climate change (Melillo, Richmond, and Yohe Citation2014; Karl, Melillo, and Peterson 2009).
As extreme events continue to increase in severity and frequency and communities continue to expand and develop, the historical patterns of economic loss during these events will likely continue to increase in the future. The rates and severity of these losses will likely depend on a variety of factors, including rates of development, planning and preparation, and changes in the economy.
Population of concern
Climate change is a significant threat to the health of the American people and others around the world (Crimmins et al. Citation2016; Field Citation2012; Frumkin et al. Citation2008; Haines et al. Citation2006). Because of the ubiquitous nature of climate change, every person is at some level of risk, though particular populations, based on local exposure, sensitivity, and adaptive capacity, are especially vulnerable to the health impacts of climate change (Gamble et al. Citation2016). Environmental and social factors can have a significant influence on the extent to which individuals are affected by changes in climate and weather. Sensitivity to these impacts is intrinsic to factors related to underlying health conditions, socioeconomic circumstances, and population demographics (Frumkin et al. Citation2008; Penner and Wachsmuth Citation2008). Generally, populations with fewer resources or individuals with chronic health conditions are more sensitive and have lower adaptive capacity to threats associated with extreme events and changes in climate (Keppel Citation2007). Health risks can also vary based on the underlying risks that already exist in a geographic location. For example, under environmental stress, a previously existing threat, such as a Vibrio bacteria, can expand its geographic and temporal range to occur in populations that previously were not exposed (Centers for Disease Control and Prevention [CDC] Citation2005). Extreme events pose a variety of health risks that can sometimes be difficult to identify because the health outcomes can be combinations of direct, indirect, and delayed impacts (McMichael and Lindgren Citation2011).
Although many locations will experience the impacts from changes in extreme events, coastal regions and the people that live there are uniquely vulnerable to the impacts that accompany climate change for several reasons. First, large portions of the earth’s population lives near or along the coastline, and that population is growing due to migration to coastal areas (Hallegatte et al. Citation2013). Second, greater hurricane intensity and more extreme precipitation events increase flooding risk (Melillo, Richmond, and Yohe Citation2014). Third, sea-level rise results in more significant storm surge and extreme tidal flooding that can impact infrastructure and water quality (Sweet et al. Citation2016). The combination of these factors increases the risk of coastal hazards and the associated health effects (Bell et al. Citation2016).
Temperature extremes
Observed changes
As climate change has resulted in a rise of the global mean temperature, there has been an increase in the frequency and severity of heat waves in many parts of the world. A heat wave that persisted throughout the summer of 2003 brought to the European continent devastating impacts that included approximately 40,000 additional deaths and a failure of social and health systems to adequately respond (García-Herrera et al. Citation2010; Russo, Sillmann, and Fischer Citation2015). Remarkably, the magnitude and spatial extent of the 2003 European heat wave were exceeded only 7 years later by a heat wave that struck Russia, leading to as many as 55,000 deaths and ~$15 billion of total economic loss attributed to the heat-wave event (Barriopedro et al. Citation2011). Both of these events were found to have been worse due to anthropogenic climate change (Dole et al. Citation2011; Otto et al. Citation2012; Rahmstorf and Coumou Citation2011; Stott, Stone, and Allen Citation2004). In addition, one estimate of the 2003 European heat wave found that “out of the estimated ~315 and ~735 summer deaths directly attributed to the heat wave event in Greater London and Central Paris, respectively, 64 (±3) deaths were attributable to anthropogenic climate change in London, and 506 (±51) in Paris” (Mitchell et al. Citation2016). Another example is the early 2017 heat wave that struck Australia and eclipsed the temperature records last set in 1939 across eastern and central areas of the continent. The record hot summer in New South Wales was found to be linked directly to climate change. Maximum temperatures of the magnitude seen in the 2016–2017 southeastern Australia summer were found to be at least 10 times more likely today than at the start of the 20th century (Climate Central Citation2017). In the United States, more than $44 billion in losses resulted from the heat waves and droughts of 2011 and 2012 (NCEI Citation2017). In some areas, high temperatures exceeded the records of the Dust Bowl era in the 1930s. July 2012 had the hottest contiguous U.S. temperature for any month since national records began (Blunden et al. Citation2013).
Many of the most severe and long-lasting heat waves are linked to periods of extreme drought and low humidity. However, heat waves can be exacerbated by persistently warm overnight temperatures, such as during the short but intense Chicago heat wave of 1995 when unusually high humidity occurred with extremely warm temperatures and led to more than 500 deaths in the city and more than 800 nationally (Changnon, Kunkel, and Reinke Citation1996; Kaiser et al. Citation2007). Global daily minimum temperatures have had a greater increase than daily maximum temperatures since the middle of the 20th century (Melillo, Richmond, and Yohe Citation2014), making such events as the Chicago heat wave more likely to occur. In some areas, such as the Asia-Pacific region and parts of Eurasia, there has been nearly a doubling of the occurrence of warm nights, defined as temperatures in the upper 90th percentile (Choi et al. Citation2009; Donat et al. Citation2013).
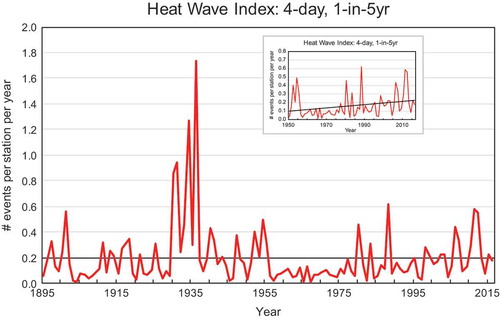
In the United States, the spatial extent of extremes in high minimum and maximum temperature has been increasing in recent decades. On an annual basis, much above normal maximum temperatures (upper 10th percentile for the period of record) covered more than 20%of the contiguous United States for 12 of the last twenty-seven years, since 1990. More than 60% of the country was affected in 2012 and 2016, eclipsing the worst of the 1930s Dust Bowl era (). Warm extremes in minimum temperature have been even more widespread in recent decades. More than 70% of the contiguous United States was affected by much above normal minimum temperatures (upper 10th percentile for the period of record) in three of the past 5 years () (Gleason et al. Citation2008). A metric of short-duration extreme heat (4-day mean temperatures exceeding a threshold for a 1-in-5 year recurrence) indicates a consistently above average number of occurrences in the 1980s and 2000s, though the 1930s experienced higher numbers (). The high number of short-duration heat waves in the 1930s reflects the multiyear severe drought of the Dust Bowl period, combined with deleterious land-use practices. This contributed to the intense summer heat through depletion of soil moisture and reduction of the moderating effects of evaporation (Walsh et al. Citation2014).
Figure 3. Annual percentage of the United States with maximum temperatures (upper graph) and minimum temperatures (lower graph) much above normal (upper 10th percentile; red) and much below normal (lower 10th percentile; blue). Updated from Gleason et al. (Citation2008).
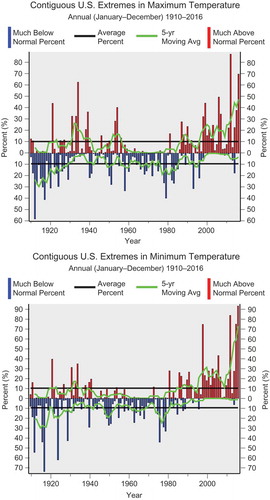
Figure 4. Annual time series (1895–2016) of heat-wave index averaged over United States. Heat-wave events are defined as 4-day periods with the average temperature exceeding the threshold for a 1-in-5-years recurrence interval. The heat-wave time series is dominated by the events of the 1930s. The heat during this period was exacerbated by severe drought and poor land management practices, which denuded large areas of vegetation in the Great Plains. Thus, the normal cooling afforded by transpiration from vegetation was largely absent. The period from the mid 1950s through the 1970s was characterized by a very low number of events. Since then, there has been a gradual increase in the number of events. Over the past 10 years, values have been near to above normal. Bold horizontal line at 0.20 indicates the long-term average. Figure inset shows the trend in heat-wave index over the United States during 1950–2016. (Data source: NOAA’s NCEI.)
As greenhouse gas concentrations continue to rise, model projections show the incidence and severity of heat waves increasing in all regions of the world throughout the 21st century (Field Citation2012; Melillo, Richmond, and Yohe Citation2014; Stocker et al. Citation2013). In the United States, summer temperatures are projected to continue rising, most sharply in central and western areas of the country where greater summer reductions in soil moisture are projected to occur (Melillo, Richmond, and Yohe Citation2014). Some projections show that heat waves that were historically a once-in-20-year event will occur every 2 or 3 years over much of the nation by the latter half of this century (Kharin et al. Citation2013). By the end of this century, under the Intergovernmental Panel for Climate Change Fifth Assessment highest projections (AR5) of increasing greenhouse gases, events of the same severity as that in Russia in the summer of 2010 will become the norm and are projected to occur as often as every 2 years in regions such as southern Europe, North America, South America, Africa, and Indonesia (Russo et al. Citation2014).
While the frequency of extremely warm temperatures and heat waves has increased, the incidence of unusually cold conditions in many parts of the world has decreased significantly since the 1950s (Donat et al. Citation2013). For example, in 2015, 16% of the earth with at least 100 years of data experienced an extreme (first, second, or third) warm year, while only 0.2% had an extreme cold year (Kam et al. Citation2016). In 2014, 12% of the earth had an extreme warm year, whereas nowhere on Earth had an extreme cold year (Kam et al. Citation2015). Using anthropogenic versus natural forcing with climate models, it was found that both of these extreme warm years were largely due to increases in greenhouse gases. In the United States, the decade of the 2000s had the fewest number of cold waves since 1895 () (Peterson, Stott, and Herring Citation2012). The reduction in cold outbreaks also is reflected in an average of twice as many record high maximum temperatures than record low minimum temperatures across the United States since the late 1990s (Meehl et al. Citation2009). Models project robust decreases in cold extremes by the end of the 21st century, with the magnitude of the changes dependent on the increase in greenhouse gas concentrations. The coldest night of the year is projected to increase more than the hottest day with the largest increases in the high latitudes of the Northern Hemisphere (Stocker et al. Citation2013). At the same time, winter storm tracks have shifted northward and their intensity and frequency has increased since the 1950s (Melillo, Richmond, and Yohe Citation2014).
Figure 5. Annual time series (1895–2016) of cold-wave index averaged over United States. Cold-wave events are defined as 4-day periods with the average temperature being less than the threshold for a 1-in-5-years recurrence interval. The cold-wave time series exhibits high year-to-year variability. This reflects the occasional occurrence of intensely cold air masses usually originating in Siberia that affect large swaths of the United States. The large area covered by these infrequent events dominates the time series. The intense cold causes a wide range of severe impacts. A key feature of this time series is the rather low values since the mid 1990s. Since then, there have been no cold waves with the intensity and areal coverage that are characteristic of the historic cold waves in the earlier record. Bold horizontal line at 0.20 indicates the long-term average. Figure inset shows the trend in cold wave index over the United States during 1895–2016. (Data source: NOAA’s NCEI.)

Health impacts
Research has shown that short-term increases in mortality and morbidity occur during periods of high heat (Basu Citation2002; Braga, Zanobetti, and Schwartz Citation2001; Melillo, Richmond, and Yohe Citation2014; Sarofim et al. Citation2016). While several biological explanations for these increases exist, heat-related illness and death are predominantly related to the concept of thermoregulation, the ability to manage one’s body temperature. When an individual is exposed to extreme heat, the body responds by reallocating blood flow from the vital organs in the central portion of the body to below the skin’s surface, believed to be a mechanism to cool the overall system. When a person is unable to thermoregulate effectively due to dehydration, aging, medication use, or chronic health conditions (e.g., diabetes) the body reallocates too much blood from the vital organs, resulting in increased stress on the heart and lungs, which can contribute to severe illness and other fatal health events (Astrand et al. Citation2003).
Epidemiological research has shown that heat-related mortality is dependent on the severity of the heat event and the health status of the affected population (Hajat et al. Citation2006; Sarofim et al. Citation2016). Older populations are at higher risk to the impacts of extreme temperatures (Bobb et al. Citation2014). Older populations, particularly those over the age of 65 years, and children have a higher risk of heat-related illness and death (Sarofim et al. Citation2016; Zanobetti et al. Citation2012). Older adults often have preexisting health conditions such as cardiovascular, respiratory, renal, and neurological diseases that can interfere with their body’s ability to respond to heat stress (Schwartz Citation2005; Stafoggia et al. Citation2006). Demographic and socioeconomic factors such as being non-Hispanic black (Berko et al. Citation2014; O’Neill, Zanobetti, and Schwartz Citation2005), low-income (Madrigano et al. Citation2013), high school educated or less (Medina-Ramón et al. Citation2006), living alone (Madrigano et al. Citation2013), and lacking access to transportation (Klinenberg Citation2003) and to air conditioning (O’Neill, Zanobetti, and Schwartz Citation2005) put individuals at risk to heat-related illness and death. Community-level characteristics, such as having access to green space (Tan et al. Citation2010), may protect populations. Reductions in green space combined with increasing temperatures may expose more individuals to harmful temperatures in the future (Conlon et al. Citation2016). Urban populations face elevated heat exposures from the urban heat island effect, where urban areas are warmer than surrounding rural areas due to land cover and building surfaces that absorb heat during the day and slowly release heat at night, causing warmer evening temperatures and decreased evapotranspiration (CDC Citation2013; Wilby Citation2008). It should also be noted that temperature variability, which will likely increase with climate change, also leads to negative health outcomes (Shi et al. Citation2016).
Temperature-related illness and death are likely underestimated, given the challenges in consistent reporting by clinicians. Often, death certificates and hospitalization records do not explicitly state that an individual had a temperature-related response (Sarofim et al. Citation2016), especially when temperature is not directly identified as a contributing factor.
Although unusually high temperatures in recent decades have garnered much attention, cold temperatures, while anticipated to be fewer in the future, can cause a substantial health burden. A recent study identified that deaths due to cold accounted for the majority of temperature-related mortality (Gasparrini et al. Citation2015). When a person experiences cold temperatures, that person’s ability to thermoregulate is impaired, leading to reduced core temperatures (e.g., hypothermia). In response, the body redistributes heat, eventually at the expense of cardiac and cerebrovascular functions. Impacts of exposure to cold temperatures can range from frostbite, to hypothermia, cardiac arrhythmias, cardiac arrest, and loss of cerebral blood flow (Capon, Demeurisse, and Zheng Citation1992; Lloyd Citation1991). Like heat vulnerability, cold-related health impacts are driven by age, socioeconomic status, and where one lives (Anderson and Bell Citation2009; Gasparrini et al. Citation2015). Heat-related health impacts are expected to be greater than the reduction in cold-related health impacts as climate change continues in the future (Sarofim et al. Citation2016).
Air pollution has shown to worsen as warmer temperatures facilitate ground-level ozone formation, a key component of smog. Increases in ground-level ozone occur as a result of both natural processes (e.g., wildfires and vegetation) and human activities (e.g., power generation and motor vehicles), while also being exacerbated by warmer temperatures (Bloomer et al. Citation2009; Weaver et al. Citation2009). Increases in ground-level ozone have been associated with reduced lung function, increasing hospital admittance and emergency department visits (Bell et al. Citation2004; U.S. EPA Citation2013; Gonçalves et al. Citation2007; Jerrett et al. Citation2009), and are projected to worsen due to climate change (Sheffield et al. Citation2011; Shen, Mickley, and Gilleland Citation2016).
Respiratory health is additionally compromised as warmer temperatures increase aeroallergens. Warmer temperatures and increased carbon dioxide levels promote plant growth, shifting outdoor aeroallergen production and timing, reducing air quality. Over recent decades, pollen seasons for some species have started earlier and lasted longer (Bielory, Lyons, and Goldberg Citation2012; Ziska et al. Citation2011), while pollen concentrations have increased (Albertine et al. Citation2014; Beggs Citation2004; D’Amato et al. Citation2013). Longer pollen seasons and higher pollen concentrations are associated with increases in allergic rhinitis and asthma prevalence, causing increased emergency department visits and school days lost for children (Bielory, Lyons, and Goldberg Citation2012; Blando et al. Citation2012).
Temperature has relevant effects on the transmission of vector-borne diseases, such as West Nile virus and Lyme disease. For example, extended spring and summer seasons associated with warmer temperatures have the potential to increase exposure risk or disease transmission (Beard et al. Citation2016). In the case of Lyme disease, warmer winter and spring temperatures are projected to lead to earlier timing in which ticks seek hosts, and thus earlier onset of Lyme disease cases (Levi et al. Citation2015). Additionally, warmer temperatures may accelerate the tick life cycle, increasing the likelihood of tick survival to reproduce (Ogden et al. Citation2014). Similarly for mosquitoes, which carry diseases like West Nile virus, warmer temperatures may increase the mosquito season as well as speed up the mosquito life cycle, leading to larger populations (Reisen et al. Citation2008) and faster virus replication (Kilpatrick et al. Citation2008), which is thought to have been the underlying factor in the 2012 West Nile virus outbreak in Texas (Chung et al. Citation2013).
Food- and waterborne illnesses are expected to be influenced by warmer temperatures as the habitat, transmission, seasonality, and viability of toxins and pathogens are altered. While these are more of an issue in developing countries, there is still a rising concern about the impacts of heat and precipitation on the spread of pathogens. Cyanobacteria, Cryptosporidium, Giardia, and Vibrio bacteria have been shown to increase in prevalence in warmer air and water conditions, causing increased incidence of waterborne illnesses (Trtanj et al. Citation2016).
Warmer temperatures may increase the reproduction and infectious dose of foodborne pathogens such as Salmonella and Escherichia coli (Juneja et al. Citation2007). Warmer air and water temperatures may increase pathogen incidence on produce or in seafood, causing gastrointestinal illnesses (Ziska et al. Citation2016). It is important to note that while prevalence of some pathogens tends to be higher during warmer temperatures, trends vary based on location and pathogen type, and can be additionally affected by either increased or decreased precipitation.
Droughts and wildfires
Observed changes
Over the past 50 years, drought frequency and intensity have increased with rising temperatures and changing precipitation patterns for some parts of the globe (Trenberth et al. Citation2014). In the United States, these trends are particularly evident in the western and southwestern parts of the country (Melillo, Richmond, and Yohe Citation2014). In addition to changes in precipitation patterns, there is evidence of decreasing water runoff from spring snowpack and shifts to earlier peak flow, which sustains snow-fed rivers (Vaughan et al. Citation2013). In addition, warmer temperatures caused by climate change are contributing to “snowpack droughts” in the western United States (Fosu, Simon Wang, and Yoon Citation2016). As populations grow, the demand for water has also increased (Intergovernmental Panel on Climate Change [IPCC] Citation2014; Maupin et al. Citation2014). The combination of the increased stress to water supplies and changes to precipitation patterns decreases water availability and amplifies water insecurity.
During 1981–2016, the United States had 24 drought events that exceeded a billion U.S. dollars in damages. The total costs of these events surpassed $226 billion (Smith and Matthews Citation2015). The heat waves associated with these drought events caused an estimated 2,993 deaths (NCEI Citation2017). According to EM-DAT, an international emergency events database, international droughts, and the resulting famines, produced more deaths than any other climate-related disaster (Keim Citation2015). A number of recent droughts have caused both national and international crises. Australia experienced a historic once-in-a-millennium drought that lasted from 1995 to 2009 (Dijk et al. Citation2013). The recent Mediterranean drought lasted for 15 years, causing political instability and turmoil, and was estimated to be the worst drought event for that region over the past 900 years (Cook et al. Citation2016; Gleick Citation2014; Nicault et al. 2008). Kenya is currently experiencing drought that has lasted since 2014 and doubled the number of people living with food insecurity (United Nations Office for the Coordination of Humanitarian Affairs [UNOCHA] Citation2017). California recently came out of a multiple-year historic drought that caused billions of dollars of economic damage (Smith and Matthews Citation2015). The link between the severity of droughts and climate change is not always apparent. However, the knowledge and capabilities to identify these relationships have increased. Recent work has shown that several droughts, including events in Ethiopia and Southern Africa (Funk et al. Citation2016), Indonesia (King, Karoly, and Jan Van Oldenborgh Citation2016), western Canada (Szeto et al. Citation2016), and the California drought (Griffin and Anchukaitis Citation2014; Williams et al. Citation2015), were worsened by climate change.
Drought also has secondary impacts, such as dust storms and wildfires. In parts of the world, including the western United States, wildfire season has shifted and extended, starting earlier in the spring and ending later in the fall (Melillo, Richmond, and Yohe Citation2014; Karl, Melillo, and Peterson 2009). The number of acres burned increased over time. One study found that climate change doubled the cumulative forest fire area since 1984, and that anthropogenic climate change will continue to chronically enhance the potential for western U.S. forest fire activity while fuels are not limiting (Abatzoglou and Park Williams Citation2016). Although some regions of the world have experienced a decrease in dust storm activity, the intensification of dust storms in the southwestern United States has been associated with changes in climate (Tong et al. Citation2017).
Health impacts
Droughts can cause detrimental effects on human health as they often occur in concert with other meteorological conditions such as heat waves, wildfires, and dust storms. These pathways to health outcomes can be direct and indirect, with the indirect pathways being very complex and variable (Stanke et al. Citation2013). However, the direct impacts of drought are generally reduced freshwater availability and increased contamination. Reduced freshwater availability particularly affects households, businesses, and communities that are directly involved in agriculture and production. The drought that occurred in the United States in 2011 and 2012 resulted in the U.S. Department of Agriculture to declare over 1,300 counties across the country as drought disaster areas. Economic insecurity for populations who rely on water access and use can cause excess stress, potentially causing mental health issues (Vins et al. Citation2015).
In addition to reduced water availability, periods of drought can compromise the quality of water. During periods of drought, reduced water quantity can cause decreased water flow, encouraging production of pathogens that favor warm, stagnant environments (Delpla et al. Citation2009; Whitehead et al. Citation2009). Consumption or contact with water that contains pathogens such as Vibrio species may result in ear, eye, and wound infections, diarrheal illness, and death (Trtanj et al. Citation2016). Additionally, coastal droughts can result in saltwater contamination of primary freshwater sources, as lower freshwater levels and higher sea levels promote saltwater intrusion (Trtanj et al. Citation2016).
Droughts have been linked to changes in vector-borne disease distribution, particularly for mosquitoes, as they rely on stagnant water to reproduce. In some areas, mosquitoes that carry West Nile virus (WNV) are more likely to come in contact with birds infected with WNV as there are fewer water resources, increasing the risk of cohabitation and, thus, WNV transmission (Johnson and Sukhdeo Citation2013).
Droughts produce conditions that are conducive to dust storms, which increase particulate matter distribution and concentrations in the air, causing respiratory illnesses like Valley fever (Coopersmith et al. Citation2017; Peterson et al. Citation2014; Tong et al. Citation2017). Chronic exposure to particulates may contribute to cardiovascular disease (Puett et al. Citation2008), suggesting that persisting drought conditions could magnify the risk of heart disease (Crooks et al. Citation2016). Evidence has also found that dust and dust storms cause nonaccidental mortality (Crooks et al. Citation2016) and traffic fatalities (Ashley et al. Citation2015).
With wildfires becoming more common and intense in many parts of the United States, particularly the western states, there are significant direct and indirect impacts on human health (Liu et al. Citation2017). Premature death, burn injuries, posttraumatic stress disorder (PTSD) (Bell et al. Citation2016), and acute exacerbation of respiratory conditions such as asthma (Elliott, Henderson, and Wan Citation2013), shortness of breath (Delfino et al. Citation2009), decreased lung function (Youssouf et al. Citation2014), and chronic obstructive pulmonary disease (COPD) (Henderson et al. Citation2011) are, perhaps, the most direct outcomes of wildfire exposure. Wildfires release toxic air pollutants (e.g., CO, O3, PM2.5, PM10) that contribute to respiratory illness and can expose communities up to 1,000 miles away and for up to several weeks after the event (Naeher et al. Citation2007; Sapkota et al. Citation2005). Wildfire smoke has also been associated with low birth weight among babies born to women who were pregnant during a wildfire event (Holstius et al. Citation2012). The most vulnerable to the smoke-related impacts of wildfires are those with cardiopulmonary and respiratory diseases, the elderly, smokers, and firefighters (Youssouf et al. Citation2014).
Population displacement from wildfires and drought can lead to myriad outcomes ranging from strain on mental health status to impacts on the health care system. Loss of one’s family members, home, and livelihood can substantially impact a person’s mental well-being. Disaster events, such as droughts and wildfires, are associated with a high burden of PTSD (Galea, Nandi, and Vlahov Citation2005). Large wildfires often result in evacuating residential populations. This is especially important as the interfaces between urban areas and natural areas are coming into more contact with the expansion of cities (Radeloff et al. Citation2005). Evacuated individuals may experience mental stress and hardship in leaving one’s property and possessions in the midst of a wildfire. Public health systems and responders can be faced with a large influx of patients, potentially overwhelming care facilities and response systems.
Extreme precipitation, flooding, and hurricanes
Observed changes
Although some regions of the world are expected to get dryer, other regions will experience an increase in precipitation because of climate change. In the United States, the East and Northeast are expected to receive more annual precipitation. Because of the physical relationship between temperature and atmospheric moisture holding capacity, as described by the Clausius–Clapeyron relationship, extreme precipitation is expected to increase and the number of days without precipitation will also increase with warming (Balbus et al. Citation2016; Melillo, Richmond, and Yohe Citation2014). The general relationship between the hydrologic cycle and increasing temperature is apparent and fairly well understood. Higher temperatures allow for more moisture to be stored in the atmosphere. When this moisture is released as precipitation, the events can cause intense downpours or flooding rains (Kunkel et al. Citation2013b). Analysis of historical data suggests that the intensity and frequency of heavy downpours has increased globally during the last century (Kunkel et al. Citation2013a). Future model results also suggest that these events will continue to increase in the future as global temperatures continue to rise (Stocker et al. Citation2013). As a result, parts of the world, such as the U.S. Midwest and Northeast, have seen an increase in flooding (Melillo, Richmond, and Yohe Citation2014). This increase is likely the result of changes in precipitation, in addition to changes in manmade infrastructure that influences runoff. The impacts of these flooding events can be severe and cause large financial losses. There are several examples of flooding events in recent years that have caused such outcomes.
There has been a substantial increase in most measures of Atlantic hurricane activity since the 1980s (Melillo, Richmond, and Yohe Citation2014). These include measures of intensity, frequency, duration, and the number of strongest (Category 4 and 5) storms. Procedures and capabilities for monitoring hurricanes have changed substantially through time (Hagen and Landsea Citation2012; Knapp and Kruk Citation2010; Kossin, Olander, and Knapp Citation2013; Landsea et al. Citation2010; Vecchi and Knutson Citation2008). These data are most reliable since high-quality remotely sensed observations were introduced in the early 1980s (Hennon et al. Citation2015; Kossin, Olander, and Knapp Citation2013; Schreck et al. Citation2014; Velden et al. Citation2006). Uncertainties in these data limit our ability to assess longer term trends in hurricane activity before the satellite period (Christensen et al. Citation2013; Hartmann et al. Citation2013; Knutson et al. Citation2010; Man-Chi, Yeung, and Chang Citation2006; Seneviratne et al. Citation2012). Despite the uncertainties in the observational record, model projections and atmospheric theory indicate that hurricane intensities and rainfall rates will both increase as the climate continues to warm (Melillo, Richmond, and Yohe Citation2014).
Even though some uncertainty remains regarding the effect of a warming climate on hurricanes, the health impacts from these storms will almost certainly worsen in the coming decades. The two biggest killers from hurricanes–storm surge and freshwater flooding will be exacerbated–regardless of the effect on the total hurricane frequency, intensity, or duration. Rising sea level will compound the storm surge for future hurricanes (Moser et al. Citation2014) and model projections consistently show greater rainfall, and thus freshwater flooding, from these storms (Melillo, Richmond, and Yohe Citation2014). On top of these geophysical effects, coastal populations will continue to rise, placing more lives in the paths of these powerful storms (Moser et al. Citation2014).
In addition to more intense precipitation and inland flooding, other hydrologic changes are occurring around the globe. The global sea level has risen by more than 20.32 cm (8 inches) during the last century for most regions of the world (Church and White Citation2011). This is visually apparent for areas of the U.S. Atlantic and Gulf coasts. Along with the increased risks that occur from storm surge during landfall of hurricanes and tropical storms, nuisance flooding is now an issue for numerous coastal communities due to increased sea levels (Bell et al. Citation2016). “Sunny day flooding” is tidal flooding of low-lying areas that causes disruption to road access and storm drains. There is an increasing trend in sunny day flooding for many parts of the United States. Since 1994, the risk of nuisance flooding has increased by over 500% for Miami, FL, due to sea-level rise (Sweet et al. Citation2016).
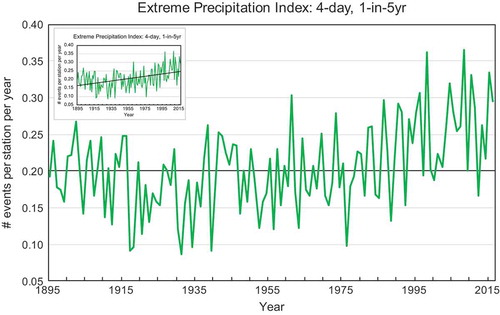
May 2015 was the wettest month on record in Texas and Oklahoma (NCEI Citation2015). While this event ended an ongoing severe drought, it also resulted in widespread loss of life from flash floods and property damage in excess of $2 billion (NCEI Citation2017). In August 2016, a historic flooding event affected Louisiana, with 20 to 30 inches of rainfall occurring over several days and exceeding 1-in-500-year amounts in some locations. Damages were estimated at $10 billion (NCEI Citation2017). In early October 2015, torrential rainfall caused catastrophic flooding in South Carolina with damages around $2 billion (NCEI Citation2017). Both the all-time 24-hr and 5-day state rainfall records were broken. During October 7–9, 2016, Hurricane Matthew dumped torrential rain along the southeast coast. Eastern North Carolina was most heavily impacted, with many locations receiving more than 10 inches and a few locations in excess of 18 inches, causing major flooding. Overall damages from this event were around $10 billion (NCEI Citation2017). These events reflect a significant increase in extreme precipitation events across the United States shows a time series of an extreme precipitation index for 4-day accumulations exceeding an average recurrence interval (ARI) of 5 years. Since the 1970s there has been a pronounced upward trend. All of the top five highest years have occurred since 1998. Since 2000, there has been only one below-average year (2012).
Figure 6. Annual time series (1895–2016) of extreme precipitation index averaged over United States. Extreme precipitation events are defined as rainfall accumulations over 4-day periods exceeding the threshold for a 1-in-5-years recurrence interval. Bold horizontal line at 0.20 indicates the long-term average. Figure inset shows the trend in extreme precipitation over the United States during 1895–2016. (Data source: NOAA’s NCEI.)
Health effects
The direct health hazards from extreme precipitation events include drowning, physical trauma, and death related to floods, storms, and hurricanes (Alderman, Turner, and Tong Citation2012; Du et al. Citation2010; Lane et al. Citation2013). Hurricane-related hazards directly caused 2,170 deaths in the United States during 1963–2012 (Rappaport Citation2014; Rappaport and Blanchard Citation2016). Associated storm waters were by far the greatest risk accounting for about 70% of those deaths, roughly equally split between storm surge and inland flooding related to rain. While flash flood events are more likely to occur in rural areas (Špitalar et al. Citation2014), the effects of a single event in an urban area can be far more detrimental as its impacts affect more people both directly and indirectly as a result of critical infrastructure failures (Klinger, Landeg, and Murray Citation2014). As an example, nearly half of the deaths related to storm surges between 1963 and 2012 were caused by the levee failure in New Orleans during Hurricane Katrina.
As staggering as those numbers are, the hazards from hurricanes do not subside as quickly as the wind and water. These indirect hazards can be harder to quantify, but Rappaport and Blanchard (Citation2016) looked at the storms that caused 90% of the direct deaths in the last 50 years, and indirect deaths accounted for 44% of the total deaths. The leading causes of these indirect deaths were increases in cardiovascular mortality in a storm’s wake, deaths related to evacuations, and vehicular accidents.
Like many climate-related hazards, hurricanes are particularly devastating to vulnerable populations. Most of the victims of the levee failure in New Orleans during Katrina were low-income, older adults, and people of color (Luber et al. Citation2014). The health impacts from Katrina also lingered long after the waters receded. Many evacuees never returned to New Orleans, placing strain on health systems around the country (Luber et al. Citation2014). Exposure to extreme events affects mental health as individuals experience the stress, trauma, and displacement related to an event (Felton, Cole, and Martin Citation2013; Ruggiero et al. Citation2012; Tracy, Norris, and Galea Citation2011). Of those who experienced Hurricane Katrina, whether as a child, adult, or first responder, there were heightened symptoms of depression, anxiety, posttraumatic stress disorder (PTSD), and suicide (Galea et al. Citation2008; La Greca et al. Citation2010; Osofsky et al. Citation2009; Pietrzak et al. Citation2013). They also demonstrated other health consequences, such as adverse birth outcomes including preterm birth, low birth weight, and maternal complications (Luber et al. Citation2014).
Increased heavy precipitation events worsen air quality both indoors and outdoors. Extreme precipitation events can result in building damage, allowing water and moisture entry to indoor spaces, providing an environment for mold growth and increase in other aeroallergens that trigger allergic rhinitis and asthma (Clark et al. Citation2004; IOM Citation2011; Johanning et al. Citation2014). Aeroallergens outside may also be heightened as a result of osmotic ruptures when heavy precipitation occurs during the pollen season, known as “thunderstorm asthma” leading to a spike in aeroallergen concentrations and increasing the number and severity of allergic illness (Cecchi et al. Citation2010; D’Amato, Liccardi, and Frenguelli Citation2007). The effects of such an event were demonstrated in Melbourne, Australia, in November 2016, when a thunderstorm led to 8,500 people hospitalized for respiratory illnesses, overwhelming emergency health departments and ambulatory systems (Woodhead Citation2016).
Extreme precipitation events can lead to increased incidence of diseases carried by vectors as habitable environments are altered. For example, climate change may increase rodent populations in indoor environments as increases in extreme precipitation events drive rodents to shelter indoors (Bezirtzoglou, Dekas, and Charvalos Citation2011), increasing risk of transmission of pathogens like hantaviruses (Klein and Calisher Citation2007; Reusken and Heyman Citation2013; Watson et al. Citation2014). Additionally, precipitation events transport human waste, animal waste, or agricultural runoff into drinking-water sources (Murphy et al. Citation2017; Trtanj et al. Citation2016). Households drinking untreated water from private wells or municipalities without disinfection face elevated gastrointestinal illness risks (Gleason and Fagliano Citation2017; Uejio et al. Citation2014). Similarly, extreme precipitation events can overwhelm the capacity of combined sewer systems that collect runoff, sewage, and waste. Untreated effluent is discharged into nearby drinking water sources and other waterbodies. In the U.S. state of Massachusetts, precipitation increased gastrointestinal illness in communities accessing treated drinking water impacted by combined sewer overflows (Jagai et al. Citation2015).
Moving forward
Climate and weather conditions have historically been known as a controlling factor of conditions that regulate human health (Brown Citation1873; Hippocrates Citation1978). As our understanding of climate change becomes more comprehensive, the focus on understanding the relationship that climate has on human health becomes more important.
This paper highlights changes in selected extreme events and discusses some of the potential impacts that these changes can have on human health. The goal of this paper was not to provide a complete description of the ways human health is affected by extreme events, but to illustrate the interconnectedness of climate to health. As demonstrated in this paper, there are various ways that interactions between changes in climate and human health can manifest. Some of the health outcomes are more direct, such as individuals who suffer loss of life from flooding. Other health outcomes are more delayed or indirect to changes in the environment, such as changes in vector ecology that affect disease spread. There are also factors that result in changes in an individual’s environment that can cause stress that may lead to a negative health outcome. For example, the additional stress of losing a home or livelihood due to an extreme event could exacerbate an underlying mental health condition (Loughry Citation2010). These are just a few examples of the health relationships and pathways that come about from extreme events.
Research gaps
Work is still needed to identify the various ways human health is affected by extreme events in a changing climate. Although many pathways between extreme events and health outcomes have been established, there is still a need to construct specific pathways that account for regional differences. Each location has its own vulnerabilities and environmental concerns that might reduce or exacerbate health issues. Identifying these differences can help local public health officials develop the tools necessary for issuing effective early warnings or capitalizing on opportunities to mitigate impacts. Understanding these pathways is especially important for the indirect or delayed health effects, as there can be more external factors that influence health outcomes. Constructing the pathways based only on historical examples may be misleading and may not create a complete picture of potential health threats. As extreme events continue to become more severe and frequent, the historical normal will no longer be an accurate reference for understanding these relationships. Extreme events can potentially present themselves in tandem. This could occur in a number of possible scenarios. For example, a region could experience reoccurring exposures, such as severe droughts or flooding rains, in a relatively short time frame that is outside the historical probability. Different types of extreme events could cascade or coincide to create additional hazards. An example of this is a severe heat event that follows the disruption of the electricity provision caused by a hurricane. Populations or communities that are adapted to dealing with singular events that manifest in a typical way could be unable to cope with the repeated stress of these new hazards. Understanding potential outcomes of these scenarios for different locations will help health departments and local managers to prepare for these events.
Comparatively less work examines the influence of extreme events on long-term compared to acute health outcomes. For example, waterborne disease infections may cause increased risk of sequelae like appendicitis, enteritis, colitis, and noninfective gastroenteritis (Moorin et al. Citation2010). Similarly, mosquito-borne diseases may cause long-term cognitive, functional, and movement disorders (Hughes, Wilson, and Sejvar Citation2007). Many case studies document the chronic psychologic dysfunction of survivors of catastrophic extreme events (e.g., hurricanes, floods, drought) (Barreau et al. Citation2017; Bei et al. Citation2013; La Greca et al. Citation2010). However, there is less systematic evidence of the mental health impacts of less severe but more common extreme events. Existing public health surveillance systems are targeted toward emergency facilities instead of clinics that provide a majority of mental health care (Buehler et al. Citation2008). Similarly, health studies may have difficulty documenting the “slow violence” of extreme events that evolve over long periods such as drought or sea-level rise (Nixon Citation2011).
Although a good deal of research has gone into understanding the health outcomes of extreme events, work is still needed on understanding the ability of health departments and health care facilities to respond to the issues that arise from more frequent and intense extreme events. Health care facilities need to maintain operations during and after extreme events, because they treat the traditional patient population and those affected by the storm. By understanding these risks to health care facilities, staff members and emergency planners can develop strategies to be more resilient to future events. To accurately improve resiliency, health care facilities may investigate local infrastructural vulnerabilities and preparedness policies to insure operations can withstand disruptions during and after different extreme events. There are multiple examples of health care facilities being disrupted by extreme events (e.g., overcrowding, loss of power, lack of access, reduction of staff). In addition to the traditional challenges, many hospitals are inconveniently located in the areas and regions that are experiencing changes in extreme events. For example, multiple hospitals are near coastal areas that are prone to tropical storms, hurricanes, and storm surge. Without proper preparedness, these hospitals will be less likely to maintain operations when the need is the greatest. In the end, resiliency in our health care facilities will reduce and prevent loss of life. Some work has already been developed for health care facilities to understand the risks of climate change on system operations (https://toolkit.climate.gov/topics/human-health/building-climate-resilience-health-sector).
Novel research initiatives
Contemporary research is investigating how communities adapt to extreme events and take advantage of opportunities for recovery (Bousquet et al. Citation2015). For example, Joplin, MO, recovered from a 2011 violent tornado (EF4) that injured more than 1,000 people and demolished parts of the city. Coordinated institutional, government, and private-sector programs rebuilt infrastructure, sustained jobs, and augmented childhood psychological support services to speed recovery (Coles, Zhang, and Zhuang Citation2016; Kanter and Abramson Citation2014; Svendsen et al. Citation2014). Nonetheless, some survivors continue to suffer lingering trauma (Houston et al. Citation2015). New exposures can also manifest after the disaster occurs (Neblett Fanfair et al. 2012). The recovery of these research areas after extreme events is likely to be less clear (LaKind et al. Citation2016).
Over the past decade, research investigated extreme events, critical infrastructure, and human health (Satumtira and Dueñas-Osorio Citation2010). For example, Hurricane Sandy flooded large portions of New York City in 2012 and damaged critical electricity infrastructure. The cascading impacts of electricity loss included hospital and subway closures, telecommunication outages, halted pipeline fuel distribution, and food delivery disruption (Haraguchi et al. Citation2016). The total number of excess deaths increased immediately after the event and remained elevated for 2 months (Howland et al. Citation2014). Understanding these relationships and pathways is key to reducing health impacts.
An emerging area of research in climate science is the detection and attribution of climate change on extreme events (Easterling et al. Citation2016). This work allows us to understand the role of climate change on current extreme events. “Detection” is the identification of whether there is a statistically significant change in this case, in a particular type of extreme event occurrence. For example, has extreme precipitation increased over North America in the past century? “Attribution” science evaluates the various causal factors that may have contributed to the change, in particular, the possible influence of anthropogenic climate change. There are many drivers for any extreme event that could be responsible for changes over time, and one of them is anthropogenic climate change. Scientists engage in attribution research for the same reason we have always studied our weather, which is, if we can understand what is causing our weather we can improve our ability to predict it in the future. This allows us to then improve planning and preparedness activities, including those for ensuring public health.
Interestingly, some of the methodology for attributing the change in event risk due to climate change was drawn from public health epidemiology. In particular, the attribution community uses the concept of the fraction of attributable risk (FAR) (Jaeger et al. Citation2008). In epidemiology, attributable risk is the difference in the rate of a health condition between an exposed population and an unexposed population. In extreme event attribution, the “exposed population” is the world as it is with increased greenhouse gas emissions. Using models, researchers compare this to an “unexposed population,” or a world in which humans have not emitted greenhouse gases causing global warming. However, like epidemiology, results are necessarily probabilistic and not deterministic. If a smoker gets lung cancer, medical science tells us that the attributable risk that the smoking caused the lung cancer is high. However, it is still possible that the person would have developed lung cancer if that person had never been a smoker. For public health, the important finding is that smoking increases your risk of lung cancer and smoking has a high cost to society. Similarly, for event attribution, the important result is often knowing that climate change is in fact changing our risk exposure to a particular extreme event and to what extent, so we can assess the overall cost to society and sectors such as public health. Extreme event attribution has clearly demonstrated that the risk for some event types is changing because of human-caused climate change (BAMS Explaining Extreme Events reports from 2011–2015). In addition to addressing whether climate change did or did not play a role in any specific event, event attribution science also strives to quantify that impact. The next step with this research is trying to combine extreme event attribution with societal and economic outcomes to determine the role climate change has on producing excess health burdens and costs (Ebi et al. Citation2017; Mitchell et al. Citation2016).
Conclusion
There is a high level of confidence that key extreme events discussed in this paper are changing and expected to continue to change in the future. These events include heat waves, precipitation, hurricanes, droughts, and wildfire. The outcomes of these changes are likely to have a variety of impacts on human health and economic losses. Some of the associations between extreme events and health are already understood and the linkages are established. However, many opportunities exist for exploring additional linkages and pathways because of the variety of ways that these events can affect human health outcomes. The health impacts are direct, indirect, and delayed, which can make it difficult to account and estimate. Incorporating this information into planning efforts can help improve preparedness and reduce impacts. In order to advance our understanding of changes in frequency and intensity of extreme events on human health, there is a variety of research that could improve our understanding of the health implications.
Disclaimer
The findings and conclusions in this report are those of the authors and do not necessarily represent the official position of the Centers for Disease Control and Prevention, the Agency for Toxic Substances and Disease Registry, or the National Oceanic and Atmospheric Administration.
Acknowledgment
This work was supported by NOAA through the Cooperative Institute for Climate and Satellites–North Carolina under Cooperative Agreement NA14NES432003. The authors appreciate the comments and recommendations from P. Schramm that have improved the paper. The authors also greatly appreciate the reviewers’ comments and recommendations.
Additional information
Funding
References
- Abatzoglou, J.T., and A. Park Williams. 2016. Impact of anthropogenic climate change on wildfire across western US forests. Proceedings of the National Academy of Sciences 113 (42):11770–75.
- Albertine, J.M., W.J. Manning, M. DaCosta, K.A. Stinson, M.L. Muilenberg, and C.A. Rogers. 2014. Projected carbon dioxide to increase grass pollen and allergen exposure despite higher ozone levels. PLoS One 9 (11):e111712.
- Alderman, K., L.R. Turner, and S. Tong. 2012. Floods and human health: A systematic review. Environment International 47:37–47.
- Anderson, B.G., and M.L. Bell. 2009. Weather-related mortality: How heat, cold, and heat waves affect mortality in the United States. Epidemiology 20 (2):205–13. doi:10.1097/EDE.0b013e318190ee08.
- Anderson, G.B., and M.L. Bell. 2012. Lights out: Impact of the August 2003 power outage on mortality in New York, NY. Epidemiology (Cambridge, Mass.) 23 (2):189.
- Ashley, W.S., S. Strader, D.C. Dziubla, and A. Haberlie. 2015. Driving blind: Weather-related vision hazards and fatal motor vehicle crashes. Bulletin of the American Meteorological Society 96 (5):755–78.
- Astrand, P.O., K. Rodahl, H.A. Dahl, and S.B. Stromme. 2003. Textbook of work physiology: Physiological bases of exercise, 4th ed. New York, NY: McGraw-Hill.
- Balbus, J., A. Crimmins, J.L. Gamble, D.R. Easterling, K.E. Kunkel, S. Saha, and M.C. Sarofim. 2016. Introduction: Climate change and human health. In The impacts of climate change on human health in the United States: A scientific assessment, 25–42. Washington, DC: U.S. Global Change Research Program.
- Barreau, T., D. Conway, K. Haught, R. Jackson, R. Kreutzer, A. Lockman, S. Minnick, R. Roisman, D. Rozell, and S. Smorodinsky. 2017. Physical, mental, and financial impacts from drought in two California counties, 2015. American Journal of Public Health 107 (5):783–90.
- Barriopedro, D., E.M. Fischer, J. Luterbacher, R.M. Trigo, and G.-H. Ricardo. 2011. The hot summer of 2010: Redrawing the temperature record map of Europe. Science 332 (6026):220–24.
- Basu, R. 2002. Relation between elevated ambient temperature and mortality: A review of the Epidemiologic evidence. Epidemiologic Reviews 24 (2):190–202. doi:10.1093/epirev/mxf007.
- Beard, C.B., R.J. Eisen, C.M. Barker, J.F. Garofalo, M. Hahn, M. Hayden, A.J. Monaghan, N.H. Ogden, and P.J. Schramm. 2016. Vectorborne diseases, 129–156. Washington, DC: U.S. Global Change Research Program.
- Beatty, M.E., S. Phelps, C. Rohner, and I. Weisfuse. 2006. Blackout of 2003: Public health effects and emergency response. Public Health Reports 121 (1):36–44.
- Beggs, P.J. 2004. Impacts of climate change on aeroallergens: Past and future. Clinical & Experimental Allergy 34 (10):1507–13.
- Bei, B., C. Bryant, K.-M. Gilson, J. Koh, P. Gibson, A. Komiti, H. Jackson, and F. Judd. 2013. A prospective study of the impact of floods on the mental and physical health of older adults. Aging & Mental Health 17 (8):992–1002.
- Bell, J.E., S.C. Herring, L. Jantarasami, C. Adrianopoli, K. Benedict, K. Conlon, V. Escobar, J. Hess, J. Luvall, C.P. Garcia-Pando, D. Quattrochi, J. Runkle, and C. Schreck. 2016. Impacts of extreme events on human health In The impacts of climate change on human health in the United States: A scientific assessment, 99–128 Washington, D.C.: U.S. Global Change Research Program. http://dx.doi.org/doi:10.7930/JOBZ63ZV.
- Bell, M.L., A. McDermott, S.L. Zeger, J.M. Samet, and F. Dominici. 2004. Ozone and short-term mortality in 95 US urban communities, 1987–2000. Journal of the American Medical Association 292 (19):2372–78.
- Berko, J., D.D. Ingram, S. Saha, and J.D. Parker. 2014. Deaths attributed to heat, cold, and other weather events in the United States 2006–2010. National Health Statistics Reports 76:1–15.
- Bezirtzoglou, C., K. Dekas, and E. Charvalos. 2011. Climate changes, environment and infection: Facts, scenarios and growing awareness from the public health community within Europe. Anaerobe 17 (6):337–40.
- Bielory, L., K. Lyons, and R. Goldberg. 2012. Climate change and allergic disease. Current Allergy and Asthma Reports 12 (6):485–94.
- Blando, J., L. Bielory, V. Nguyen, R. Diaz, and H.A. Jeng. 2012. Anthropogenic climate change and allergic diseases. Atmosphere 3 (1):200–12.
- Bloomer, B.J., J.W. Stehr, C.A. Piety, R.J. Salawitch, and R.R. Dickerson. 2009. Observed relationships of ozone air pollution with temperature and emissions. Geophysical Research Letters 36:9.
- Blunden, J., D.S. Arndt, C. Achberger, S.A. Ackerman, A. Albanil, P. Alexander, E.J. Alfaro, R. Allan, L.M. Alves, and J.A. Amador. 2013. State of the climate in 2012. Bulletin of the American Meteorological Society 94 (8):1–238.
- Bobb, J.F., Z. Obermeyer, Y. Wang, and F. Dominici. 2014. Cause-specific risk of hospital admission related to extreme heat in older adults. Journal of the American Medical Association 312 (24):2659–67.
- Bousquet, F., P. Robbins, C. Peloquin, and O. Bonato. 2015. The PISA grammar decodes diverse human–environment approaches. Global Environmental Change 34:159–71.
- Braga, A.L., A. Zanobetti, and J. Schwartz. 2001. The time course of weather-related deaths. Epidemiology 12 (6):662–67.
- Brown, H.E. 1873. The Medical Department of the United States Army from 1775 to 1783. Washington, DC: Surgeon General’s Office.
- Buehler, J.W., A. Sonricker, M. Paladini, P. Soper, and F. Mostashari. 2008. Syndromic surveillance practice in the United States: Findings from a survey of state, territorial, and selected local health departments. Advances in Disease Surveillance 6 (3):1–20.
- Capon, A., G. Demeurisse, and L. Zheng. 1992. Seasonal variation of cerebral hemorrhage in 236 consecutive cases in Brussels. Stroke 23 (1):24–27.
- CDC. 2005. Vibrio illnesses after Hurricane Katrina—Multiple states, August–September 2005. MMWR. Morbidity and Mortality Weekly Report 54 (37):928.
- CDC. 2013. Heat-related deaths after an extreme heat event—Four states, 2012, and United States, 1999–2009. MMWR. Morbidity and Mortality Weekly Report 62 (22):433.
- Cecchi, L., G. d’Amato, J.G. Ayres, C. Galan, F. Forastiere, B. Forsberg, J. Gerritsen, C. Nunes, H. Behrendt, and C. Akdis. 2010. Projections of the effects of climate change on allergic asthma: The contribution of aerobiology. Allergy 65 (9):1073–81.
- Changnon, S.A., K.E. Kunkel, and B.C. Reinke. 1996. Impacts and responses to the 1995 heat wave: A call to action. Bulletin of the American Meteorological Society 77 (7):1497–506.
- Choi, G., D. Collins, G. Ren, B. Trewin, M. Baldi, Y. Fukuda, M. Afzaal, T. Pianmana, P. Gomboluudev, and P. Thi Thanh Huong. 2009. Changes in means and extreme events of temperature and precipitation in the Asia Pacific Network region, 1955–2007. International Journal of Climatology 29 (13):1906–25.
- Christensen, J.H., K.K. Kanikicharla, G. Marshall, and J. Turner. 2013. Climate phenomena and their relevance for future regional climate change In Climate change 2013: The physical science basis. Contribution of Working Group I to the Fifth Assessment of the Intergovernmental Panel on Climate Change, eds. T.F. Stocker, D. Qin, G. Plattner, M. Tignor, S.K. Allen, J. Boschung, A. Nauels, Y. Xia, V. Bex, and P.M. Midgley, 1217–1308. Cambridge, UK: Cambridge University Press.
- Chung, W.M., C.M. Buseman, S.N. Joyner, S.M. Hughes, T.B. Fomby, J.P. Luby, and R.W. Haley. 2013. The 2012 West Nile encephalitis epidemic in Dallas, Texas. Journal of the American Medical Associatio 310 (3):297–307.
- Church, J.A., and N.J. White. 2011. Sea-level rise from the late 19th to the early 21st century. Surveys in Geophysics 32 (4–5):585–602.
- Clark, N.M., H.M. Ammann, B. Brunekreef, P. Eggleston, W. Fisk, R. Fullilove, J. Guernsey, A. Nevalainen, and S.G. Von Essen. 2004. Damp indoor spaces and health. Institute of Medicine (US) Committee on Damp Indoor Spaces and Health. Washington, DC: National Academies Press (US). https://www.ncbi.nlm.nih.gov/books/NBK215643/doi:10.17226/11011
- Climate Central. 2017. “Extreme heat: Australia, February 2017. https://wwa.climatecentral.org/analyses/extreme-heat-australia.
- Coles, J., J. Zhang, and J. Zhuang. 2016. Partnership behavior in disaster relief operations: A case study comparison of the responses to the tornado in Joplin, Missouri and Hurricane Sandy along the Jersey Coast. Natural Hazards 84 (1):625–47.
- Conlon, K., A. Monaghan, M. Hayden, and O. Wilhelmi. 2016. Potential impacts of future warming and land use changes on intra-urban heat exposure in Houston, Texas. PloS ONE 11 (2):e0148890.
- Cook, B.I., K.J. Anchukaitis, R. Touchan, D.M. Meko, and E.R. Cook. 2016. Spatiotemporal drought variability in the Mediterranean over the last 900 years. Journal of Geophysical Research: Atmospheres 121 (5): 2060–2074
- Coopersmith, E.J., J.E. Bell, K. Benedict, J. Shriber, O. McCotter, and M.H. Cosh. 2017. Relating coccidioidomycosis (valley fever) incidence to soil moisture conditions. GeoHealth 1 (1):51–63.
- Crimmins, A., J. Balbus, J.L. Gamble, C.B. Beard, J.E. Bell, D. Dodgen, R.J. Eisen, N. Fann, M.D. Hawkins, and S.C. Herring. 2016. The impacts of climate change on human health in the United States: A scientific assessment. Washington, DC: U.S. Global Change Research Program.
- Crooks, J.L., W.E. Cascio, M.S. Percy, J. Reyes, L.M. Neas, and E.D. Hilborn. 2016. The association between dust storms and daily non-accidental mortality in the United States, 1993–2005. Environmental Health Perspectives 124 (11):1735.
- D’Amato, G., C.E. Baena-Cagnani, L. Cecchi, I. Annesi-Maesano, C. Nunes, I. Ansotegui, M. D’Amato, G. Liccardi, M. Sofia, and W.G. Canonica. 2013. Climate change, air pollution and extreme events leading to increasing prevalence of allergic respiratory diseases. Multidisciplinary Respiratory Medicine 8 (1):12.
- D’Amato, G., G. Liccardi, and G. Frenguelli. 2007. Thunderstorm‐asthma and pollen allergy. Allergy 62 (1):11–16.
- Delfino, R.J., S. Brummel, W. Jun, H. Stern, B. Ostro, M. Lipsett, D.H. Arthur Winer, L.Z. Street, and T. Tjoa. 2009. The relationship of respiratory and cardiovascular hospital admissions to the southern California wildfires of 2003. Occupational and Environmental Medicine 66:189–197.
- Dell, J., S. Tierney, G. Franco, R.G. Newell, R. Richels, J. Weyant, and T.J. Wilbanks. 2014. Energy supply and use. In Climate change impacts in the United States: The third national climate assessment, eds. J.M. Melillo, T.C. Richmond, and G.W. Yohe, 113–129. U.S. Global Change Research Program. doi:10.7930/J0BG2KWD.
- Delpla, I., A.V. Jung, E. Baures, M. Clement, and O. Thomas. 2009. Impacts of climate change on surface water quality in relation to drinking water production. Environment International 35 (8):1225–33.
- Deshmukh, A., E.H. Oh, and M. Hastak. 2011. Impact of flood damaged critical infrastructure on communities and industries. Built Environment Project and Asset Management 1 (2):156–75.
- Dijk, A.I.J.M., H.E. Beck, R.S. Crosbie, R.A.M. Jeu, Y.Y. Liu, G.M. Podger, B. Timbal, and N.R. Viney. 2013. The Millennium Drought in southeast Australia (2001–2009): Natural and human causes and implications for water resources, ecosystems, economy, and society. Water Resources Research 49 (2):1040–57.
- Dole, R., M. Hoerling, J. Perlwitz, J. Eischeid, P. Pegion, T. Zhang, X.-W. Quan, T. Xu, and D. Murray. 2011. Was there a basis for anticipating the 2010 Russian heat wave? Geophysical Research Letters 38:L06702. doi:10.1029/2010GL046582.
- Donat, M.G., L.V. Alexander, H. Yang, I. Durre, R. Vose, R.J.H. Dunn, K.M. Willett, E. Aguilar, M. Brunet, and J. Caesar. 2013. Updated analyses of temperature and precipitation extreme indices since the beginning of the twentieth century: The HadEX2 dataset. Journal of Geophysical Research: Atmospheres 118 (5):2098–118.
- Du, W., G. Joseph FitzGerald, M. Clark, and X.-Y. Hou. 2010. Health impacts of floods. Prehospital and Disaster Medicine 25 (3):265–72.
- Easterling, D.R., K.E. Kunkel, M.F. Wehner, and L. Sun. 2016. Detection and attribution of climate extremes in the observed record. Weather and Climate Extremes 11:17–27.
- Ebi, K.L., N.H. Ogden, J.C. Semenza, and A. Woodward. 2017. Detecting and attributing health burdens to climate change. Environmental Health Perspectives 85004:1.
- Elliott, C.T., S.B. Henderson, and V. Wan. 2013. Time series analysis of fine particulate matter and asthma reliever dispensations in populations affected by forest fires. Environmental Health 12 (1):11.
- Felton, J.W., D.A. Cole, and N.C. Martin. 2013. Effects of rumination on child and adolescent depressive reactions to a natural disaster: The 2010 Nashville flood. Journal of Abnormal Psychology 122 (1):64.
- Fennell, A.-M., V.R. Hunt, M. Armes, C. Arvidson, K. Childers, C. Currie, C. Gilbert, E. Pinto, H. Sasso, and J. Soares. 2015. Army Corps of Engineers: Efforts to assess the impact of extreme weather events (No. GAO-15-660). DTIC Document. Washington, DC: Government Accountability Office.
- Field, C.B. 2012. Managing the risks of extreme events and disasters to advance climate change adaptation: Special report of the intergovernmental panel on climate change. New York, NY: Cambridge University Press.
- Fosu, B.O., S.-Y. Simon Wang, and J.-H. Yoon. 2016. The 2014/15 snowpack drought in Washington State and its climate forcing. Bulletin of the American Meteorological Society 97 (12):S19–S24.
- Freese, J., N.J. Richmand, R.A. Silverman, J. Braun, B.J. Kaufman, and J. Clair. 2006. Impact of citywide blackout on an urban emergency medical services system. Prehospital and Disaster Medicine 21 (06):372–78.
- Frumkin, H., J. Hess, G. Luber, J. Malilay, and M. Michael. 2008. Climate change: The public health response. American Journal of Public Health 98 (3):435–45.
- Funk, C., L. Harrison, S. Shukla, D. Korecha, T. Magadzire, G. Husak, G. Galu, and A. Hoell. 2016. Assessing the contributions of local and east Pacific warming to the 2015 droughts in Ethiopia and Southern Africa. Bulletin of the American Meteorological Society 97 (12):S75–S80.
- Galea, S., A. Nandi, and D. Vlahov. 2005. The epidemiology of post-traumatic stress disorder after disasters. Epidemiologic Reviews 27 (1):78–91.
- Galea, S., M. Tracy, F. Norris, and S.F. Coffey. 2008. Financial and social circumstances and the incidence and course of PTSD in Mississippi during the first two years after Hurricane Katrina. Journal of Traumatic Stress 21 (4):357–68.
- Gamble, J.L., J. Balbus, M. Berger, K. Bouye, V. Campbell, K. Chief, K. Conlon, A. Crimmins, B. Flanagan, C. Gonzalez-Maddux, and E. Hallisey. 2016. Populations of concern. 247–286. Washington, DC: U.S. Global Change Research Program.
- García-Herrera, R., J. Díaz, R.M. Trigo, J. Luterbacher, and E.M. Fischer. 2010. A review of the European summer heat wave of 2003. Critical Reviews in Environmental Science and Technology 40 (4):267–306.
- Gasparrini, A., Y. Guo, M. Hashizume, E. Lavigne, A. Zanobetti, J. Schwartz, A. Tobias, S. Tong, J. Rocklöv, B. Forsberg, M. Leone, M. De Sario, M.L. Bell, Y.-L. Leon Guo, W. Chang-Fu, H. Kan, Y. Seung-Muk, M. De Sousa Zanotti Stagliorio Coelho, P.H.N. Saldiva, Y. Honda, H. Kim, and B. Armstrong. 2015. Mortality risk attributable to high and low ambient temperature: A multicountry observational study. Lancet 386 (9991):369–75. doi:10.1016/S0140-6736(14)62114-0.
- Gleason, J.A., and J.A. Fagliano. 2017. Effect of drinking water source on associations between gastrointestinal illness and heavy rainfall in New Jersey. PloS ONE 12 (3):e0173794.
- Gleason, K.L., J.H. Lawrimore, D.H. Levinson, T.R. Karl, and D.J. Karoly. 2008. A revised US climate extremes index. Journal of Climate 21 (10):2124–37.
- Gleick, P.H. 2014. Water, drought, climate change, and conflict in Syria. Weather, Climate, and Society 6 (3):331–40.
- Gonçalves, F.L., T. Samuel Braun, P.L. Silva Dias, and R. Sharovsky. 2007. Influences of the weather and air pollutants on cardiovascular disease in the metropolitan area of Sao Paulo. Environmental Research 104 (2):275–81.
- Griffin, D., and K.J. Anchukaitis. 2014. How unusual is the 2012–2014 California drought? Geophysical Research Letters 41 (24):9017–23.
- Groisman, P.Y., R.W. Knight, D.R. Easterling, T.R. Karl, G.C. Hegerl, and V.N. Razuvaev. 2005. Trends in intense precipitation in the climate record. Journal of Climate 18 (9):1326–50.
- Hagen, A.B., and C.W. Landsea. 2012. On the classification of extreme Atlantic hurricanes utilizing mid-twentieth-century monitoring capabilities. Journal of Climate 25 (13):4461–75.
- Haines, A., R. Sari Kovats, D. Campbell-Lendrum, and C. Carlos. 2006. Climate change and human health: Impacts, vulnerability and public health. Public Health 120 (7):585–96.
- Hajat, S., B. Armstrong, M. Baccini, A. Biggeri, L. Bisanti, A. Russo, A. Paldy, B. Menne, and T. Kosatsky. 2006. Impact of High Temperatures on Mortality. Epidemiology 17 (6):632–38. doi:10.1097/01.ede.0000239688.70829.63.
- Hallegatte, S., C. Green, R.J. Nicholls, and J. Corfee-Morlot. 2013. Future flood losses in major coastal cities. Nature Climate Change 3 (9):802–6.
- Haraguchi, M., M. Haraguchi, S. Kim, and S. Kim. 2016. Critical infrastructure interdependence in New York City during Hurricane Sandy. International Journal of Disaster Resilience in the Built Environment 7 (2):133–43.
- Hartmann, D.L., A.M.K. Tank, M. Rusticucci, L.V. Alexander, S. Brönnimann, Y.A.R. Charabi, F.J. Dentener, E.J. Dlugokencky, D.R. Easterling, A. Kaplan,and B.J. Soden. 2013. Observations: Atmosphere and surface. In Climate Change 2013 the Physical Science Basis: Working Group I Contribution to the Fifth Assessment Report of the Intergovernmental Panel on Climate Change. Cambridge University Press.
- Henderson, S.B., M. Brauer, Y.C. MacNab, and S.M. Kennedy. 2011. Three measures of forest fire smoke exposure and their associations with respiratory and cardiovascular health outcomes in a population-based cohort Environmental Health Perspectives 119 (9):1266.
- Hennon, C.C., K.R. Knapp, C.J. Schreck III, S.E. Stevens, J.P. Kossin, P.W. Thorne, P.A. Hennon, M.C. Kruk, J. Rennie, and J.-M. Gadéa. 2015. Cyclone center: Can citizen scientists improve tropical cyclone intensity records? Bulletin of the American Meteorological Society 96 (4):591–607.
- Hippocrates. 1978. Airs, waters and places. An essay on the influence of climate, water supply and situation on health. In Hippocratic writings, ed. G.E.R. Lloyd, 148–160. London, UK: Penguin.
- Holstius, D.M., C.E. Reid, B.M. Jesdale, and R. Morello-Frosch. 2012. Birth weight following pregnancy during the 2003 Southern California wildfires. Environmental Health Perspectives 120 (9):1340.
- Houston, J.B., M.L. Spialek, J. Stevens, J. First, V.L. Mieseler, and B. Pfefferbaum. 2015. 2011 Joplin, Missouri tornado experience, mental health reactions, and service utilization: Cross-sectional assessments at approximately 6 months and 2.5 years post-event. PLoS Currents 7: ecurrents.dis.18ca227647291525ce3415bec1406aa5. http://doi.org/10.1371/currents.dis.18ca227647291525ce3415bec1406aa5
- Howland, R.E., A.M. Madsen, L. Nicaj, R.S. Noe, M. Casey-Lockyer, and E. Begier. 2014. Assessing electronic death registration and American Red Cross systems for mortality surveillance during Hurricane Sandy, October 29–November 10, 2012, New York City. Disaster Medicine and Public Health Preparedness 8 (06):489–91.
- Hughes, J.M., M.E. Wilson, and J.J. Sejvar. 2007. The long-term outcomes of human West Nile virus infection. Clinical Infectious Diseases 44 (12):1617–24.
- Institute of Medicine. 2011. Climate change, the indoor environment, and health. Washington, DC: National Academies Press.
- IPCC. 2014. Climate change 2014—Impacts, adaptation and vulnerability: Regional aspects. New York, NY: Cambridge University Press.
- Jaeger, C.C., J. Krause, A. Haas, R. Klein, and K. Hasselmann. 2008. A method for computing the fraction of attributable risk related to climate damages. Risk Analysis 28 (4):815–23.
- Jagai, J.S., L. Quanlin, S. Wang, K.P. Messier, T.J. Wade, and E.D. Hilborn. 2015. Extreme precipitation and emergency room visits for gastrointestinal illness in areas with and without combined sewer systems: An analysis of Massachusetts data, 2003–2007. Environmental Health Perspectives (Online) 123 (9):873.
- Jerrett, M., R.T. Burnett, C. Arden Pope III, K. Ito, G. Thurston, D. Krewski, Y. Shi, E. Calle, and M. Thun. 2009. Long-term ozone exposure and mortality. New England Journal of Medicine 360 (11):1085–95.
- Johanning, E., P. Auger, P.R. Morey, C.S. Yang, and E. Olmsted. 2014. Review of health hazards and prevention measures for response and recovery workers and volunteers after natural disasters, flooding, and water damage: Mold and dampness. Environmental Health and Preventive Medicine 19 (2):93–99.
- Johnson, B.J., and M.V.K. Sukhdeo. 2013. Drought-induced amplification of local and regional West Nile virus infection rates in New Jersey. Journal of Medical Entomology 50 (1):195–204.
- Juneja, V.K., M.V. Melendres, L. Huang, V. Gumudavelli, J. Subbiah, and H. Thippareddi. 2007. Modeling the effect of temperature on growth of Salmonella in chicken. Food Microbiology 24 (4):328–35.
- Kaiser, R., A. Le Tertre, J. Schwartz, C.A. Gotway, W. Randolph Daley, and C.H. Rubin. 2007. The effect of the 1995 heat wave in Chicago on all-cause and cause-specific mortality. American Journal of Public Health 97 (Suppl._1):S158–S162.
- Kam, J., T.R. Knutson, F. Zeng, and A.T. Wittenberg. 2015. Record annual mean warmth over Europe, the Northeast Pacific, and the Northwest Atlantic during 2014: Assessment of anthropogenic influence. Bulletin of the American Meteorological Society 96 (12):S61–S65.
- Kam, J., T.R. Knutson, F. Zeng, and A.T. Wittenberg. 2016. Multimodel assessment of anthropogenic influence on record global and regional warmth during 2015. Bulletin of the American Meteorological Society 97 (12):S4–S8.
- Kanter, R.K., and D. Abramson. 2014. School interventions after the Joplin tornado. Prehospital and Disaster Medicine 29 (02):214–17.
- Karl, T.R., J.M. Melillo, and T.C. Peterson. (2009). Global climate change impacts in the United States: A state of knowledge report from the US Global Change Research Program. Cambridge University Press.
- Keim, M.E. 2015. The role of public health in disaster risk reduction as a means for climate change adaptation. In Global climate change and human health: From science to practice, eds. G. Luber and J. Levine, 35. John Wiley & Sons.
- Keppel, K.G. 2007. Ten largest racial and ethnic health disparities in the United States based on Healthy People 2010 objectives. American Journal of Epidemiology 166 (1):97–103.
- Kharin, V.V., F.W. Zwiers, X. Zhang, and M. Wehner. 2013. Changes in temperature and precipitation extremes in the CMIP5 ensemble. Climatic Change 119 (2):345–57.
- Kile, J.C., S. Skowronski, M.D. Miller, S.G. Reissman, V. Balaban, R.W. Klomp, D.B. Reissman, H.M. Mainzer, and A.L. Dannenberg. 2005. Impact of 2003 power outages on public health and emergency response. Prehospital and Disaster Medicine 20 (02):93–97.
- Kilpatrick, A.M., M.A. Meola, R.M. Moudy, and L.D. Kramer. 2008. Temperature, viral genetics, and the transmission of West Nile virus by Culex pipiens mosquitoes. PLoS Pathogens 4 (6):e1000092.
- King, A.D., D.J. Karoly, and G. Jan Van Oldenborgh. 2016. Climate change and El Niño increase likelihood of Indonesian heat and drought. Bulletin of the American Meteorological Society 97 (12):S113–S117.
- Klein, K.R., P. Herzog, S. Smolinske, and S.R. White. 2007. Demand for poison control center services “surged” during the 2003 blackout. Clinical Toxicology 45 (3):248–54.
- Klein, S.L., and C.H. Calisher. 2007. Emergence and persistence of hantaviruses. In Wildlife and emerging zoonotic diseases: The biology, circumstances and consequences of cross-species transmission, Vol. 315, eds. J.E. Childs, J.S. Mackenzie and J.A. Richt, 217–52. Springer Science & Business Media.
- Klinenberg, E. 2003. Review of heat wave: Social autopsy of disaster in Chicago. New England Journal of Medicine 348 (7):666–67. doi:10.1056/NEJM200302133480721.
- Klinger, C., O. Landeg, and V. Murray. 2014. Power outages, extreme events and health: A systematic review of the literature from 2011–2012. PLOS Currents Disasters 6: ecurrents.dis.04eb1dc5e73dd1377e05a10e9edde673. http://doi.org/10.1371/currents.dis.04eb1dc5e73dd1377e05a10e9edde673
- Knapp, K.R., and M.C. Kruk. 2010. Quantifying interagency differences in tropical cyclone best-track wind speed estimates. Monthly Weather Review 138 (4):1459–73.
- Knutson, T.R., J.L. McBride, J. Chan, K. Emanuel, G. Holland, C. Landsea, I. Held, J.P. Kossin, A.K. Srivastava, and M. Sugi. 2010. Tropical cyclones and climate change. Nature Geoscience 3 (3):157–63.
- Kossin, J.P., T.L. Olander, and K.R. Knapp. 2013. Trend analysis with a new global record of tropical cyclone intensity. Journal of Climate 26 (24):9960–76.
- Kunkel, K.E., T.R. Karl, H. Brooks, J. Kossin, J.H. Lawrimore, D. Arndt, L. Bosart, D. Changnon, S.L. Cutter, and N. Doesken. 2013a. Monitoring and understanding trends in extreme storms: State of knowledge. Bulletin of the American Meteorological Society 94 (4):499–514.
- Kunkel, K.E., T.R. Karl, D.R. Easterling, K. Redmond, J. Young, X. Yin, and P. Hennon. 2013b. Probable maximum precipitation and climate change. Geophysical Research Letters 40 (7):1402–8.
- La Greca, A.M., W.K. Silverman, B. Lai, and J. Jaccard. 2010. Hurricane-related exposure experiences and stressors, other life events, and social support: Concurrent and prospective impact on children’s persistent posttraumatic stress symptoms. Journal of Consulting and Clinical Psychology 78 (6):794.
- LaKind, J.S., J. Overpeck, P.N. Breysse, L. Backer, S.D. Richardson, J. Sobus, A. Sapkota, C.R. Upperman, C. Jiang, and C. Ben Beard. 2016. Exposure science in an age of rapidly changing climate: Challenges and opportunities. Journal of Exposure Science and Environmental Epidemiology 26 (6):529–38.
- Landsea, C.W., G.A. Vecchi, L. Bengtsson, and T.R. Knutson. 2010. Impact of duration thresholds on Atlantic tropical cyclone counts. Journal of Climate 23 (10):2508–19.
- Lane, K., K. Charles-Guzman, K. Wheeler, Z. Abid, N. Graber, and T. Matte. 2013. Health effects of coastal storms and flooding in urban areas: A review and vulnerability assessment. Journal of Environmental and Public Health, Article ID 913064. doi:10.1155/2013/913064
- Levi, T., F. Keesing, K. Oggenfuss, and R.S. Ostfeld. 2015. Accelerated phenology of blacklegged ticks under climate warming. Philosophical Transactions of the Royal Society B 370 (1665):20130556.
- Lin, S., B.A. Fletcher, M. Luo, R. Chinery, and S.-A. Hwang. 2011. Health impact in New York City during the northeastern blackout of 2003. Public Health Reports 126 (3):384–93.
- Liu, J.C., A. Wilson, L.J. Mickley, F. Dominici, K. Ebisu, Y. Wang, M.P. Sulprizio, R.D. Peng, X. Yue, and J.-Y. Son. 2017. Wildfire-specific fine particulate matter and risk of hospital admissions in urban and rural counties. Epidemiology 28 (1):77–85.
- Lloyd, E.L. 1991. The role of cold in ischaemic heart disease: A review. Public Health 105 (3):205–15.
- Loughry, M. 2010. Climate change, human movement and the promotion of mental health: What have we learnt from earlier global stressors? In Climate change and displacement: Multidisciplinary perspectives, ed. J. McAdam. Portland, OR: Hart Publishing.
- Luber, G., K. Knowlton, J. Balbus, H. Frumkin, M. Hayden, J. Hess, M. McGeehin, N. Sheats, L. Backer, C.B. Beard, K.L. Ebi, E. Maibach, R.S. Ostfeld, C. Wiedinmyer, E. Zielinski-Gutiérrez, and L. Ziska. 2014. Human health. In Climate change impacts in the United States: The third national climate assessment, ed. J.M. Melillo, T.C. Richmond, and G.W. Yohe. Washington, DC: U.S. Global Change Research Program.
- Madrigano, J., M.A. Mittleman, A. Baccarelli, R. Goldberg, S. Melly, S. Von Klot, and J. Schwartz. 2013. Temperature, myocardial infarction, and mortality: Effect modification by individual- and area-level characteristics. Epidemiology 24 (3):439–46. doi:10.1097/EDE.0b013e3182878397.
- Man-Chi, W., K.-H. Yeung, and W.-L. Chang. 2006. Trends in western North Pacific tropical cyclone intensity. Eos, Transactions, American Geophysical Union 87 (48):537–38.
- Maupin, M.A., J.F. Kenny, S.S. Hutson, J.K. Lovelace, N.L. Barber, and K.S. Linsey. 2014. Estimated use of water in the United States in 2010. Reston, VA: U.S. Geological Survey.
- McMichael, A.J., and E. Lindgren. 2011. Climate change: Present and future risks to health, and necessary responses. Journal of Internal Medicine 270 (5):401–13.
- Medina-Ramón, M., A. Zanobetti, D.P. Cavanagh, and J. Schwartz. 2006. Extreme temperatures and mortality: Assessing effect modification by personal characteristics and specific cause of death in a multi-city case-only analysis. Environmental Health Perspectives 114: 1331–1336.
- Meehl, G.A., C. Tebaldi, G. Walton, D. Easterling, and L. McDaniel. 2009. Relative increase of record high maximum temperatures compared to record low minimum temperatures in the US. Geophysical Research Letters 36: L23701. doi:10.1029/2009GL040736.
- Melillo, J.M., T.C. Richmond, and G.W. Yohe, Eds.. 2014. Climate change impacts in the United States. The third national climate assessment. Washington, DC: U.S. Global Change Research Program. doi:10.7930/J0BG2KWD.
- Mitchell, D., C. Heaviside, S. Vardoulakis, C. Huntingford, G. Masato, B.P. Guillod, P. Frumhoff, A. Bowery, D. Wallom, and M. Allen. 2016. Attributing human mortality during extreme heat waves to anthropogenic climate change. Environmental Research Letters 11 (7):074006.
- Moorin, R.E., J.S. Heyworth, G.M. Forbes, and T.V. Riley. 2010. Long-term health risks for children and young adults after infective gastroenteritis. Emerging Infectious Diseases 16 (9):1440.
- Moser, S.C., M.A. Davidson, P. Kirshen, P. Mulvaney, J.F. Murley, J.E. Neumann, L. Petes, D. Reed, J.M. Melillo, and T.T. Richmond. 2014. Coastal zone development and ecosystems. In Climate change impacts in the United States: The third national climate assessment, eds. J.M. Melillo, T.C. Richmond, and G.W. Yohe, 579–618. Global Change Research Program. doi:10.7930/J0MS3QNW.
- Murphy, H.M., M.D. Prioleau, M.A. Borchardt, and P.D. Hynds. 2017. Epidemiological evidence of groundwater contribution to global enteric disease, 1948–2015. Hydrogeology Journal 25 (4):981–1001.
- Naeher, L.P., M. Brauer, M. Lipsett, J.T. Zelikoff, C.D. Simpson, J.Q. Koenig, and K.R. Smith. 2007. Woodsmoke health effects: A review. Inhalation Toxicology 19 (1):67–106.
- National Centers for Environmental Information. 2015. State of the climate: National climate report for May 2015. NOAA National Centers for Environmental Information, State of the Climate: Global Climate Report for Annual 2015, published online January 2016, retrieved on January 17, 2018 from https://www.ncdc.noaa.gov/sotc/global/201513.
- National Centers for Environmental Information. 2017. U.S. billion-dollar weather and climate disasters. https://www.ncdc.noaa.gov/billions
- Neblett Fanfair, R., K. Benedict, J. Bos, S.D. Bennett, L. Yi-Chun, T. Adebanjo, K. Etienne, E. Deak, G. Derado, and W.-J. Shieh. 2012. Necrotizing cutaneous mucormycosis after a tornado in Joplin, Missouri, in 2011. New England Journal of Medicine 367 (23):2214–25.
- Nicault, A., S. Alleaume, S. Brewer, M. Carrer, P. Nola, and J. Guiot. 2008. Mediterranean drought fluctuation during the last 500 years based on tree-ring data. Climate Dynamics 31 (2–3):227–45.
- Nixon, R. 2011. Slow violence and the environmentalism of the poor. Cambridge, MA: Harvard University Press.
- O’Neill, M.S., A. Zanobetti, and J. Schwartz. 2005. Disparities by race in heat-related mortality in four US cities: The role of air conditioning prevalence. Journal of Urban Health 82 (2):191–97. doi:10.1093/jurban/jti043.
- Ogden, N.H., M. Radojevic, W. Xiaotian, V.R. Duvvuri, P.A. Leighton, and W. Jianhong. 2014. Estimated effects of projected climate change on the basic reproductive number of the Lyme disease vector Ixodes scapularis. Environmental Health Perspectives 122 (6):631.
- Osofsky, H.J., J.D. Osofsky, M. Kronenberg, A. Brennan, and T.C. Hansel. 2009. Posttraumatic stress symptoms in children after Hurricane Katrina: Predicting the need for mental health services. American Journal of Orthopsychiatry 79 (2):212.
- Otto, F.E.L., N. Massey, G.J. van Oldenborgh, R.G. Jones, and M.R. Allen. 2012. Reconciling two approaches to attribution of the 2010 Russian heat wave. Geophysical Research Letters 39: L04702. doi:10.1029/2011GL050422.
- Penner, S.J., and C. Wachsmuth. 2008. Disaster management and populations with special needs. Public Administration and Public Policy-New York 138:427.
- Peterson, T.C., T.R. Karl, J.P. Kossin, K.E. Kunkel, J.H. Lawrimore, J.R. McMahon, R.S. Vose, and X. Yin. 2014. Changes in weather and climate extremes: State of knowledge relevant to air and water quality in the United States. Journal of the Air & Waste Management Association 64 (2):184–97.
- Peterson, T.C., P.A. Stott, and S. Herring. 2012. Explaining extreme events of 2011 from a climate perspective. Bulletin of the American Meteorological Society 93 (7):1041–67.
- Pietrzak, R.H., P.H. Van Ness, T.R. Fried, S. Galea, and F.H. Norris. 2013. Trajectories of posttraumatic stress symptomatology in older persons affected by a large-magnitude disaster. Journal of Psychiatric Research 47 (4):520–26.
- Prezant, D.J., J. Clair, S. Belyaev, D. Alleyne, G.I. Banauch, M. Davitt, K. Vandervoorts, K.J. Kelly, B. Currie, and G. Kalkut. 2005. Effects of the August 2003 blackout on the New York City healthcare delivery system: A lesson for disaster preparedness. Critical Care Medicine 33 (1):S96–S101.
- Puett, R.C., J. Schwartz, J.E. Hart, J.D. Yanosky, F.E. Speizer, H. Suh, C.J. Paciorek, L.M. Neas, and F. Laden. 2008. Chronic particulate exposure, mortality, and coronary heart disease in the nurses’ health study. American Journal of Epidemiology 168 (10):1161–68.
- Radeloff, V.C., R.B. Hammer, S.I. Stewart, J.S. Fried, S.S. Holcomb, and J.F. McKeefry. 2005. The wildland–urban interface in the United States. Ecological Applications 15 (3):799–805.
- Rahmstorf, S., and D. Coumou. 2011. Increase of extreme events in a warming world. Proceedings of the National Academy of Sciences 108 (44):17905–09.
- Rappaport, E.N. 2014. Fatalities in the United States from Atlantic tropical cyclones: New data and interpretation. Bulletin of the American Meteorological Society 95 (3):341–46.
- Rappaport, E.N., and B. W. Blanchard. 2016. Fatalities in the United States indirectly associated with Atlantic tropical cyclones. Bulletin of the American Meteorological Society 97 (7):1139–48.
- Reisen, W.K., D. Cayan, M. Tyree, C.M. Barker, B. Eldridge, and M. Dettinger. 2008. Impact of climate variation on mosquito abundance in California. Journal of Vector Ecology 33 (1):89–98.
- Reusken, C., and P. Heyman. 2013. Factors driving hantavirus emergence in Europe. Current Opinion in Virology 3 (1):92–99.
- Ruggiero, K.J., K. Gros, J.L. McCauley, H.S. Resnick, M. Morgan, D.G. Kilpatrick, W. Muzzy, and R. Acierno. 2012. Mental health outcomes among adults in Galveston and Chambers counties after Hurricane Ike. Disaster Medicine and Public Health Preparedness 6 (01):26–32.
- Russo, S., A. Dosio, R.G. Graversen, J. Sillmann, H. Carrao, M.B. Dunbar, A. Singleton, P. Montagna, P. Barbola, and J.V. Vogt. 2014. Magnitude of extreme heat waves in present climate and their projection in a warming world. Journal of Geophysical Research: Atmospheres 119 (22): 12–500.
- Russo, S., J. Sillmann, and E.M. Fischer. 2015. Top ten European heatwaves since 1950 and their occurrence in the coming decades. Environmental Research Letters 10 (12):124003.
- Sapkota, A.J., M. Symons, J. Kleissl, L. Wang, M.B. Parlange, J. Ondov, P.N. Breysse, G.B. Diette, P.A. Eggleston, and T.J. Buckley. 2005. Impact of the 2002 Canadian forest fires on particulate matter air quality in Baltimore City. Environmental Science & Technology 39 (1):24–32.
- Sarofim, M.C., S. Saha, M.D. Hawkins, D.M. Mills, J. Hess, R. Horton, P. Kinney, J. Schwartz, and A. St. Juliana. 2016. Temperature-related death and illness. In The impacts of climate change on human health in the United States: A scientific assessment. U.S. Global Change Research Program. https://health2016.globalchange.gov.
- Satumtira, G. and L. Dueñas-Osorio. 2010. Synthesis of modeling and simulation methods on critical infrastructure interdependencies research. In Sustainable and resilient critical infrastructure systems, 1–51. Berlin/Heidelberg: Springer.
- Schreck, I.I.I., J. Carl, K.R. Knapp, and J.P. Kossin. 2014. The impact of best track discrepancies on global tropical cyclone climatologies using IBTrACS. Monthly Weather Review 142 (10):3881–99.
- Schwartz, J. 2005. Who is sensitive to extremes of temperature?: A case-only analysis. Epidemiology 16 (1):67–72.
- Seneviratne, S.I., N. Nicholls, D. Easterling, C.M. Goodess, S. Kanae, J. Kossin, Y. Luo, J. Marengo, K. McInnes, and M. Rahimi. 2012. Changes in climate extremes and their impacts on the natural physical environment. In Managing the risks of extreme events and disasters to advance climate change adaptation, A Special Report of Working Groups I and II of the Intergovernmental Panel on Climate Change (IPCC),eds. C.B. Field, V. Barros, T.F. Stocker, D. Qin, D.J. Dokken, K.L. Ebi, M.D. Mastrandrea, K.J. Mach, G.A.K. Plattner, S.K. Allen, M. Tignor, P.M. Midgley, 109–230. Cambridge, UK/New York, USA: Cambridge University Press.
- Sheffield, P.E., K. Knowlton, J.L. Carr, and P.L. Kinney. 2011. Modeling of regional climate change effects on ground-level ozone and childhood asthma. American Journal of Preventive Medicine 41 (3):251–57.
- Shen, L., L.J. Mickley, and E. Gilleland. 2016. Impact of increasing heat waves on US ozone episodes in the 2050s: Results from a multimodel analysis using extreme value theory. Geophysical Research Letters 43 (8):4017–25.
- Shi, L., P. Liu, Y. Wang, A. Zanobetti, A. Kosheleva, P. Koutrakis, and J. Schwartz. 2016. Chronic effects of temperature on mortality in the Southeastern USA using satellite-based exposure metrics. Scientific Reports 6: 30161. http://doi.org/10.1038/srep30161.
- Skinner, M.W., N.M. Yantzi, and M.W. Rosenberg. 2009. Neither rain nor hail nor sleet nor snow: Provider perspectives on the challenges of weather for home and community care. Social Science & Medicine 68 (4):682–88.
- Smith, A.B., and R.W. Katz. 2013. US billion-dollar weather and climate disasters: Data sources, trends, accuracy and biases. Natural Hazards 67 (2):387–410.
- Smith, A.B., and J.L. Matthews. 2015. Quantifying uncertainty and variable sensitivity within the US billion-dollar weather and climate disaster cost estimates. Natural Hazards 77 (3):1829–51.
- Špitalar, M., J.J. Gourley, C. Lutoff, P.-E. Kirstetter, M. Brilly, and N. Carr. 2014. Analysis of flash flood parameters and human impacts in the US from 2006 to 2012. Journal of Hydrology 519:863–70.
- Srinivasan, S., L.R. O’Fallon, and A. Dearry. 2003. Creating healthy communities, healthy homes, healthy people: Initiating a research agenda on the built environment and public health. American Journal of Public Health 93 (9):1446–50.
- Stafoggia, M., F. Forastiere, D. Agostini, A. Biggeri, L. Bisanti, E. Cadum, N. Caranci, F. de’Donato, S.D. Lisio, M.D. Maria, P. Michelozzi, R. Miglio, P. Pandolfi, S. Picciotto, M. Rognoni, A. Russo, C. Scarnato, and C.A. Perucci. 2006. Vulnerability to heat-related mortality: A multicity, population-based, case-crossover analysis. Epidemiology 17 (3):315–23. doi:10.1097/01.ede.0000208477.36665.34.
- Stanke, C., M. Kerac, C. Prudhomme, J. Medlock, and V. Murray. 2013. Health effects of drought: A systematic review of the evidence. PLoS Currents 5: ecurrents.dis.7a2cee9e980f91ad7697b570bcc4b004. http://doi.org/10.1371/currents.dis.7a2cee9e980f91ad7697b570bcc4b004
- Stocker, T.F., D. Qin, G.-K. Plattner, M. Tignor, S.K. Allen, J. Boschung, A. Nauels, Y. Xia, V. Bex, and P.M. Midgley. 2013. Climate change 2013: The physical science basis. Intergovernmental Panel on Climate Change, Working Group I Contribution to the IPCC Fifth Assessment Report (AR5). New York, NY: Cambridge University Press.
- Stott, P.A., D.A. Stone, and M.R. Allen. 2004. Human contribution to the European heatwave of 2003. Nature 432 (7017):610–14.
- Svendsen, E.S., G. Baine, M.E. Northridge, L.K. Campbell, and S.S. Metcalf. 2014. Recognizing resilience. American Journal of Public Health. 104(4): 581–3
- Sweet, W.V., M. Menendez, A. Genz, J. Obeysekera, J. Park, and J.J. Marra. 2016. In Tide’s Way: Southeast Florida’s September 2015 Sunny-day Flood. Bulletin of the American Meteorological Society 97 (12):S25–S30.
- Szeto, K., X. Zhang, R.E. White, and J. Brimelow. 2016. The 2015 extreme drought in Western Canada. Bulletin of the American Meteorological Society 97 (12):S42–S46.
- Tan, J., Y. Zheng, X. Tang, C. Guo, L. Liping, G. Song, X. Zhen, D. Yuan, A. Kalkstein, L. Furong, and H. Chen. 2010. The urban heat island and its impact on heat waves and human health in Shanghai. International Journal of Biometeorology 54 (1):75–84. doi:10.1007/s00484-009-0256-x.
- Tong, D.Q., J.X.L. Wang, T.E. Gill, H. Lei, and B. Wang. 2017. Intensified dust storm activity and Valley fever infection in the southwestern United States. Geophysical Research Letters 44(9): 4304–4312.
- Tracy, M., F.H. Norris, and S. Galea. 2011. Differences in the determinants of posttraumatic stress disorder and depression after a mass traumatic event. Depression and Anxiety 28 (8):666–75.
- Trenberth, K.E., A. Dai, G. Van Der Schrier, P.D. Jones, J. Barichivich, K.R. Briffa, and J. Sheffield. 2014. Global warming and changes in drought. Nature Climate Change 4 (1):17–22.
- Trtanj, J., L. Jantarasami, J. Brunkard, T. Collier, J. Jacobs, E. Lipp, S. McLellan, S. Moore, H. Paerl, J. Ravenscroft, M. Sengco, and J. Thurston. 2016. Climate impacts on water-related illness. In The impacts of climate change on human health in the United States: A scientific assessment, 157–188. Washington, DC: U.S. Global Change Research Program.
- Uejio, C.K., S.H. Yale, K. Malecki, M.A. Borchardt, H.A. Anderson, and J.A. Patz. 2014. Drinking water systems, hydrology, and childhood gastrointestinal illness in Central and Northern Wisconsin. American Journal of Public Health 104 (4):639–46.
- United Nations Office for the Coordination of Humanitarian Affairs. 2017. Kenya Humanitarian Partnership Team. Kenya drought response, Situation report no. 1.
- U.S. EPA. 2013.Integrated Science Assessment (ISA) of ozone and related photochemical oxidants (Final Report, Feb 2013). U.S. Environmental Protection Agency, Washington, DC, EPA/600/R-10/076F, 2013.
- Vaughan, D.G., J.C. Comiso, I. Allison, J. Carrasco, G. Kaser, R. Kwok, P. Mote, T. Murray, F. Paul, and J. Ren. 2013. Observations: Cryosphere. Climate Change 2103:317–82.
- Vecchi, G.A., and T.R. Knutson. 2008. On estimates of historical North Atlantic tropical cyclone activity. Journal of Climate 21 (14):3580–600.
- Velden, C., B. Harper, F. Wells, J.L. Beven, R. Zehr, T. Olander, M. Mayfield, C. Guard, M. Lander, and R. Edson. 2006. The Dvorak tropical cyclone intensity estimation technique: A satellite-based method that has endured for over 30 years. Bulletin of the American Meteorological Society 87 (9):1195–210.
- Vins, H., J. Bell, S. Saha, and J.J. Hess. 2015. The mental health outcomes of drought: A systematic review and causal process diagram. International Journal of Environmental Research and Public Health 12 (10):13251–75.
- Walsh, J., D. Wuebbles, K. Hayhoe, J. Kossin, K. Kunkel, G. Stephens, P. Thorne, R. Vose, M. Wehner, J. Willis, D. Anderson, S. Doney, R. Feely, P. Hennon, V. Kharin, T. Knutson, F. Landerer, T. Lenton, J. Kennedy, and R. Somerville. 2014. Our changing climate. In Climate change impacts in the United States: The third national climate assessment, eds. J.M. Melillo, T.C. Richmond, and G.W. Yohe, U.S. Global Change Research Program, 19–67. doi:10.7930/J0KW5CXT.
- Watson, D.C., M. Sargianou, A. Papa, P. Chra, I. Starakis, and G. Panos. 2014. Epidemiology of Hantavirus infections in humans: A comprehensive, global overview. Critical Reviews in Microbiology 40 (3):261–72.
- Weaver, C.P., E. Cooter, R. Gilliam, A. Gilliland, A. Grambsch, D. Grano, B. Hemming, S.W. Hunt, C. Nolte, and D.A. Winner. 2009. A preliminary synthesis of modeled climate change impacts on US regional ozone concentrations. Bulletin of the American Meteorological Society 90 (12):1843–63.
- Whitehead, P.G., R.L. Wilby, R.W. Battarbee, M. Kernan, and A.J. Wade. 2009. A review of the potential impacts of climate change on surface water quality. Hydrological Sciences Journal 54 (1):101–23.
- Wilby, R.L. 2008. Constructing climate change scenarios of urban heat island intensity and air quality. Environment and Planning B: Planning and Design 35 (5):902–19.
- Williams, A.P., R. Seager, J.T. Abatzoglou, B.I. Cook, J.E. Smerdon, and E.R. Cook. 2015. Contribution of anthropogenic warming to California drought during 2012–2014. Geophysical Research Letters 42 (16):6819–28.
- Woodhead, M. 2016. Hospitals overwhelmed with patients after “thunderstorm asthma” hits Melbourne. British Medical Journal Publishing Group. 355:1–2.
- Youssouf, H., C. Liousse, L. Roblou, E.-M. Assamoi, R.O. Salonen, C. Maesano, S. Banerjee, and I. Annesi-Maesano. 2014. Non-accidental health impacts of wildfire smoke. International Journal of Environmental Research and Public Health 11 (11):11772–804.
- Zanobetti, A., M.S. O’Neill, C.J. Gronlund, and J.D. Schwartz. 2012. Summer temperature variability and long-term survival among elderly people with chronic disease. Proceedings of the National Academy of Sciences 109 (17):6608–13. doi:10.1073/pnas.1113070109.
- Ziska, L., A. Crimmins, A. Auclair, S. DeGrasse, J.F. Garofalo, A.S. Khan, I. Loladze, A.P. de León, A. Showler, J. Thurston and I. Walls. 2016. Food safety, nutrition, and distribution. In The impacts of climate change on human health in the United States: A scientific assessment, 189–216.
- Ziska, L., K. Knowlton, C. Rogers, D. Dalan, N. Tierney, M.A. Elder, W. Filley, J. Shropshire, L.B. Ford, and C. Hedberg. 2011. Recent warming by latitude associated with increased length of ragweed pollen season in central North America. Proceedings of the National Academy of Sciences 108 (10):4248–51.
- Zoraster, R.M. 2010. Vulnerable populations: Hurricane Katrina as a case study. Prehospital and Disaster Medicine 25 (01):74–78.