
 ?Mathematical formulae have been encoded as MathML and are displayed in this HTML version using MathJax in order to improve their display. Uncheck the box to turn MathJax off. This feature requires Javascript. Click on a formula to zoom.
ABSTRACT
Indoor dust is one of the key sources contributing to indoor air pollution (IAP) in rural households. It acts as a media for various toxicants like heavy metal depositions and causes severe health risks. The present study deals with investigation of metal concentrations and morphological characteristics of indoor dust generated in varied fuel types followed by estimation of health risks for women and children in rural households in Telangana, India. Indoor floor dust samples were collected from households using biomass and liquefied petroleum gas (LPG) as their cooking energy during winter to evaluate the morphological and chemical characteristics in the aforementioned dust samples. A morphological (SEM-EDX) analysis revealed the presence of carbonaceous particles in biomass-based households and mineral-rich crustal sources in LPG-based households. As observed from ICP-OES analysis, there is a significant difference in mean concentrations of Al, Co, Cr, Fe, Zn, and Ni based on fuel type, except for Mn and Pb. From Pearson’s correlation analysis and principal component analysis, it was observed that the biomass households were dominated by Zn, Al, Mn, Cr, and Pb, which could have been contributed from biomass burning deposits, crustal sources, and unpaved roads, while Cr, Pb, Fe, and Mn dominated in LPG households, indicating their origin from leaded paints (Pb and Cr) and crustal sources. The health risks associated with these heavy metals to women and children were investigated using an EPA health risk model. The values from the model indicated that both non-carcinogenic and carcinogenic risks were within the safe levels for both subjects. This study not only establishes chemical and morphological characteristics of indoor dust, but also quantifies the role of fuel type.
Implications: The present study provides the latest geographical evidence of chemical and morphological characterization of indoor dust particles in varied fuels; i.e, biomass- and LPG-based households and associated health risk assessment in a sub-tropical rural site in Telangana, India. Nevertheless, further research is essential from various regions across the country for more heavy metal analysis and factors impacting these levels. One of the major limitations of the present study is the analysis of few metals and measurements in only living area locations. Future studies can include soil and road dust, as well as kitchens and bedrooms, to provide more comprehensive analysis of dust compositions in varied environments.
Introduction
Indoor air pollution (IAP) in rural households is predominantly contributed from solid fuel combustion, cigarette smoking, paints and varnishes, infiltration of outdoor air pollutants, unpaved roads, and agricultural residue burning, resulting in terrible health implications (WHO 2007). The major constituent of IAP is particulate matter (PM) that results in increased morbidity and mortality rates due to chronic bronchitis, acute respiratory infections, lung cancer, and cardiovascular and ischemic heart diseases (Lim et al. Citation2012; WHO Citation2007). The PM deposited on the surface environment forms indoor dust, which is source and sink for various toxicants including metals and organic contaminants; i.e., polycyclic aromatic hydrocarbons (PAHs), persistent organic pollutants, asbestos, viable biological particles, etc. (Chen, Lu, and Li Citation2014; Kumar and Scott Citation2009; Lioy and Gochfeld Citation2002; Zhu et al. Citation2013). Several investigations revealed the presence of heavy metals such as arsenic (As), cadmium (Cd), chromium (Cr), copper (Cu), lead (Pb), nickel (Ni), and zinc (Zn) in indoor dust (Chattopadhyay, Lin, and Feitz Citation2003; Lin et al. Citation2015; Turner and Simmonds Citation2006; Yoshinaga et al. Citation2014).
A number of studies have been reported on heavy metal concentrations in household dusts across the world, though these studies were limited to urban households, offices (Cao et al. Citation2016; Chattopadhyay, Lin, and Feitz Citation2003; Huang et al. Citation2014; Kang et al. Citation2011; Kumar and Scott Citation2009; Kurt-Karakus Citation2012; Rasmussen et al. Citation2011; Rasmussen, Subramanian, and Jessiman Citation2001; Wang et al. Citation2011; Yoshinaga et al. Citation2014), and nursery and primary schools (Chen, Lu, and Li Citation2014), with very few in rural households (Kurt-Karakus Citation2012; Lin et al. Citation2015; Yang et al. Citation2016). A study of 82 residential homes in Sydney (Australia) reported the presence of Cd, Cr, Cu, Fe, Mn, Ni, Pb, and Zn with 4% households having elevated Pb concentrations (>1000 µg/g) contributed from motor vehicle emissions and leaded paints (Chattopadhyay, Lin, and Feitz Citation2003). In one of the first studies on urban indoor dust in India, Pb samples from 99 households in Delhi were analyzed by Kumar and Scott (Citation2009), who concluded that Pb contents were significantly higher than in the national data in the US. Further, Chen et al. (Citation2014) observed greater concentrations of Cu, Pb, Zn, Co, Cr, and Ba in nursery and primary schools in Xian, China, primarily originating from vehicles and industrial activities. Also, heavy metal concentrations of Zn, Pb, Cu, Cr, V, Ni, Co, and As in rural indoor dust in Anhui, China, were higher than background soils and varied within different rural areas due to a difference in structural characteristics of houses, sweeping frequency, infiltration of outdoor air, unpaved roads, etc. (Lin et al. Citation2015). Thus, it is understood that heavy metal concentrations and compositions differ based on anthropogenic factors such as fuel types, cooking styles, paints, varnishes, vehicular emissions, furniture, structural characteristics, and natural sources, including crustal and geogenic origins. It is also evident that there exists considerable difference in indoor dust compositions in urban and rural households, making rural indoor dust the current focus of the present study. Furthermore, few studies reported use of scanning electron microscopy (SEM) with energy dispersive X-ray spectroscopy (EDX) in morphological analysis of indoor dust samples, along with identification of the sources (Brown, Millette, and Mount Citation1995; Hunt et al. Citation1992; Jianhua et al. Citation2006; Kelepertzis et al. Citation2019; Agarwal et al. Citation2019; Yang et al. Citation2016). However, application of SEM for source determination in rural indoor dust in households using biomass and liquefied petroleum gas (LPG) as fuel has been limited so far (Yang et al. Citation2016).
Children, adults, and elderly women who spend ~71–89% of their time in indoor areas are exposed to heavy metals that are highly toxic and non-degradable via dermal, ingestion, and inhalation. The prolonged exposure to heavy metals leads to chronic accumulation in internal organs and tissues, resulting in severe health hazards (Chen, Lu, and Li Citation2014; Kurt-Karakus Citation2012). In the past, many studies were reported on non-carcinogenic and carcinogenic risks associated with the heavy metals using the USEPA (Citation1996) model for indoor dust in homes and offices, nursery and primary schools, rural households, and for street dust in Istanbul, Turkey (Kurt-Karakus Citation2012), Shaanxi, China (Chen, Lu, and Li Citation2014), Anhui, China (Lin et al. Citation2015), Dhanbad, India (Masto et al. Citation2017), and Huludao, China (Zheng et al. Citation2010), respectively. It was observed that in indoor dust in schools and households, both non-carcinogenic and carcinogenic risks were within safe levels (Chen, Lu, and Li Citation2014; Kurt-Karakus Citation2012; Lin et al. Citation2015; Lu et al. Citation2014). However, the risk levels were greater for street dust (Masto et al. Citation2017; Zheng et al. Citation2010). Hence, indoor dust is one of the most common metrics used for residential quantitative exposure analysis and assessment in rural households for vulnerable people who are prone to active or passive exposures (Lioy and Gochfeld Citation2002).
Thus, the objective of the present study is to determine metal concentrations and morphological characteristics of indoor dust samples for varied fuels during winter (high PM concentrations) in rural India, and to estimate the health risks associated with these heavy metals for children and women.
Methodology
Study area description
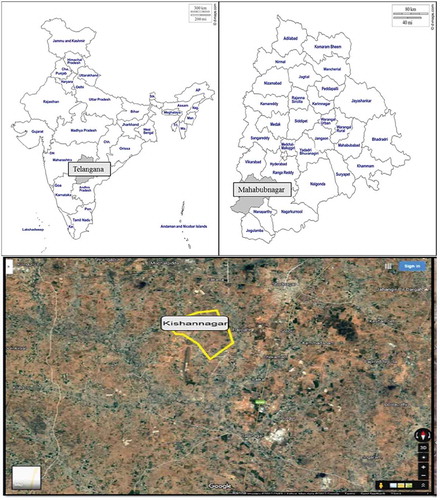
The study site is Kishannagar village (17.3850° N, 78.4867° E), Mahbubnagar district, southern Telangana, India (). The selection of the village was based on key factors like fuel usage, socioeconomic status, structural characteristics of households, and climate. This village has a total population of 3,639 of which 51% are males and 49% are females living in 737 households with a total geographical area of 1571 hectares. Agriculture is the major occupation, followed by cattle farming by 30% of the villagers. Kishannagar is characterized as having 80.5% households relying on biomass and 17.7% using LPG (Census Citation2011). In the present study, data from the 2011 census have been used. To have additional assurance of the applicability of the data, a questionnaire survey was distributed to collect primary data on the fuel usage during field studies in 2016 (Table S1 in Supplementary Information (SI)). Though the survey showed a decline in the percentage of houses using firewood, it coincided with the census on firewood being the primary fuel in these areas. The major soil types reported in this region are red sandy soil, followed by black cotton soil. Chemical composition of red sandy soils include non-soluble material, iron, aluminum, and organic matter, while black cotton soils are dominated by iron, lime, calcium, potassium, aluminum, and magnesium. The study site has a tropical climate; specifically, a semi-arid climate representative of south India. The Indian Meteorological Department (IMD) has characterized the winter season as taking place during the months of January and February, the summer season being between March and May, the southwest monsoon season as June to September, and the northeast monsoon season between October and December. According to the IMD, the warmest month of the year is May, with an average temperature of 33°C. December is the coolest month of the year, with an average temperature of 22.1°C.
Figure 1. Study areas on map of (a) India and Telangana state and (b) aerial map of rural study site: Kishan Nagar (Image source: Google Earth).
Sampling and analytical methods
Indoor floor dust samples were collected from living area locations of various households that were selected for monitoring based on the fuel used for cooking activities. Samples were collected from 20 households during the winter season (December 20, 2016, to January 25, 2017), with 10 each of biomass and LPG-based households. The sample size was selected based on the type of fuel used for cooking, proximity to the road, structural characteristics, and economic status, along with budget constraints. Thus, the sample of 20 households representative of the study region was chosen. The indoor dust samples were collected by vacuum cleaner (Euroclean) using the ASTM standard D5438 method (Citation1993) by estimating the dust loading over a 24 h average on an area of 1 m2 floor space. The collected samples were dried at 50°C for 24 h in an oven followed by sieve analysis to obtain a fraction of particles of less than 70 microns (ASTM Citation2006). The samples were kept in ziplocked plastic bags and stored in a desiccator for further analysis.
The indoor dust samples were chemically characterized for their elemental compositions following EPA method 3050B (USEPA Citation1996). The sieved sample dust was extracted through microwave digestion (Anton Paar Microwave Digestion System Multiwave GO). A total of 1 g of the dust samples were digested with a concentrated HCl (10 ml) – HNO3 (5 ml) – HClO4 (5 ml) – HF (3 ml) – H2O2 (3 ml) mixture in TFM vessels (50 ml capacity). For digestion of dust samples, the program was set for 10 minutes at 180ºC with operating pressure of 80 bar. The collected sample filtrates were allowed to cool for 10 minutes and made up to 20 ml with milliQ water. The extracted samples were quantitatively analyzed by EPA method IO-3.1 using ICP-OES (Perkin Elmer Optima 5300 DV) for elemental compositions. The elemental compositions of aluminum (Al), cobalt (Co), chromium (Cr), iron (Fe), manganese (Mn), nickel (Ni), lead (Pb), and zinc (Zn) were analyzed. The blank samples were collected in duplicate to evaluate precision and bias for quality assurance and control (GSS-1 and GSS-3). Calibration methods and minimum detection limits of instrument and the recovery rate of each element are explained in the supplementary information (Table S2).
The morphological characteristics and quantitative identification of elements in indoor dust were analyzed by High Resolution Scanning Electron Microscope (FEI Quanta FEG 200) combined with energy dispersive X-ray spectroscopy (EDX) (Genesis 2011 Emcrafts; Oxford Instruments). The sieved dust samples were mounted on the stubs followed by gold sputter coating (Cresington sputter coater 108) to attain vacuum durability and conductivity. SEM analysis was performed by scanning the electron beam (20–30 KV accelerating voltage) over the sample and observing the subsequent secondary or backscattered signals. The presence of the following elements was analyzed by SEM-EDX: aluminum (Al), barium (Ba), carbon (C), calcium (Ca), chlorine (Cl), iron (Fe), potassium (K), magnesium (Mg), molybdenum (Mo), niobium (Nb), oxygen (O), lead (Pb), and siliona (Si).
The variations in elemental compositions in indoor dust for varied fuel types—i.e., biomass and LPG-based households—were investigated using an analysis of variance (ANOVA) test. Further, elemental compositions in biomass and LPG households were analyzed using factor analysis to determine underlying components, physical interpretations, and interrelationships among the variables. On the basis of eigenvalue and cumulative variance, the total number of factors was identified. Also, Pearson correlation matrices were estimated to understand the relationship amongst the elements and further determine the contributing sources. This analysis was performed using R studio (version 2.14.1) and origin pro (8.5 version).
Enrichment factor
Enrichment factor (EF) analysis was employed to distinguish anthropogenic sources from those of natural origin using eq1. It is a fairly standard and described calculation used to analyze the enrichment of an element with reference to its abundance in the Upper Continental Crust (UCC) (Adimalla, Qian, and Wang Citation2019; Cao et al. Citation2008; Samiksha et al. Citation2017). For each element, EF was analyzed by dividing its ratio with a reference element to the ratio of baseline values; i.e., UCC values (Taylor Citation1964). For the present study, aluminum was used as the reference element, while the baseline values of the elements in soil were obtained from the literature (Taylor Citation1964; Taylor and McLennan Citation1995). The average crustal abundances of Al, Co, Cr, Fe, Mn, Ni, Pb, and Zn were 154,000, 17.3, 92, 50,400, 1000, 47, 17, and 67 mg/kg, respectively (Taylor Citation1964).
Cn and CAl represents the concentration of the element and aluminum, respectively, with household dust and background values (crustal abundance).
Health risk assessment
The model developed by the EPA (USEPA Citation1996) was used in this study to evaluate the residential exposure of heavy metals to children and women in biomass and LPG-based households. The exposure to this dust is possible through three main pathways: dermal absorption, ingestion, and inhalation of dust particles. The risk assessment was calculated for children and adult females with 6 years and 24 years, respectively (ICMR Citation2009), by estimating the average daily dose (ADD) (mg/kg/day) of pollutants through the previously mentioned pathways using the following equations:
where C is concentration (mg/kg) of metal in indoor dust, SA is exposed skin area (1.05 m2 for adults and 0.35 for children) (Harinarayan et al. Citation2013; USEPA Citation2011), AF is skin adherence factor (0.001595 kg/m2 for adults (Kissel, Richter, and Fenske Citation1996) and 0.0017 kg/m2 for children (Holmes et al. Citation1999)), ABS is dermal absorption factor (unit less) (0.001 for all elements (Ferreira-Baptista and De Miguel Citation2005)), EF is exposure frequency (365 days/year for both subjects), ED is exposure duration (24 years for adult and 6 years for children (ICMR Citation2009)), BW is body weight (60 kg for adult and 20 kg for children (Indian situation) (ICMR Citation2009; Khadilkar et al. Citation2007), IngR is ingestion rate (0.0001 kg/day for adult (USEPA Citation2011), and 0.0002 kg/day for child (USEPA Citation2011)), InhR is inhalation rate (16 m3/day for adult and 10.1 m3/day for children (USEPA Citation2011)), PEF is particle emission factor (1.36 × 10⁹ m3/kg (USEPA Citation2001)), AT is the time period over which the dose is averaged for non-carcinogens; it is ED×365 days and for carcinogens it is 70 × 365 = 25,550 days (USEPA Citation2011).
Quantified risk and hazard quotient (HQ) for non-carcinogenic effects were calculated by dividing the doses of each element and exposure pathway by their corresponding reference dose (RfD) (mg/kg/day) (), while for carcinogens, the cancer risk was estimated by multiplying the dose with corresponding slope factor (SF) (mg/kg/day)−1 () (Lin et al. Citation2015; Masto et al. Citation2017). The sum of HQ (dermal, ingestion, and inhalation) is equal to the hazard index (HI); if HI < 1, there is not a significant risk from non-carcinogenic effects; if HI > 1, there is a greater chance that non-carcinogenic effects may arise, with a likelihood to surge as HI value increases (USEPA Citation2001). Further, for carcinogens, the acceptable or tolerable risk is within the range 10−6–10−4 for regulatory purposes (Ferreira-Baptista and De Miguel Citation2005). The human exposure to heavy metals present in indoor dust in living area locations of rural households using varied fuel types in sub-tropical climate conditions was assessed based on hazard index and cancer risk methods.
Table 1. Reference doses and slope factors of heavy metals for different exposure routes.
Results and discussion
Morphological characteristics of indoor dust in biomass and LPG-based households
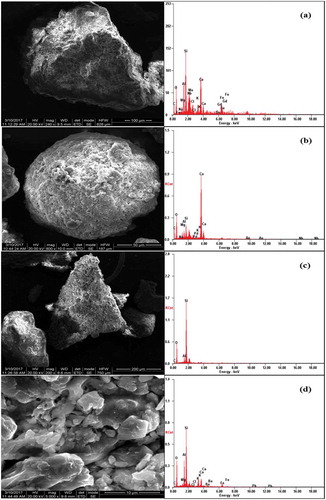
The presence of particles in the indoor dust resulting from natural/crustal sources or anthropogenic sources of varied fuel types was detailed using their morphology and elemental compositions. SEM images of indoor dust collected from biomass () and LPG () households were evaluated to differentiate various sources contributing toward it and, consequently, the impact of fuel usage on it. represents individual carbonaceous spherules with irregular shape, dominated by C and O along with inorganic soil-related elements like Si, Ca, Fe, K, Al, and Mg, primarily generated from anthropogenic activities like biomass combustion (Pachauri et al. Citation2013). ) also represents elongated structures with higher compositions of C and O (>90%) originating from biomass burning. However, ) represents elongated mineral-rich particles with C, O, Si, Al, Ca, Cl, and K, derived from crustal dust and secondary reactions arising in the atmosphere that are accumulated in the re-suspended dust (Kolluru, Patra, and Kumar Citation2019). Conversely, represents irregular and spherical morphology in LPG-based households, dominated by minerals including Si, Ca, Al, Nb, and Mo obtained from crustal sources, re-suspended dust, and paved and unpaved roads. ) shows irregularly shaped silica particles with high contents of Si and O originating from natural geogenic sources; i.e., soil, while ), reveals mineral-rich particles—i.e., Si, Al, Fe, Ca, K, Mg, Pb, and Ba—which could have been contributed from anthropogenic sources, including paints, vehicular emissions, and paved and unpaved roads, apart from crustal sources (Brown, Millette, and Mount Citation1995; Kelepertzis et al. Citation2019; Pachauri et al. Citation2013).
Figure 2. SEM image and EDX profile of indoor dust in biomass-based household.
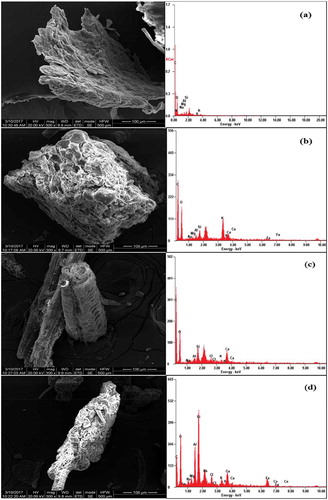
Figure 3. SEM image and EDX profile of indoor dust in LPG-based household.
Chemical characteristics of indoor dust in biomass and LPG-based households
The metals concentrations (mg/kg) in indoor dust of biomass and LPG households are reported in . These concentrations were compared with published background values of soil in Maheshwaram (~40 km from study village), Telangana (Purushotham et al. Citation2012). In biomass-based households, Al was observed with highest median concentration (54,800 mg/kg), followed by Fe (27,300 mg/kg), Mn (300 mg/kg), Zn (90 mg/kg), Cr (35 mg/kg), Pb (32 mg/kg), Ni (20 mg/kg), and Co (5.2 mg/kg). The hierarchy of metals concentrations as observed in biomass-based households is as follows: Al > Fe > Mn > Zn > Cr > Pb > Ni > Co. Further, it was observed that Co, Cr, Pb, and Ni concentration levels were lower than the background values. However, Zn levels were greater than the background levels, which could have been caused by biomass-burning deposits (Salam et al. Citation2013). In LPG-based households, the trend was similar to that of biomass households for Al (51,200 mg/kg) > Fe (17,400 mg/kg) > Mn (210 mg/kg), although it varied for heavy metals such as Cr (70 mg/kg), Pb (50 mg/kg), Zn (30 mg/kg), Ni (8 mg/kg), and Co (2.5 mg/kg). Co, Ni, and Zn concentrations were within the background values, but Cr and Pb levels were found to be higher. High levels of Pb and Cr could have come from paints and unpaved roads (Lee et al. Citation2016). Correspondingly, the hierarchy of metals concentrations in LPG-based households is as follows: Al > Fe > Mn > Cr > Pb > Zn > Ni > Co. The ANOVA confirmed significant difference (p < .05) in mean concentrations of Al, Co, Cr, Fe, Zn, and Ni for different fuel types. The results also indicated no difference for Mn and Pb, which reveals that they are coming from the same source (Table S3 in the Supplementary Information).
Table 2. Concentrations of metals in indoor dust of biomass and LPG-based households.
Further, these concentrations were compared with past investigations of indoor dust levels in households, schools, and offices, along with soil, surface, and street dust in rural and urban areas across the globe (). From the , it is clear that Fe, Mn, Co, Cr, Ni, and Pb levels were comparable to household dust (Chattopadhyay, Lin, and Feitz Citation2003; Kelepertzis et al. Citation2019; Kurt-Karakus Citation2012; Yoshinaga et al. Citation2014), school dust (Figueroa, De la O-Villanueva, and De la Parra Citation2007), and street dust (Du et al. Citation2013; Ferreira-Baptista and De Miguel Citation2005; Masto et al. Citation2017; Pathak et al. Citation2013; Yu, Wang, and Zhou Citation2014). Zn levels were significantly lower and similar to surface soils (Li et al. Citation2016) and household dust (Madany et al. Citation1994). However, Al levels were higher than values reported in the literature, and comparable to surface dust levels of industrial areas in Faridabad, India (Pathak et al. Citation2013).
Table 3. Literature on metal levels in indoor dust (household, school, office) and soil, surface, and street dust around the world.
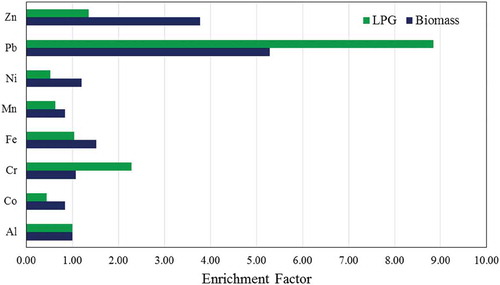
The estimated median values of the enrichment factor (EF) of biomass and LPG-based households are shown in . In both households, Pb (5.47–8.55) was higher than 5, indicating that it was significantly enriched and contaminated indoor dust. However, the median EF values of Co (0.43–0.87) and Mn (0.61–0.87) reaching 1 denotes their key contribution from nature or crustal origin (Han, Cao, and Posmentier Citation2006). Further, EF values of Cr (1.1–2.21), Fe (1–1.57), Ni (0.5–1.24), and Zn (1.3–3.9) are < 2 and indicate a lack of pollution in indoor dust (Cheng et al. Citation2018; Han, Cao, and Posmentier Citation2006). The Pb and Cr levels were higher in LPG-based households than biomass households, while Co, Fe, Mn, Ni, and Zn exhibited the opposite trend. Additionally, Pb levels were higher in LPG-based households, which might have come from paints, varnishes, and unpaved roads, etc. (Hassanvand et al. Citation2015; Lin et al. Citation2015). On the other hand, Zn levels were higher in biomass-based households, which could have come from biomass burning deposits, since Zn is an essential element for plant growth (Salam et al. Citation2013). However, in LPG-based households, Zn could have come from outdoor dust and vehicle tire wear (Lu et al. Citation2014; Zhang et al. Citation2014). Furthermore, Cr, Ni, and Zn deposits are from stainless steel utensils, metal objects, paints, and building materials (Lin et al. Citation2015; Lu et al. Citation2014).
Figure 4. Enrichment factor of elements for indoor dust in biomass and LPG-based households.
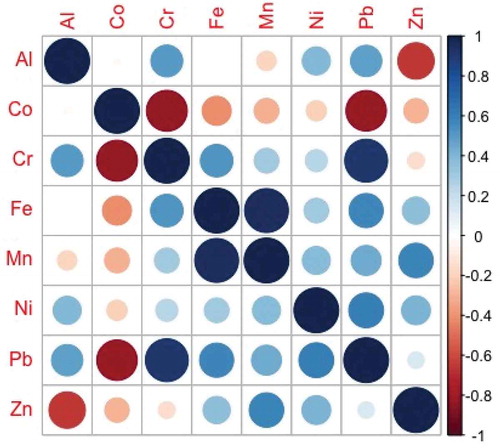
Pearson’s correlation matrix was plotted for metals concentrations in biomass () and LPG () households to measure their degree of correlation with results obtained from EF analysis. In biomass-based households, positive correlation at 95% significance was observed for Al-Co, Al-Mn, Al-Zn, and Cr-Pb pairs; however, the Cr-Zn pair showed negative correlation. In LPG-based households, Cr-Pb and Fe-Mn had positive correlations, while Co-Cr and Co-Pb were negatively correlated. Major sources contributing to the positive correlation of Al with Co, and Mn and Fe-Mn, were natural crustal sources (Zhang et al. Citation2014). Moreover, Pb-Cr correlation in both households is primarily from leaded paints, apart from unpaved roads and vehicular emissions (Lee et al. Citation2016; Liu et al. Citation2014; Zhang et al. Citation2014).
Figure 5. Correlation coefficient matrices for metal concentrations in biomass-based households.
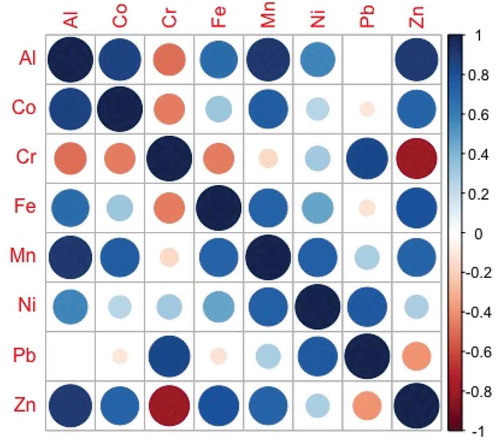
Figure 6. Correlation coefficient matrices for metal concentrations in LPG-based households.
The sources contributing to elemental concentrations in biomass and LPG-based households were identified using a PCA technique. and depict the results of PCA analysis, such as factor loadings and eigenvalues for biomass and LPG-based households, respectively. In biomass-based households, two factors were extracted with initial eigenvalues > 1.0, which extracted 88.58% of the total variance. Factor loadings of Al, Fe, Mn, and Zn were high on Factor 1 with 56.94% of total variance, indicating that they were contributed by crustal sources dominated by laterite soils and biomass burning deposits (Salam et al. Citation2013; Zhang et al. Citation2014). On Factor 2, Cr, Pb, and Ni showed great loadings with 31.64% of total variance, representing that they may have been contributed from paints, unpaved roads, and vehicular emissions (Lin et al. Citation2015; Lu et al. Citation2014; Yongming et al. Citation2006). However, in LPG-based households, three factors were obtained, accounting for 89.5% of the total variance. Factor 1 is dominated by Cr and Pb accounting for 48.46% of the total variance, once again reflecting the lead-chromate paints (Lee et al. Citation2016). Factor 2, dominated by Zn, Fe, and Mn, accounts for 27.57% of the total variance, considered to be soil or geogenic sources. Factor 3 is dominated by Ni, Co, and Al accounting for 13.47% of the total variance.
Table 4. Matrix of factor analysis of metals in indoor dust of biomass households.
Table 5. Matrix of factor analysis of metals in indoor dust of LPG households.
Health risk assessment
The health risk assessments of metals in indoor dust were calculated using three different pathways to children () and women () for both fuel types in Kishannagar village, Telangana state, India. In terms of non-carcinogenic risk, ingestion is the dominant exposure pathway, followed by dermal contact and inhalation for children and adults, which is comparable to earlier studies (Ferreira-Baptista and De Miguel Citation2005; Lin et al. Citation2015; Lu et al. Citation2014). The highest ADDing value for children was 9.00E-04 for Zn (biomass); the lowest was 2.55E-05 for Co (LPG). Even amongst women, Zn (1.50E-04) had the highest ADDing value while Co (4.25E-06) had the lowest, but the levels were lower compared to children, as children are associated with hand-to-mouth activity resulting in higher values. Further, these results are consistent with earlier studies (Du et al. Citation2013). HQs of Co, Cr, Ni, Pb, and Zn through inhalation of dust particles were 2–5 orders lower compared to ingestion and dermal contact. HQ of Cr through ingestion was highest for children, however it was dermal in the case of women for all the other metals. The median values of HIs for all of the metals for children and women descended in the order of Cr > Pb > Ni > Zn > Co in both types of households. This study reveals that the HI values for metals due to indoor dust exposure were within safe values (USEPA Citation1989). Cr had the maximum HI levels, nearing 1, which may result in non-carcinogenic risk to children and women in both types of households in rural areas and cannot be disregarded. Carcinogenic risk through inhalation mode was only considered for the current assessment model, and it was observed that the levels of Co, Cr, and Ni were three orders lower than the acceptable range (10−6–10−4) for children and women in both types of households. Though the health risks associated with these heavy metals were within safe levels, they cannot be ignored. Few potential solutions to control metal levels in indoor dust can be using the paints or house building materials that have higher absorption characteristics, also using paints having a lower percentage of Pb and Cr apart from regular cleaning of re-suspended dust in indoor areas.
Table 6. Daily doses, hazard quotients, hazard indices, and cancer risks for children from metals in biomass and LPG-based households.
Table 7. Daily doses, hazard quotients, hazard indices, and cancer risks for women from metals in biomass and LPG-based households.
The present study provides the latest geographical evidence of chemical and morphological characterization of indoor dust particles in households using biomass and LPG-based fuel and the associated health risk assessment in a sub-tropical rural site in Telangana, India. Nevertheless, further research is essential from various regions across the country for more heavy metal analysis and factors impacting their levels. One of the major limitations of the present study is the analysis of few metals and that it took place only during winter. Moreover, the measurements were carried out in living area locations; future studies can include soil and road dust as well as kitchens and bedrooms to provide more comprehensive analysis of dust compositions in varied environments.
Conclusion
Indoor dust samples in rural households relying on biomass and LPG fuels in Kishannagar village, Telangana state, India, were analyzed for Al, Fe, Mn, Zn, Cr, Pb, Ni, and Co levels, morphological characteristics, source contribution, and estimation of health risks associated with heavy metals for women and young children. It was observed that there is a significant difference in mean concentrations of Al, Co, Cr, Fe, Zn, and Ni based on fuel type. The EF values showed that in both types of households Pb was contaminated indoor dust. Pearson’s correlation and PCA analysis revealed that the biomass households were dominated by Al, Fe, and Mn from crustal sources and laterite-rich soils, and Zn from biomass burning deposits. On the other hand, LPG households were dominated by Cr and Pb from paints, and Co and Ni from unpaved roads, stainless steel utensils, and metal objects. SEM-EDX morphological analysis helped in differentiating source contributions from biomass and LPG households. The health risks associated with these heavy metals to women and children were investigated using the EPA health risk model (USEPA Citation1996). The values from the model indicated that both non-carcinogenic and carcinogenic risks were within the safe levels for both subjects. Thus, the present study provides the latest geographical evidence of chemical and morphological characteristics of indoor dust particles for varied fuels in a rural site in Telangana, India. The present study revealed that there is an urgent need for indoor air quality (IAQ) regulations; for instance, for leaded paints (Pb-Cr) and cooking chulhas. Further, there is a need to bring awareness of government schemes such as Pradhan Mantri Ujwala Yojana (PMUY) sponsored by the government of India; these are significant as they help in the transition from biomass to LPG and thus reduce risk.
Supplemental Material
Download MS Word (18.1 KB)Acknowledgments
The authors thank the China Section of the Air & Waste Management Association for the generous scholarship they received to cover the cost of page charges, and make the publication of this paper possible. The authors also thank the people of Kishan Nagar village for being very cooperative during the monitoring campaign. They also express their sincere thanks to the Sophisticated Analytical Instruments Facility (SAIF), Indian Institute of Technology Madras, Chennai, India, for their support of this study.
Disclosure statement
No potential conflict of interest was reported by the authors.
Supplementary material
Supplemental data for this article can be accessed on the publisher's website.
Additional information
Funding
Notes on contributors
Deepthi Yaparla
Deepthi Yaparla is a Ph.D. scholar in the Department of Civil Engineering, Environmental and Water Resources Engineering Division, Indian Institute of Technology Madras, Chennai, India.
S.M. Shiva Nagendra
S.M. Shiva Nagendra is a professor in the Department of Civil Engineering, Environmental and Water Resources Engineering Division, Indian Institute of Technology Madras, Chennai, India.
Sathyanarayana N. Gummadi
Sathyanarayana N. Gummadi is a professor in the Department of Biotechnology, Indian Institute of Technology Madras, Chennai, India.
Related Research Data
References
- Adimalla, N., H. Qian, and H. Wang. 2019. Assessment of heavy metal (HM) contamination in agricultural soil lands in northern Telangana, India: An approach of spatial distribution and multivariate statistical analysis. Environ. Monit. Assess. 191 (4):246.
- Agarwal, N., S. M. Nagendra, A. E. Peter, and D. Yaparla. 2019. Microanalysis of the floor dust particles in the classrooms of tropical urban environment. J. Inst. Eng. (India) Ser. A (2019):1–12.
- Akhter, M. S., and I. M. Madany. 1993. Heavy metals in street and house dust in Bahrain. Water Air Soil Pollut. 66 (1–2):111–19. doi:10.1007/BF00477063.
- ASTM, C. 2006. Standard practice for making and curing concrete test specimens in the laboratory. Annu. Book ASTM Stand. 4.
- ASTM, D. 1993. 5379-93, test method for shear properties of composite materials by the V-notched beam method. Philadelphia, PA: American Society for Testing and Materials.
- Brown, R. S., J. R. Millette, and M. D. Mount. 1995. Application of scanning electron microscopy for pollution particle source determination in residential dust and soil. Scanning 17 (5):302–05. doi:10.1002/sca.4950170506.
- Cao, J. J., J. C. Chow, J. G. Watson, F. Wu, Y. M. Han, Z. D. Jin, … Z. S. An. 2008. Size-differentiated source profiles for fugitive dust in the Chinese Loess Plateau. Atmos. Environ. 42 (10):2261–75. doi:10.1016/j.atmosenv.2007.12.041.
- Cao, S., X. Duan, X. Zhao, Y. Chen, B. Wang, C. Sun, … F. Wei. 2016. Health risks of children’s cumulative and aggregative exposure to metals and metalloids in a typical urban environment in China. Chemosphere 147:404–11. doi:10.1016/j.chemosphere.2015.12.134.
- Census of India. 2011. Census info India 2011: Houses, household amenities and assets, (Version2.0). Accessed March 28, 2016. http://www.devinfolive.info/censusinfodashboard/website/index.php/pages/kitchen_fuelused/total/Households/IND
- Chattopadhyay, G., K. C. P. Lin, and A. J. Feitz. 2003. Household dust metal levels in the Sydney metropolitan area. Environ. Res. 93 (3):301–07. doi:10.1016/s0013-9351(03)00058-6.
- Chen, H., X. Lu, and L. Y. Li. 2014. Spatial distribution and risk assessment of metals in dust based on samples from nursery and primary schools of Xi’an, China. Atmos. Environ. 88:172–82. doi:10.1016/j.atmosenv.2014.01.054.
- Cheng, Z., L. J. Chen, H. H. Li, J. Q. Lin, Z. B. Yang, Y. X. Yang, … X. M. Zhu. 2018. Characteristics and health risk assessment of heavy metals exposure via household dust from urban area in Chengdu, China. Sci. Total Environ. 619:621–29. doi:10.1016/j.scitotenv.2017.11.144.
- Du, Y., B. Gao, H. Zhou, X. Ju, H. Hao, and S. Yin. 2013. Health risk assessment of heavy metals in road dusts in urban parks of Beijing, China. Procedia Environ. Sci. 18:299–309. doi:10.1016/j.proenv.2013.04.039.
- Ferreira-Baptista, L., and E. De Miguel. 2005. Geochemistry and risk assessment of street dust in Luanda, Angola: A tropical urban environment. Atmos. Environ. 39 (25):4501–12. doi:10.1016/j.atmosenv.2005.03.026.
- Figueroa, D., M. De la O-Villanueva, and M. L. De la Parra. 2007. Heavy metal distribution in dust from elementary schools in Hermosillo, Sonora, México. Atmos. Environ. 41 (2):276–88. doi:10.1016/j.atmosenv.2006.08.034.
- Han, Y., J. Cao, and E. S. Posmentier. 2006. Multivariate analysis of heavy metal contamination in urban dusts of Xi’an, Central China. Sci. Total Environ. 355 (1–3):176–86. doi:10.1016/j.scitotenv.2005.02.026.
- Harinarayan, C. V., M. F. Holick, U. V. Prasad, P. S. Vani, and G. Himabindu. 2013. Vitamin D status and sun exposure in India. Dermato-endocrinology 5 (1):130–41. doi:10.4161/derm.23873.
- Hassanvand, M. S., K. Naddafi, S. Faridi, R. Nabizadeh, M. H. Sowlat, F. Momeniha, … S. Niazi. 2015. Characterization of PAHs and metals in indoor/outdoor PM10/PM2. 5/PM1 in a retirement home and a school dormitory. Sci. Total Environ. 527:100–10. doi:10.1016/j.scitotenv.2015.05.001.
- Holmes, K. K., Jr, J. H. Shirai, K. Y. Richter, and J. C. Kissel. 1999. Field measurement of dermal soil loadings in occupational and recreational activities. Environ. Res. 80 (2):148–57. doi:10.1006/enrs.1998.3891.
- Huang, M., W. Wang, C. Y. Chan, K. C. Cheung, Y. B. Man, X. Wang, and M. H. Wong. 2014. Contamination and risk assessment (based on bioaccessibility via ingestion and inhalation) of metal (loid) s in outdoor and indoor particles from urban centers of Guangzhou, China. Sci. Total Environ. 479:117–24. doi:10.1016/j.scitotenv.2014.01.115.
- Hunt, A., D. L. Johnson, J. M. Watt, and I. Thornton. 1992. Characterizing the sources of particulate lead in house dust by automated scanning electron microscopy. Environ. Sci. Technol. 26 (8):1513–23. doi:10.1021/es00032a003.
- ICMR. 2009. Nutrient requirements and recommended dietary allowances for Indians. A Report of the Expert Group of the Indian Council of Medical Research. National Institute of Nutrition, Hyderabad, India.
- Jianhua, Q. I., L. Xianguo, F. Lijuan, and Z. Manping. 2006. Characterization of dust and non-dust aerosols with SEM/EDX. J. Ocean Univ. China 5 (1):85. doi:10.1007/BF02919381.
- Kang, Y., H. S. Wang, K. C. Cheung, and M. H. Wong. 2011. Polybrominated diphenyl ethers (PBDEs) in indoor dust and human hair. Atmos. Environ. 45 (14):2386–93. doi:10.1016/j.atmosenv.2011.02.019.
- Kelepertzis, E., A. Argyraki, F. Botsou, E. Aidona, Á. Szabó, and C. Szabó. 2019. Tracking the occurrence of anthropogenic magnetic particles and potentially toxic elements (PTEs) in house dust using magnetic and geochemical analyses. Environ. Pollut. 245:909–20. doi:10.1016/j.envpol.2018.11.072.
- Khadilkar, V. V., A. V. Khadilkar, P. Choudhury, K. N. Agarwal, D. Ugra, and N. K. Shah. 2007. IAP growth monitoring guidelines for children from birth to 18 years. Indian Pediatr. 44 (3):187–97.
- Kissel, J. C., K. Y. Richter, and R. A. Fenske. 1996. Field measurement of dermal soil loading attributable to various activities: Implications for exposure assessment. Risk Anal. 16 (1):115–25.
- Kolluru, S. S. R., A. K. Patra, and P. Kumar. 2019. Determinants of commuter exposure to PM2. 5 and CO during long-haul journeys on national highways in India. Atmos. Pollut. Res. 10:1031–41. doi:10.1016/j.apr.2019.01.012.
- Kumar, A., and C. C. Scott. 2009. Lead loadings in household dust in Delhi, India. Indoor Air 19 (5):414–20. doi:10.1111/j.1600-0668.2009.00605.x.
- Kurt-Karakus, P. B. 2012. Determination of heavy metals in indoor dust from Istanbul, Turkey: Estimation of the health risk. Environ. Int. 50:47–55. doi:10.1016/j.envint.2012.09.011.
- Lee, P. K., S. Yu, H. J. Chang, H. Y. Cho, M. J. Kang, and B. G. Chae. 2016. Lead chromate detected as a source of atmospheric Pb and Cr (VI) pollution. Sci. Rep. 6:36088. doi:10.1038/srep36088.
- Li, Y., Y. Yu, Z. Yang, Z. Shen, X. Wang, and Y. Cai. 2016. A comparison of metal distribution in surface dust and soil among super city, town, and rural area. Environ. Sci. Pollut. Res. 23 (8):7849–60. doi:10.1007/s11356-015-5911-7.
- Lim, S. S., T. Vos, A. D. Flaxman, G. Danaei, K. Shibuya, H. Adair-Rohani, … M. Aryee. 2012. A comparative risk assessment of burden of disease and injury attributable to 67 risk factors and risk factor clusters in 21 regions, 1990–2010: A systematic analysis for the global burden of disease study 2010. lancet 380 (9859):2224–60. doi:10.1016/S0140-6736(12)61766-8.
- Lin, Y., F. Fang, F. Wang, and M. Xu. 2015. Pollution distribution and health risk assessment of heavy metals in indoor dust in Anhui rural, China. Environ. Monit. Assess. 187 (9):565. doi:10.1007/s10661-015-4763-4.
- Lioy, P. J., and M. Gochfeld. 2002. Lessons learned on environmental, occupational, and residential exposures from the attack on the World Trade Center. Am. J. Ind. Med. 42 (6):560–65. doi:10.1002/ajim.10160.
- Liu, E., T. Yan, G. Birch, and Y. Zhu. 2014. Pollution and health risk of potentially toxic metals in urban road dust in Nanjing, a mega-city of China. Sci. Total Environ. 476:522–31. doi:10.1016/j.scitotenv.2014.01.055.
- Lu, X., X. Zhang, L. Y. Li, and H. Chen. 2014. Assessment of metals pollution and health risk in dust from nursery schools in Xi’an, China. Environ. Res. 128:27–34. doi:10.1016/j.envres.2013.11.007.
- Madany, I. M., M. Salim Akhter, and O. A. Al Jowder. 1994. The correlations between heavy metals in residential indoor dust and outdoor street dust in Bahrain. Environ. Int. 20 (4):483–492.
- Masto, R. E., J. George, T. K. Rout, and L. C. Ram. 2017. Multi element exposure risk from soil and dust in a coal industrial area. J. Geochem. Explor. 176:100–07. doi:10.1016/j.gexplo.2015.12.009.
- OSWER, 2001 andUSEPA. 2001. Supplemental guidance for developing soil screening levels for superfund sites. Peer Rev. Draft 9355:4–24.
- Pachauri, T., V. Singla, A. Satsangi, A. Lakhani, and K. M. Kumari. 2013. SEM-EDX characterization of individual coarse particles in Agra, India. Aerosol Air Qual. Res. 13 (2):523–36. doi:10.4209/aaqr.2012.04.0095.
- Pathak, A. K., S. Yadav, P. Kumar, and R. Kumar. 2013. Source apportionment and spatial–Temporal variations in the metal content of surface dust collected from an industrial area adjoining Delhi, India. Sci. Total Environ. 443:662–72. doi:10.1016/j.scitotenv.2012.11.030.
- Purushotham, D., M. A. Lone, M. Rashid, A. N. Rao, and S. Ahmed. 2012. Deciphering heavy metal contamination zones in soils of a granitic terrain of southern India using factor analysis and GIS. J. Earth Syst. Sci. 121 (4):1059–70. doi:10.1007/s12040-012-0209-3.
- Rasmussen, P. E., K. S. Subramanian, and B. J. Jessiman. 2001. A multi-element profile of house dust in relation to exterior dust and soils in the city of Ottawa, Canada. Sci. Total Environ. 267 (1–3):125–40. doi:10.1016/s0048-9697(00)00775-0.
- Rasmussen, P. E., S. Beauchemin, M. Chénier, C. Levesque, L. C. MacLean, L. Marro, … H. D. Gardner. 2011. Canadian house dust study: Lead bioaccessibility and speciation. Environ. Sci. Technol. 45 (11):4959–65. doi:10.1021/es104056m.
- Salam, A., M. Hasan, B. A. Begum, M. Begum, and S. K. Biswas. 2013. Chemical characterization of biomass burning deposits from cooking stoves in Bangladesh. Biomass Bioenergy 52:122–30. doi:10.1016/j.biombioe.2013.03.010.
- Samiksha, S., R. S. Raman, J. Nirmalkar, S. Kumar, and R. Sirvaiya. 2017. PM10 and PM2.5 chemical source profiles with optical attenuation and health risk indicators of paved and unpaved road dust in Bhopal, India. Environ. Pollut. 222:477–85. doi:10.1016/j.envpol.2016.11.067.
- Taylor, S. R. 1964. Abundance of chemical elements in the continental crust: A new table. Geochim. Cosmochim. Acta 28 (8):1273–85. doi:10.1016/0016-7037(64)90129-2.
- Taylor, S. R., and S. M. McLennan. 1995. The geochemical evolution of the continental crust. Rev. Geophys. 33 (2):241–65. doi:10.1029/95RG00262.
- Turner, A., and L. Simmonds. 2006. Elemental concentrations and metal bioaccessibility in UK household dust. Sci. Total Environ. 371 (1–3):74–81. doi:10.1016/j.scitotenv.2006.08.011.
- USEPA. 1989. U.S. Environmental Protection Agency. Interim procedures for estimating risks associated with exposures to mixtures of chlorinated dibenzo-p-dioxins and dibenzofurans (CDDs and CDFs) and 1989 update. EPA/625/3-89/016. U.S. Environmental Protection Agency, Washington, DC.
- USEPA. 1996. Soil screening guidance technical background document, office of solid waste and emergency response. EPA/540/R-95/128.
- USEPA. 2011. Exposure Factors Handbook 2011 Edition (Final). U.S. Environmental Protection Agency, Washington, DC.
- Wang, W., M. J. Huang, Y. Kang, H. S. Wang, A. O. Leung, K. C. Cheung, and M. H. Wong. 2011. Polycyclic aromatic hydrocarbons (PAHs) in urban surface dust of Guangzhou, China: Status, sources and human health risk assessment. Sci. Total Environ. 409 (21):4519–27. doi:10.1016/j.scitotenv.2011.07.030.
- World Health Organization. 2007. Indoor air pollution: national burden of disease estimates.
- Yang, Y., L. Liu, Y. Xiong, G. Zhang, H. Wen, J. Lei, … Y. Lyu. 2016. A comparative study on physicochemical characteristics of household dust from a metropolitan city and a remote village in China. Atmos. Pollut. Res. 7 (6):1090–100. doi:10.1016/j.apr.2016.06.009.
- Yongming, H., D. Peixuan, C. Junji, and E. S. Posmentier. 2006. Multivariate analysis of heavy metal contamination in urban dusts of Xi'an, Central China. Sci. Total Environ. 355 (1–3):176–186.
- Yoshinaga, J., K. Yamasaki, A. Yonemura, Y. Ishibashi, T. Kaido, K. Mizuno, … A. Tanaka. 2014. Lead and other elements in house dust of Japanese residences–Source of lead and health risks due to metal exposure. Environ. Pollut. 189:223–28. doi:10.1016/j.envpol.2014.03.003.
- Yu, B., Y. Wang, and Q. Zhou. 2014. Human health risk assessment based on toxicity characteristic leaching procedure and simple bioaccessibility extraction test of toxic metals in urban street dust of Tianjin, China. PLoS ONE 9 (3):92459. doi:10.1371/journal.pone.0106369.
- Zhang, Q., Z. Shen, J. Cao, K. Ho, R. Zhang, Z. Bie, … S. Liu. 2014. Chemical profiles of urban fugitive dust over Xi’an in the south margin of the Loess Plateau, China. Atmos. Pollut. Res. 5 (3):421–30. doi:10.5094/APR.2014.049.
- Zheng, N., J. Liu, Q. Wang, and Z. Liang. 2010. Health risk assessment of heavy metal exposure to street dust in the zinc smelting district, Northeast of China. Sci. Total Environ. 408 (4):726–33. doi:10.1016/j.scitotenv.2009.10.075.
- Zhu, Z., G. Sun, X. Bi, Z. Li, and G. Yu. 2013. Identification of trace metal pollution in urban dust from kindergartens using magnetic, geochemical and lead isotopic analyses. Atmos. Environ. 77:9–15. doi:10.1016/j.atmosenv.2013.04.053.