
 ?Mathematical formulae have been encoded as MathML and are displayed in this HTML version using MathJax in order to improve their display. Uncheck the box to turn MathJax off. This feature requires Javascript. Click on a formula to zoom.
ABSTRACT
To investigate the effect of atmospheric particulates on the chemistry and acidity of rainwater during the washout process in areas with highly acidic rainfall, rainwater and particulates (before, during and after rain) were sampled and analyzed from June 2008 to June 2009 in the Yangtze River Delta region, China. The volume-weighted mean pH of the rainwater was only 4.44 in Hangzhou, and the average concentrations of TSP (total-suspended particulates) and PM10 (particulates with aerodynamic equivalent diameters of less than 10 μm) during the study period were 191 μg/m3 and 155 μg/m3, respectively. The measured acid buffering capacities of PM10 and TSP were 1.31 ± 0.45 and 1.61 ± 0.84 ml/mg, on average, respectively, indicating that both had a certain acid buffering capacity. Rain appeared to have a pronounced scouring effect on particulates, except for F− and Cl− in PM10. Upon combining the correlation analysis between ions in particulates and rainwater with Enrichment Factor and Principal Component Analysis of the rainwater chemistry, the results suggested that the components of rainwater were mainly derived from washout processes acting on particulates from crustal dust and building industry sources (Ca2+), marine sources (Na+, K+ (in spring), Mg2+ and Cl−) and anthropogenic sources, especially secondary aerosols emitted from agricultural land, motor vehicles and industrial plants (NO3−, SO42-, and NH4+). The F− in rainwater was mainly contributed by gaseous pollutants, such as HF from cooling systems, coal burning and surrounding factories.
Implications: The interaction between particulates and rain in areas with highly acidic rainfall include the following: rain appears to have a pronounced scouring effect on most components in the particulates; the components of the rainwater are mainly derived from washout processes acting on PM contributed by crustal dust, sea salt and secondary aerosol subcloud; and the acid buffering capacities of PM10 and TSP in Hangzhou are 1.31 ± 0.45 and 1.61 ± 0.84 ml/mg, respectively, and had a certain acid buffering capacity toward rainwater.
Introduction
Air pollution in China is very complex because of the large amounts of gaseous and particulate emissions. Acid rain, ozone and particulate (hereafter referred to as PM) pollutions coexist in some regions, especially in South China (http://www.mee.gov.cn/hjzl/zghjzkgb/lnzghjzkgb/). PM is commonly from motor vehicle exhaust, industrial emissions, coal burning, and dust, as well as from secondary pollution (Liu et al. Citation2017; Shi et al. Citation2014; Tian et al. Citation2016), and can be removed by wet and dry deposition (Duhanyan and Roustan Citation2011; Zhang et al. Citation2018). Acid rain is mainly caused by acidic gases, such as SO2 and NOX, which are mostly contributed by anthropogenic sources including the burning of fossil fuels and industrial chemical processes (Likens and Bormann Citation1974; Mihajlidi-Zelić et al. Citation2006; Wang et al. Citation1993; Zhang et al. Citation2012a). The chemical characteristics of dry and wet depositions can provide important information on atmospheric pollution sources and help to control air pollution. However, the area with highly acidic rainfall in China does not completely overlap with areas containing high concentration of SO42- and NO3−. According to the 1990–1992 statistics of 27 major cities (11 in the north and 16 in the south, with most of the cities being provincial capitals), it has been found that the sum of the SO42- and NO3− annual concentrations in rainwater in the nonacid rain region in northern China was 241.5 μeq/L (ranging from 12.5 to 639.2 μeq/L), but in rainwater in the acid rain region in southern China, that concentration was 145.1 μeq/L (ranging from 53.6 to 433.1 μeq/L); The sum of the Ca2+, Mg2+ and NH4+ annual concentrations in the northern nonacid rain region was 575.6 μeq/L (ranging from 64.1 to 799.7 μeq/L), but in the southern acid rain region, it was 198.8 μeq/L (ranging from 55.7 to 436.4 μeq/L) (Wang et al. Citation1993). The situation has not changed much in the last decade or so, as the sum of the SO42- and NO3− annual concentrations in rainwater of the nonacid rain region in northern China was 258.1 μeq/L (ranging from 132.1 to 399.6 μeq/L) and the sum of the Ca2+, Mg2+ and NH4+ annual concentrations was 646.9 μeq/L (ranging from 512.5 to 989.7 μeq/L) (Wang et al. Citation2019; Xu et al. Citation2009; Zhang et al. Citation2003), but in rainwater of the acid rain region in southern China, those concentrations were 260.1 μeq/L (ranging from 140.5 to 352.6 μeq/L) and 306.0 μeq/L (ranging from 140.0 to 447.5 μeq/L) (Han and Liu Citation2006; Huang et al. Citation2008; Tu et al. Citation2005; Wang and Han Citation2011; Zhang et al. Citation2007). The main reason for the absence of regional acid rain pollution in the northern region of China is that the atmospheric particulate matter in the northern region is highly alkaline, which neutralizes the acidity of rainwater and reduces the incidence of acid rain in northern cities (Wang et al. Citation2009).
The formation processes of acid rain include the rainout process in clouds and the washout processes acting on gases and PM subcloud (Zhang et al. Citation2018). Rain is an effective way to remove aerosol from the atmosphere (Tang et al. Citation2005; Zhang et al. Citation2007), and accordingly, atmospheric aerosol also has a great influence on the composition and acidity of rainwater (Huo et al. Citation2012). The chemical compositions of cloud water and rainwater have been compared within southwestern China, such as Chongqing City and Guizhou Province in China, which experienced severe acid rain pollution in the 1980s and 1990s (Huang et al. Citation1995; Lei et al. Citation1997, Citation2001). It was found that washout processes neutralized a large proportion of rainwater acidity through the scavenging effect on alkaline PM subcloud (Wang et al. Citation2009). The chemical constituents of PM in China have changed a lot during the last 10 years, as sulfate and nitrate are the major components in both northern and southern China, with less alkali material now (Liu et al. Citation2019; Meng et al. Citation2019). The decrease of the particulate concentration and changes in its chemical constituents are very likely to be accompanied by the emergence of another potential environmental problem: acid rain pollution in northern China will gradually become more prominent (Liu et al. Citation2019), which is a problem that has to be taken seriously (http://www.mee.gov.cn/hjzl/zghjzkgb/lnzghjzkgb/).
In this study, our attention was focused on the subcloud scavenging process and its influence on PM and rain. Some studies, such as those by Huo et al. (Citation2012), Ren et al. (Citation2011) and Singh, Elumalai, and Pal (Citation2016), have focused on the acid buffering capacity of PM, defining the acid buffering capacity of PM according to the amount of acid or alkali added into a PM solution before the pH value reached 5.60. In this study, a similar calculation method for the acid buffering capacity was used.
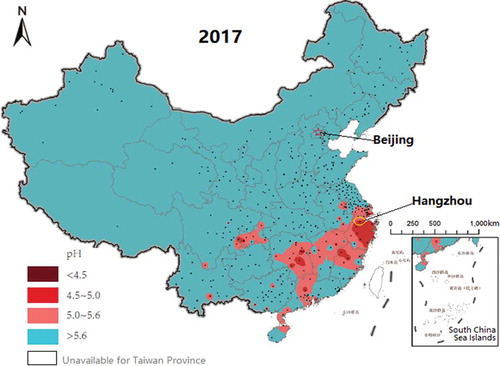
Hangzhou has been included in acid rain-control areas by China’s Ministry of Ecology and Environment (MEE) due to the low pH value (annual average of 4.4) of rainwater and the high acid rain rate (80%), which was calculated by the ratio between acid rain events with a pH lower than 5.6 and the total rain events (Li and Liang Citation2011). In the most recent 5 years, Hangzhou has still been impacted by acid rain events and is where the most serious acid rain has been found (). The aims of this study are: (1) to explore the scavenging effects of rain on PM subcloud; (2) to provide basic information for use in controlling PM and acid rain pollution; and (3) to provide data and theoretical support for constructing the Acid Wet Deposition Predicting and Forecasting (AWDPF) system. As China increases its efforts to control particulate pollution, the acid rain problem will probably be aggravated in some areas, which is an effect that needs to be considered at the same time. This AWDPF system is important for both acid rain areas, such as Hangzhou, and nonacid rain areas, such as North China.
Figure 1. The annual average pH distribution of precipitation in China in 2017.
Experimental methods
Study area
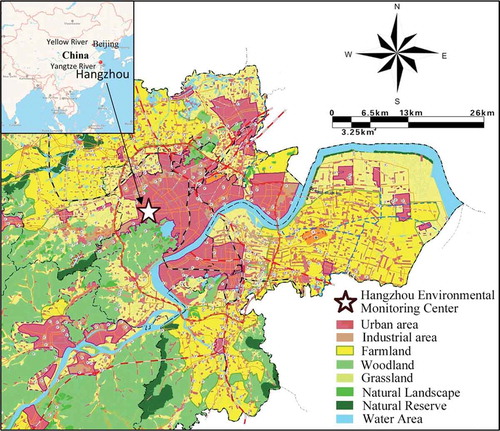
The Yangtze River Delta region is one of the most developed areas in China and includes Shanghai, Jiangsu and Zhejiang, which are also important intersections of the “One Belt And One Road” and Yangtze River economic belt. Hangzhou, the capital city of Zhejiang Province in China, is located on the west side of Hangzhou Bay near the East China Sea and is very close to Shanghai (), with a total area of 16,600 km2 (Yue, Liu, and Fan Citation2013), of which approximately 48.2% is urban area. It is a metropolitan city with 9,188,000 inhabitants, of which ~80% are urban residents, while ~20% are rural residents, and the urban population is growing rapidly (http://www.hzstats.gov.cn/tjnj/nj2017/index.htm, 2017). Hangzhou has a subtropical, monsoonal climate with four distinct seasons, characterized by a hot, humid summer (June–August) and a cold, wet winter (December–February) (Li and Liang Citation2011). The annual average temperature, rainfall and relative humidity are 17.5°C, 1454 mm and 70.3%, respectively (Xu et al. Citation2011). Hangzhou is a typical tourism city, and series of international conferences and activities have been conducted here. Although the air quality is above that in middle China, acid rain has been an environmental problem in the area for many years, together with PM and ozone pollution (), even though precursors such as SO2 have recently decreased (http://www.mee.gov.cn/hjzl/zghjzkgb/lnzghjzkgb/). Generally, with conditions similar to those in many contiguous areas at mid-low latitudes, Hangzhou can represent the characteristics of the Yangtze River Delta urban agglomeration, so this study can provide a good reference for these areas in the control of air pollution.
Figure 2. Map of the study area and sampling site.
Rainwater sampling
The sampling site is shown in , and it is located in the urban area of Hangzhou and influenced by high levels of human activity. Two power plants lie to the north (12 km) and south (20 km) of the sampling site, respectively. Agricultural land is mainly located in the east, southeast and northwest of the sampling site. Typical industrial areas are located in the north (characterized by steelworks, cement plants, chemical industry, etc.), west (characterized by plastic plants, pharmaceutical factories, shipyards, machinery works, etc.), southeast (characterized by textile mills, printing and dyeing mills, chemical fiber factories, etc.), and east (characterized by building materials and paint factories, among others), respectively. The East China Sea is approximately 130 km away from the sampling site. The sampling campaign was carried out from June 2008 to June 2009 on the roof of a building at the Hangzhou Environmental Monitoring Center (30°16′N, 120°08′E), which is approximately 4 m up from the ground level, and this location conforms to the specifications for rain monitoring (Allan Citation2004). An automatic rainwater sampler equipped with a polyethylene bucket (SZG-Ш, China) was set at the height of 1.5 m above the roof, and at least two more polyethylene buckets (with a diameter and height of 20 cm) were prepared at the sampling site. The sampling buckets and rainwater containers were cleaned using diluted HCl (10%) first, washed with deionized water until the Cl− in the waste water was at the same concentration as that of the deionized water, and then dried before using. Rainwater sampling started when rain occurred and ended when rain stopped, and the plastic cover of the rainwater sampler was removed immediately after the first raindrops to prevent contamination from dry deposition. If several rain events happened in 1 day, the rainwater from 8:00 a.m. on that day until 8:00 a.m. on the next day were merged into one sample, and each 24-h rainwater sample was treated individually. A rain gauge was used to calculate the rain amount, and 101 rainwater samples were collected in total. The electric conductivity (EC) of the rainwater samples was measured with a conductivity meter (DDS-307, Leici Corp., Shanghai, China) which has a measurement range of 0 ~ 105 μS/cm. A pH meter (Mettler Toledo Delta 320) with a flow-type combination electrode was used for pH measurements, and two standard buffer solutions at pH 4.01 and 6.86 were used for pH calibration before the measurement. The sampled rainwater was filtered through a 0.45-μm millipore membrane filter to remove insoluble substances and then shifted to polyethylene bottles for storage in a 4°C refrigerator after in situ conductivity and pH measurements.
Air particulate sampling
Four particulate middle-flow impact samplers (Wuhan Tianhong Intelligent Instruments, Inc. China, TH-150C, flow rate: 100 L/min) were employed for TSP and PM10 sampling on the same building roof of the rainwater sampling site, with two used for the TSP and two used for the PM10. PM sampling each day occurred over 23 h from 8:00 a.m. to 7 a.m. of the next day. The TSP and PM10 were collected on both pre-weighed polypropylene fiber and quartz fiber filter membranes. The membranes were weighed using an analytical balance with a reading precision of 1 μg after stabilization under constant temperature (20 ± 5°C) and humidity (40 ± 2%) for 48 h. A total of 148 PM samples including 74 TSP samples and 74 PM10 samples were collected, among which 45 TSP and 50 PM10 samples were characterized before, during, and after the rain events. The reason for only part of the precipitation events having PM samples that covered the three stages (before, during & after each rain event) was that PM sampling was manually operated, while rainwater was automatically sampled. On some days, the start time of PM sampling was missed for some rain events, so PM samples were absent during these rain events. Each rainy day was treated individually, and the “PM samples during rain” were those sampled from 8:00 a.m. of each rainy day to 7:00 a.m. of the next day, while the PM samples collected on the day before each rainy day were “before rain samples”, regardless of whether it rained during in the day before each rainy day. The same was true for the “after rain samples”, as long as the samples were collected on the day after a rainy day. The following is an example illustrating the timing of samples before, during and after rain events: for the rain event that happened on Mar. 3, 2009, “before” includes PM samples collected on Mar. 2, 2009; “during” includes PM samples collected on Mar. 3, 2009; and “after” includes PM samples collected on Mar. 4, 2009. All PM samples were stored in a 4°C refrigerator after the weighing procedure.
Methods for chemical analysis
Among the 101 rainwater samples, only 34 were analyzed for chemical compositions, and the remaining samples were used for measuring only the pH and conductivity, of which 31 contained monitored PM samples that covered all or part of the three periods (before, during and after rain). Four anions (SO42-, NO3−, F−, Cl−) and five cations (NH4+, K+, Ca2+, Na+, Mg2+) in rainwater and PM samples were quantitatively analyzed using ion chromatography (Dionex-120, USA). The ion chromatograph was calibrated with standard reagents that covered five concentration gradients for each ion, and this calibration procedure was conducted each week to guarantee the accuracy of the measurements. For the PM samples, one-eighth of the polypropylene membrane was cut off and used for water-soluble ions analysis.
The acid buffering capacity was calculated using the following formula (Huo et al. Citation2012; Ren et al. Citation2011):
where A is the acid buffering capacity expressed in ml/mg, for which positive value (Ai) represents the volume of HCl acid standard solution (10−4 N, pH = 4.0) that the PM could neutralize to 7.00 per milligram PM, while a negative value (-Aj) represents the volume of HCl acid standard solution that has the same acidity per milligram PM. The standard HCl acid solution was used as the titrant in the first case (in equations (1) and (2)), and the standard NaOH alkaline solution (10−4 N, pH = 10.0) was used as the titrant in the second case (in Equations (3) and (4)). Each intersecting PM sample (one-fourth of the whole PM sample was used in the measurement of the PM acid buffering capacity) was dissolved in 10 ml ultrapure water and filtered through a 0.45-μm millipore membrane filter. In the first case, pH0 = 4.0 represents the initial pH of the HCl acid solution and pH1 represents the final pH of the mixed solution after the HCl acid solution was reacted with the PM solution. mi is the PM mass in 10 ml PM solution. R0 = 10−4 mol/L, representing the H+ (HCl) ion concentration of the titrant. In the second case, pOH0 = 4.0 (pH0 = 10.0) represents the initial pOH of the NaOH alkaline solution and pOH1 represents the final pOH of the mixed solution after the NaOH alkaline solution was reacted with the PM solution. mj is the PM mass in 10 ml PM solution. R0 = 10−4 mol/L, representing the OH− (NaOH) ion concentration of the titrant. V0 is the volume of the titrant (standard HCl acid or NaOH alkaline solution) used in each case, and V1 is the final volume of the mixed solution when the titration was performed.
Enrichment factor (EF) calculation
The enrichment factor (EF) is typically used to identify the origins of chemical components in rainwater, and in the present study, Na+ was used as the reference element for marine sources. The EF of an ion in rainwater relative to the ion in seawater (EFseawater) was calculated according to the following equation (Wang et al. Citation2019):
where X is the ionic concentration of interest (X/Na+)rainwater is the ratio of the rainwater composition, and (X/Na+)seawater represents the ratio of the seawater composition.
Results and disscussion
Acidity and ionic composition of rainwater
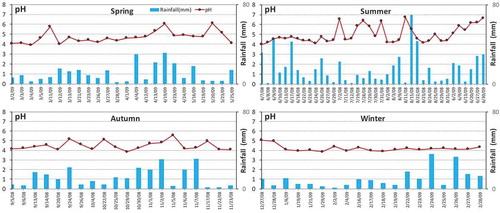
The seasonal variations of the pH, EC and major ions are displayed in . First, the balance between the cations and anions was assessed according to the ratio of ∑C/∑A, which was within the range of 1 ± 0.25 (Keene et al. Citation1986) in this study, indicating that the data quality was acceptable. The rainfall amount throughout the year was 1199.3 mm, which was comparable to the perennial average annual rainfall (1454 mm) and showed that most of the rain had been captured. The highest amount occurred in summer (493.2 mm), which was almost 2.5 times that in winter (202.1 mm) and 2 times that in spring (258.4 mm) and autumn (245.6 mm). The higher the ion concentration, the higher was the conductivity. A large-scale rain of drizzle type can scavenge more aerosol than can localized heavy rain, and this can be attested by the volume-weighted mean EC values in . A higher EC was found in winter rainwater than in rainwater during the other three seasons, and the EC and ∑C, ∑A of summer rainfall were the lowest. Because of the weak convection of air masses during winter, most of the pollution was trapped in the lower boundary layer, unlike in summer, causing the slow removal of large concentrations of trapped pollution in the boundary layer with no dilution effect compared to that in summertime, which finally resulted in relatively higher ion concentrations in winter, as reflected by the EC (Zhang et al. Citation2007). Here, the inconsistency between the total ion concentrations and EC values among seasons in was because not all the rainwater samples were analyzed for chemical compositions. The pH values of rain during the study period ranged from 3.85 to 6.73, with a volume-weighted mean (VWM) of 4.44, which was a bit lower than the pH observed (4.50) by Xu et al. (Citation2011) in Hangzhou. The pH value order was summer > spring > autumn > winter, indicating that the acid rain status was the most severe during the winter time, and the possible reason for this result was the higher acid gas concentrations during this season (Tang et al. Citation2005; Wang et al. Citation1993). As shown in , the pH values of rainwater were relatively lower and fluctuated a lot during summer but were more stable in winter than during the other three seasons. It was also found that there was a longer period of duration of rain during winter, which was possibly because the type of rain was more likely to be from non-convective stratiform rain covering large areas (such as the entire city or province) during this season, and this was opposite to the short periods of thunderstorms and locally heavy rain in summertime. In addition to the different rain patterns among the seasons, the land surface became wet when it rained and less soil dust went into the air, but the anthropogenic emissions of acid gases such as SO2 and NOX were not influenced. As mentioned above, the accumulation of high levels of pollution, especially acid gases, along with slow drizzle over longer periods can lead to lower pH values during winter in Hangzhou. Approximately 87.1% of the rain had a pH value of less than 5.60%, and 52.5% has a value of less than 4.50. The EC of rainwater ranged from 10.0 to 235.0 μS/cm, with a VWM value of 43.1 μS/cm. The EC was approximately 2.1 times that measured in Jinhua City (20.3 μS/cm) near Hangzhou (Zhang et al. Citation2007, Citation2012b), indicating that the air pollution in Hangzhou was more serious than that in Jinhua.
Table 1. Seasonal variation of rainwater chemistry in Hangzhou.
Figure 3. Seasonal variation of rainwater pH and rainfall in Hangzhou from June 2008 to June 2009.
NH4+ and SO42- were the most important cation and anion in rainwater, respectively. Ca2+ and NO3− had comparatively equivalent concentrations as the second-most important cation and anion. Unlike the average concentrations of water-soluble ions in rain in China overall, rainfall in Hangzhou was more abundant in NH4+ and SO42- instead of Ca2+ and SO42- (http://www.mee.gov.cn/hjzl/zghjzkgb/lnzghjzkgb/), which will lead to more acidic rain. The highest ion concentration occurred in spring, which may have been caused by transported dust from northern and northwestern China (Kang, Zhang, and Liu Citation2002), while the lowest ion equivalent concentration in summer time was due to a large amount of rainfall (Zhang et al. Citation2007).
Scouring effect of rain on particulates
The scouring effect on particulates exerted by rain was investigated by analyzing the variation of the PM (including the concentration, chemical compositions, and acid buffering capacity) during the three periods associated with rain events (before, during, and after rain).
Concentration variation of particulates
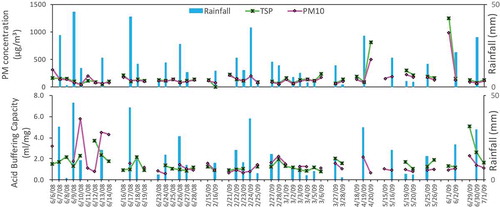
A total of 31 rain events was chosen to analyze the interaction between rain and particulate matter based on whether PM samples were available for the three defined periods. If the PM samples met one of these three groups – “before-during”, “during-after”, and “before-during-after” – this rain event and the corresponding PM samples could be used to analyze the changes of the chemical composition of PM caused by rain. shows the variations of concentration and acid buffering capacity of PM10 and TSP during the three periods. When it did not rain on the day of a “before rain event”, precipitation would inevitably corresponded to a decrease of the particle concentration. However, when it rained on the day of a “before rain event”, changes in the particulate matter were less systematic. The effect of rainfall on the PM concentration was also important. It was not difficult to find that both the TSP and PM10 concentrations went down during most rain, especially during events with large amounts of rainfall. The decreasing rate of the TSP concentration ranged from 14.5% to 87.6%, and that of PM10 ranged from 5.3% to 86.6%, suggesting that wet deposition had a strong scavenging effect on PM (Blanco-Becerra et al., Citation2015; Duhanyan and Roustan Citation2011; González and Aristizábal Citation2012). In addition, the PM concentration before a rainy day was also important to the PM variation, and both PM10 and TSP showed the largest decreasing rate when the PM concentration was the highest on the day before a rainy day (June 1, 2009). The PM concentration increased again after the rain event. There was a good correlation between the PM10 and TSP, with a correlation coefficient of 0.98. The average concentrations of the TSP and PM10 were 191 μg/m3 and 155 μg/m3, respectively. Approximately 81.2% of the TSP was PM10, indicating that the washout of TSP by rain mainly affected PM10 (Zhang et al. Citation2018).
Figure 4. The variations of concentration and acid buffering capacity of PM10 and TSP during three stages.
Variation of chemical compositions of particulates
The differences among the chemical compositions of PM during the three stages indicated that rainwater appeared to have different scavenging effects on each ion ( and ), the percentage change in concentration of PM samples and their components was given in the supplementary file. Generally, the percentage change in concentration of PM10 and TSP were negative on average, that of most ions in TSP and in PM10 also were negative, except for F− and Cl− in PM10 were positive on average which was likely due to the scavenging effect of rain on PM were mainly on larger size and large quantities of ions (Figure S1, Roy et al. Citation2019; Xu et al. Citation2017), indicating the possible scavenging effect of rain on PM and the components. shows a seasonal comparison of the PM chemistry between rainy days and non-rainy days in the environmental receptor, giving the differences in ionic compositions of the TSP and PM10. PM10-R and TSP-R represent the PM on rainy days, and PM10-NR and TSP-NR represent the PM on non-rainy days.
Table 2. Seasonal average concentration of TSP and PM10 and the chemical data during non-rainy days (-NR) and rainy days (-R) (μg/m3).*.
Figure 5. Variations of chemical compositions in PM10.
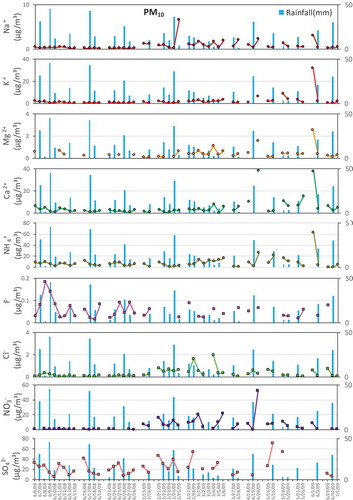
Figure 6. Variations of chemical compositions in TSP.
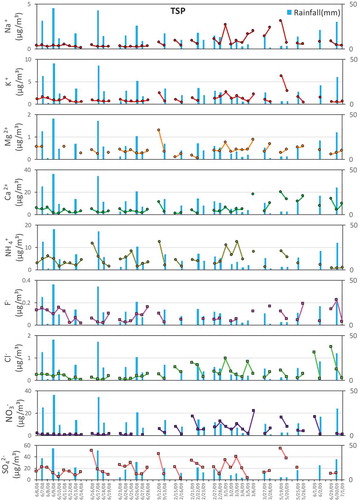
As shown in , the concentrations of the TSP and PM10 were generally higher on non-rainy days than on rainy days, and the seasonal dropping rates of the TSP and PM10 were 23.6–60.9% and 30.2–56.6%, respectively. The concentrations of SNA (sulfate, nitrate, and ammonium) and other cations on non-rainy days were generally higher than those on rainy days in both PM10 and TSP most of the time. Unlike SNA, the relative difference between the concentrations of F− and Cl− during rainy days and non-rainy days changed with the season.
Ca2+ and Mg2+ showed a similar tendency to that of the PM concentration in both TSP and PM10. The seasonal average dropping rates of Ca2+ were 37.2–73.0% and 39.2–71.6% in TSP and PM10, respectively, and those of Mg2+ were 10.3–54.8% and −9.0–63.9%. However, there were also several cases of increasing, especially when the amount of rainfall was relatively small. The concentrations of Ca2+ and Mg2+ during rainy days were mostly lower than those during the other two stages, and the concentrations continually decreased on consecutive rainy days most of the time. The concentrations of Ca2+ and Mg2+ on June 8th, 2008, and March 4th and 28th, 2009, increased compared to those on the preceding days, and this was because the amount of rainfall was relatively small during these 3 days. The similar variation trends of the Ca2+ and Mg2+ concentrations during the three stages indicated their similar physical characteristics (Gorham, Martin, and Litzau Citation1984; Likens and Bormann Citation1974).
The temporal variation of the other two major cations, Na+ and K+, in the particulates during the campaign were in accordance with the overall trend of Ca2+ and Mg2+ – their concentrations on rainy days were lower than those on non-rainy days except for K+ and Mg2+ in the TSP (). The seasonal average dropping rates of Na+ were 0.4–32.7% and 12.9–46.8% in the TSP and PM10. For K+, the rates were −20.5–73.4% and −9.7–71.8% in the TSP and PM10, indicating that rain showed a certain scouring effect on Na+ and K+ in PM. For NH4+, the ranges of the dropping rates were 8.3–74.4% and 16.3–73.3% in the TSP and PM10, respectively. The concentration of NH4+ in the TSP (5.9 ± 3.8 μg/m3) was lower than that in the PM10 (8.1 ± 3.5 μg/m3) on non-rainy days, and the same was true on rainy days, at 3.5 ± 1.7 μg/m3 in the TSP and 5.2 ± 2.0 μg/m3 in the PM10. Both results suggested that NH4+ was mostly enriched in the PM10. The possible reason for the lower amount of NH4+ in the TSP than in the PM10 is that reactions of NH4+ with other ions such as Cl− and NO3− produce volatile NH4Cl and NH4NO3, respectively, which can easily decompose into gaseous ammonia, especially under the climate conditions of the Yangtze River Delta region, with an annual average temperature approximately 20℃ and a relative humidity of approximately 70% (Harrison and Pio Citation1983; Querol et al. Citation2001; Wall, John, and Ondo Citation1988; Zhuang et al. Citation1999). Gaseous ammonia is more likely to react with SO2 and NOx to form SNA as secondary PM sources that mostly exist in smaller particulates (Liu et al. Citation2017; Shi et al. Citation2014; Tian et al. Citation2016). The scavenging effects exerted on NH4+ and SO42- by rain showed high consistency in both the TSP and PM10, and the scavenging effect on NO3− in PM10 also displayed high consistency with those on NH4+ and SO42-, which supported the secondary sources of SNA. The dropping rates of NO3− were 51.1–73.6% and −27.7–71.1% in the TSP and PM10, and those for SO42- were 13.0–64.0% and 11.6–59.5%, suggesting that rain also played an important role in the removal of these two anions (Tang et al. Citation2005).
Even through there were some occasions when the ion concentrations increased after a rain event, overall, the above results indicated the generally synchronized scavenging effect on PM chemical components exerted by rain.
Variation of the acid buffering capacity
The acid buffering capacity (A value) of PM decreased with rain occurrence because the alkaline components in the PM were washed out by rain (González and Aristizábal Citation2012). The average dropping rates of the A value for the TSP and PM10 were 30.6 ± 17.6% and 33.8 ± 16.0%, respectively. As shown in , during consecutive rain events, the A value fell gradually over time. The possible reason for this phenomenon was that the PM concentration decreased due to rain, especially affecting the alkaline components (Larssen and Carmichael Citation2000), as did its acid buffering capacity. The potential cause of the more significant scouring effect on alkaline than acidic components exerted by rain is their different size distributions. Alkaline components were found primarily in large particulates, and acidic components are typically present in smaller particulates (Blanco-Becerra et al., Citation2015; Barnard, Stensland, and Gatz Citation1986; Samara and Tsitouridou Citation2000; Zhang et al. Citation2018; Zheng et al. Citation1998). Generally, the PM10 and TSP showed good consistency in terms of the acid buffering capacity, with a correlation coefficient of 0.79 under the significance level of less than 0.001. However, there also existed particulates that exhibited the opposite behavior of the A value during rain events between the PM10 and TSP, despite the similar variations of their chemical compositions, and the reasons for this effect need to be further studied. The average acid buffering capacities of the PM10 and TSP were 1.31 ± 0.45 and 1.61 ± 0.84 ml/mg (consuming 131 ± 45 and 161 ± 84 nmol H+ per mg PM), respectively, indicating that the local atmospheric PM had certain an acid buffering capacity toward rain and that the TSP possessed a higher A value than did the PM10. The acid buffering capacity of airborne particulates at northern sites, such as Beijing, which has an acid buffering capacity of 552.22 nmolH+/mgPM, was much higher than that at southern sites, such as Wuyishan (−63.33 nmolH+/mgPM) (Ren et al. Citation2011). Hangzhou is located at an intermediate position between Beijing and Wuyishan and had a moderate acid buffering capacity.
Correlation of the chemical compositions of PM and rainwater
To investigate the effect of PM on the rainwater chemistry, correlation analysis of the chemical compositions (nine ions) of PM collected during rainy days with the ions in rainwater was conducted. It was hypothesized that a strong correlation between PM and rainwater chemistry represented a strong effect on rainwater exerted by PM. On the contrary, the impact was small. The correlation coefficient (R) of the chemical compositions between rainwater and the PM10 and TSP are listed in . The calculated results were statistically significant (p ≤ 0.01) at the 95% confidence level, except for NO3−.
Table 3. Correlation coefficient among soluble ions present in rainwater and PM in Hangzhou.
The Ca2+ in rainwater and PM was most strongly correlated, and the correlation coefficient of PM10 was greater than that of TSP, indicating that the PM10 during rainy day had a more significant effect on the Ca2+ in rainwater than did the TSP. Na+ also displayed a good correlation between rainwater and particulates, suggesting that a large portion of the Na+ in rainwater was from PM. The correlations of K+ and Mg2+ were relatively worse than those of Na+ and Ca2+. NH4+ also had weak correlations, as the NH4+ in rainwater was likely from other sources such as the absorption of NH3 by rain (Huo et al. Citation2012; Kumar, Yadav, and Kumar Citation2014). For anions, Cl− showed a good correlation, similar to that of Na+, which was perhaps due to sharing common marine sources (Tang et al. Citation2005) and having similar transport patterns in the atmosphere since the East China Sea is approximately 130 km away from the sampling site. In the TSP and PM10, F− always exhibited a negative correlation with the corresponding rainwater, indicating that F− in the rainwater might be from other sources, such as rainout processes in clouds, or gaseous pollutants, such as HF from coolants used in cooling systems, as well as from coal burning, aluminum refinery, and phosphate fertilizer factories. There were two power plants to the north (12 km) and south (20 km) of the sampling site, respectively. Typical industrial areas surrounded the sampling site, so the power plants and industrial factories were potential sources of F− in the rainwater in Hangzhou. NO3− showed a worse correlation between rainwater and particulates than did the other three anions, probably because it mostly came from gaseous pollutants, such as NOX (Tian et al. Citation2016). For SO42-, the correlation coefficient of the PM10 was greater than that of the TSP, suggesting that SO42- mainly originated from particulates emitted or formed during rainy days, especially small particulates, such as secondary sulfate, which contributed a larger ratio in the PM10 than in the TSP (Kavouras et al. Citation2013).
Sources of chemical components in rainwater
To further determine the sources of the chemical species in rainwater, the enrichment factors of ions in rainwater were calculated. shows the enrichment factors for the rainwater components relative to those of seawater.
Table 4. Enrichment factors for rainwater components relative to the seawater.
Generally, an EF value of near 1 represents that the main contribution was from a reference source; otherwise, the main contribution was related to other sources. The EF values of all ions were the lowest in spring. According to the meteorological data from the China Meteorological Administration, the predominant wind directions in Hangzhou during spring were east, and combined with the results of backward trajectory analysis of air masses during the study period (which can be found in the supplementary material), most time air masses would pass the marine area, so a large amount of sea salt was transported from the marine area together with water vapor. The annual average EF values of Mg2+ and Cl− were very close to 1, indicating that major sources of these two ions were sea salt. The EF values of Ca2+ and SO42- were approximately 100, suggesting that very little Ca2+ and SO42- came from sea salt. The EF value of K+ was also far greater than 1, except for during spring; therefore, the proportion of K+ from sea salt was very low most of the time.
At the same time, principle component analysis (PCA) was conducted using SPSS19.0. shows the varimax rotated principle component patterns of the rainwater compositions. Four PCs were extracted from the rain samples, which explained about 75% of the variance. The communalities for all species were higher than 0.65, indicating that the four identified factors were reasonable. Factor 1 had high loadings for K+, Na+, Ca2+, and Mg2+ and accounted for about 31% of the total variance. This factor was assumed to be associated with natural sources and the building industry, such as soil and road dust, cement plant emission and sea salt sources (Larssen and Carmichael Citation2000; Rodriguez et al. Citation2004). Factor 2 had high loadings for NO3−, SO42-, and NH4+ and accounted for about 20% of the total variance. This factor was assumed to be associated with secondary aerosol formation (Huo et al. Citation2012; Liu et al. Citation2017; Shi et al. Citation2014). The sampling site was surrounded by agricultural land and typical industrial plants, so factor 2 represented the SNA chemical components of rainwater, which were from NH3 (mainly emitted from agricultural land), SO2 or sulfate (emitted from power plants), NOX (emitted from motor vehicle emissions) and other industrial emissions. In factor 3, there was a high loading for H+, but other ions showed very low loadings, suggesting that the acidity of the rainwater was influenced by multiple sources (Wang et al. Citation2009). Factor 4 was likely associated with gaseous pollutants, such as HF and HCl, and accounted for about 12% of the total variance. Although it had been suggested that Cl− and Na+ were well correlated, the possible reason for Cl− and Na+ not being included in one factor in the PCA analysis results was that the Cl− in particulates is easily changed into gaseous forms, such as HCl, especially in South China, with its high temperatures, high humidity and strong radiation (Hsu et al. Citation2007). As mentioned before, the F− in rainwater was mainly from coolant used in cooling systems such as air conditioners and refrigerators and from coal burning, aluminum refinery, and phosphate fertilizer factories located in the surrounding environment.
Table 5. Principal component analysis of ionic compositions in Hangzhou rainwater from June 2008 to June 2009.
Conclusion
There were severe acid rain and PM pollution problems in the study area during the study period. The volume-weighted mean pH of rainwater was only 4.44, and the average concentrations of TSP and PM10 during the study period were 191 μg/m3 and 155 μg/m3, respectively. Both PM10 and TSP had certain acid buffering capacities, with A values of 1.31 ± 0.45 and 1.61 ± 0.84 ml/mg, respectively. As China increases its efforts to control particulate pollution, the acid rain problem will probably become aggravated in some areas, which needs to be considered at the same time.
The scavenging process of atmospheric particulate matter appeared to be conducive to the mitigation of acid rain pollution in areas in the Yangtze River Delta region, such as Hangzhou. Rain appeared to have a significant effect on the scavenging of particulate matter, especially on the scouring of alkaline constituents. The TSP changed concentration consistent with that of PM10, and both the mass and chemical composition (soluble ions) concentrations showed significant decreases during most rainy days, and a continuous decrease occurred when it continually rained for more than 1 day. When rain stopped, the particulate concentrations increased again. Overall, the acid buffering capacity of PM had a similar change to that of the PM concentration during the development of rain processes (three periods), as did ions. The scavenging effect on particulates exerted by rain had an important influence on the chemical compositions of rain, except for F−, and was the main source of multiple components in the rainwater. In spring, a large amount of sea salt was transported from the marine area together with water vapor, and sea salt was the major source of Mg2+ and Cl− in rainwater. Sea salt contributed very little Ca2+ and SO42-, and the proportion of K+ from sea salt was very low except during spring. The principle component analysis results suggested that the components of the rain mainly derived from washout processes acting on PM, such as crustal dust, building industry sources (Ca2+), marine sources (Na+, Mg2+, K+ (in spring) and Cl−) and anthropogenic sources, especially secondary aerosols emitted from agricultural land, motor vehicles and industrial plants (NO3−, SO42-, and NH4+). The F− in the rainwater was mainly from coolants used in cooling systems and from coal-burning and factories located in the surrounding environment. This study can provide data and theoretical support for the joint control of particulate matter and acid rain pollution in both acid rain and nonacid rain areas.
Supplemental Material
Download MS Word (1.3 MB)Disclosure statement
No potential conflict of interest was reported by the authors.
Supplementary material
Supplemental data for this article can be accessed on the publisher’s website.
Additional information
Funding
Notes on contributors
Yan Han
Yan Han and Hong Xu are Ph.D students of Nankai University, College of Environmental Science and Technology; The State Environment Protection Key Laboratory of Urban Particulate Air Pollution and Prevention in Tianjin, China.
Hong Xu
Yan Han and Hong Xu are Ph.D students of Nankai University, College of Environmental Science and Technology; The State Environment Protection Key Laboratory of Urban Particulate Air Pollution and Prevention in Tianjin, China.
Xiaohui Bi
Xiaohui Bi, Yufen Zhang, and Yinchang Feng are research professors of Nankai University, College of Environmental Science and Technology; The State Environment Protection Key Laboratory of Urban Particulate Air Pollution and Prevention, in Tianjin, China.
Fengmei Lin
Fengmei Lin and Li Jiao are employees of The Environmental Monitoring Center of Hangzhou in Zhejiang, China.
Li Jiao
Fengmei Lin and Li Jiao are employees of The Environmental Monitoring Center of Hangzhou in Zhejiang, China.
Yufen Zhang
Xiaohui Bi, Yufen Zhang, and Yinchang Feng are research professors of Nankai University, College of Environmental Science and Technology; The State Environment Protection Key Laboratory of Urban Particulate Air Pollution and Prevention, in Tianjin, China.
Yinchang Feng
Xiaohui Bi, Yufen Zhang, and Yinchang Feng are research professors of Nankai University, College of Environmental Science and Technology; The State Environment Protection Key Laboratory of Urban Particulate Air Pollution and Prevention, in Tianjin, China.
Related Research Data
References
- Allan, M. A. 2004. Manual for the GAW precipitation chemistry programme: Guidelines, data quality objectives and standard operating procedures, 183. Geneva, Switzerland: World Meteorological Organization.
- Barnard, W. R., G. J. Stensland, and D. F. Gatz. 1986. Alkaline materials flux from unpaved roads: Source strength, chemistry and potential for acid rain neutralization. Water Air Soil Poll. 30 (1–2):285–93. doi:10.1007/BF00305199.
- Blanco-Becerra, L. C., A. I. Gáfaro-Rojas, and N. Y. Rojas-Roa. 2015. Influence of precipitation scavenging on the PM2.5/PM10 ratio at the Kennedy locality of Bogotá, Colombia. Revista Facultad De Ingeniería 76:58–65. doi:10.17533/udea.redin.n76a07.
- Duhanyan, N., and Y. Roustan. 2011. Below-cloud scavenging by rain of atmospheric gases and particulates. Atmos. Environ. 45 (39):7201–17. doi:10.1016/j.atmosenv.2011.09.002.
- González, C. M., and B. H. Aristizábal. 2012. Acid rain and particulate matter dynamics in a mid-sized Andean city: The effect of rain intensity on ions scavenging. Atmos. Environ. 60:164–71. doi:10.1016/j.atmosenv.2012.05.054.
- Gorham, E., F. B. Martin, and J. T. Litzau. 1984. Acid rain: Ionic correlations in the eastern United States. Science 225 (4660):407–09. doi:10.1126/science.225.4660.407.
- Han, G. L., and C. Q. Liu. 2006. Strontium isotope and major ion chemistry of the rainwater from Guiyang, Guizhou province, China. Sci. Total Environ. 364:165–74. doi:10.1016/j.scitotenv.2005.06.025.
- Harrison, R. M., and C. Pio. 1983. Size-differentiated composition of inorganic atmospheric aerosols of both marine and polluted continental origin. Atmos. Environ. 17 (9):1733–38. doi:10.1016/0004-6981(83)90180-4.
- Hsu, S. C., S. C. Liu, S. J. Kao, W. L. Jeng, Y. T. Huang, C. M. Tseng, F. Tsai, J. Y. Tu, and Y. Yang. 2007. Water-soluble species in the marine aerosol from the northern South China Sea: High chloride depletion related to air pollution. J. Geophys. Res. 112 (D19304):1–11. doi:10.1029/2007jd008844.
- Huang, K., G. S. Zhuang, C. Xu, Y. Wang, and A. H. Tang. 2008. The chemistry of the severe acidic precipitation in Shanghai, China. Atmos. Res. 89:149–60. doi:10.1016/j.atmosres.2008.01.006.
- Huang, M. Y., Z. L. Shen, S. R. Liu, Y. X. Wu, H. Xiao, H. C. Lei, and C. H. Bai. 1995. Study on acid rain formation process of typical acid rain areas in Southwest China. Atmos. Sci. 19:359–66. (in Chinese).
- Huo, M. Q., Q. Sun, Y. H. Bai, J. L. Li, P. Xie, Z. R. Liu, and X. S. Wang. 2012. Influence of airborne particles on the acidity of rainwater during wash-out process. Atmos. Environ. 59:192–201. doi:10.1016/j.atmosenv.2012.05.035.
- Kang, X. F., J. H. Zhang, and H. H. Liu. 2002. Influences of sandy weather on city’s air quality in China: Scope and scale. Resour. Sci. 24 (4):1–4.
- Kavouras, I. G., M. Lianou, M. C. Chalbot, I. C. Vei, A. Kotronarou, G. Hoek, K. Hameri, and R. M. Harrison. 2013. Quantitative determination of regional contributions to fine and coarse particle mass in urban receptor sites. Environ. Pollut. 176:1–9. doi:10.1016/j.envpol.2013.01.004.
- Keene, W. C., A. A. P. Pszenny, J. N. Galloway, and M. E. Hawley. 1986. Sea-salt corrections and interpretation of constituent ratios in marine precipitation. J. Geophy. Res. 91 (D6):6647–58. doi:10.1029/JD091iD06p06647.
- Kumar, P., S. Yadav, and A. Kumar. 2014. Sources and processes governing rainwater chemistry in New Delhi, India. Nat. Hazards 74:2147–62. doi:10.1007/s11069-014-1295-0.
- Larssen, T., and G. R. Carmichael. 2000. Acid rain and acidification in China: The importance of base cation deposition. Environ. Pollut. 110 (1):89–102. doi:10.1016/S0269-7491(99)00279-1.
- Lei, H. C., P. A. Tanner, M. Y. Huang, Z. L. Shen, and Y. X. Wu. 1997. The acidification process under the cloud in southwest China: Observation results and simulation. Atmos. Environ. 31:851–61. doi:10.1016/S1352-2310(96)00247-6.
- Lei, H. C., Y. X. Wu, H. Xiao, and Z. L. Shen. 2001. Study on cloud-water and rainwater chemical characteristics under different weather system over China. Plateau Meteorol. 20:127–31. (in Chinese).
- Li, L., and Z. Y. Liang. 2011. The analysis of the characteristics of acid rain in Hangzhou. J. Qinghai Meteorol. 63:87–90. (in Chinese).
- Likens, G. E., and F. H. Bormann. 1974. Acid rain: A serious regional environmental problem. Science 184 (4142):1176–79. doi:10.1126/science.184.4142.1176.
- Liu, B. S., J. M. Yang, J. Yuan, J. Wang, Q. L. Dai, T. K. Li, X. H. Bi, Y. C. Feng, Z. M. Xiao, Y. F. Zhang, et al. 2017. Source apportionment of atmospheric pollutants based on the online data by using PMF and ME2 models at a megacity, China. Atmos. Res. 185:22–31. doi:10.1016/j.atmosres.2016.10.023.
- Liu, M. X., X. Huang, Y. Song, J. Tang, J. J. Cao, X. Y. Zhang, Q. Zhang, S. X. Wang, T. T. Xu, L. Kang, et al. 2019. Ammonia emission control in China would mitigate haze pollution and nitrogen deposition, but worsen acid rain. PNAS 116 (16):7760–65. doi:10.1073/pnas.1814880116.
- Meng, Y., Y. L. Zhao, R. Li, J. L. Li, L. L. Cui, L. D. Kong, and H. B. Fu. 2019. Characterization of inorganic ions in rainwater in the megacity of Shanghai: Spatiotemporal variations and source apportionment. Atmos. Res. 222:12–24. doi:10.1016/j.atmosres.2019.01.023.
- Mihajlidi-Zelić, A., I. Deršek-Timotić, D. Relić, A. Popović, and D. Đorđević. 2006. Contribution of marine and continental aerosols to the content of major ions in the precipitation of the central Mediterranean. Sci. Total Environ. 370 (2–3):441–51. doi:10.1016/j.scitotenv.2006.07.017.
- Querol, X., A. Alastuey, S. Rodriguez, F. Plana, E. Mantilla, and C. R. Ruiz. 2001. Monitoring of PM10 and PM2.5 around primary particulate anthropogenic emission sources. Atmos. Environ. 35 (5):845–58. doi:10.1016/S1352-2310(00)00387-3.
- Ren, L., W. Wang, Q. Y. Wang, X. Y. Yang, and D. G. Tang. 2011. Comparison and trend study on acidity and acidic buffering capacity of particulate matter in China. Atmos. Environ. 45 (39):7503–19. doi:10.1016/j.atmosenv.2010.08.055.
- Rodriguez, S., X. Querol, A. Alastuey, M. M. Viana, M. Alarcon, E. Mantilla, and C. R. Ruiz. 2004. Comparative PM10–PM2.5 source contribution study at rural, urban and industrial sites during PM episodes in Eastern Spain. Sci. Total Environ. 328 (1–3):95–113. doi:10.1016/s0048-9697(03)00411-x.
- Roy, A., A. Chatterjee, A. Ghosh, S. K. Das, S. K. Ghosh, and S. Raha. 2019. Below- cloud scavenging of size-segregated aerosols and its effect on rainwater acidity and nutrient deposition: A long-term (2009–2018) and real-time observation over eastern Himalaya. Sci. Total Environ. 674:223–33. doi:10.1016/j.scitotenv.2019.04.165.
- Samara, C., and R. Tsitouridou. 2000. Fine and coarse ionic aerosol components in relation to wet and dry deposition. Water Air Soil Poll. 120 (1–2):71–88. doi:10.1023/a:1005267021828.
- Shi, G. L., G. R. Liu, X. Peng, Y. N. Wang, Y. Z. Tian, W. Wang, and Y. C. Feng. 2014. A comparison of multiple combined models for source apportionment, including the PCA/MLR-CMB, Unmix-CMB and PMF-CMB models. Aerosol Air Qual. Res. 14 (7):2040–50. doi:10.4209/aaqr.2014.01.0024.
- Singh, S., S. P. Elumalai, and A. K. Pal. 2016. Rain pH estimation based on the particulate matter pollutants and wet deposition study. Sci. Total Environ. 563–564:293–301. doi:10.1016/j.scitotenv.2016.04.066.
- Tang, A. H., G. S. Zhuang, Y. Wang, H. Yuan, and Y. L. Sun. 2005. The chemistry of precipitation and its relation to aerosol in Beijing. Atmos. Environ. 39 (19):3397–406. doi:10.1016/j.atmosenv.2005.02.001.
- Tian, Y. Z., G. L. Shi, Y. Q. Huang-Fu, D. L. Song, J. Y. Liu, L. D. Zhou, and Y. C. Feng. 2016. Seasonal and regional variations of source contributions for PM10 and PM2.5 in urban environment. Sci. Total Environ. 557–558:697–704. doi:10.1016/j.scitotenv.2016.03.107.
- Tu, J., H. S. Wang, Z. F. Zhang, X. Jin, and W. Q. Li. 2005. Trends in chemical composition of precipitation in Nanjing, China, during 1992–2003. Atmos. Res. 73:283–98. doi:10.1016/j.atmosres.2004.11.002.
- Wall, S. M., W. John, and J. L. Ondo. 1988. Measurement of aerosol size distribution for nitrate and major ionic species. Atmos. Environ. 22 (8):1649–56. doi:10.1016/0004-6981(88)90392-7.
- Wang, H., and G. L. Han. 2011. Chemical composition of rainwater and anthropogenic influences in Chengdu, southwest China. Atmos. Res. 99:190–96. doi:10.1016/j.atmosres.2010.10.004.
- Wang, L. Q., Z. X. Shen, D. Lu, Q. Zhang, T. Zhang, Y. L. Lei, and H. M. Xu. 2019. Water-soluble components in rainwater over Xi’an in northwest China: Source apportionment and pollution controls effectiveness evaluation. Atmos. Pollut. Res. 10:395–403. doi:10.1016/j.apr.2018.08.011.
- Wang, W., W. Zhang, Q. Shi, and S. Hong. 1993. Research of factors influencing acidity of rain in China. Environ. Sci. 13:401–06. (in Chinese).
- Wang, Y. S., X. Li, L. Yao, Y. N. Zhao, and Y. P. Pan. 2009. Variation of pH and chemical composition of precipitation by multi-step sampling in summer of Beijing 2007. Environ. Sci. 30:2715–21. (in Chinese).
- Xu, D. H., B. Z. Ge, Z. F. Wang, Y. L. Sun, Y. Chen, D. S. Ji, T. Yang, Z. Q. Ma, N. L. Cheng, J. Q. Hao, et al. 2017. Below-cloud wet scavenging of soluble inorganic ions by rain in Beijing during the summer of 2014. Environ. Pollut. 230:963–73. doi:10.1016/j.envpol.2017.07.033.
- Xu, H., X. H. Bi, Y. C. Feng, F. M. Lin, L. Jiao, S. M. Hong, W. G. Liu, and X. Y. Zhang. 2011. Chemical composition of precipitation and its sources in Hangzhou, China. Environ. Monit. Assess. 183 (1–4):581–92. doi:10.1007/s10661-011-1963-4.
- Xu, Z. F., Y. S. Li, Y. Tang, and G. L. Han. 2009. Chemical and strontium isotope characterization of rainwater at an urban site in Loess Plateau, Northwest China. Atmos. Res. 94:481–90. doi:10.1016/j.atmosres.2009.07.005.
- Yue, W. Z., Y. Liu, and P. L. Fan. 2013. Measuring urban sprawl and its drivers in large Chinese cities: The case of Hangzhou. Land Use Policy 31:358–70. doi:10.1016/j.landusepol.2012.07.018.
- Zhang, B. E., L. M. Jiao, G. Xu, S. L. Zhao, X. Tang, Y. Zhou, and G. Chen. 2018. Influences of wind and precipitation on different-sized particulate matter concentrations (PM2.5, PM10, PM2.5–10). Meteorol. Atmos. Phys. 130:383–92. doi:10.1007/s00703-017-0526-9.
- Zhang, D. D., C. Y. Jim, M. R. Peart, and C. X. Shi. 2003. Rapid changes of precipitation pH in Qinghai province, the northeastern Tibetan plateau. Sci. Total Environ. 305:241–48. doi:10.1016/S0048-9697(02)00464-3.
- Zhang, M. Y., S. J. Wang, F. C. Wu, X. H. Yuan, and Y. Zhang. 2007. Chemical compositions of wet precipitation and anthropogenic influences at a developing urban site in southeastern China. Atmos. Res. 84 (4):311–22. doi:10.1016/j.atmosres.2006.09.003.
- Zhang, X. Y., H. Jiang, J. X. Jin, X. H. Xu, and Q. X. Zhang. 2012a. Analysis of acid rain patterns in northeastern China using a decision tree method. Atmos. Environ. 46:590–96. doi:10.1016/j.atmosenv.2011.03.004.
- Zhang, X. Y., H. Jiang, Q. X. Zhang, and X. Zhang. 2012b. Chemical characteristics of rainwater in northeast China, a case study of Dalian. Atmos. Res. 116:151–60. doi:10.1016/j.atmosres.2012.03.014.
- Zheng, W. X., Q. R. Sun, W. B. Zhang, and F. M. Zhou. 1998. Alkaline component of atmospheric particulate matter in Beijing. Clim. Environ. Res. 3:89–95.
- Zhuang, H., C. K. Chan, M. Fang, and A. S. Wexler. 1999. Size distributions of particulate sulfate, nitrate, and ammonium at a coastal site in Hong Kong. Atmos. Environ. 33:843–53. doi:10.1016/S1352-2310(98)00305-7.