
ABSTRACT
According to the literature, it is estimated that outdoor air pollution is responsible for the premature death in a range from 3.7 to 8.9 million persons on an annual basis across the world. Although there is uncertainty on this figure, outdoor air pollution represents one of the greatest global risks to human health. In North America, the rapid evolution of technologies (e.g., nanotechnology, unconventional oil and gas rapid development, higher demand for fertilizers in agriculture) and growing demand for ground, marine and air transportation may result in significant increases of emissions of pollutants that have not been carefully studied so far. As a result, these atmospheric pollutants insufficiently addressed by science in Canada and elsewhere are becoming a growing issue with likely human and environmental impacts in the near future. Here, an emerging pollutant is defined as one that meets the following criteria: 1) potential or demonstrated risk for humans or the environment, 2) absence of Canada-wide national standard, 3) insufficient routine monitoring, 4) yearly emissions greater than one ton in Canada, 5) insufficient data concerning significant sources, fate, and detection limit, and 6) insufficiently addressed by epidemiological studies. A new methodology to rank emerging pollutants is proposed here based on weighting multiple criteria. Some selected emerging issues are also discussed here and include the growing concern of ultrafine or nanoparticles, growing ammonia emissions (due to rapid expansion of the agriculture), increased methane/ethane/propane emissions (due to the expanding hydraulic fracturing in the oil and gas sector) and the growing transportation sector. Finally, the interaction between biological and anthropogenic pollution has been found to be a double threat for public health. Here, a multidisciplinary and critical overview of selected emerging pollutants and related critical issues is presented with a focus in Canada.
Implications: This overview paper provides a selection methodology for emerging pollutants in the atmospheric environment. It also provides a critical discussion of some related issues. The ultimate objective is to inform about the need to 1) address emerging issues through adequate surface monitoring and modeling in order to inform the development of regulations, 2) reduce uncertainties by geographically mapping emerging pollutants (e.g., through data fusion, data assimilation of observations into air quality models) which can improve the scientific support of epidemiological studies and policies. This review also highlights some of the difficulties with the management of these emerging pollutants, and the need for an integrated approach.
Introduction
A key possible consequence of the emergence of new technologies in modern life includes an increase in atmospheric emissions of pollutants to the ambient air. The associated “emerging pollutants” that are known or suspected to be harmful to human health deserve more attention. Air pollution (indoor and outdoor) has become the largest environmental cause of disease and death in the world today (Fuller et al. Citation2018). According to the literature, it is estimated that outdoor air pollution is responsible for premature death in a range from 3.7 to 8.9 million persons on an annual basis across the world (Burnett, Chen, and Szyszkowicz et al. Citation2018; Silva et al. Citation2013) with more than two-thirds of the deaths occurring in Asia according to Lelielveld et al. (Citation2015). A large part of this burden is associated with global epidemics of heart disease, stroke, respiratory diseases, and cancer (Burnett, Chen, and Szyszkowicz et al. Citation2018; Fuller et al. Citation2018; GBD Citation2016). In Canada, a study of the Canadian Medical Association revealed that for the year 2008, air pollution has caused 21,000 premature deaths, 11,000 admissions to hospital, and 620,000 visits to physicians for total costs beyond 8 billion dollars in Canada (CMA Citation2008). A recent update by Health Canada (Citation2017) estimates the number of annual premature mortalities in Canada attributable to air pollution from human sources in North America to be 14,400. According to the International Institute for Sustainable Development, air pollution would have costed Canadians $39 billion in the year 2015 (IISD Citation2017). While uncertainty exists on these estimates, it is clear that air pollution has severe impacts on people’s health and the environment on the global, national, and local scale. Vulnerable people such as pregnant women, senior citizens and children are more affected by air pollution. For example, the leading causes of infant mortality are diseases of the respiratory system (approximately half of all children deaths) (Tamburlini Citation2002).
One question which emerges is how much of the global burden of disease is linked to “regulated pollutants” such as ozone, fine particulate matter (PM2.5), nitrogen dioxide (NO2) which are the main predictors used in epidemiological studies (e.g., Burnett, Chen, and Szyszkowicz et al. Citation2018; Crouse et al. Citation2015; Pope et al. Citation2002) and what part is due to the pollutants which are not included in these estimates (e.g., emerging pollutants such as black carbon, formaldehyde, ultrafine particles, butadiene, inorganic arsenic, iron oxide, nickel, etc.). Epidemiological studies rarely address the possibility of biases introduced by emerging pollutants or by the environmental cocktail effect (synergy between regulated and emerging pollutants and other environmental conditions such as changing weather) (ANSES Citation2018; D’Amato et al. Citation2015; Michaels Citation2008; Robichaud Citation2019; Xu, Ha, and Basnet Citation2016 and references therein). Difficulties to control confounding, uncertainties on how to combine synergistic effects of pollutants, lack of accuracy of exposure models are among the common problems of epidemiological studies (Xu, Ha, and Basnet Citation2016 and references therein). Moreover, population exposure to TRAP pollution (Traffic-Related Air Pollution) is not well taken into account in these studies since near-road monitoring have not been established so far in Canada (SOCAAR Citation2019). In fact, these studies do not take into account the proximity to major roads whereas a significant portion of the population live (about one-third of Canadians live within 250 m of major roads and thus potentially directly exposed to TRAP emissions according to Statistics Canada) (SOCAAR Citation2019).
In developed countries, significant changes in emission sources have occurred, for example, in the U.S., Canada and Western Europe over the past decade. This decrease is due to the implementation of emissions standards, the introduction, and addition of abatement technologies for road transport, reduction in fuel sulfur content for road and non-road transport, technology change as well as economic impacts of a major recession and differential fuel prices (http://www.epa.gov/air/airtrends/values.html and http://www.epa.gov/airmarkt/progress/ARP09_3.html; ECCC Citation2019). Over the past few decades, efforts to reduce air pollution were effective at least in North America for criteria air pollutants such as lead, carbon monoxide, sulfur and nitrogen oxides, and PM2.5 among others (ECCC Citation2019; Parrish et al. Citation2011; Robichaud and Ménard Citation2014). For example, for SO2 and nitrogen oxides, measurements reported systematic decreases in northeastern U.S. cities (Duncan et al. Citation2016; Emami, Masiol, and Hopke Citation2018). Similarly, the monthly average PM2.5 mass showed a downward trend (−5 μg/m3 or −41%) between 2001 and 2015 in Rochester (NY), a typical urban environment of the Northeast US (Masiol et al. Citation2018). Overall, for the whole of North America (urban and rural environments), Robichaud and Ménard (Citation2014) have obtained similar results (a decreasing trend of about 6 μg/m3 of the high percentile annual average from 2004 through 2012, e.g., 95th and 98th percentiles for PM2.5). These reductions in pollutant concentrations have also been noted through a reduction in acidification and nitrification in North America over the past decades (Schwede and Lear Citation2014). However, although regulated pollutants have diminished, there is no guarantee that emergent pollutants have been below safe thresholds during the same period. Likely, industries have made efforts to adapt to existing regulation but there has been less pressure to do so for un-regulated pollutants, even if these pollutants pose significant health risks. The “precautionary principle” (see definition in Supplementary material, S1) with respect to emerging or new species introduced in the environment has rarely been applied in North America due to various reasons such as additional costs to the industry, inappropriate technology, lack of public awareness, science uncertainties (Fuller et al. Citation2018; Michaels Citation2008). For example, emerging aerosol nanopollution in North America, could have had significant health impacts in the burden of disease (Arujo Citation2011a, Citation2011b; Kumar et al. Citation2013; Maher et al. Citation2016; Oberdörster, Ferin, and Lehnert Citation1994, Citation1995, Citation2005, Citation2002, Citation2004; Rahim, Pal, and Ariya Citation2019) but science and technical uncertainties are still an obstacle for the development of effective monitoring to support epidemiological studies and policies. Detecting particulate matter is usually obtained by measurements of total mass (PM2.5, PM10) while nanoparticles are more difficult to measure since the associated mass is small and often uncorrelated with PM2.5 (AQEG Citation2018; de Jesus et al. Citation2019; Frampton and Rich Citation2016; Morawska et al. Citation2008; Rodriguez et al. Citation2007). Trends for regulated pollutants may not reflect trends in a component or co-emitted unregulated pollutants and may not be representative of industrial or near-road activities (i.e. the most polluted sites). For example, the decreasing PM2.5 mass may occur while increasing black carbon, nanoparticles number, and nanometals present on their surfaces which is becoming a growing scientific concern currently not sufficiently addressed (AQEG Citation2018; EFCA Citation2019; Maher et al. Citation2016; Oberdörster, Oberdörster, and Oberdörster Citation2005; Oberdörster et al. Citation2002, Citation2004; Rahim, Pal, and Ariya Citation2019).
Over the recent decades many research studies have been conducted concerning emerging pollutants (EPs) in water (see Richardson and Ternes Citation2018 for a review), and soil (see Gomes et al. Citation2017 for a review) but a limited number of studies have dealt with airborne outdoor emerging pollutants in Canada (except for those covered by the international conventions or treaties). Therefore, there is a research gap concerning these “uncovered” airborne emerging pollutants. More research and information including monitoring are needed concerning their characterization, and their impact on health and the environment.
The number of chemical substances introduced into the atmosphere by technology is large. In the U.S., according to CDTSC (California Department of Toxic Substances Control), more than 85,000 chemicals are currently in commerce in the U.S. with about 2,500 chemicals being manufactured at a rate of more than one million pounds annually, with 45% of these chemicals lacking adequate toxicological studies for humans (https://www.dtsc.ca.gov/assessingrisk/emergingcontaminants.cfm#Emerging_Chemicals_of_Concern). A minority of these substances have undergone testing for safety or toxicity by the U.S. Environmental Protection Agency (US/EPA), which has been able to require testing on just 200 of them. Of that amount, only five have been regulated under the Toxics Substances Control Act (e.g., polychlorinated biphenyls, dioxin, hexavalent chromium, asbestos, and chlorofluorocarbons) (Fuller et al. Citation2018; Michaels Citation2008). In Canada, about 23,000 chemical substances were in commercial use between January 1, 1984, and December 31, 1986, with 4,300 substances requiring further attention as defined by the “Chemicals Management Plan” of the Canadian Government (Government of Canada Citation2018).
According to the French National Agency ANSES (French Agency for Food, Environmental, and Occupational Health & Safety, ANSES Citation2018), in a recent report release in 2018, 557 substances have been identified as emerging pollutants in France (not counting pesticides, radioactive isotopes, and biological pollutants). Among them, 394 pollutants have unknown effects on health, 66 pollutants have been recognized as requiring additional study. Finally, 13 pollutants were prioritized for which monitoring action was urgently recommended (ultrafine particles, black carbon, 1,3-butadiene, manganese, hydrogen sulfide, acrylonitrile, 1,1,2-trichloroethane, copper, trichloroethylene, vanadium, cobalt, antimony, and naphthalene). Similarly, the WHO (World Health Organization) suggests air quality criteria for only 32 pollutants (WHO Citation2016a; see Supplementary material S2 for a list) out of thousands of air pollutants that are potentially hazardous (ANSES Citation2018). Robust data needs to be documented concerning the fate and behavior in the environment of anthropogenic EPs. In Canada, categorization of air toxics includes two classes of emerging pollutants: 1) EPs that are inherently toxic and, 2) substances that have the greatest potential for exposure. The first category of EPs is further subdivided into persistent (very long time until they break down) and/or bioaccumulative EPs (accumulate in the food chain) (Government of Canada Citation2018). Concerning the first category, the human body simply does not possess enzymes to break down the molecular structures of many of the novel synthetic or emerging compounds (Tamburlini Citation2002). Other emerging pollutants such as ultrafine particles (UFPs, diameter less than 100 nm) are not filtered out by the upper respiratory system and can penetrate the blood barrier and affect and accumulate in the whole body (HEI Citation2013; Oberdörster et al. Citation2002; Stearns et al. Citation1994). More specifically, they can directly enter into the brain following the olfactory nerve and contribute to dementia in animal (Calderon-Guarciduenas et al. Citation2003) or humans (EFCA, Citation2019; Maher et al. Citation2016; Xu, Ha, and Basnet Citation2016). The supporting evidence between dementia and UFPs is growing. Levesque et al. (Citation2011) suggest that diesel nanoparticles particles are associated with neurodegenerative diseases. Chen et al. (Citation2017) found that people living near major roads present an increased risk of dementia. Gonet and Maher (Citation2019) pointed out that most of the near-road nanoparticles originate from the brake and tire wear system and that these inhaled nanoparticles play a role in dementia.
The emerging pollutants described in the current work are suspected to be carcinogenic, mutagenic, reprotoxic, teratogenic, or neurotoxic (or a combination, see definition in Suppl. Material S1) according to various health agencies across the world (ANSES Citation2018; Government of Canada Citation2018; US/EPA Citation2005; WHO Citation2016a, Citation2016b) and this is why further research on their prevalence, ambient concentrations, and toxicity is recommended.
The literature overview presented here is not comprehensive and only includes pollutants which are airborne (excludes indoor contaminants, personal care products, e.g., fragrances, indoor allergens, etc.). Moreover, it does not include pollutants that are already covered by international agreements such as the Stockholm, Minamata, Rotterdam, Vienna, and Benzene Conventions, i.e. persistent organic pollutants, mercury, plasticizers, flame retardants, perfluoroalkyls, chlorinated paraffins, siloxanes, chlorine compounds, pesticides, fungicides, herbicides, and other endocrine disruptors and other similar hazardous compounds. The report also does not cover algal toxins, radionuclides and other toxics found in water and soils, as they are not within the scope of this work. However, outdoor airborne biological pollution (see definition in Supplementary material S1) is treated here and is considered as an emerging pollutant according to the definition given in the next section. Note that routine bioaerosols monitoring has been already achieved in European countries. In France, for example, pollen is now considered a bio-pollutant having the same legal status as an anthropogenic pollutant (Légifrance Citation2010). Such recognition was necessary due to several reasons to be discussed later in this paper. Finally, toxicology studies suggest that engineered nanoparticles (eNPs from the nanotechnology sector) present a potential health risk as well but the precise health effects associated with human exposure are still poorly known (Gwinn and Vallyathan Citation2006). Therefore, eNPs are also included in this literature overview since it deserves better attention due to its health risk.
This overview paper also provides a rationale for enhanced monitoring and modeling to support policymakers for selected emerging pollutants and some critical emerging issues. While the primary focus is on Canada, the rationale is also relevant to other countries. The first part of the paper proposes a methodology for selecting critical emerging pollutants (CEPs), and is based on a decision tree making use of multiple selection criteria. This methodology was applied to the list of 4,300 chemicals under Canada’s Chemicals Management Plan (CMP) to derive a subset of CEPs, and each CEP is discussed. The second section of the review presents selected emerging issues, as well as the rationale for selecting each of these issues. The last section covers knowledge gaps, uncertainties, and provides recommendations.
Definition, methodology, and description of CEPs
Definition
The working group of the Massachusetts Department of Environmental Protection (MassDEP) defined emerging pollutants as substances or mixed substances (natural or anthropogenic) characterized by 1) a potential risk for humans and the environment, 2) absence of criteria and standards or published data, 3) limited or inadequate toxicological information, and 4) a need for new data concerning their emissions, fate and/or detection limits. Balducci, Perilli, and Romagnoli (Citation2012) define emerging pollutants more practically “as substances that are not currently included in routine monitoring programs: nevertheless, they may be candidates for future regulation, on the basis of outcomes of research on toxicity, occurrence in various environmental compartments and public perception.” The definition adopted here is inspired from these two existing definition described above but adapted to the Canadian context. Therefore, any selected emerging pollutant described here below obeys the following criteria: 1) potential or demonstrated risk for humans or the environment, 2) absence of Canada-wide national standard, 3) insufficient routine monitoring, 4) yearly emissions greater than one ton in Canada, 5) insufficient data concerning significant sources, fate, and detection limit, and 6) insufficiently addressed by epidemiological studies in Canada. In the second part of the paper, some critical emerging issues are also discussed. WHO (Citation2013) defines emerging issues as the following: “issues that are perceived to be potentially significant but that may be not fully understood. This includes 1) issues that are new or, 2) issues that are not new but may have been insufficiently recognized or given priority in the past while their significance or importance is now coming to the fore.” All the above definitions are used as guidelines in this study.
Methodology to select critical emerging pollutants
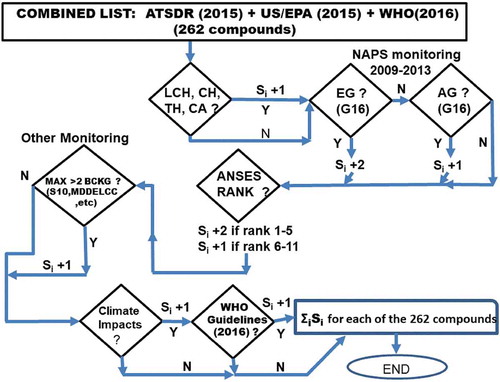
Given the thousands of chemical substances in use, a methodology to filter the most critical ones is needed and an algorithm is proposed here. The algorithm presented here starts by applying a filter by using the reduced list provided by ANSES (Citation2018) which is a large directory of hazardous compounds established by multiple panels of experts by the following three agencies: ATSDR (Citation2015), US/EPA (Citation2005) and WHO (Citation2016a). The list is narrowed down to 262 compounds after applying this filter (see details in ANSES Citation2018) and then compounds which are already addressed elsewhere by treaties, convention or other international agreement (pesticides, POPs, PAHs, mercury, benzene, carbon tetrachloride, etc.) or substances that have a Canadian Ambient Air Quality Standard (CAAQS), i.e. O3, PM2.5, etc. are removed (by attributing them a zero score). For the resulting included chemicals, a scheme of prioritization is then applied as follows. A cumulative scoring algorithm follows the flowchart of , with points being added depending on the substance’s known properties, appearance on different lists of chemicals of concern, etc., with the net score determining the relative priority of the chemical. If a compound is classified carcinogenic in humans (CH) or in animals (CA), toxic, or reprotoxic (see definition in Suppl. Material S1) in humans (TH), or likely or possibly carcinogenic in humans (LCH), or suspected to have long-term chronic effect even at low doses, it receives a score of unity. Then, if available monitoring in Canada (as described in Galarneau et al. Citation2016) has shown that it exceeds any provincial guidelines (EG) based on measurement from NAPS (National Air Pollutant Surveillance, see Suppl. material S1 for details), the compound gets an additional score of two. If measured concentrations do not exceed but approach provincial guidelines (within one order of magnitude) more than 5% of the time, it receives a score of unity. An additional step is taken to check whether the compounds are part of the 11 most worldwide hazardous pollutants as determined by ANSES (Citation2018) (see the list given in the Introduction). The established rank given by ANSES (Citation2018) is used here (see their assigned rank in , third column). If the compound belongs to the rank from 1 to 5, it gets two points, and one point if it corresponds to the rank 6 through 11. Furthermore, an additional score of one is added to the total if other measurement campaign in Canada (over the past 10 years or so) has shown large concentration values for a given compound. For example, over the oils sands, Simpson et al. (Citation2010) (labeled S10 in ) have taken measurements of numerous compounds including 76 VOCs. These authors have computed the ratio of maximum values over the background (see definition in S1). If measurements show that a compound exceeds two times the background values, it collects another point. Moreover, any compounds having a connection to climate impacts is also attributed to one point (e.g., main ozone precursors). Finally, an additional score of one is given if the compound has been selected for future regulations by the WHO (Citation2016a) (see Supplementary material S2 for a list of compounds selected by WHO). The last step of the algorithm computes the total cumulative score and the prioritization can now be completed. shows a summary of the selected pollutants and , the results of the cumulative scores and the corresponding prioritization rank. Only compounds having cumulative scores of 3 or more are addressed in the following and they will be referred to as critical emerging pollutant (CEP) in the rest of this document. Overall, the methodology is simple, easy to reproduce and takes into account the international expertise of many panel of scientists concerning emerging pollutants, climate impact, health risks, and prioritization as well as the results of real-world measurements available in Canada and whether or not they exceed or approach provincial guidelines (where available). Note that also includes other emerging compounds that cannot be assessed by this methodology (i.e. no NAPS measurements and no provincial air quality standards) but are recognized important in the literature (i.e. anthropogenic ultrafine particles, nanoparticles from the nanotechnology industry, diesel/black carbon, and bioaerosols).
Table 1. List of emerging air pollutants selected using the methodology shown in (gas and metals) or from literature (particles). Legend: CA: carcinogenic in animals, CH: carcinogenic in humans, TH: toxic in humans, MH: mutagenic in humans, LCH: likely carcinogenic in humans; EG: exceeding one or more provincial guidelines at least at one or more observing sites (G16; Galarneau et al. Citation2016), AG: approaching guidelines at least at one or more observing sites (G16); MIR: maximum weighted incremental reactivity (see definition in Supplementary material S1). ECCC: Environment and climate change Canada; rank: based on a score risk for health (ANSES Citation2018). UFPs: ultrafine particles, eNPs: engineered nanoparticles, WHO: World Health Organization, CASRN: Chemical abstract service registry number.
Table 2. Results of the prioritization algorithm (from ): a proposed selection of the most critical emerging outdoor pollutant.
Table 3. A) Top 10 highest average concentration during summer at the site under the plume of Montreal (based on ESOM-96 campaign), B) Top 10 highest percentage weighted MIR (Maximum Incremental Reactivity) percentage at a site under the plume of Montreal.
Figure 1. Algorithm used to select emerging pollutants. ATSDR: Agency for toxic substances and disease registry. WHO: World health organization. MDDELCC: Ministère du Développement Durable, de l’Environnement et de la Lutte contre les Changements Climatiques, Québec. ANSES: Agence Nationale de Sécurité Sanitaire, Alimentation, Environnement, Travail (France). LCH: likely carcinogenic to human, CH: carcinogenic to human. TH: toxic or reprotoxic, CA: carcinogenic in animal, BGCK: background value (see definition in S1), EG: exceeding provincial guidelines, AG: approaching guidelines (within an order of magnitude), S10: Simpson et al. (Citation2010).
The methodology to select emerging issues (discussed in the second part of this review) is based on the following criteria: 1) growing concern for public health and/or the environment, 2) potential for regulation or mitigation with the existing technology, 3) is an all year round problem (i.e. not seasonal such as forest fires), 4) modeling and monitoring studies are limited, i.e. scientific uncertainty is high and, 5) emissions reported to NPRI (National Pollutant Release Inventory) have large uncertainties.
In the following, we give more details concerning selected emerging compounds shown in in terms of their health impact but also their role in atmospheric chemistry and on the environment. Supplementary material S3 gives general information about the characteristics of the selected emerging pollutants. Note that the selected critical emerging pollutants (CEPs) are not exactly the same as the list provided by ANSES (Citation2018) since the selection here has been adapted to the Canadian context. Note also that CEPs having average yearly total emissions in Canada during the period 2009–2017 less than one ton (according to the National Pollutant Release Inventory, ECCC Citation2019) were removed from and (i.e., dichloroethane, propylene oxide, and 1,1,2 trichloroethane) and will not be addressed further in this paper.
Emerging VOCs
VOCs are precursors of ozone and PM2.5 and have been traditionally treated for simplicity by lumping them into families in air quality models (Lurmann, Lloyd, and Atkinson Citation1986; Seinfeld and Pandis Citation2006). However, some VOCs have more impact than others do on air quality chemistry () and on health. For this reason, VOCs should be considered individually (for monitoring, modeling, and verification) and not by family. Moreover, continuous measurements of VOC are needed in Canada (only 24-h average sampled every 3 or 6 days are measured by NAPS at the current time). Uncertainties on routine individual VOC measurements is a key knowledge gap that must be bridged to properly address the scientific knowledge of ozone and PM2.5 precursors, atmospheric chemistry, and impact on health. According to Galarneau et al. (Citation2016), further investigation of more than 30 compounds in Canadian air would aid to ensure that their spatio-temporal coverage is adequate and that their sampling and analysis methods are suitable. Details about individual selected emerging VOCs in this research (listed in ) are now given below.
Acrolein (C3H4O)
Acrolein is a reactive chemical that has many sources and toxic effects (Cahill Citation2014). Acrolein may also arise from the breakdown or oxidation of certain pollutants (such as 1,3 butadiene) or from the burning of organic matter as well as produced by vehicle combustion (Cahill Citation2014). It belongs to the family of aldehydes and is known to react with ozone and OH. The atmospheric lifetime is estimated to be 12–17 h and is a precursor of formaldehyde and PAN (peroxyacyl nitrate) (Seinfeld and Pandis Citation2006). Stroud et al. (Citation2016) found no changes in average concentrations in Canada from the period 2004–2010. However, a net annual increase of 86 to 110 tons of acrolein has been noted from 2009 to 2013 in Canada with a total of 102 tons in 2017 (ECCC Citation2019). The largest use of acrolein is as an intermediate in the synthesis of acrylic acid and as a biocide mostly related to wood products and pulp and paper industries (ECCC Citation2019). It is recognized as carcinogenic in animals (information is insufficient for humans) but inhalation in humans may produce irritation and congestion in the upper respiratory tract (ATSDR Citation2007; US/EPA Citation2003). Galarneau et al. (Citation2016) have shown that this compound exceeded one or more provincial guidelines in Canada at least at one or more sites during the period 2009–2013 using NAPS data. In California, Cahill (Citation2014) found that the median natural summertime background is near 40 ng/m3 which is double than EPA’s reference concentration of 20 ng/m3. Moreover, the same author measured concentrations in an urban environment to be 3–8 fold that of that background. In Canada, Galarneau et al. (Citation2016) found that acrolein measurements are often close to the detection limit in NAPS measurements (their Figure 2). Although the difficulty of measurements as described in Cahill (Citation2014) exists, Galarneau et al. (Citation2016) recommend increasing the monitoring of this compound in Canada.
Acrylonitrile (C3H3N)
This emerging pollutant belongs to the family of amines and is emitted by the textile industry and in the fabrication of polymers, rubber, resins, and plastic materials. Emission sources are strictly anthropogenic and US/EPA suggests that this pollutant is possibly carcinogenic for humans (US/EPA Citation1991) and toxic even at low doses (IARC Citation1999). Acute or short-term exposure causes mucous membrane, irritation, headaches, dizziness, and nausea (IARC Citation1999). In several animal studies, an increased incidence of tumors has been detected due to exposure to acrylonitrile (ANSES Citation2018). Monitoring data and observations are lacking considering the health risk of this CEP. As reported in ANSES (Citation2018), studies made in Japan and USA show that in 27% of the time, measurements in urban environments were exceeding the safe limit for humans (established to be 0.15 µg/m3 by US/EPA Citation1991). Galarneau et al. (Citation2016) showed that this compound exceeds provincial guidelines of at least one or more sites during the period 2009–2013 in Canada. About 5 tons of acrylonitrile emissions were reported in 2017 in Canada (ECCC Citation2019). Note that these species is on the list of proposed new guidelines by WHO (Citation2016a) and ANSES (Citation2018) classifies this air pollutant as the fourth rank in the priority for monitoring in France. In the scheme of prioritization proposed here, it reaches the highest level (priority 1, ). Acrylonitrile has an atmospheric lifetime of 5.6 days according to Seinfeld and Pandis (Citation2006).
1,3-butadiene (C4H6)
Some measurement campaigns in Europe and more specifically in France have led to the conclusion that concentrations of 1,3-butadiene frequently exceeds the safe limit (0.06 µg/m3; ANSES Citation2018) no matter where the site is located with a health risk factor at least three times higher than any other gaseous air pollutants. Therefore, the expert panel in Europe established the need for national monitoring in ambient air (ANSES Citation2018). Over different parts of Canada, Galarneau et al. (Citation2016) found that this chemical compound is approaching provincial guidelines (about 45% of the time) during the period 2009–2013 and emissions have not diminished since this period (ECCC Citation2019) suggesting that current concentrations will be at similar levels as during 2009–2013. Finally, over oil sands (Alberta, Canada), during two measurements campaigns (2010 and 2013), the maximum concentration of 1,3-butadiene was found to exceed the background value by a factor ranging from 5 to 10, respectively (Simpson et al. Citation2010, Citation2013). Emissions of butadiene in 2017 amount to 25 tons in Canada (ECCC Citation2019).
The health impact of 1,3-butadiene has been documented by Health Canada and some guidelines have been suggested for this harmful VOC https://www.canada.ca/en/health-canada/services/chemical-substances/challenge/batch-4/1-3-butadiene-ongoing-risk-management-activities.html. Studies suggest that this VOC is carcinogenic and mutagenic in humans (ATSDR Citation1992; IARC Citation2018; WHO Citation2001). ANSES (Citation2018) suggests, based on a multifactorial analysis, that this pollutant should be ranked first in a list of priority for monitoring and regulation due to its health risk for humans and its abundance and that monitoring should be increased. This CEP is considered as the most potentially harmful to health among all studied emerging VOCs (ANSES Citation2018; WHO Citation2016a). The above is consistent with results obtained here: 1,3-butadiene is classified as priority 1 with the algorithm used in here (see ).
The sources of 1,3-butadiene are exclusively anthropogenic and include rubber manufacturing, resin production, latex-styrene-butadiene and neoprene emulsions, motor vehicle exhausts, cigarette smoke, petroleum emissions, chemical feedstock, combustion of plastics and rubber (ECCC Citation2019). It is also among the list of 31 precursors of ozone (ANSES Citation2018; Seinfeld and Pandis Citation2006). Although the lifetime is short in summer (less than a day; Seinfeld and Pandis Citation2006), it is constantly emitted by motor vehicles in urban and semi-urban areas. In winter, the lifetime is up to 83 days (WHO Citation2001). There is a monitoring gap in Canada for this CEP and no current Canada-wide standard exists. Note, that in Europe, national regulation has been set-up for this VOC in Hungary and the United Kingdom (ANSES Citation2018). Provincial guidelines in Canada for 1,3-butadiene are inconsistent from one province to another (a factor of 6.6 between Ontario versus Quebec standards) and one order of magnitude higher that the toxicological reference value of 0.06 µg/m3 adopted in Europe (ANSES Citation2018). Recently, Stroud et al. (Citation2016) computed a yearly decrease of −0.01 µg/m3 for butadiene in Canada using observations and regional air quality modeling. However, the authors found poor skills in predicting 1,3 butadiene and its oxidation product, acrolein. Therefore, the exposure to Canadians above the safe limit is still not well characterized for both compounds and more research is needed.
Chloroform (CHCl3)
The monitoring of this compound by NAPS during the period 2009–2013 has shown that concentrations often exceeded or approached provincial guidelines at several sites in Canada (Galarneau et al. Citation2016). Emissions of chloroform are dominated by the pulp and paper industry. This substance has increased its production from below 30 tons in the early 2000s up to above 100 tons in 2016 (ECCC Citation2019). Chloroform is also released in the air by the chlorination of drinking water, wastewater, and swimming pools (Catto et al. Citation2012; Xu and Weisel Citation2005). Hazardous waste sites and sanitary landfills also release chloroform (ATSDR Citation1997). Short-term inhalation exposure may pose a health risk to the central nervous system (depression). Chronic or long-term exposure to chloroform by inhalation in humans increases the health risk including central nervous system effects (such as depression and irritability), effects on the liver, hepatitis, and jaundice (ATSDR Citation1997). Chloroform has been declared carcinogenic in animals after oral exposure, inducing kidney and liver tumors (CEPA Citation1999) while EPA has also classified chloroform as a likely human carcinogen (ATSDR Citation1997). Chloroform has a very long lifetime (0.55 year; Seinfeld and Pandis Citation2006). Galarneau et al. (Citation2016) mentioned that chloroform measurements are under the detection limit in the NAPS monitoring system but that more investigation is needed to evaluate the real exposure to Canadians (background median and maximum values are unknown).
Dichloromethane (CH2Cl2)
Dichloromethane (DCM), also known as methylene chloride, is used as a solvent in a wide range of industrial process applications including painting and cleaning. This compound appears on the WHO air quality guidelines (Citation2016a), is on the list of the US EPA hazardous substances (ANSES Citation2018) and laboratory studies have shown it causes cancer of the lungs, liver and pancreas in animals (ATSDR Citation2000). Finally, Galarneau et al. (Citation2016) report that DCM approaches some provincial guidelines (within one order of magnitude) at least 5% of the time. Natural sources of dichloromethane include oceanic sources, macroalgae, wetlands, and volcanoes but industrial emissions contribute to the majority of DCM in the environment (Gribble Citation2009). More monitoring is needed in Canada to assess the exposure of this pollutant to the population, the evaluation of background levels and the spatio-temporal variability. Reported industrial emissions in 2017 amount to 39 tons in Canada (ECCC Citation2019).
Ethylene oxide (C2H4O)
The major use of ethylene oxide is associated with the manufacturing of ethylene glycol (as a chemical intermediate). Galarneau et al. (Citation2016) report that average concentrations often exceed provincial standards across Canada. Measurements (NAPS) in Quesnel (British Columbia) during the period 2009–2013 have shown maximum concentrations up to 162 times the annual provincial standard and 1.89 times the 24-hr standard (the Quebec provincial standard was used here since British Columbia has no standard for this compound). The short-term acute effects of ethylene oxide in humans mostly poses a risk to the central nervous system (depression) and may cause irritation of the eyes and mucous membranes while the long-term chronic exposure in humans may induce damage to the brain and nervous system (ATSDR Citation1990). EPA has classified ethylene oxide as carcinogenic in humans (lymphoid and breast cancer) (https://www.epa.gov/sites/production/files/2016-09/documents/ethylene-oxide.pdf). This compound is also mutagenic, irritates the throat and lungs and is also an anesthetic gas (ATSDR Citation1990). The lifetime of ethylene oxide is very long and is about 200 days on average (Seinfeld and Pandis Citation2006). Despite the health and security risk (flammable), very little monitoring takes place in Canada (i.e. at only 7 sites in Canada, see Galarneau et al. Citation2016). This practice makes the follow-up of this substance difficult for scientific studies (monitoring, modeling, air quality forecasting) and exposes the Canadian population to unknown risks. In 2017, reported industrial emissions of ethylene oxide amount for 1.6 tons in Canada (ECCC Citation2019).
Formaldehyde (HCHO)
Formaldehyde is the simplest and usually the most abundant carbonyl in the urban and remote troposphere (de Blas et al. Citation2019; Hak et al. Citation2005; Zhu et al. Citation2017a, Citation2017b). In urban areas, concentrations range from 0.2 to almost 50 ppbv (de Blas et al. Citation2019; Hak et al. Citation2005; Seinfeld and Pandis Citation2006 and references therein). Emissions in Canada amount to about 1,560 tons in 2017 and are increasing since 2009 (ECCC Citation2019). HCHO was measured during ESOM-96 campaign in the Montreal area (Canada) and found to have relatively high concentrations (second highest after acetone, ). HCHO is emitted by combustion and industrial processes but also produced by plants, animals, and humans (Wakefield Citation2008) and by oxidation and degradation of anthropogenic and biogenic VOCs and methane in rural areas (de Blas et al. Citation2019; Zhu et al. Citation2017a, Citation2017b and references therein). In the global troposphere, more than 60% of the HCHO is due to oxidation of methane. In Mount Sutton (Quebec, Canada), it was estimated that about 50% of formaldehyde was due to methane oxidation (MacDonald et al. Citation2001). In rural areas, Guenther et al. (Citation2006) found that 85% of HCHO originate from biogenic sources (mostly isoprene), 15% from anthropogenic sources and forest fires. The removal processes for HCHO are photolysis, dry and wet deposition. Its atmospheric lifetime is 4–9 h (Seinfeld and Pandis Citation2006). shows that the mean reactivity of HCHO computed from real data taken in the Montreal region during ESOM-96 (in the context of North American Research Strategy on Tropospheric ozone, e.g., NARSTO) measurement campaign in 1996 at the L’Assomption site (located 50 km to the North of Montreal). According to , HCHO was found to have the highest reactivity potential of all 107 VOCs measured during ESOM-96 as expressed by the highest weighted MIR (maximum incremental reactivity, see more details in Suppl. Material S1). Similarly, based on scenarios for 12 urban areas in the United States, formaldehyde was also found to have the largest incremental reactivity with respect to ozone (Seinfeld and Pandis Citation2006). In urban areas, controlling the anthropogenic VOCs that react to make formaldehyde is a cornerstone in air quality management since it is one of the main precursors responsible for the formation of photochemical oxidants such as ozone. HCHO contributes to 25–30% of the radical production during midday and even greater during the morning and late afternoon under NOx-rich conditions (Lee et al. Citation1998). Seinfeld and Pandis (Citation2006) demonstrated that the theoretical maximum amount of ozone could be expressed as: [O3] = [HCHO] + [NO2], i.e. directly dependent on formaldehyde and NOx concentrations. Meteorological conditions determine HCHO peaks and daily profile and it is well correlated with ozone and isoprene (de Blas et al. Citation2019). HCHO is considered here to have an indirect climate impact since it is a precursor of tropospheric ozone (a powerful greenhouse gas).
IARC (Citation2006) declared HCHO as carcinogenic and mutagenic to humans. US/EPA acknowledges that HCHO is the most important carcinogen in the outdoor environment among the 187 hazardous identified by the U.S. Environmental Protection Agency (EPA Citation2011). It is also associated with nose tumor, eyes, and skin irritation as well as respiratory effects (Wang, Holloway, and Harkey Citation2019). Despite the health risk and impact on the photochemistry, there is no Canada-wide federal guideline at the current moment, although some provinces of Canada have adopted an air quality guideline and conduct some monitoring (Ontario, Manitoba, Alberta, and British Columbia). The situation is similar in most counties, except for the U.S., where a sparse surface monitoring network using chromatography measurements has been set-up, or measurements are available from occasional campaigns (see Zhu et al. Citation2017a, Citation2017b for details). Satellite observations are currently available from OMI, GOME2A,2B, and OMPS. Zhu et al. (Citation2017a, Citation2017b) and Wang, Holloway, and Harkey (Citation2019) using OMI total column have shown positive trends (2005–2014) for formaldehyde over most regions of North America although Stroud et al. (Citation2016) suggested a decrease of 0.11 µg/m3/year averaged over Canada during the period 2004–2010. In Canada, significant positive trends (3.8%/year during the period 2005–2014) over the Cold Lake oil sands region of Alberta have been estimated by Zhu et al. (Citation2017b).
Naphthalene (C10H8)
Naphthalene belongs to both families of PAHs (Polycyclic Aromatic Hydrocarbons) and VOCs (Jia and Batterman Citation2010). It is emitted into the environment during the production of phthalates, plastic substances, dyes, and insect repellents but also from the incomplete combustion of wood (ANSES Citation2018). Jet aircraft exhaust also contributes to the emission of naphthalene (Clark Citation2014; Masiol and Harrison Citation2014; Touri et al. Citation2013). The coal and steel industries and traffic are also emission sources in the atmosphere. In Canada, industrial emissions amount to 76 tons in 2017 (ECCC Citation2019). Sources of naphthalene are exclusively anthropogenic (ANSES Citation2018).
Naphthalene is suspected to be carcinogenic (ANSES Citation2018; Seinfeld and Pandis Citation2006 and references therein). According to Jia and Batterman (Citation2010), naphthalene ranks at or near the top of those substances posing inhalation cancer risks. The safe limit for inhalation of naphthalene has been established to be 1.8 µg/m3 by the US/EPA (US/EPA Citation2011) and was exceeded 4.3% of the time according to the only one measurement campaign noted by ANSES (Citation2018). Naphthalene occupies the 11th rank on the priority list of ANSES for the health risk and is likely carcinogenic for humans (ANSES Citation2018) and approaching guidelines (within one order of magnitude) in Canada more than 5% of the time (Galarneau et al. Citation2016). Finally, naphthalene is considered toxic under the Canadian Environmental Protection Act (CEPA Citation1999). While there are some routine measurements of naphthalene in urban areas, there is little measurement specific sources such as industrial sites and airports.
Tetrachloroethylene (C2Cl4)
Tetrachloroethylene also known as “perc” or tetrachloroethene is widely used for dry-cleaning fabrics and metal degreasing operations. Short-term high-level inhalation exposure of humans to “perc” produces irritation of the upper respiratory tract and eyes, kidney dysfunction, and neurological effects such as behavioral changes, impairment of coordination, dizziness, headache, sleepiness, and unconsciousness. Long-term inhalation exposure includes neurological, including impaired cognitive and motor neurobehavioral performance. The EPA has classified tetrachloroethylene as likely carcinogenic to humans (ATSDR Citation2007). Galarneau et al. (Citation2016) found that “perc” levels in Canada exceed the Quebec provincial guideline at least at one observation site during the period 2009–2013. This VOC is also on the CEPA list of toxics (CEPA Citation1999) and it can also damage plants (ECCC Citation2019). The WHO has proposed guidelines for this substance (WHO Citation2016a). Emission of “perc” has increased from 60 tons in 2009 to 118 tons in 2013 in Canada and amount to 79 tons in 2017 (ECCC Citation2019). Note that several environmental fines for violation of the CEPA (Citation1999) environmental law occurs every year with respect to this pollutant across Canada (https://www.canada.ca/en/environment-climate-change/services/environmental-enforcement/notifications.htmlreference), justifying maintaining the vigilance.
Toluene (C7H8)
This compound belongs to the aromatic family, is found in gasoline and is also used as a solvent. Toluene is toxic in both humans and animals for acute (short-term) and chronic (long-term) exposures. Symptoms after inhalation include irritation of the upper respiratory tract, fatigue, dizziness, sleepiness, headaches, and nausea (ATSDR Citation2017). Toluene may cause neurological and brain disorders in young children. Infants of mothers exposed to toluene (by inhalation) in pregnancy had abnormally low scores on the development of speech and motor functions (Grandjean and Landrigan Citation2006 and references therein). Note that the EPA has concluded that there is inadequate information to assess toluene’s carcinogenic potential. Nevertheless, toluene appears on the WHO (Citation2016a) list of future guidelines as a hazardous pollutant. Measurements made by the NAPS network show that toluene concentrations approach provincial guidelines (within one order of magnitude) in Canada in a significant percentage of the time (Galarneau et al. Citation2016, their Figure 7). Toluene is also an important anthropogenic precursor of ozone (second highest MIR in the Montreal region, ). The atmospheric lifetime of toluene is 2.4 days (Seinfeld and Pandis Citation2006). In a measurement campaign over oil sands (Alberta, Canada), toluene was found to exceed the background levels by a factor of 73 (Simpson et al. Citation2010). Finally, it is worth mentioning that toluene is also produced in significant quantities by jet aircraft (Masiol and Harrison Citation2014). Reported industrial emissions from all sources (not including the aviation sector) were 2,307 tons in 2017 (ECCC Citation2019).
Trichloroethylene (C2HCl3)
This VOC belongs to the family of halocarbons and is used as a solvent to extract grease, oil, and other similar substances. It is also used in lubricants, paintings, pesticides among other applications. Sources of atmospheric contamination are exclusively anthropogenic (Seinfeld and Pandis Citation2006; ANSES Citation2018 and references therein). The safe limit of 2.4 µg/m3 has been established by the US/EPA (US/EPA Citation2011). Information about this pollutant relies on only one measurement campaign in an urban and industrial environment and shows that the safe limit was exceeded 5.6% of the time (ANSES Citation2018). Another campaign over the oil sands (Alberta, Canada) reveals that concentrations were up to about 34 times the natural background (Simpson et al. Citation2010). The atmospheric lifetime of trichloroethylene is 5–8 days (Seinfeld and Pandis Citation2006). This compound occupies the seventh priority rank in the ANSES emerging pollutant list and has been found carcinogenic and mutagenic in humans (ATSDR Citation2007). Galarneau et al. (Citation2016) report that this VOC has exceeded some provincial guidelines at one or more site during the period 2009–2013 in Canada. Finally, WHO (Citation2016a) have proposed guidelines to manage this VOC. In this study, this compound was found to reach the second-highest priority (). Emissions in Canada amount to 30 tons in 2017 (ECCC Citation2019).
Transition metals
According to the methodology presented in , these are the following critical transition metals selected which need further attention ( and ): arsenic, cadmium, manganese, nickel, and vanadium. These trace metals are normally present in particulate matter and measured by the NAPS network in Canada. Most sources of anthropogenic emissions come from the metal industry, smelters, incinerators, fossil fuel combustion (ANSES Citation2018), as well as vehicle tire and brake wear and dust road resuspension (SOCAAR Citation2019). Natural emissions for many of these metals also occur and are coming from airborne soil particles, forest fires, volcanic eruptions, etc. (ANSES Citation2018 and references therein). More characteristics of transition metals are also found in Supplementary material S3.
Arsenic
Among one of the most carcinogenic transition metals is inorganic arsenic. Chronic (long-term) inhalation exposure to arsenic may cause irritation of the skin and of mucous membranes and affects the brain and nervous system. Inorganic arsenic inhalation exposure of humans has been associated with lung, kidney, prostate, liver cancer (ANSES Citation2018). The EPA has classified inorganic arsenic as a human carcinogenic (based on IARC Citation1987). It has been established that arsenic even at low doses may cause neurological disorders and brain dysfunction in babies and young children causing cognitive deficits and lifelong disability with significant costs to families and society (Grandjean and Landrigan Citation2006). In Canada, monitoring of arsenic exists in different provinces (analyzed from PM2.5 and PM10) and usually shows large exceedances of the annual standard. For example, monitoring in the province of Quebec over the past decade shows annual mean concentrations often exceeding the annual standard (0.003 µg/m3 in Quebec) at different sites (Supplementary material S4) with peak values likely up to two orders of magnitude more than the safe limit. In the region of Rouyn-Noranda (Quebec), measurements indicated that, in 2018, annual concentrations exceeded 32.7 times the provincial standard (Suppl. Material S4) which poses an acute problem to exposed population and especially children in Rouyn-Noranda (https://www.cbc.ca/news/canada/montreal/rouyn-noranda-lead-arsenic-levels-children-public-health-1.5135744). Moreover, public health authorities reported that concentrations of arsenic exceeded the provincial standard by 400% in 2011 and 200% in 2018 due to a copper smelter located in Montreal-east. (https://santemontreal.qc.ca/fileadmin/fichiers/professionnels/DRSP/sujets-a-z/Pollution/CCR_Avis_4sept2018.pdf). The NAPS network is primarily focused on urban monitoring (commercial and residential), and hence observations of arsenic made in this context may not reflect exposures in the communities near these industrial sites. Consequently, while Galarneau et al. (Citation2016) found that arsenic approaches provincial guidelines less than 20% of the time during the period 2009–2013 across Canada, exposures near non-urban industrial sites may be considerably higher. Therefore, the NAPS network does not give a complete knowledge of the exposure to the population in many cases. Arsenic is prioritized at level 2 in . This pollutant is proposed for regulation by Europe (WHO Citation2016a) (Suppl. Material S2) and it is suggested here to gain more knowledge about it and consider arsenic as a future candidate for a Canada-wide standard based on the evidence given above. Reported industrial emissions amount to 35.5 tons in Canada mostly from smelter activity (ECCC Citation2019).
Other metals
Manganese and vanadium are other critical emerging pollutants of interest (rank 2nd and 8th, respectively for ANSES; see also the level of prioritization indicated in ). Manganese and vanadium are also on the list of candidate for new regulation proposed by WHO (Citation2016a). They were both found to be carcinogenic (ANSES Citation2018; Ress et al. Citation2003). Manganese has been found to cause neurological disorders and brain dysfunction in young children and in adults and is linked with Parkinson’s disease (Grandjean and Landrigan Citation2006 and references therein). Metals mentioned above are used in the making of alloys in the smelter and appear linked with many other industrial processes and anthropogenic activities (industrial rejects, plumes of thermal power plants, incinerators, and industrial activities linked with mining) (Amato et al. Citation2013). Reported industrial emissions in Canada for manganese and vanadium amount to 299 and 54 tons, respectively, in 2017 (ECCC Citation2019). Manganese concentrations were measured to be very close to annual provincial standards in Lac Megantic (Quebec) in a measurement campaign (May 12–Nov 2, 2015) (MDDELCC Citation2017). Finally, cadmium and nickel have been declared likely carcinogenic by the US/EPA and proposed as well for new regulation by WHO (Citation2016a). In Canada, Galarneau et al. (Citation2016) observed that cadmium and nickel either approach (more than 5%) or exceed provincial guidelines and are therefore recommended for further investigation. Reported industrial emissions for cadmium and nickel in 2017 in Canada amount to 5572 and 128 tons, respectively (ECCC Citation2019). Nickel and other metals (such as zinc) have been found as nanometal on ultrafine particles in the context of activities at Montreal Pierre Elliott Trudeau’s airport (Rahim, Pal, and Ariya Citation2019) and in quantities higher than expected (i.e. higher than what suggests PM2.5 measurements). Therefore, population exposure to nanometals (see definition in S1) in urban areas needs to be better characterized (Maher et al. Citation2016). These source-specific short-term study observations may highlight the need for either source-specific monitoring observations or a denser monitoring network. For example, only one NAPS site measure metals on the whole island of Montreal with none near an industrial area, near-road or at airport. Note that in Canada, metal measurements by NAPS does not take place in any industrial areas (which are the main sources of metal emissions). Knowledge of levels of metals closer to large sources is desired, to better evaluate exposure in those segments of the Canadian population impacted by those sources.
Only pollutants of prioritization level 1 through 4 () have been discussed so far. One emerging pollutant of the prioritization level 5, which is worth mentioning here, is iron nanometal compounds. Maher et al. (Citation2016) recently suggested that magnetite pollution nanoparticles such as iron oxide could follow the olfactory nerve and accumulate in the brain (via the olfactory bulb) increasing the risk of dementia. Brake wear is the biggest source of iron oxide in PM2.5 and ultrafine particles near-road according to Gonet and Maher (Citation2019). Nanometals such as iron, zinc, nickel, lead are classified as emerging contaminants by the US/EPA and are also found in abundance in the context of airport activities (Masiol and Harrison Citation2014; Rahim, Pal, and Ariya Citation2019). The characterization and the study of transition metals in ambient air are important for public health, pollution control and to provide information to the analysis of the environmental global biogeochemical cycle.
Ultrafine anthropogenic particles (UFPs)
UFPs containing metals have been discussed above, and here the attention will be turned to the broader class of particles to which they belong. The methodology described in does not apply for some CEPs such as most UFPs due to lack of monitoring in Canada at the moment. However, ultrafine particles (UFPs, aerodynamic diameter <100 nm) fall under the above definition of emerging pollutants since there is no regulation for UFPs and they are suspected to cause significant damage to health as they can deposit and accumulate deep into the lungs and through the whole body (AQEG Citation2018; EFCA Citation2019; HEI Review Panel Citation2013; Jeong et al. Citation2004; Kelly and Fussell Citation2012; Oberdörster, Oberdörster, and Oberdörster Citation2005; Oberdörster et al. Citation2002, Citation2004; Terzano et al. Citation2010). The UFP size range encompasses the nucleation size (<30 nm) and Aitken or accumulation modes (30–100 nm). In an urban environment, UFPs are a mixture of diesel, black carbon and fly ash (Terzano et al. Citation2010) and are carriers for toxic components (Kelly and Fussell Citation2012; Rahim, Pal, and Ariya Citation2019). Recently, high values of ultrafine particle number have been measured at airports (AQEG Citation2018; Hudda et al. Citation2014; Keuken et al. Citation2015; Lopes et al. Citation2019) or due to maritime activities (González et al. Citation2011). Although UFPs or nanoparticles (both are used interchangeably in this review) have been monitored at some rare locations, they are still not part of regulatory networks (SOCAAR Citation2019). They account for most of the particle number concentrations (up to about 90%) in the whole spectrum of aerosols, but generally have negligible mass because of their small diameter and volume (AQEG Citation2018; Frampton and Rich Citation2016; Rodriguez et al. Citation2007). UFPs have larger collecting surface per unit mass with respect to larger particles and therefore contain higher proportions of organic material such as PAH and other condensable toxic compounds (Masiol and Harrison Citation2014). Many authors (de Jesus et al. Citation2019; Morawska et al. Citation2008; Rodriguez et al. Citation2007) found no correlation between UFPs count and PM2.5 mass. Consequently, it is important to measure UFPs concentrations directly, rather than attempting to infer their concentrations from measurements of regulated pollutants (AQEG Citation2018). Note that a description of instrument measurements for UFPs will not be given here. The reader is rather referred to the comprehensive review of Kumar et al. (Citation2010) for more details.
Anthropogenic UFPs can be either carbon-based or metallic or both. Carbon particles derived from combustion processes are the most numerous particles in the ultrafine range. They can aggregate easily into clusters containing iron and other transition metals, as well as VOCs and PAHs which exacerbate negative impacts on health (Terzano et al. Citation2010; Vedal Citation1997; Venkataraman and Raymond Citation1998) especially neurological disorders and dementia (Gonet and Maher Citation2019; Maher et al. Citation2016; Terzano et al. Citation2010). According to Terzano et al. (Citation2010), off-road UFPs have increased dramatically during the past few decades (e.g., aviation, marine sectors). Similarly, on-road freight is the fastest-growing source of terrestrial transportation emissions (Pollution Probe Citation2019). Heavy-duty diesel vehicles emissions (mostly associated to on-road freight transport) have increase by a factor of 3.4 from 1990 to 2015 (ECCC Citation2017). Moreover, the increasing popularity of SUV’s (sport utility vehicles) also threaten efforts to reduce pollution and carbon dioxide (IEA Citation2019). Therefore, unregulated diesel emissions, black carbon, and UFPs are likely expected to increase over the next decades in Canada. Note that WHO recommends targeting black carbon and UFPs for pollution reduction (WHO Citation2012b). There is a growing evidence that a causal link is emerging between health impacts (e.g., central nervous system and cardio-respiratory) and UFPs (ANSES Citation2018; US/EPA Citation2019; Xu, Ha, and Basnet Citation2016). In its latest PM assessment report, however, US/EPA (Citation2019) stipulates that “exposure to UFPs is suggestive of, but not sufficient to infer, a causal relationship” between UFP exposure and nervous system effects. A consensus has not been reached for the effects of UFPs on health in general and also on the metric that best represents the exposure to UFPs (US/EPA Citation2019). Interestingly, non-tail pipe emission of fine particulate matter (brake and tire wear and dust resuspension) has been measured near-road in downtown Toronto and found higher than primary tailpipe PM2.5 (SOCAAR Citation2019). More details about UFPs measurement can be found in Morawska et al. (Citation2008), Baldauf et al. (Citation2016), AQEG (Citation2018) and SOCAAR (Citation2019).
Black carbon (BC) and diesel exhaust particles (DEP)
An important particular class of UFPs is soot or black carbon, which is produced by incomplete combustion of fossil fuels (mostly diesel) and biomass burning. Diesel exhaust particles (DEP), black carbon (BC), and fly ash are carcinogenic in humans (Terzano et al. Citation2010 and references therein; WHO Citation2012a; Citation2012b). A recent study monitoring near-road pollutants in Canada found that levels of black carbon average above 1µg/m3 were found in both downtown Vancouver and Toronto in a range that has been associated with an elevated lifetime risk of lung cancer (SOCAAR Citation2019). Particularly of health concern are DEPs which consist of a carbon core with adsorbed PAH (polycyclic aromatic hydrocarbon) and transition metals which are carcinogenic, genotoxic (causing DNA damage), inducing ROS (reactive oxidizing species) formation as well (Terzano et al. Citation2010 and references therein) which is particularly harmful for health (see https://www.cancer.org/cancer/cancer-causes/diesel-exhaust-and-cancer.html). Elemental carbon (EC) and black carbon (BC) are suspected to be responsible for asthma according to the US/EPA (Citation2019). Globally, diesel engines account for about 25% of all black carbon emissions (http://www.cleanenergy.org/wp-content/uploads/dtfblack_carbon_final.pdf). Since black carbon absorbs sunlight, it is considered to have a positive radiative forcing which can alter climate (IPCC Citation2013; Seinfeld and Pandis Citation2006). Actions that target black carbon mitigation can lead to near-term climate benefits, as well as immediate health benefits (IPCC Citation2013). Quantifying the sources, transport and deposition of black carbon is the key to understanding the radiative forcing of black carbon (NAS, Citation2016). The World Health Organization (WHO) considers that black carbon (soot) is a better indicator of deleterious particle impacting health and a better target for air pollution reduction (WHO Citation2016b). A more complete description of deleterious health impacts of black carbon can be found in Terzano et al. (Citation2010) and on the following website: https://www.sciencedirect.com/topics/earth-and-planetary-sciences/black-carbon as well as in WHO (Citation2012a). According to AQEG (Citation2018 and references therein) GDI (Gasoline Direct Injection) can emit 5–40 times more particles (by mass) than a conventional PFI (port-fuel injected) petrol engine but still less than a diesel engine without a particle filter. About 50% of all light-duty vehicles in North America currently have GDI engines (May 2019) and the popularity of GDI is increasing due to fuel economy (HIS Citation2017). GDI growth is an emerging concern since it may wipe out (at least to a certain extent) efforts to 1) reduce climate forcers (such as BC), and 2) reduce pollution (e.g., BC has a large impact on public health). A potential mitigation is gasoline particle filters, which can reduce particle number from a GDI engine up to 80–90% (AQEG Citation2018 and references therein), although there are currently no regulations in Canada to enforce the use of these filters.
Emissions and formation
UFPs (including black carbon) are emitted by primary and secondary anthropogenic sources from combustion sources transportation and energy sectors which burn sulfur-containing fuels, (AQEG Citation2018) and natural sources (forest fires and volcanic eruptions among others). Airborne UFPs also form through heterogeneous and photochemical reactions. In urban environments, UFPs originate from combustion, such as motor vehicle exhaust (maritime, rail, and airport emissions), industrial activities and incineration, biomass burning and some non-combustion sources (Hudda et al. Citation2014; Masiol et al. Citation2018 and references therein) and from brake and tire wear. Gonet and Maher (Citation2019) recently showed that 86% of magnetite (a nano-metal suspected to be involved in neurodegenerative diseases according to Maher et al. Citation2016) is emitted by brake wear and only a few percent by diesel or petrol fuel. GDI engines emit a significantly high number of UFPs and black carbon but the technology is still evolving as well as the understanding of factors contributing to particle formation (Wallace Citation2019; Zimmerman et al. Citation2016). In the world of the automobile market, GDI is ideal for future hybrid, a fastest-growing market segment in propulsion (HIS Citation2017). More science is needed to efficiently support regulatory development given the rapid technological advances in the terrestrial transportation sector. Airport activity is also a source of concern for their growing emissions (particle number, black carbon, etc.; see Section below on emerging issues concerning the aviation sector). Reduction of emissions from shipping and aviation depends primarily upon the use of low sulfur fuels and road-vehicles to the use of particle filters device (AQEG Citation2018). UFPs may form by homogeneous nucleation of low volatility compounds and grow in the atmosphere (Jeong et al. Citation2004; Seinfeld and Pandis Citation2006) and sulfur plays a role in particle formation by providing sulfate nuclei on which the semi–volatile compounds can condense. Sulfur particles are formed immediately downwind as the plume cools and mixes with the surrounding air (AQEG Citation2018).
Health impact
There is an increasing concern about UFPs from outdoor and indoor sources and their toxicity (NAS Citation2016). Particles in the nucleation mode dominate the global total particle number abundance (Yu et al. Citation2010). Consequently, the impact of UFPs on human health may be systemic health effects, rather than simple toxicity to the lungs (ANSES Citation2018; EFCA Citation2019; Gwinn and Vallyathan Citation2006; Terzano et al. Citation2010). A massive amount of literature has examined the impacts of PM2.5 (diameter less than 2.5 microns) or PM10 but very few epidemiological studies have examined the health effects of UFPs because most ambient monitoring measures fine particle mass not concentration number (Terzano et al. Citation2010) and this is the reason why the direct connection between UFPs and health is still limited. However, one cannot ignore that challenges exist in the monitoring of UFPs and nanoparticles which should be scrutinized more to reduce scientific uncertainties (EFCA Citation2019; Knol et al. Citation2009). Although UFPs constitute a small fraction of the total mass of ambient particulate matter, which makes them hard to detect, they represent a substantial proportion in terms of particle number concentration and chemically active surface area.
Animal toxicological studies provide consistent evidence of brain inflammation and oxidative stress in the brain and morphological changes typical of neurodegeneration and Alzheimer’s disease (Maher et al. Citation2016; US/EPA Citation2019). In humans, the most obvious impact of UFPs is to enhance pro-inflammatory effects in airways of COPD (Chronic Obstructive Pulmonary Disease) and asthma patients and cause oxidative stress as well. Moreover, UFPs penetrate the blood barrier and act as triggering factors of the blood coagulation in the bloodstream, impact the autonomic nervous system and affect the cardiovascular system and redistribute throughout the whole body including the brain with potential neurotoxic degradation (Donaldson et al. Citation2005; Oberdorster et al. Citation2004; Reeves Citation2011; Sun, Wang, and Ximei et al. Citation2005; Terzano et al. Citation2010; Xu, Ha, and Basnet Citation2016) although the precise mechanism by which air pollution from UFPs influences cardiovascular risk has not been fully understood yet (Terzano et al. Citation2010). Many researchers suggest that UFPs may also promote atherosclerosis (Arujo Citation2011a; Arujo et al. Citation2008; Sun, Wang, and Ximei et al. Citation2005). Health effects related to UFPs exposure have been less extensively studied than the effects of coarser PMs. However, UFPs ability to migrate to organs beyond the lungs and interact with tissues and cells is a significant concern and represents a distinct biological mechanism for effects (Brook Citation2019; HEI Citation2013; Knol et al. Citation2009; Ohlwein et al. Citation2019; US/EPA Citation2019). It has been known for more than two decades that UFPs are suspected to cause mortality, adverse cardiovascular and respiratory diseases (Knol et al. Citation2009; Oberdörster, Ferin, and Lehnert Citation1994, Citation1995, Citation2002; Terzano et al. Citation2010 and references therein; EFCA Citation2019; HEI Citation2013; Kelly and Fussell Citation2012). Although there is no definite answer on UFP impact alone given the mixture of other pollutants within the “urban chemical soup,” a recent systematic literature review (Ohlwein et al. Citation2019) suggests the evidence of short-term impact (inflammatory and cardiovascular effects) which “may be at least partly independent of other pollutants” (Brook Citation2019). Recent studies also suggest an association of atmospheric particles with neurodegenerative diseases such as Alzheimer’s and Parkinson’s, strokes, autism, and anxiety (Maher et al. Citation2016; NAS Citation2016 and reference therein; EFCA Citation2019; US/EPA Citation2019). According to Petsko (Citation2006), the next epidemic will be that of Alzheimer and Parkinson and nanoparticles may possibly increase the public risk throughout the 21st century (Maher et al. Citation2016). These are costly diseases having a significant threat to the economy according to Petsko (Citation2006). US/EPA PM assessment (Citation2019) latest report (under review) states that “collective evidence is insufficient to conclude that a causal relationship is likely to exist between long-term UFP exposure and nervous system effects.” However, the same report suggests that UFPs reaching the brain via olfactory transport is likely to be related to nervous system effects. In Montreal, ambient UFP concentrations were associated with a significant increased risk of prostate cancer (Weichenthal et al. Citation2017). There is also increasing evidence that UFPs generate airway inflammation and act as adjuvants for IgE (Immunoglobulin E) production that may explain the increased asthma prevalence (see Supplementary material S1 for a definition) and other respiratory allergic diseases in polluted environments (Knox, Suphioglu, and Taylor et al. Citation1997; Majd et al. Citation2004; Nel et al. Citation1998; Parker, Akinbami, and Woodruff Citation2009). Bové et al. (Citation2019) found UFP-related black carbon in the human placenta and Saenen et al. (Citation2017) observed UFP-related black carbon in child urine. Identifying and isolating the specific health effects of UFPs is still a considerable challenge. However, the conclusion of a panel of European experts on UFPs is clear (Knol et al. Citation2009): “the overall medium to high likelihood rating of causality of health effects of UFP exposure stresses the importance of considering UFPs in future health impact assessments.” Moreover, according to the same panel of experts: “omission of UFPs in health impact assessment may lead to inadequate policies to reduce air pollution as UFPs reduction may also be effective in improving health.” However, a lack of appropriate monitoring of UFPs makes impossible to develop health guidelines as a basis for national regulations at the current moment. Gaps in knowledge of the spatio-temporal and seasonal variations and in the chemical composition need to be resolved, and long-term trends are needed in order to reduce uncertainties in providing recommendations for the development of air quality standards, guidelines, or toxicological reference values especially for black carbon, diesel ultrafine, and fine particles (ANSES Citation2018).
Engineered nano-particles (eNPs)
We distinguish here nanoparticles that are manufactured (engineered) to those emitted from combustion processes (as described above). The emergence of eNPs is considered as a “new industrial revolution,” the biggest engineering innovation since the Industrial Revolution (the latter took place in the mid-18th to mid-19th century) (Gwinn and Vallyathan Citation2006). Nanotechnology is growing so fast (medical imaging, drug delivery, cancer treatment, gene therapy, electronics, and micro-informatics among others) that it could become impossible to follow this “industrial revolution” if large-scale action is not taken to better monitor and evaluate their health impact (Gwinn and Vallyathan Citation2006). The growing use of composite materials leads to a higher amount lost in the atmospheric environment (incineration, usage, i.e. brake and tire wear, etc.). The exact mechanism through which eNPs exposure affects health remains to be understood. Recently, a study has shown than an increase in blood pressure in schoolchildren was found related with the inhalation of the smallest eNPs particles (Pieters et al. Citation2015). Other studies made in the context of oral ingestion suggest that the primary biological responses include immuno-modulation, oxidative stress, and embryotoxicity. Interactions of eNPs with biomolecules (e.g., polysaccharides, proteins, and colloids) may affect their aggregation and bioavailability. Whenever eNPs are present inside an organism, they may interact with plasma proteins affecting uptake and toxicity (see the review of health impacts in Gwinn and Vallyathan Citation2006; Richardson and Ternes Citation2018 and references therein).
The eNPs can further be subdivided between carbon-based nanoparticles such as carbon nanotubes or fullerenes and metal-based nanoparticles (nZnO, nCeO2, nAu, to name a few) or as a form of quantum dots (EPA, Citation2010; Sauvé and Desrosiers Citation2014). One of the most popular is fullerene (C60) due to its conducting and lubricating properties. Given the small size of these particles, they can be transported to distant sites and could induce adverse health effects far from their source of emissions. The possible toxic health effect of fullerenes (C60), graphene, carbon nanotubes, titanium dioxide, and other eNPs associated with nanotechnology are virtually unknown (Gwinn and Vallyathan Citation2006; Sauvé and Desrosiers Citation2014). However, the similarity, size, and compatibility of eNPs to UFPs suggest that the human health effects are likely to be similar (Gwinn and Vallyathan Citation2006) since they can be translocated through the whole human body just as for UFPs (Card et al. Citation2008; Oberdorster et al. Citation2004; Oberdörster, Oberdörster, and Oberdörster Citation2005). Even if a particular eNP is not very toxic, inhaled eNPs may cross cell membranes, permeate to the blood vessels, and redistribute through the whole body causing systemic health effects and cause oxidative stress (Romieu et al. Citation2008), inflammatory mediator release, induce heart and lung and other systemic effects (Card et al. Citation2008). In addition to that, occupational exposure, direct human exposures through medicinal applications and their wastes are inevitable. According to Kumar et al. (Citation2013), eNPs enter into the atmosphere by wear and tear of material containing eNPs and through incineration of waste. When burned in incinerators, airborne heavy metals, dioxins, hydrocarbons, and other organic chemicals can adhere to eNPs surface and increase their toxicity (Quarg Citation1996; Record Citation2012). Note that any pollutant that is not regulated could be burned in incinerators and eNPs are no exception to this. The release of toxic eNPs will depend on whether or not incinerators have appropriate filters (AQEG Citation2018). Nevertheless, following the “precautionary principle,” monitoring of airborne eNPs is desirable and necessary in view of their potential health effect. A full lifecycle study (emissions, transport, deposition) is needed for eNPs (as well as for most CEPs).
Bioaerosols
Interest in the sources and impacts of bioaerosols on health and climate has strongly increased in recent years (Ariya et al. Citation2009; Chathurika et al. Citation2017; de Weger et al. Citation2013; Efstathiou, Isukapalli, and Georgopoulos Citation2011; Frölich-Nowoisky et al. Citation2016; Klein et al. Citation2012; Laaidi, Chinet, and Aegerter Citation2011; O’Sullivan et al. Citation2015; Wozniak, Solmon, and Steiner et al. Citation2018; Zhang et al. Citation2014). However, the understanding of the impacts of bioaerosols on atmospheric composition, climate, and human health remains weak (NAS Citation2016 and references therein). Bioaerosols (pollen, bacteria, spores) could be thought as emerging pollutants as well since 1) little or no regulation exists in the urban environment (e.g., presence of ragweed, birch, or other allergenic plants) (Klein et al. Citation2012), 2) there is little monitoring of pollen in Canada (any existing monitoring is conducted by the private sector and some universities), 3) they present severe potential health impact interacting with air pollution (Behrendt and Becker Citation2001; Behrendt et al. Citation1997; Majd et al. Citation2004), and, 4) they are likely increasing in the future (under climate change scenarios; D’Amato et al. Citation2015 and references therein). Moreover, bioaerosols have been shown to contribute more than previously thought to terrestrial (Jaenicke, Matthias-Maser, and Gruber Citation2007) and also to marine aerosol composition (O’Dowd and de Leeuw Citation2007). In addition, bioaerosols can metabolize in cloud water and likely change the cloud chemistry (Amato et al. Citation2005; Delort et al. Citation2011) and act as condensation or ice nucleation (Ariya et al. Citation2009). Finally, many authors (Chathurika et al. Citation2017; Mohler et al. Citation2007; O’Sullivan et al. Citation2015; Wright et al. Citation2014; and references therein) suggest a powerful link between rain and bioaerosols (amplifying precipitation mechanism known as bio-precipitation). Wozniak et al. (2018) have shown that bioaerosols can suppress continental rain by up to 30%.
Researchers from different parts of the world have also shown that bioaerosols may have synergy with air pollution exacerbating human health degradation more than bioaerosols or pollutants alone. This is the case for pollen mixed with urban or industrial pollution (Knox, Suphioglu, and Taylor et al. Citation1997; Laaidi, Laaidi, and Besancenot Citation2002; Majd et al. Citation2004; Molfino et al. Citation1991; Morgenstern et al. Citation2008; Parker, Akinbami, and Woodruff Citation2009; Peltre Citation1998 among others). In addition, over the past two decades, the work of many researchers suggests the need to monitor airborne fine allergens (starch granules inside the pollen grain released in large amounts following pollen rupture or spore fragments) and not only the entire pollen grains or spores (Buters et al. Citation2012, Citation2010; Miguel et al. Citation2006; Puc et al. Citation2016; Rantio-Lehtimäki, Viander, and Koivikko Citation1994, Citation2004; Taylor et al. Citation2002). These spore fragments or starch pollen granules can trigger asthma attack more efficiently since they are smaller inner particles (diameter in the fine mode) that can penetrate deeper into the lungs and exacerbate lung inflammation and allergic reactions. Allergic rhinitis prevalence is 18.7% in Europe, and the sensitization rate to pollen is 19.3% and 4.4% to fungal spores and molds, respectively (Klein et al. Citation2012). Modeling efforts have started over the past decade or so in North America (Efstathiou, Isukapalli, and Georgopoulos Citation2011; Zhang et al. Citation2014) but they are incomplete and the performance is inadequate and therefore further research is needed particularly concerning the modeling of fragmentation of bioaerosols. The study of aeroallergens cannot be done independently of that of air pollution. As an example, more details about the interaction pollution-pollen are given below.
Interaction of pollution-pollen
Chemical pollution interacts with pollen in four different ways: 1) it impacts the quantity of emitted pollen by plants, 2) it increases the allergenic impact of the pollen released, 3) it changes the patient individual sensitization to pollen and allergens and, 4) it favors pollen rupture or cracks in its surface liberating small allergens which can penetrate deeper in the lungs and exacerbate respiratory problems such as allergic asthma (de Weger et al. Citation2013; EPA Citation2008; Gervais Citation1994; Jelks Citation1987; Laaidi, Chinet, and Aegerter Citation2011; Lacroix Citation2005; Miguel et al. Citation2006; Ring et al. Citation2001; Sénéchal et al. Citation2015; Taylor and Jonsson Citation2004; Thibaudon Citation2007). The need to monitor both pollen and aeroallergens in ambient air has been highlighted in an expert opinion and reports published by several countries around the world (Buters et al. Citation2010, Citation2012; Dales et al. Citation2004, Citation2008; Klein et al. Citation2012; see also a review in Sofiev and Bergmann Citation2013). Contaminated pollen with pollution are more dangerous than non-contaminated pollen as an increase of IgE (a marker for allergies) has been reported in many studies (Majd et al. Citation2004; Parker, Akinbami, and Woodruff Citation2009). Peltre (Citation1998) coined the new term polluen (pollutant+pollen) to represent a contaminated pollen with adsorbed fine particles (including trace metals or black carbon) or absorbed gas pollutants (NO2, PAH, NH3 among others). In parts of Europe, pollen is legally recognized as an air pollutant (e.g., in France, Légifrance Citation2010), but is rarely addressed by air quality scientists in North America. The potential importance of the pollution-pollen as a health risk may warrant additional studies to address existing knowledge gaps. In the US, according to the Asthma and Allergy Foundation of America, 14 of the 15 cities listed as the “most challenging places to live with asthma” have overlapping risks of ozone and ragweed pollen (EPA Citation2008; NRDC Citation2015) suggesting a hazardous synergy between pollen and pollution.
There is a research gap in the understanding of synergies between anthropogenic, biological pollution and weather as suggested by Klein et al. (Citation2012). This is particularly true in the context of climate change where these synergies could become more active (D’Amato et al. Citation2015). Finally, Cao et al. (Citation2014) have shown that many kinds of pathogens and bacteria can be spread out through PM2.5 in smog and increase the risk of respiratory diseases. The same is applicable for some fungal spores such as from Alternaria, which could be involved in triggering asthma epidemics in some specific weather conditions so-called “thunderstorm-asthma” (Marks and Bush Citation2007). Robichaud and Comtois (Citation2019) showed that an increase in asthma hospitalization in Montreal is associated with weather fronts during the spring season and proposed the concept of “frontal-asthma” to describe the complex synergy pollen-pollutant-weather conditions.
Monitoring and forecasting effort
In Canada, besides the private sector (Weather Network) very little attention has been given to airborne measurement of bioaerosols as compared to that in Europe. In the U.S., the situation is similar with Multi-Media Inc. which provides aeroallergen public forecast. However, the American Academy of Allergy, Asthma, and Immunology (AAAAI) collects pollen and mold counts in near-real time on their website (https://www.aaaai.org/). One pilot study in Canada was a monitoring effort in Halifax (Arsenault, Waugh, and Richardson Citation2005), where bioaerosols (pollen and fungal spores) were collected according to AAAAI protocols. According to Klein et al. (Citation2012): “today’s air quality legislation falls short of addressing air quality degradation by biological weather.” It is believed that the burden of asthma, and other allergic diseases (the most common causes of emergency room visits), can be reduced with appropriate monitoring and an improved monitoring/forecasting alert system for aeroallergens (Osborne, Alcock, and Fleming Citation2017). This aeroallergen alert system should also be coordinated with the pollutant alert system for consistency. Quantifying better emissions of bioaerosols is a high priority for the U.S. National Academy of Science (NAS Citation2016) in order to reduce uncertainties for known sources and constrain emissions of poorly understood bioaerosols. More details about the need to better monitor pollen and health impact could be found in ANSES (Citation2014). Control of bioaerosol emissions in an urban setting is possible. People living near allergenic vegetation (birch trees, ragweed, etc.) may become sensitized to their allergens and later develop lifetime allergies to pollen (Jelks Citation1987). Eliminating ragweed, imposing rules concerning future avoidance of planting urban decorative trees which are highly allergenic such as birch trees, Chinese Elm, and other similar taxons are among example. Moreover, efforts should be allowed to produce bioaerosols forecast for the public (pollen, spores, bacteria, and virus) and to study the relation to pollution forecast (e.g., pollen-synergy between ragweed and ozone) so that sensitive people may better avoid exposure to this double threat. Research and monitoring of bioaerosols are important not just for their impact on health and allergies, but also because they can influence air, precipitation, and climate.
Important emerging issues related to air quality in Canada
In the last section, individual selected emerging pollutants of concern were identified, described and a prioritization level (whenever possible) was obtained through the methodology of . In this section, we discuss overarching emerging issues selected based on the definition given in the Methodology Section. Note that these emerging issues are connected to various degree to emerging pollutants selected in .
Growing transportation sector: the need to improve monitoring and modeling of particle number concentration, black carbon, and diesel
Technology in the transportation sector is evolving rapidly. While the major focus has been on the challenge of decarbonizing the transportation sector and reducing regulated pollutants, UFPs, black carbon, and diesel particles have received much less attention and they are collectively considered here as an emerging threat. Near-road UFPs particle number and black carbon are expected to increase since the density of diesel vehicles will also increase (HIS Citation2017). Mass concentration has traditionally been the metric used for assessing PM pollution, and has been the metric used for ambient air quality standards in many countries to protect public health. However, according to recent studies presented at the Symposium on ultrafine particles in Belgium (EFCA Citation2019), by monitoring experience in Ireland (AQEG Citation2018) or across the world (de Jesus et al. Citation2019), there is an urgent need to better establish the link between health risk and particle number concentration. This would be a useful complementary metric, which will allow setting effective regulations (based on the number of particles and not only on total mass). Current legislation in air quality focusses on monitoring the total mass of fine particulates (PM2.5). Several authors (Saliba et al. Citation2017; Zimmerman et al. Citation2016) shows that the new GDI (gasoline direct injection) technology for cars produces about one order of magnitude more particle number than the PFI (port-fuel injection) vehicles although the former complies more with existing regulation for NOx, CO and emits less carbon dioxide than the latter. Since there has been a significant trend in the last ten years to switch toward the GDI technology (HIS Citation2017), this will potentially cause an important increase in the urban number of nanoparticles including black carbon. The latter poses a risk to health and is a climate short-term forcer (IPCC Citation2013; WHO Citation2016b).
In a recent study of near-road monitoring in Canada (SOCAAR Citation2019), it was found that 60% of black carbon comes from local traffic and that a small portion of trucks and cars were responsible for the majority of emissions. Moreover, the same study showed that non-tail pipe emissions are now contributing more to the PM2.5 mass than tailpipe emissions in downtown Toronto. Emami, Masiol, and Hopke (Citation2018) showed that although declines were noted from 2002 to 2011 in submicron particle concentrations in a metropolitan area of the northeastern United States, since 2011, an increase has been observed matching the GDI sharp increase of market penetration. The recent upward trend of UFPs number concentration is likely to be the norm over the next decades worldwide since the modern vehicle fleet is increasing everywhere (HIS Citation2017; Zimmerman et al. Citation2016). In parallel, the rise of SUVs popularity will not help pollution reduction. According to the International Energy Agency, in 2010, 18% of worldwide car sales were SUVs whereas in 2018, it amounts to 40% (IEA Citation2019). Note that in Canada, the size of vehicle has increased during the period 2007–2016 (17% increase) as well as the average one-way travel distance (increase from 7.8 to 8.7 km) (SOCAAR Citation2019 and reference therein) which adds up to future challenges if trends remain similar. Finally, the aviation sector is another growing issue since it is known as the greater emitter of urban nanoparticles (Hudda et al. Citation2014; Keuken et al. Citation2015; Rahim, Pal, and Ariya Citation2019). This subject is covered in more details in the next section.
Despite extensive discussion of introducing UFPs metrics into the U.S. regulatory system, particle number concentration has not been promulgated as a National Ambient Air Quality Standard (NAAQS) (Masiol et al. Citation2018). Discussions have been going on for at least a few decades and actions to reduce uncertainties in measurement protocols are needed (Teichman Citation2008). Recently, the European Federation of Clean Air and Environmental Protection Associations (EFCA Citation2019) concluded that regulation is strongly recommended to policymakers in Europe concerning UFPs. Although technological problems associated with UFPs measurement exist and monitoring protocols are not well established, effort to control or mitigate the impact of UFPs should be enhanced considering the potential considerable heath risk. Moreover, current near-road monitoring is inadequate in Canada and should be enhanced since more than one-third of the Canadian population live near major roads (SOCAAR Citation2019). Real-world measurement of emission factors shows important differences from laboratory-based values especially marked with the large seasonality of the Canadian climate. For example, cold temperatures increase the near-road concentration of UFPs and NOx (SOCAAR Citation2019). UFP measurement also makes it possible to improve the knowledge on pollution source identification (AQEG Citation2018; Keuken et al. Citation2015). UFPs, black carbon and diesel linked with growing transportation represent an area of emerging concern for toxicology and air quality that warrants more attention. Note that, in Europe, a standard (known as EURO-6 standard, see S1 for details) for UFPs has been proposed for ignition vehicles (6 X 10¹¹ particles/km) to protect public health and which can be considered for North America as well. Finally, of particular concern is the fast-growing sector of freight transport especially the heavy-duty diesel vehicles. From 1990 to 2015, heavy-duty diesel trucks and rail emissions increased by a factor of 2.7 times (ECCC Citation2017). A heavy-duty diesel truck or bus exhibits particle number emission factors that are one of two orders of magnitude larger than a typical petrol car (Morawska et al. Citation2008 and references therein).
Air quality in the vicinity of airports and aircraft emissions
The air travel sector is continuing to experience the fastest growth among all modes of transport. Historically, across the world from 1992 to 2005, an increase of passengers of 5.2% per year has been registered (Fleuti Citation2008; Lee et al. Citation2009). According to the latest ICAO’s forecasts (using the year 2015 as a baseline), global passenger traffic will grow at 4.3% percent annually from 2015 to 2035 (https://www.icao.int/sustainability/Pages/eap-fp-forecast-scheduled-passenger-traffic.aspx) mainly driven by the developing economies and globalization (Masiol and Harrison Citation2014 and references therein). Furthermore, an increase in aircraft age and traveled distance is also expected (ACI Citation2016) which also will contribute to emission increase (Lopes et al. Citation2019).
Airports have been known for a long time as sources of noise but recently also of poor air quality (Hsu et al. Citation2013; Hudda et al. Citation2014; Kukken et al. 2015; Rahim, Pal, and Ariya Citation2019; Touri et al. Citation2013). Although NOx emissions have been reduced in aviation from 1997 to 2003 (a decrease of 40%), airports have been shown to contribute significantly to anthropogenic UFP emission in the apron and area surrounding airport (Kumar et al. Citation2013; Touri et al. Citation2013). Recently, Rahim, Pal, and Ariya (Citation2019) have demonstrated that pollution by nanoparticles containing trace metals (e.g., Fe, Al, Zn, Ni) was found at higher number concentrations than expected at Pierre E.-Trudeau airport in Montreal (note that Ni is a highly prioritized emerging pollutant in ). Metal presence is mostly due to 1) fuel impurities, and 2) corrosion of mechanical components of engines (Masiol and Harrison 2015). Secondary organic aerosols is also a product of aircraft exhaust and mostly dominate the PM component at low thrust while sulfate becomes dominant at higher power (Masiol and Harrison, 2015 and references therein). Aircraft emit NOx, SOx, CO, CO2, sulfates, hydrocarbons, lead, and black carbon (IPCC Citation1999), ultrafine particles with nanometals (Masiol et al. 2015; Rahim, Pal, and Ariya Citation2019 and reference therein) as well as other CEPs mentioned above. At airports, naphthalene could reach high levels due to jet aircraft exhaust (Touri et al. Citation2013). Note that most of CEPs in are also emitted by jet aircraft exhaust in significant amounts (Masiol and Harrison 2015).
Direct measurements of turbojets emissions have shown that UFPs are of two types: nonvolatile black carbon and nucleated sulfurous particles (Petzold et al. Citation2011). Particles emitted from aircraft engines are described by a bi-modal distribution with a size emission peaking in the nucleation mode at 10–20 nm (Keuken et al. Citation2015) and another mode between 30 and 100nm (US/EPA Citation2019) with higher particle counts compared to emission from diesel engines (AQEG Citation2018; Winther et al. Citation2015). UFPs around airports were also found much higher than previously believed (Hsu et al. Citation2013; Hudda et al. Citation2014; Keuken et al. Citation2015; Lopes et al. Citation2019; Rahim, Pal, and Ariya Citation2019; Weichenthal et al. Citation2016). Several studies across the world have identified that airports are hotspots of air pollution (Westerdahl et al. Citation2008; Rahim, Pal, and Ariya Citation2019; Touri et al. Citation2013), more specifically of PAHs (Touri et al. Citation2013 and references therein) and UFPs (among others Hudda et al. Citation2014 in Los Angeles, USA; Hofman et al. Citation2016; Keuken et al. Citation2015 for Amsterdam, Netherlands; Weichenthal et al. Citation2016 in Toronto, Canada; Lopes et al. Citation2019 for Lisbon, Portugal,; Rahim, Pal, and Ariya Citation2019 in Montreal, Canada). These studies also indicate that UFPs concentration are higher downwind of the airport. First, Hudda et al. (Citation2014) using a mobile monitoring approach detected up to 4–5 fold increase at distances 8–10 km downwind of Los Angeles airport. Similarly, in Europe, Keuken et al. (Citation2015) made measurements at a site located 7 km of Schipol airport and when the wind direction was from the airport, a threefold increase of UFP number was observed. Other researchers (Riley et al. Citation2016 in USA; Lopes et al. Citation2019 in Portugal) have confirmed these results. Westerdahl et al. (Citation2008) computed that between different sites (upwind vs. downwind) at the Los Angeles airport differences could be up to about a 100-fold increase in particle counts, a 134-fold increase in NOx, and a 12-fold increase in black carbon (900 m behind the plume of a jumbo jet taking off). Other studies in North America include Weichenthal et al. (Citation2016) using mobile monitoring and land-use regression model suggest a similar issue of UFPs hotspot in the vicinity of the Lester B. Pearson airport in Toronto (Canada). In addition, in the Montreal region, nanoparticles measured at or near airports are an order of magnitude higher than anywhere else including downtown (Rahim, Pal, and Ariya Citation2019). Similarly, Lopes et al. (Citation2019) found that 10-min means of particle counting increased 18–26 fold at locations near the airport, and fourfold at locations up to 1 km distance to the airport. Note that airport emissions include not only aircraft engine exhaust, but also ground vehicles and power units (Unal et al. Citation2005). Collectively, all these studies leave no doubt about the need for more monitoring and modeling of UFPs at or near airports and to better characterize emission inventories at airports.
Air pollution emissions from the aviation sector have been subjected to less rigorous control than road traffic emissions (AQEG Citation2018; Harrison, Masiol, and Vardoulakis Citation2015). Lead and sulfur have been largely removed from fossil fuels in many sectors (e.g., terrestrial vehicles) but not for aviation (piston-powered or jet exhaust) (AQEG Citation2018; Clark Citation2014; EPA Citation2012; Masiol and Harrison 2015; Winther et al. Citation2015). For example, the upper limit of sulfur content typically allowed in kerosene is 3000 ppm versus 10 ppm in car gasoline (Masiol and Harrison 2015).
Current engine emissions control and emission factors (described in ICAO Citation1993) remain largely uncertain. For example, black carbon is measured using a metric called the “smoke number” which has been shown to largely underestimate (by a factor 3 to 10) the real emission rate from most jet engines. A new method has been proposed by ICAO, called FOA3 but Stettler et al. (Citation2013) have shown that it still underestimates significantly black carbon emission for jet aircrafts. The authors developed a new method called FOX to properly account for hydrocarbons emissions from aircraft. However, there is no indication of whether or not emission factors are being revised in the ICAO engine database suggesting a current underestimation of aircraft emissions.
No clear regulation and no routine monitoring exists on aircraft exhaust emissions at the current time at airport sites although ICAO (International Civil Aviation Organization) has provided standards for emissions of NOx, CO, hydrocarbons and smoke for landing and takeoff (ICAO Citation1993). However, recent literature (as mentioned above) shows that non-regulated pollutants (including UFPs) are found in excess of safe limits at or near airports. One of the cause, according to Lee and Mo (Citation2011), is that the aviation industry did not actively invest in truly innovative energy-saving technologies in aircraft systems. Most fuel efficiency improvements occurred before 1995 (related to the introduction of high bypass turbofan engines). According to Fleuti (Citation2008), airports should be scrutinized for the accountability of air emissions contributions to the local and regional air quality. Many researchers (Hudda et al. Citation2014; Masiol and Harrison Citation2014; Rahim, Pal, and Ariya Citation2019; Touri et al. Citation2013) recommend further environmental studies close to the airport to evaluate the fate of nanosize particles and other pollutants and health impact. More specifically, exposure studies combining dispersion models and population distribution are recommended (such as the study of Keuken et al. Citation2015) to get a better understanding on the potential impacts on the health of UFPs associated with airport activities. Simple measures could be adopted to reduce concentrations of CEPs related to aviation. Moore et al. (Citation2015) found that reducing the aromatic and sulfur content of jet fuel to near zero-values results in roughly a 10-fold decrease in aerosol number emitted per kilogram of fuel burned. Note that the use of biofuels can reduce about 50–70% of particle concentration number (Moore et al. Citation2017) which is another viable option.
Ambient air quality standards do not exist for CEPs in North America; therefore, they are not taken into account in current airport operations and planning. However, future airport-related planning and development should address CEPs exposures to communities around the airport especially those who are downwind of a particular airport (AQEG Citation2018). Aircraft emissions produce significant unburned hydrocarbons particles but ICAO (Citation1993) only refers to a lump sum of all hydrocarbons, which creates a significant gap of knowledge for emission inventories and on health impacts from the aviation sector (Masiol and Harrison 2015). Kerosene-based fuels have the potential to cause acute or persistent neurotoxic effects. However, scientific evidence is still lacking concerning the real health impact (Masiol and Harrison 2015). Most studies highlight the knowledge gaps about AQ near and at airports (emission inventory, chemical composition) with exposure to population, workers, and travelers. Masiol and Harrison (2015) have identified several gaps and sciences issues related to airport activities: 1) emission inventories at airports, 2) quantification of ozone precursors, 3) standardization of procedures for measurement of exhaust for regulatory purposes, 4) chemical and physical characterization of PM, 5) role of plumes aging on PM mass and composition, 6) assessment of health effects, and 7) identification of tracers for airport pollution sources.
Oil and gas development: ethane, propane and toluene as a tracer of emission sources and proxies for many CEPs
Another important issue in Canada (as well as in the rest of North America) is the fast development of unconventional oil and gas (especially hydraulic fracturing) which has raised concerns on the impact on the environment and on public health (Costa et al. Citation2017). Hydraulic fracturing and oil gas development occurs mostly in western provinces of Canada since a moratorium has been imposed in the province of Québec, in most of the Atlantic provinces and Yukon. It has been found difficult to correctly monitor air pollution near and over oil and gas development sites and evaluate their impacts for various reasons: 1) monitoring is costly, 2) sampling must take place over a long period to establish robust results, 3) emissions sources are located over private industrial properties and obtaining authorizations to monitor and at appropriate time is not guaranteed (Costa et al. Citation2017; Richardson and Ternes Citation2018 and references therein). Many studies have described in details the operations and associated pollution of oil and gas activities. The goal of this section is to identify the best pollution trackers of unconventional oil and gas development (HF and oil sands) which could somehow increase our knowledge and reduce uncertainties with respect to fugitive emissions. This aspect has been little addressed in the current literature.
Hydraulic fracturing (HF)
The past decade or so has seen a continued growth in the number of environmental studies on HF, with many addressing potential risks to the environment and health (Costa et al. Citation2017 and references therein). According to numerous authors (see the Special Issue in the Environmental Science and Technology Journal on HF; Sept. 2014), shale gas exploitation has been found to reduce CO2 emissions (as compared to coal-burning) but this gain could be offset by many factors associated with HF such as: 1) increasing energy use is actually slowing down the development of renewable sources of energy (due to lower price associated with HF), and 2) the emissions of fugitive methane and ozone precursors is more than previously thought (Small et al. Citation2014). The major contaminants associated with hydraulic fracturing are benzene, toluene, ethylbenzene, xylene, NOx, methane, ethane, and propane all of them having serious health impacts (www.psr.org) and contribute to ozone formation (and therefore to climate warming). Moreover, air toxins, and particulate matter are emitted from flaring, compressors, and engines. Health impacts are largely unknown from this rapidly developing industry. Among the few studies, one covering 128,862 births in rural Colorado found that congenital heart defects and neural tube deficits were associated to the HF pollution (McKenzie et al. Citation2014).
Vengosh, Mitch, and McKenzie (Citation2017), based on a review over 100 scientific papers, concluded that a major environmental priority related to HF is the quantification of fugitive methane emissions (which is often underestimated by a factor 10–40). Hydraulic fracturing technique exploits tight or low-porosity rock formation gas and oil deposits and consists of the high-pressure injection of millions of gallons of water with the addition of surfactants, sand, and chemicals (such as biocides) deep into the ground to fracture shales and extract natural gas or oil. Most HF development originally occurred in the U.S. with more than 7000 shale gas wells in Pennsylvania alone. However, HF is now quickly expanding to other countries (Richardson and Ternes Citation2018). In Canada, more than 175,000 wells have been horizontally fractured safely for gas or oil so far in the past 60 years, primarily in the western provinces (https://canada.chevron.com/environment/hydraulic-fracturing).
It is reported that fugitive emissions occur from HF (ethane, propane, methane, etc.) and that the ethane and propane increase in North America has been attributed to this industry, which has contributed to increase background tropospheric ozone in the western part of the U.S. (Dalsøren et al. Citation2018; NAS Citation2016) and likely in Western Canada (as reported by Robichaud and Ménard Citation2014; their table 5e shows an upward trend for all the percentiles up to the 95th). Moreover, methane is the second greenhouse gas in terms of radiative forcing and is 25 times more effective per molecule than carbon dioxide at 100-yr timescale (Lelielveld, Crutzen, and Dentener Citation1998). Methane is also a precursor of ozone and contributes to stratospheric water vapor and therefore has also an indirect influence on climate forcing. Air quality models (AQM) do not predict well-peak episodes in western rural areas in the U.S. due to the rapid development of this sector (NAS Citation2016 and references therein) and underestimation of HF emissions (Vengosh, Mitch, and McKenzie Citation2017). This phenomenon occurs especially in winter since ozone production is most sensitive to VOC emission during this season with several ozone precursors related to HF such as ethane, propane, and methane (Adgate, Goldstein, and McKenzie Citation2014). The ethane upward trend for atmospheric concentrations which has been noted over the past decade or so in North America matches the upward trend (2.9–4.7% per year) of ethane emissions (https://nar.ucar.edu/2015/acom/d2-ethane-emissions-inventory; Helmig et al. Citation2016). Although ethane and propane are non-carcinogenic and have low toxicity (https://toxnet.nlm.nih.gov), it turns out to that they seem perfect candidate for monitoring HF emissions (including methane) and may serve as proxies for a large basin of emerging pollutants since they are strongly correlated with many CEPs (see correlation matrix in Simpson et al. Citation2010). They are the longest-lived non-methane hydrocarbon, contributes to ozone formation, and are also precursors of aerosols (Seinfeld and Pandis Citation2006). Satellite total column measurements (from OMI) are available from satellite retrievals and show a global increase of ethane since 2009 (Franco et al. Citation2016). One sink of both ethane and methane is OH. Therefore, the fact that ethane is being underestimated in emission inventory has an impact on AQMs by producing underestimate OH which, in turn, impacts methane (Dalsøren et al. Citation2018). New studies done with AQMs have shown that ethane (and also propane) emissions has been underestimated by 50% and even more which in turns leads to underestimating methane by 0.5–0.7% in models. Since methane accumulates in the atmosphere (lifetime of about 12 years), this would give model long-term biases. Moreover, tropospheric ozone is also underestimated in AQMs by up to 5–13% due to ethane and propane underestimation in emission inventories (Dalsøren et al. Citation2018; Helmig et al. Citation2016). Monitoring ethane and propane correctly is a key to better understand the impact of HF on the atmospheric chemistry. Ethane and propane affect the formation and loss of many pollutants and greenhouse gases and also of aerosols (Dalsøren et al. Citation2018; Helmig et al. Citation2016). They are also among the most abundant VOC in the urban environment (e.g., ). While ethane and methane share the same sources of emission, methane has a long lifetime and is well-mixed and it is hard to identify its emission sources whereas ethane and propane sources are easier to trace back (Dalsøren et al. Citation2018). There is a lot of uncertainty on the methane leakage from HF sources (Costa et al. Citation2017) and ethane and propane monitoring (as “methane tracker”) could help to diminish uncertainties on methane emissions due to HF (Dalsøren et al. Citation2018). Moreover, ethane and propane affect the formation and loss of several other air pollutants and greenhouse gases. Since models tend to underestimate ethane and propane in the Northern Hemisphere (NAS Citation2016), it is important to adequately monitor ethane and propane for model verification and data assimilation purposes and to reduce overall uncertainty related to HF.
Alberta oil sands
Canada has the third-largest oil reserves in the world with 97% of its reserves located in the oil sands (www.canadasoilsands.ca). Published articles on the monitoring of emerging pollutants are limited concerning oil sands. Canadian studies tend to discuss monitoring over oil sands in terms of regulated pollutants (McLinden et al. Citation2016; Sioris et al. Citation2018). Among other interesting Simpson et al. (Citation2010, Citation2013) showed that clear statistical enhancements of concentrations occurred compared to local background values (see definition in S1 for background) from 1.9 up to 397 times for ethane and n-Heptane, respectively. Emission of BTEX (benzene, toluene, ethylbenzene, and xylene) and PAHs compounds are also often present in association with gas and oil development but only few reports are available. Measurements have shown that BTEX compounds were in excess from 7 up to 181 times the background over oil sands (Simpson et al. Citation2010). Toluene is considered as one of the key critical emerging pollutants in this review (see ) and turnout to be a good proxy for benzene, ethylbenzene, and xylene (mostly carcinogenic chemicals) since the coefficient of correlation of toluene with many toxics is often greater than 0.9 (Simpson et al. Citation2010). Note that 1,3-butadiene (high priority in ) was found in excess of more than 100 times over the oil sands region (Simpson et al. Citation2013). Propane is also a good proxy for tracking oil and gas emissions of emerging chemical compounds with a high coefficient of correlation (R > 0.7) for a majority of compounds sampled by Simpson et al. (Citation2010) over Alberta oil sands. Since toluene, ethane, and propane are the key to monitor unconventional oil and gas development (oil sands and HF pollution tracker), it is suggested to focus more and improve the monitoring of these compounds near oil sands. Comprehensive studies have been achieved by Canadian researchers who have demonstrated that many pollutants such as secondary organic aerosols (Liggio et al. Citation2016), gaseous organic acids (Liggio et al. Citation2017) and carbon dioxide (Liggio et al. Citation2019) may be underestimated for oil sands region of Alberta, Canada suggesting the need for enhanced monitoring, modeling, and emissions characterization of oil sands activity and associated emerging pollutants. Finally, it is worth mentioning the study of Makar et al. (Citation2018) who estimated, using a high-resolution regional model (GEM-MACH), the impact of oil sands in acidification of ecosystems in western Canada and found that the ecosystem damage (using 2013 emissions) would potentially occur over a large region (the spatial extent in exceedance of critical loads varied between 1 × 10⁴ and 3.3 × 10⁵ km2).
Excess of ammonia (NH3) increasing worldwide
Another critical rising issue is ammonia. The central role of ammonia in environmental problems is now becoming widely recognized. Gaseous ammonia reacts with sulfuric acid or nitric acid and contribute to the acidification, eutrophication and also affects biodiversity (Erisman et al. Citation2007; LRTAP Citation2016). Increase of ammonia (NH3) in the environment is considered as a worldwide critical emerging issue (Galloway et al. Citation2008). Excess of ammonia could be very detrimental to the environment (as a nitrogenous waste) being partly responsible for the recent rapid eutrophication of lakes and coastal waters (Callisto, Molozzi, and Etham Citation2014; Erisman et al. Citation2007). Galloway et al. (Citation2008) reports that increasing ammonia emissions combined with the pervasive inefficiencies in use could have unknown consequences on the nitrogen cycle. In Canada, ammonia emissions have increased by about 20% since during the period 1990–2016 according to NPRI (https://www.canada.ca/en/environment-climate-change/services/environmental-indicators/air-pollutant-emissions.html). Ammonia dispersed in the environment mainly originates from agricultural processes (e.g., livestock farming and fertilization), soil, and fossil fuel combustion (Buijsman, Mass, and Asman Citation1987). From a public health perspective, inhalation of ammonia can also cause bronchoconstriction and asthma on human and animal (Portejoie, Martinez, and Landmann Citation2002) and is also unpleasant with its pungent odor. Ammonia is globally increasing with the highest ammonia emissions produced in northern India and southeastern China (Van Damme et al. Citation2018). Global ammonia emissions from agriculture are projected to increase strongly in the future due to population growth (which needs more and more food) and increasing demand for biofuels. Ammonia contributes to nitrous oxide formation and may affect global warming (Höpfner et al. Citation2016). For example, biofuels production from corn in US or from sugar cane in Brazil is producing a rise in N2O emissions and ozone (two powerful greenhouse gases) that could cancel out any CO2 savings (Crutzen et al. Citation2008; Galloway et al. Citation2008 and references therein). According to Huang et al. (Citation2014), oxidation of ammonium in an intensively managed agricultural soils could be responsible to nearly half of N2O emissions to the atmosphere (a greenhouse gas with 298 times the potential of that of carbon dioxide). Ammonia is also a precursor gas that can react in the atmosphere to produce particulate matter (PM) such as ammonium nitrate (NH4NO3), ammonium sulfate ((NH4)2SO4), and ammonium hydrogen sulfate (NH4HSO4). Particles of ammonium salts can also attach to each other to form aerosol particles acting as condensation nuclei in cloud formation (Höpfner et al. Citation2016).
As of 2014, about 88% of the ammonia produced worldwide was used as fertilizers. Worldwide production of NH3 is on the rise as shown in . Roughly 60–85% of NH3 emissions in the United States are estimated to be associated from agricultural sources. Half of the industrial ammonia production is eventually lost to the environment with significant impacts on ecosystems (Erisman et al. Citation2007; Höpfner et al. Citation2016). Note, however, that part of the ammonia atmospheric gaseous current rise is associated with the decrease of the main reactive agents (NOx and SO2). Satellite observations suggest a significant increase of about 30% in tropospheric gas-phase NH3 in North China during 2008–2016. However, the estimated NH3 emissions decreased slightly by 7% in the same area (mostly due to changes in agricultural practices). During the same time, emissions of SO2 have rapidly declined by about 60% during the same time. By integrating measurements from ground and satellite, a long-term anthropogenic NH3 emission inventory, and chemical transport model simulations, Liu et al. (Citation2018) found that large SO2 emission reduction is responsible for the NH3 increase over the North China Plain (due to less ammonium sulfate formation). Similarly, Chan, Gantt, and McDow (Citation2018) have shown that the reduction of sulfates have produced a switch to winter PM2.5 concentration maxima in the United States now dominated by nitrate aerosols (instead of sulfates). This illustrates the difficulty of managing air quality since reducing a regulated pollutant can produce another one to emerge and produce new kinds of problem. That also suggests that no single strategy will work to reduce the adverse impact of excess nitrogen in the environment.
Figure 2. Worldwide production of ammonia (1998–2017). Raw data obtained from. Raw data obtained from https://www.usgs.gov/centers/nmic/mineral-commodity-summaries
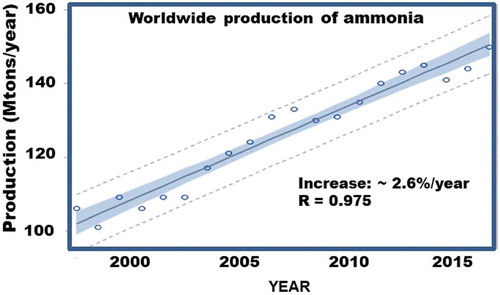
The satellite IASI interferometer developed by the Center National d’Études Spatiales (CNES) has recently identified previously undetected sources of ammonia. Van Damme et al. (Citation2018) were able to catalog 248 ammonia sources, two-thirds of which had previously never been identified. Since an increase in fertilizer use through increasing demands for food and biofuels is expected, better management of ammonia or abatement is necessary (Erisman et al. Citation2007). According to Van Damme et al. (Citation2018), EDGAR emission inventory should be updated. Although it agrees with IASI, it underestimates global ammonia by an order of magnitude in 66% of the time.
This is not surprising since agriculture is expanding and new cars emit more ammonia than before related to the fact that new vehicles are equipped with a three-way catalytic converter (Liu et al. Citation2014). Recently, a study monitoring urban concentrations showed levels of ammonia three times higher near-road compared to a site located in the urban background (SOCAAR Citation2019). This indicates that ammonia emission from the transportation sector might have been underestimated before since most of the monitoring sites are not based on near-road monitoring.
A network for measurement of ammonia has been set in US (AMoN). In Canada, a mapping algorithm for ammonia has been formulated by researchers using satellite data (Shephard and Cady-Pereira Citation2015) or using surface model-data fusion (Cole et al. Citation2018; Robichaud et al. Citation2018). Improved monitoring and management of ammonia is required to slow down eutrophication which is a very significant deterioration of the environment which is evolving rapidly across Canada and the rest of the world. Understanding better the emissions, transport, and fate of ammonia under various meteorological conditions (such as the study of Moravek et al. Citation2019; Wentworth et al. Citation2016) is necessary given the large impact of excess of ammonia on the environment.
Impact of climate change and population growth
In this final section, we briefly discuss how climate change and population growth exacerbate CEPs and critical emerging issues discussed above. First, due to an increase in temperature and frequency of droughts in some places and an increase of precipitation in other locations (IPCC Citation2013), several emerging issues (including those discussed above) could be significantly exacerbated. For example, increasing surface water temperature and precipitation (due to more intense storms washing out more chemicals into the waterways) combined with increasing nitrogenous waste lost in the environment (due to ammonia emission increase among others) will likely accelerate eutrophication in the future (Callisto, Molozzi, and Etham Citation2014). Given both increase of population and climate change, it is important to review agricultural practices in order to reduce the loss of ammonia in the environment (Galloway et al. Citation2008). For example, about 25% of the lakes in the province of Quebec (renowned for the abundance and purity of its lakes) have been categorized with various degrees of eutrophication due to agricultural practices (http://www.environnement.gouv.qc.ca/rapportsurleau/cartes/GR12_C03_Lac.htm).
Climate change is also affecting many other parts of ecosystems such as biological aerosol concentrations (pollen, bacteria, and fungal spores). The latter are expected to increase as well due to the higher fertilization effect of CO2 and increasing temperature that both favor plant growth, increase the length of the growing season and the associated biological emissions (D’Amato et al. Citation2015; Garneau et al. Citation2005). In general, climate change worsens respiratory health (NRDC Citation2015) and allergy problems (D’Amato et al. Citation2015). For example, ragweed plants have been shown to grow bigger, produce more pollen and extend their season under higher temperature and CO2. Ozone occurrence and ragweed are both likely to increase under climate change affecting the more allergic population (EPA Citation2008; NRDC Citation2015 and references therein). Birch pollen has been shown to be more allergenic under higher temperature (Ahlholm, Helander, and Savolainen Citation1998). Increase of biogenic emissions (such as isoprene and terpene precursors of secondary organic aerosols) which depends on temperature and other environmental parameters are also expected to affect photochemistry (e.g., formaldehyde, see Zhu et al. Citation2017b).
Other connection with climate change and the emerging issue discussed here include the ozone-climate penalty (see definition in Suppl. Material S1) and increase of wildfires (producing more CO, CO2, fine particles, and other related pollutants) which can, in turn, reinforce climate warming. Since air quality, climate change and population growth are connected, better mitigation strategies and interdisciplinary studies will be needed (Fiore, Vaishali, and Leibensperger Citation2015) especially in a context of increasing heat-urban island effects making some megacities more sensitive to climate change (Parrish et al. Citation2011 and references therein; Fiore, Vaishali, and Leibensperger Citation2015). Due to global warming, some existing pollutants sensitive to air temperature such as ground-level ozone and some other photochemical compounds could start increasing again due to increasing temperature, frequency and intensity of droughts and enhance peak ozone episodes, which have stabilized or decreased over the past decades (Jaffe and Zhang Citation2017). For example, Reid, Yap, and Bloxam (Citation2008) have estimated that the background ozone is increasing at a rate of 0.3 to 0.5 ppb per year while ozone concentration peaks are diminishing in North America (see Robichaud and Ménard Citation2014). The full description of the problem of reemerging ozone and other climate-sensitive chemical compounds is not part of the scope of this work and will be discussed in more details in a future publication.
Discussion and conclusion
Emerging contaminants often linked with new technologies reach the atmospheric environment from various anthropogenic sources and affect public health and other components of the environment. The aim of this manuscript is to provide a critical overview of knowledge around critical emerging pollutants and air quality issues. The document proposes a methodology for filtering lists of pollutants to select the critical emerging pollutants (see ). This manuscript also discusses selected emerging air quality issues, many of which are related to emerging pollutants. Note that the results of selected pollutants overall agree with the work of Galarneau et al. (Citation2016) and is also in agreement with the list of critical pollutants ranked by ANSES (Citation2018).
The lack of knowledge about emerging pollutants (especially near sources; i.e. near-road and near airports) may lead to erroneous conclusions concerning their modeling, monitoring, long-term trends and geographical mapping (e.g., through data fusion or data assimilation) and ultimately lead to inappropriate policies and regulations. It is necessary to reduce uncertainties concerning 1) the real health risk that these emerging pollutants pose on public health, 2) their impact on atmospheric chemistry and on the environment, and 3) their long-term trends. The burden of disease caused by air pollution shown by numerous epidemiological studies (mostly based on regulated pollutants such as ozone, NO2, and PM2.5) could also be partly caused by emerging pollutants (such as these identified in ) and their synergy with other components of the atmosphere (including other related pollutants, meteorological conditions, etc.). This is important to acknowledge that fact which is not much discussed in the current literature and which should be clarified in future health studies. Moreover, lack of appropriate monitoring of critical emerging pollutants (CEPs) restricts opportunities to verify air quality models (with respect to these CEPs) and to provide an adequate model forecast that protects public health. At the current moment, air quality forecasts and air quality indices only exist for regulated pollutants, which may not allow a full protection to the public against CEPs. For example, policies and actions to control or mitigate the impact of PM2.5 and PM10 will not necessarily work for UFPs (AQEG Citation2018; de Jesus et al. Citation2019).
The evolution of scientific knowledge and growing sources of emissions contributes to the identification of new toxic effects on health and/or on the environment. Despite scientific uncertainties, additional research, monitoring, and modeling of the CEPs and emerging issues discussed in this article would be in agreement with the “precautionary principle” (CEPA Citation1999) for guiding actions to protect the environment and health. The co-benefits of action on these CEPs and emerging issues include impacts on climate change (i.e., reduction of black carbon, tropospheric ozone, and methane; Fuller et al. Citation2018), as well as on existing environmental issues (i.e., eutrophication and acidification).
There are numerous gaps in knowledge about critical emerging pollutants and critical emerging issues. These include:
the physical characterization of many CEPs (emission, transport, deposition in the environment),
the chemical composition and size distribution of UFPs, BC, and diesel in different environments which has been under-studied (important from the perspective of source appointment and health studies),
emission factors and emission inventory for UFPs or other CEPs are more uncertain than for regulated pollutants (such as PM2.5 and PM10) especially in the context of rapidly developing technology (HF and oil sands) but also for growing industries (such as aviation, on-road freight transportation),
the specification of adequate monitoring protocols for some CEPS (e.g., ultrafine particles, acrolein) which could improve the capability to better monitor and forecast air quality,
the identification of the uncertainty and the role of CEPs on the burden of disease (gap in knowledge due to the lack of measurements and exposure data of CEPs). This represents a challenge especially for UFPs which have a high spatio-temporal variation in their concentrations,
the characterization of ecological effects of emerging issues on the impact on the global environment (e.g., ammonia),
the understanding of the synergy between CEPs (including bioaerosols) and other pollutants on its impact on health and the environment,
uncertainty about background values of CEPs (which are either missing or highly uncertain) and long-term trends of CEPs especially near sources (near-road, airports, maritime ports, industries),
poorly quantified emissions of ammonia and methane (emerging issues)
uncertainty of the local level of exposure of CEPs on the population (e.g., UFPs, arsenic, etc.) which requires adequate monitoring especially near-road, near industries and near airports,
code of good practices to mitigate the impact of many CEPs (e.g., reducing sulfur content in the aviation sector, better agriculture, and oil and gas practices).
No federal standards exist for air toxics in Canada (Galarneau et al. Citation2016). However, several provinces have set-up guidelines for many toxic compounds but they tend to be inconsistent from one province to another. Variation of up to two order of magnitudes exist for 24 h and 1-year period (). For example, for acrylonitrile, the standard is 0.12 µg/m3 (1 year) in Ontario and 12 µg/m3 in Quebec (a difference of 100 times). For butadiene, a factor of 6.67 difference exists between the two provinces (2.0 µg/m3 in Ontario, 0.3 µg/m3 in Quebec) but up to two order of magnitude higher than the European toxicological reference value of 0.06 µg/m3 (ANSES Citation2018). Moreover, many Canadian provinces have no air quality standards at all for CEPs. In addition, the NAPS monitoring network measure metals at only a few industrial sites in Canada (mostly in Western Canada). Therefore, there is a lack in addressing industrial pollution in Canada since it is not the mandate of NAPS to measure near industrial sites.
Table 4. Selected provincial guidelines with a factor of variability across provinces.
The methodology adopted to rank emerging pollutants was found appropriate, allows identifying and prioritize emerging pollutants. Given the importance of the emerging pollutants and the complexity of their chemical, biological and physical effects, increasing dialog with stakeholders and adopting a multidisciplinary approach to bring together air quality specialists, chemists, epidemiologists, toxicologists, environmental physicians and policymakers, among others is required to reduce uncertainties about CEPs and their related issues. Robust data on emerging contaminants (to increase knowledge of their fate, behavior, and environmental risk) are also lacking and inclusion of the critical emerging pollutants presented here () should be undertaken in air quality models (e.g., GEM-MACH in Canada). The prioritization scheme () and the literature overview presented here could be considered as a starting point. Reducing uncertainties of air pollution would not only improve public health and mitigate future costs related to mortality and morbidity but also protect the environment, achieve sustainable development, slow down climate change and ecosystem degrading as well as to reduce environmental injustice. On the short and on medium-term, adequate resources are necessary to manage emerging pollutants and issues to avoid further degradation of the environment. Addressing emerging pollutants and issues by providing new resources is not a threat to economic development. On the contrary, it may produce massive savings in health-care costs in the long run (Fuller et al. Citation2018; Lopes et al. Citation2019; Pinder, Adams, and Pandis Citation2007; Stiglitz Citation2019). An integrated air quality and greenhouse gas management plan in a context of sustainable development is necessary since there are many links between air quality, climate changes and energy issues and the environment. Air quality management faces multiple challenges (Fiore, Vaishali, and Leibensperger Citation2015). For example, long-range of transported greenhouse gases such as CH4, which is currently not regulated, is an important ozone precursor (Jacobson Citation2002). Pervasive use of ammonia for fertilization exacerbates eutrophication and also increase PM2.5 and N2O. Finally, an important aspect about new technology in which vigilance is needed is the increasing popularity of hybrid-diesel vehicles. These vehicles could, in theory, save up to 30% fuel (i.e. hybrid buses). However, in a real-world situation, an average economy of only 6% was achieved in a case study made on Hong-Kong buses. Moreover, although CO2 emissions were decreasing, N2O emissions (a much more powerful greenhouse gas than CO2) were increased by four times (Keramydas et al. Citation2018).
The links among air quality, climate change, energy, and environmental issues suggest that an integrated management plan would be the most appropriate for addressing these interconnected issues. This integrated approach would ensure that efforts to reduce a specific pollutant would not then inadvertently increase another pollutant leading to adverse impacts on the environment or on the climate (Fiore, Vaishali, and Leibensperger Citation2015). An improved understanding of the linkages between air quality, including of the emerging pollutants and issues, and climate is essential for informing policy decisions. Finally, given the high level of proof required for regulation (Grandjean and Landrigan Citation2006; Michaels Citation2008) applying the precautionary principle is also needed in air quality management. The science recommendations following this literature overview of emerging pollutants and issues include:
improved monitoring (including use of alternative methods such as unmanned aerial vehicles, low-cost sensors, passive samplers, proxies from satellite measurements, etc.), modeling, and characterization of emerging pollutants can improve understanding of population exposure especially in the vicinity of major airports, major roads, and industries. Continuous VOC monitoring is particularly important for epidemiological studies (currently VOCs are only available on an intermittent basis, e.g., 24-hour samples every 3,6 or 12 days in Canada),
scrutinize more and reinforce the monitoring and testing of emissions from the transportation sector for non-regulated pollutants such as UFPs, black carbon, naphthalene and others CEPs (), which may have significant health, environmental and climate change impacts (particularly from the aviation sector and new technology such as GDI for terrestrial vehicles),
reduce uncertainties to define adequate monitoring protocols concerning ultrafine particles, acrolein and other artifacts in the measurement system,
develop further land-use regression models to help mapping emerging pollutants having small-scale spatial gradients such as toluene, acrolein, and UFPs. There is a clear need for a thorough understanding of the spatio-temporal variation of UFPs and other relevant CEPs, giving their health impacts,
given the importance of ammonia excess on the deterioration of the environment, better agricultural practices (use of fertilizers, management of livestock waste) and incentives to reduce nitrogenous wastes from the agriculture sector and wastewater discharges from municipalities should be encouraged. Global EDGAR emission inventory for ammonia needs to be revisited significantly as ammonia emissions seen from satellite (IASI instrument) are significantly higher than in the global inventory,
develop the monitoring and modeling of biological pollution in Canada and promote the study of the interaction between pollen and pollutant. Characterizing bioparticles emission has been identified as a high priority by the US National Academy of Science (NAS Citation2016) given its impact on air quality, public health, and climate. Improvement of the science to produce biaoaerosols simulation (pollen, spores) and its relation to the pollution is desirable (since an important synergy exist between pollen and pollution, i.e. ragweed and ozone; birch pollen and diesel),
investigate the development of an air quality index that includes exposure to near-road pollution, air toxics and other CEPs (including polluen),
improve reporting of CEPs emission to national inventories such as the National Pollutant Release Inventory (NPRI) in Canada. Improved accuracy and trends in emission inventories are critical to adequately support air quality policies and better protect public health. Consistent accountability mechanisms and consistent reporting requirements should also be improved,
develop a geographical mapping of emerging pollutants (data fusion of air quality model and observations) to appropriately support epidemiological studies including CEPs similar to the work of Van Donkelaar et al. (Citation2010) for PM2.5 and Robichaud and Ménard (Citation2014) for ground-level ozone and PM2.5 and for other criteria air pollutants (Robichaud et al. Citation2016). Mobile apparatus should be prioritized given the high spatio-temporal variability of some CEPs (e.g., UFPs), and with near-road monitoring enhanced (SOCAAAR Citation2019),
continue to develop policies based on science,
a better coordinated approach to optimally meet both climate and air quality objectives (e.g., GDI, hybrid-diesel buses, agricultural practices, oil and gas industry, etc.) is needed. A quantitative understanding of the climate effects of emerging air pollutants and issues is critical in this respect.
Supplemental Material
Download MS Word (33.3 KB)Acknowledgment
The author wish to thank various reviewers at Environment and Climate Change Canada for their comments concerning this document: Rosa Wu, Maygan McGuire, Tom Harner, Elisabeth Galarneau, John Liggio, Kirill Semeniuk, Robin Stevens, Paul Makar as well as four external anonymous reviewers who have helped to improve this review.
Disclosure statement
No potential conflict of interest was reported by the author.
Supplementary material
The supplementary data for this article can be accessed here.
Additional information
Notes on contributors
Alain Robichaud
Alain Robichaud is an air quality research meteorologist with 25 years of experience and with a multidisciplinary background in studies related to air quality, aerobiology, meteorology and health impacts.
References
- ACI (Airports Council International). 2016. ACI annual report 2016. Accessed November 22, 2019. https://issuu.com/aciworld/docs/aci_annual_report_2016.
- Adgate, J. L., B. D. Goldstein, and L. M. McKenzie. 2014. Potential public health hazards, exposures and health effects from unconventional natural gas development. Env. Sci. Tech. 48:8307–20. doi:10.1021/es404621d.
- Ahlholm, J. U., M. L. Helander, and J. Savolainen. 1998. Genetic and environmental factors affecting the allergenicity of birch pollen (Betula pubescens ssp. Czerepanobii (Orl) Hämet-Ahti). Clin. Exp. Allergy 28:1384–88. doi:10.1046/j.1365-2222.1998.00404.x.
- Amato, F., M. Schaap, C. Reche, and X. Querol. 2013. Road traffic: A major source of particulate matter in Europe. Urban Air Qual. Eur. 26:165–93. doi:10.1007/698_2012_211.
- Amato, P., M. Ménager, M. Sancelme, P. Laj, G. Mailhot, and A. M. Delort. 2005. Microbial population in cloud water at the Puy de Dôme: Implications for the chemistry of clouds. Atmos. Environ. 39:4143–53. doi:10.1016/j.atmosenv.2005.04.002.
- ANSES. 2014. État des connaissances sur l’impact sanitaire lié à l’exposition de la population générale aux pollens présents dans l’air ambiant. Avis de l’Anses. Rapport d’expertise collective. Janvier 2014. Saisine n° 2011-SA-0151, French Agency for FoodEnvironmental and Occupational Health & Safety. Accessed December 20, 2018. https://www.anses.fr/fr/system/files/AIR2011sa0151Ra.pdf.
- ANSES. 2018. Polluants “émergents” dans l’air ambient. Rapport d’expertise collective. Juin 2018. Saisine n° 2015_SA_2016, French Agency for Food, Environmental and Occupational Health & Safety. Accessed December 20, 2018. https://www.anses.fr/fr/system/files/AIR2015SA0216Ra.pdf.
- AQEG. 2018. Ultrafine particles (UFP) in the UK. Air Quality Expert Group, Department for Environment, Food and Rural Affairs. http://uk-air.defra.gov.uk.
- Ariya, P. A., J. Sun, N. A. Eltouny, E. D. Hudson, C. T. Hayes, and G. Kos. 2009. Physical and chemical characterization of bioaerosols – Implications for nucleation processes. Int. Rev. Phys. Chem. 28:1–32. doi:10.1080/01442350802597438.
- Arsenault, T., D. L. Waugh, and D. H. S. Richardson. 2005. Report on the Halifax experiment pollen and spore forecast program. Meteorological Service of Canada, Atlantic Region. Science Report Series 2005-1, Environment Canada, Government of Canada, Darmouth, Canada.
- Arujo, J. A. 2011a. Particulate air pollution, systemic oxidative stress, inflammation, and atherosclerosis. Air Qual. Atmos. Health 4 (1):79–93. doi:10.1007/s11869-010-0101-8.
- Arujo, J. A. 2011b. Are ultrafine particles a risk factor for cardiovascular diseases? Rev. Esp. Cardiol. 64 (8):642–45. doi:10.1016/j.rec.2011.05.006.
- Arujo, J. A., B. Barajas, M. Kleinman, X. Wang, B. J. Bennett, K. W. Gong, M. Navab, J. Harlema, C. Sioutas, A. J. Lusis, et al. 2008. Ambient particulate pollutants in the ultrafine range promote early atherosclerosis and systemic oxidative stress. Circ. Res. 102 (5):589–96. doi:10.1161/CIRCRESAHA.107.164970.
- ATSDR. 1992. Toxicological profile for 1,3 butadiene. Atlanta, GA: Public Health Service, U.S. department of Health and Human Services.
- ATSDR. 1997. Toxicological profile for acrolein. Atlanta, GA: Public Health Service, U.S. department of Health and Human Services.
- ATSDR. 2000. Toxicological profile for methylene chloride. Atlanta, GA: Public Health Service, U.S. department of Health and Human Services.
- ATSDR. 2007. Toxicological profile for chloroform, tetrachloroethylene, trichloroethylene. Atlanta, GA: Public Health Service, U.S. department of Health and Human Services.
- ATSDR. 2015. Agency for Toxic Substances and Disease Registry Priority List. Accessed February 6, 2020. https://www.atsdr.cdc.gov/spl/resources/2015_atsdr_substance_priority_list.html
- ATSDR. 2017. Toxicological profile for toluene. Atlanta, GA: Public Health Service, U.S. department of Health and Human Services.
- ATSDR (Agency for Toxic Substances and Disease Registry). 1990. Toxicological profile for ethylene oxide. Atlanta, GA: Public Health Service, U.S. department of Health and Human Services.
- Baldauf, R. W., R. B. Devlin, P. Gehr, R. Giannelli, B. Hassett-Sipple, H. Jung, G. Martini, J. McDonald, J. D. Sacks, and K. Walker. 2016. Ultrafine particle metrics and research considerations: Review of the 2015 UFP workshop. Int. J. Environ. Res. Public Health 13:1054. doi:10.3390/ijerph13111054.
- Balducci, C., M. Perilli, and P. Romagnoli. 2012. New developments on emerging organic pollutants in the atmosphere. Environ. Sci. Pollut. Res. 19:1875–84. doi:10.1007/s11356-012-0815-2.
- Behrendt, H., and W. M. Becker. 2001. Localization, release and bioavailability of pollen allergens: The influence of environmental factors. Curr. Opin. Immunol. 13 (6):709–15. doi:10.1016/S0952-7915(01)00283-7.
- Behrendt, H., W. M. Becker, C. Fritzsche, W. Sliwa-Tomczok, J. Tomczok, K. H. Friedrichs, and J. Ring. 1997. Air pollution and allergy: Experimental studies on modulation of allergen release from pollen by air pollutants. Int. Arch. Allergy Immunol. 113 (1–3):69–74. doi:10.1159/000237511.
- Bové, H., E. Bongaerts, E. Slenders, E. M. Bijnens, N. D. Saenen, W. Gyselaers, P. Van Eyken, M. Plusquin, M. B. J. Roeffaers, M. Ameloot, et al. 2019. Ambient black carbon particles reach the fetal side of human placenta. Nat. Commun. 10:3866. doi:10.1038/s41467-019-11654-3.
- Brook, J. 2019. Health effects from exposure to ultrafine particles. Presented at the Workshop on ultrafine particle emissions from transportation, University of Toronto, September 18, Toronto, Canada.
- Buijsman, E., H. F. M. Mass, and W. A. H. Asman. 1987. Anthropogenic NH3 emissions in Europe. Atmos. Environ. 21:1009–22. doi:10.1016/0004698187902307.
- Burnett R., H. Chen, M. Szyszkowicz, N. Fann, B. Hubbell, C. Arden Pope III, J. S. Apte., M. Brauer, A. Cohen, S. Weichenthal, J. et al. 2018. Global estimates of mortality associated with long-term exposure to outdoor fine particulate matter. PNAS 115 (38):9592–97. doi:10.1073/pnas.1803222115.
- Buters, J. T., I. Weichenmeier, S. Ochs, G. Pusch, W. Kreyling, A. J. Boere, W. Schober, and H. Behrendt. 2010. The allergen Bet v 1 in fractions of ambient air deviates from birch pollen counts. Allergy 65:850–58. doi:10.1111/j.1398-9995.2009.02286.x.
- Buters, J. T., M. Thibaudon, M. Smith, R. Kennedy, A. Rantio-Lehtimäki, R. Albertini, G. Reeseg, B. Weberg, C. Galán, R. Brandaoi; The HIALINE working group, et al. 2012. Release of Bet v 1 from birch pollen from 5 European countries. Results from the HIALINE study. Atmos. Env. 55:496–505. doi:10.1016/j.atmosenv.2012.01.054.
- Cahill, T. M. 2014. Ambient Acrolein concentrations in coastal, remote, and urban regions in California. Environ. Sci. Technol. 48 (15):8507–13. doi:10.1021/es5014533.
- Calderon-Guarciduenas L., R. Maronpot, R. Torres-Jardon, C. Henriquez-Roldan, R. Schoonhoven, H. Acuna-Ayala, A. Villarreal-Calderon, J. Nakamura, R. Fernando, W. Reed, et al. 2003. DNA damage in nasal and brain tissues of canines exposed to air pollutants is associated with evidence of chronic brain inflammation and neurodegeneration. Toxicol. Pathol. 31:524–38. doi:10.1080/01926230390226645.
- Callisto, M., J. Molozzi, and B. J. L. Etham. 2014. Eutrophication of lakes. In Eutrophication: Causes, consequences and control, ed. A. A. Ansari and S. S. Gill, 55–71. Dordrecht: Springer Science+Business Media. ISBN 978-94-007-7814-6. doi:10.1007/978-94-007-7814-6_5.
- Cao, C., W. Jiang, B. Wang, J. Fang, J. Lang, G. Tian, J. Jiang, and T. F. Zhu. 2014. Inhalable microorganisms in Beijing’s PM2.5 and PM10 pollutants during a severe smog event. Environ. Sci. Technol. 48 (3):1499–507. doi:10.1021/es4048472.
- Card, J. W., D. C. Zelder, J. C. Bonner, and E. R. Nestmann. 2008. Pulmonary applications and toxicity of engineered nanoparticles. Am. J. Physiol. Lung Cell. Mol. Physiol. 295 (3):L400. doi:10.1152/ajplung.00041.2008.
- Catto, C., G. Charest-Tardif, M. Rodriguez, and R. Tardif. 2012. Assessing exposure to chloroform in swimming pools using physiologically based toxicokinetic modeling. Environ. Pollut. 1. doi:10.5539/ep.v1n2p132.
- CEPA. 1999. List of toxic substances managed under CEPA (Canadian environmental protection act) (schedule 1). Accessed August 3, 2019. www.ec.gc.ca/toxiques-toxics/.
- Chan, E. A. W., B. Gantt, and S. McDow. 2018. The reduction of summer sulfate and switch from summertime to wintertime PM2.5 concentration maxima in the United States. Atmos. Env. 175:25–32. doi:10.1016/j.atmosenv.2017.11.055.
- Chathurika, M. R., N. Metwali, T. Jayarathne, J. Kettler, Y. Huang, P. S. Thorne, P. T. O’Shaughnessy, and E. A. Stone. 2017. Influence of rain on the abundance of bioaerosols in fine and coarse particles. Atmos. Chem. Phys. 17:2459–75. doi:10.5194/acp-17-2459-2017.
- Chen, H., J. C. Kwong, R. Copes, K. Tu, J. P. Villeneuve, and A. van Donkelaar. 2017. Living near major roads and the incidence of dementia, Parkinson’s disease, and multiple sclerosis: A population-based cohort study. The Lancet 389 (10007):718–26. doi:10.1016/S0140-6736(16)32399-6.
- Clark, P. 2014. Air quality: An emerging issue in the airport industry. Paper presented at the Aerospace International Research Conference 16. Accessed August 3, 2019. https://commons.erau.edu/aircon/2014_Challenges_Facing_our_Industry/january-18-2014/16.
- CMA (Canadian Medical Association). 2008. No breathing room: National illness costs of air pollution. Summary report, August. Accessed August 1, 2019. https://www.cma.ca/en/Pages/cma_default.aspx.
- Cole, A. S., A. Robichaud, M. D. Moran, A. Lupu, M. Shaw, M. Beauchemin, G. Roy, and V. Fortin. 2018. Total nitrogen deposition by measurement-model fusion using ADAGIO. Poster presentation. AGU fall meeting, Washington, D.C., December 10–14.
- Costa, D., J. Jesus, D. Branco, A. Danko, and A. Fliuza. 2017. Extensive review of shale gas environmental impacts from scientific literature (2010-2015). Environ. Sci. Pollut. Res. doi:10.1007s/s11356-017-8790-0.
- Crouse, D. L., P. A. Peters, P. Hystad, J. R. Brook, A. van Donkelaar, R. V. Martin, P. J. Jerrett, M. S. Goldberg, C. A. Pope 3rd, M. Brauer, et al. 2015. Ambient PM2.5, O₃, and NO₂ exposures and associations with mortality over 16 years of follow-up in the Canadian census health and environment cohort (CanCHEC). Env. Health. Perspect. 123 (11):1180–86. doi:10.1289/ehp.1409276.
- Crutzen, P. J., A. R. Mosier, K. A. Smith, and W. Winiwarter. 2008. N2O release from agro-biofuel production negates global warming reduction by replacing fossil fuels. Atmos. Chem. Phys. 8:389–95. doi:10.5194/acp-8-389-2008.
- D’Amato, G., S. T. Holgate, R. Pawankar, D. K. Ledford, L. Cecchi, M. Al-Ahmad, F. Al-Enezl, S. Al-Muhsen, I. Ansotegui, C. E. Baena-Cagnani, et al. 2015. Meteorological conditions, climate change, new emerging factors, and asthma and related allergic disorders. A statement of the World Allergy Organization. World Allergy Organ. J. 8:25. doi:10.1186/s40413-015-0073-0.
- Dales, R. E., S. Cakmak, S. Judek, and F. Coates. 2008. Tree pollen and hospitalization for asthma in urban Canada. Int. Arch. Allergy Immunol. 146:241–47. doi:10.1159/000116360.
- Dales, R. E., S. Cakmak, S. Judek, T. Dann, F. Coates, J. R. Brook, and R. T. Burnett. 2004. Influence of outdoor aeroallergens on hospitalization for asthma in Canada. Environ. Occup. Disord. doi:10.1016/j.jaci.2003.11.016.
- Dalsøren, S. B., G. Myhre, Ø. Hodnebrog, C. Lund Myhre, A. Stohl, I. Pisso, S. Schwietzke, L. Höglund-Isaksson, D. Helmig, S. Reimann, et al. 2018. Discrepancy between simulated and observed ethane and propane levels explained by underestimated fossil emissions. Geoscience. doi:10.1038/s41561-018-0073-0.
- de Blas, M., P. Ibáñez, J. A. García, M. C. Gómez, M. Navazo, L. Alonso, N. Durana, J. Iza, G. Gangoiti, and E. S. de Cámara. 2019. Summertime high resolution variability of atmospheric formaldehyde and non-methane volatile organic compounds in a rural background area. Sci. Total Environ. 647:862–77. doi:10.1016/j.scitotenv.2018.07.411.
- de Jesus, A. L., M. M. Rahman, M. Mazaheri, H. Thompson, L.D. Knibbs, C. Jeong, G. Evans, W. Nei, A. Ding, L. Qiao, et al. 2019. Ultrafine particles and PM2.5 in the air of cities around the world: Are they representative of each other? Environ. Int. 129:118–35. doi:10.1016/j.envint.2019.05.21.
- de Weger, L. A., K. C. Bergmann, A. Rantio-Lehtimäki, A. Dahl, J. T. Buters, J. Déchamp, and J. Belmonte. 2013. Impact of pollen. In Allergenic pollen, A review of the production, release, distribution and health impacts, Chap. 6., ed. M. Sofiev and K. C. Bergmann, 256. Dordrecht: Springer Science+Business Media. ISBN 978-94-007-4880-4e-ISBN 978-94-94-007-4881-1. doi:10.1007/978-94-007-4881-1_6.
- Delort, A. M., P. Amato, M. Sancelme, and P. Laj. 2011. Do microorganisms play a role in cloud chemistry? In Aerobiological monographs. Towards a comprehensive vision, ed. B. Clot, P. Comtois, and B. Escamilla-Garcia, Vol. 1, 133–53. Canada: MeteoSwiss (CH) and Université de Montréal. ISBN 978-2-8399-0466-7.
- Donaldson, K., L. Tran, A. Jimenez, R. Duffin, D. E. Newby, N. Mills, W. Macnee, and V. Stone. 2005. Combustion-derived nanoparticles: A review of their toxicology following inhalation exposure. Particle. Fibre Toxicol. 2:10. doi:10.1186/1743-8977-2-10.
- Duncan, B. N., L. N. Lamsal, A. M. Thompson, Y. Yoshida, Z. Lu, D. G. Streets, M. M. Hurwitz, and K. E. Pickering. 2016. A space-based, high-resolution view of notable changes in urban NOx pollution around the world (2005–2014). J. Geophys. Res. Atmos. 121 (2):976–96. doi:10.1002/2015JD024121.
- ECCC (Environment and Climate Change Canada). 2017. National inventory report 1990-2015. Greenhouse gas sources and sinks in Canada. https://www.canada.ca/en/environment-climate-change/services/climate-change/greenhouse-gas-emissions/inventory.html.
- ECCC (Environment and Climate Change Canada). 2019. National pollutant release inventory: Facility search. Accessed October 16, 2019. http://ec.gc.ca/inrp-npri/donnees-data/index.cfm?lang=En.
- EFCA (European Federation of Clean Air and Environmental Protection Associations). 2019. Ultrafine particles – air quality and climate. 7th International Symposium, Brussels, May 15-16. http://ufp.efca.net.
- Efstathiou, C., S. Isukapalli, and P. Georgopoulos. 2011. A mechanistic modeling system for estimating large scale emissions and transport of pollen and co-allergens. Atmos. Environ. 45 (13):2260–76. doi:10.1016/j.atmosenv.2010.12.008.
- Emami, F., M. Masiol, and P. K. Hopke. 2018. Air pollution at Rochester, NY: Long-term trends and multivariate analysis of upwind SO2 source impacts. Sci. Total Environ. 612:1506–15. doi:10.1016/j.scitotenv.2017.09.026.
- EPA. 2008. Review of the impacts of climate variability and change on aeroallergens and their associated effects. Report EPA/600/R-06/164F. Accessed January 31, 2017. www.epa.gov.
- EPA. 2010. Emerging contaminants- nanomaterials. Accessed September 2, 2019. https://archive.epa.gov/region9/mediacenter/web/pdf/emerging_contaminant_nanomaterials.pdf.
- EPA. 2011. Technical support document, national-scale air toxics assessment, NATA TSD. United States Environmental Protection Agency. Accessed January 31, 2017. https://www.epa.gov/sites/production/files/2015-12/documents/2011-nata-tsd.pdf.
- EPA. 2012. What are the six common air pollutants? Accessed October 20, 2019. www.epa.gov/air/urbanair.
- Erisman, J. W., A. Bleeker, J. Galloway, and M. S. Sutton. 2007. Reduced nitrogen in ecology and the environment. Environmen. Pollut. 150:140–49. doi:10.1016/j.envpol.2007.06.033.
- Fiore, A. M., N. Vaishali, and E. M. Leibensperger. 2015. Air quality and climate connections. J. Air Waste Manage. Assoc. 65 (6):645–85. doi:10.1080/10962247.2015.1040526.
- Fleuti, E. 2008. Local air quality: A growing concern to airport management. J. Airport Manage. 2 (2):115–19.
- Frampton, M. W., and D. Q. Rich. 2016. Does particle size matter? Ultrafine particles and hospital visits in Eastern Europe. Am. J. Respir. Crit. Care Med. 194 (10):1180–82. doi:10.1164/rccm.201606-1164ED.
- Franco, B., E. Mahieu, L. K. Emmons, Z. A. Tzompa-Sosa, E. V. Fischer, K. Sudo, B. Bovy, S. Conway, D. Griffin, J. W. Hannigan, et al. 2016. Evaluating ethane and methane emissions associated with the development of oil and natural gas extraction in North America. Environ. Res. Lett. 11:044010. doi:10.1088/1748-9326/11/4/044010.
- Frölich-Nowoisky, J., C. J. Kampf, B. Weber, J. A. Huffman, C. Pöhlker, M. O. Andreae, N. Lang-Yona, S. M. Burrows, S. S. Gunthe, W. Elbert, et al. 2016. Bioaerosols in the earth system: Climate, health, and ecosystem interactions. Atmos. Res. 182:346–76. doi:10.1016/j.atmosres.2016.07.018.
- Fuller, R., E. Rahoma, S. Fisher, J. Caravanos, D. Webb, D. Kass, T. Matte, and P. Landrigan. 2018. Comment: Pollution and non-communicable disease: Time to end the neglect, vol 2. www.thelancet.com/planetary-health.
- Galarneau, E., D. Wang, E. Dabek-Zlotorzynska, M. Siu, V. Celo, M. Tardif, D. Harnish, and Y. Jiang. 2016. Air toxics in Canada measured by the national air pollution surveillance (NAPS) program and their relation to ambient air quality guidelines. J. Air Waste Manage. Assoc. 66 (2):184–200. doi:10.1080/10962247.2015.1096863.
- Galloway, J. N., A. R. Townsend, J. W. Erisman, M. Bekunda, C. Zucong, J. R. Freney, L. A. Martinelli, S. P. Seitzinger, and M. A. Sutton. 2008. Transformation of the nitrogen cycle: Recent trends, questions, and potential solutions. Science 320:889–92. doi:10.1126/science.1136674.
- Garneau, M., M. C. Breton, F. Guay, L. Héguy, D. Chaumont, and M. F. Sottile. 2005. Hausse des concentrations des particules organiques (pollen et spores) et ses conséquences potentielles sur les maladies respiratoires des populations vulnérables en milieu urbain et projection des impacts sous l’effet du changement climatique. Projet A-571. Rapport final présenté au Fonds d’action au changement climatique, Ministère des Ressources Naturelles du Canada.
- GBD (Global Burden of Disease 2015). 2016. Mortality and causes of death collaborators. Global, regional, and national life expectancy, all-cause mortality, and cause-specific mortality for 249 causes of death, 1980–2015: A systematic analysis for the global burden of disease study 2015. Lancet 388:1459–544. doi:10.1016/S0140-6736(16)31012-1.
- Gervais, P. 1994. Maladie asthmatique et aggression chimique. Rev. Fr. Allergol. 34 (5):403–07. doi:10.1016/S0335-7457(05)80250-3.
- Gomes, A. R., C. Justino, T. Rocha-Santos, A. C. Freitas, A. C. Duarte, and R. Pereira. 2017. Review of the ecotoxicological effects of emerging contaminants to soil biota. J. Environ. Sci. Health Part A 52 (10):992–1007. doi:10.1080/10934529.2017.1328946.
- Gonet, T., and B. A. Maher. 2019. Magnetic properties of brake wear emissions. Scientific poster presented at IUGG Symposium, Montreal, Canada, July 8-18.
- González, Y., S. Rodríguez, J. C. Guerra García, J. L. Trujillo, and R. García. 2011. Ultrafine particles pollution in urban coastal air due to ship emissions. Atmos. Env. 45:4907–14. doi:10.1016/j.atmosenv.2011.06.002.
- Government of Canada. 2018. Follow-up report to the house of commons standing committee on environment and sustainable development on the Canadian environmental protection act, 1999. https://www.canada.ca/en/environment-climate-change/services/canadian-environmental-protection-act-registry/review/standing-committee-report-cepa-2018.html.
- Grandjean, P., and P. J. Landrigan. 2006. Developmental neurotoxicity of industrial chemicals. Lancet 368:2167–78. doi:10.1016/S0140-6736(06)69665-7.
- Gribble, G. W. 2009. Naturally occurring organohalogen compounds. New York, USA: Springer. ISBN 978-3211993248.
- Guenther, A., T. Karl, P. Harley, C. Wiedinmyer, P. J. Palmer, and C. Geron. 2006. Estimates of global terrestrial isoprene emissions using MEGAN (Model of emissions of gases and aerosols from nature). Atmos. Chem. Phys. 6:3181–210. doi:10.5194/acp-6-3181-2006.
- Gwinn, M. R., and V. Vallyathan. 2006. Nanoparticles: Health effects – Pros and Cons. Environ. Health Perspect. 114 (12):1818–25. doi:10.1289/ehp.8871.
- Hak, C., I. Pundt, S. Trick, C. Kern, U. Platt, J. Dommen, B. R. J. Larsen, J. Mellqvist, A. Strandberg, Y. Yu, et al. 2005. Intercomparison of four different in-situ techniques for ambient formaldehyde measurements in urban air. Atmos. Chem. Phys. 5 (11):2881–900. doi:10.5194/acp-5-2881-2005.
- Harrison, R. M., M. Masiol, and S. Vardoulakis. 2015. Civil aviation, air pollution and human health. Environ. Res. Lett. 10:041001. doi:10.1088/1748-9326/10/4/041001.
- Health Canada. 2017. Health impacts of air pollution in Canada. An estimate of premature mortalities. Accessed May 30, 2019. http://publications.gc.ca/collections/collection_2018/sc-hc/H144-51-2017-eng.pdf.
- HEI, Review Panel. 2013. Understanding the health effects of ambient ultrafine particles. Health Effect Institute. HEI (Health Effects Institute), Boston, MA. https://www.healtheffects.org/publication/understanding-health-effects-ambient-ultrafine-particles.
- Helmig, D., S. Rossabi, J. Hueber, P. Tans, S. A. Montzka, K. Masarie, K. Thoning, C. Plass-Duelmer, A. Claude, L. J. Carpenter, et al. 2016. Reversal of global atmospheric ethane and propane trends largely due to U.S. oil and natural gas production. Nat. Geosci. 9:490–95. doi:10.1383ngeoO2721.
- HIS. 2017. GDI market penetration. Accessed 29 September, 2019. https://www.aftonchemical.com/Generic/PFI-vs-GDI?lang=fr-FR#.
- Hofman, J., J. Staelens, R. Cordell, C. Stroobants, N. Zikova, S. M. L. Hama, K. P. Wyche, G. P. A. Kos, S. Van Der Zee, K. L. Smallbone, et al. 2016. Ultrafine particles in four European urban environments: Results from a new continuous long-term monitoring network. Atmos. Environ. 136:68–81. doi:10.1016/j.atmosenv.2016.04.010.
- Höpfner, M., R. Volkamer, U. Grabowski, M. Grutter, J. Orphal, G. Stiller, T. von Clarmann, and G. Wetzel. 2016. First detection of ammonia (NH3) in the Asian summer monsoon upper troposphere. Atmos. Chem. Phys. 16 (22):14357. doi:10.5194/acp-16p-16-14357-2016.
- Hsu, H. H., G. Adamkiewicz, E. Andres Houseman, D. Zarubiak, J. D. Spengler, and J. I. Levy. 2013. Contributions of aircraft arrivals and departures to ultrafine particle counts near Los Angeles international airport. Sci. Total Environ. 444:347–55. doi:10.1016/j.scitotenv.2012.12.010.
- Huang, T., B. Gao, H. Xiao-Kang, L. Xing, R. Well, P. Christie, L. R. Bakken, and J. Xiao-Tang. 2014. Ammonia-oxidation as an engine to generate nitrous oxide in an intensively managed calcareous Fluvio-aquic soils. Sci. Rep. 4:3950. doi:10.1038/srep03950.
- Hudda, N., T. Gould, K. Hartin, T. V. Larson, and S. A. Fruin. 2014. Emissions from an international airport increase particle number concentrations 4-fold at 10 km downwind. Environ. Sci. Technol. 48:6628–35. doi:10.1021/es5001566.
- IARC. 1987. Monographs on the evaluation of Carcinogenic risk to humans. Arsenic and arsenic compound. Geneva, Switzerland: WHO.
- IARC. 1999. Re-evaluation of some organic chemicals, hydrazine and hydrogen peroxide (Part 1, Part 2, Part 3). IARC Monographs on the Evaluation of Carcinogenic Risks to Humans Volume 71. Accessed October 16, 2019. https://publications.iarc.fr/89.
- IARC. 2006. Monographs on the evaluation of Carcinogenic risk to humans. Formaldehyde. Accessed August 3, 2019. https://monographs.iarc.fr/wp-content/uploads/2018/06/mono100F-29.pdf.
- IARC. 2018. 1,3-Butadiene. Accessed April 16, 2019. https://monographs,iarc.fr/wp-content/uploads/2018/06/mono71-8.pdf.
- ICAO – International Civil Aviation Organization. 1993. Environmental protection. Annex 16, Vol. II, 2nd ed. Montreal, Canada: Aircraft Engine Emissions.
- IEA (International Energy Agency). 2019. Commentary: Growing preference for SUVs challenges emissions reductions in passenger car market. https://www.iea.org/newsroom/news/2019/october/growing-preference-for-suvs-challenges-emissions-reductions-in-passenger-car-mark.html.
- IISD (International Institute for Sustainable Development). 2017. Costs of pollution in Canada. Measuring the impacts on families, business and governments. ISBN 978-1-894784-76-4. Accessed April 16, 2019. https://www.iisd.org/sites/default/files/publications/costs-of-pollution-in-canada.pdf.
- IPCC. 1999. Aviation and the global atmosphere. In Prepared in collaboration with the scientific assessment panel to the Montreal protocol on substances that Deplete the Ozone layer, ed. J. E. Penner, D. H. Lister, D. J. Griggs, D. J. Dokken, and M. McFarland. U.K.: Cambridge University Press. Accessed April 2, 2019. http://www.cambridge.org/ch/academic/collections/ipccreports.
- IPCC. 2013. Climate change 2013: The physical science basis. In Contribution of working group I to the fifth assessment report of the intergovernmental panel on climate change, ed. T. F. Stocker, D. Qin, G.-K. Plattner, M. Tignor, S. K. Allen, J. Boschung, A. Nauels, Y. Xia, V. Bex, and P. M. Midgley, 1535. Cambridge, UK: Cambridge University Press.
- Jacobson, M. 2002. Atmospheric pollution. History, science and regulation. Cambridge, England: Cambridge University Press.
- Jaenicke, R., S. Matthias-Maser, and S. Gruber. 2007. Omnipresence of biological material in the atmosphere. Environ. Che. 4:217–20. doi:10.1071/EN07021.
- Jaffe, D. A., and L. Zhang. 2017. Meteorological anomalies lead to elevated O3 in the western U.S. in June 2015. Geophys. Res. Lett. 44:1990–97. doi:10.1002/2016GL072010.
- Jelks, M. 1987. Allergy plants: That cause sneezing and wheezing, 64. World Wide Publication. ISBN: 0-911977 04-X.
- Jeong, C. H., P. K. Hopke, D. Chalupa, and M. Utell. 2004. Characteristics of nucleation and growth events of ultrafine particles in Rochester, NY. Environ. Sci. Technol. 38:1933–40. doi:10.1021/es034811p.
- Jia, C., and S. Batterman. 2010. A critical review of naphthalene sources and exposures relevant to indoor and outdoor. Air Int. J. Environ. Res. Public Health 7 (7):2903–39. doi:10.3390/ijerph7072903.
- Kelly, F. J., and J. C. Fussell. 2012. Size, source and chemical composition as determinants of toxicity attributable to ambient particulate matter. Atmos. Environ. 6:504–26. doi:10.1016/j.atmosenv.2012.06.039.
- Keramydas, C., G. Pappadopoulos, L. Ntziachristos, T.-S. Lo, K.-L. Ng, H. L. Anson Wong, and C. Ka-Lok Wong. 2018. Real-world measurement of hybrid buses fuel consumption and pollutant emissions in a metropolitan urban road network. Energies 11:2569. doi:10.3390/en11102569.
- Keuken, M. P., M. Moerman, P. Zandveld, J. S. Henzing, and G. Hoek. 2015. Total and size-resolved particle number and black carbon concentrations in urban areas near Schipol airport (the Netherlands). Atmos. Environ. 104:132–42. doi:10.1016/j.atmosenv.2015.01.015.
- Klein, T., J. Kukkonen, A. Dahl, E. Bossioli, A. Baklanov, A. F. Vik, P. Agnew, K. D. Karatzas, and M. Sofiev. 2012. Interactions of physical, chemical, and biological weather calling for an integrated approach to assessment, forecasting and communication of air quality. Ambio 41:851–64. doi:10.1007/s/13280-012-0288-z.
- Knol, A. B., J. J. de Hartog, H. Boogaard, P. Slottje, J. P. van der Sluijs, E. Lebret, F. R. Cassee, J. A. Wardekker, J. G. Ayres, P. J. Borm, et al. 2009. Expert elicitation on ultrafine particles: Likelihood of health effects and causal pathways. Part. Fibre Toxicol. doi:10.1186/1743-8977-6-19.
- Knox, R. B., C. Suphioglu, P. Taylor, R. Desai, H. C. Watson, J. L. Peng, and L. A. Bursill. 1997. Major grass pollen allergen Lol p1 binds to diesel exhaust particles: Implications for asthma and air pollution. Clin. Exp. Allergy 27:246–51. PMID: 9088650.
- Kumar, P., A. Robins, S. Vardoulakis, and R. Britter. 2010. A review of the characteristics of nanoparticles in the urban atmosphere and the prospects for developing regulatory controls. Atmos. Environ. 44:5035–52. doi:10.1016/j.atmosenv.2010.08.016.
- Kumar, P., L. Pirjola, M. Ketzel, and R. M. Harrison. 2013. Nanoparticle emissions from 11 non-vehicle exhaust sources- A review. Atmos. Environ. 67:252–77. doi:10.1016/j.atmosenv.2012.11.011.
- Laaidi, K., M. Laaidi, and J. P. Besancenot. 2002. Synergie entre pollens et polluants chimiques de l’air: Les risques croisés. Environ. Risques et santé 1 (1):42–49.
- Laaidi, M., T. Chinet, and P. Aegerter. 2011. Allergies au pollen, pollution et climat: Revue de la littérature. Rev. Fr. Allergol. 51:622–28. doi:10.1016/j.reval.2011.05.004.
- Lacroix, G. 2005. Allergies respiratoires, pollens et polluants. Archives des Maladies Professionnelles et de L’Environnement Elsevier Masson 66:584–91. Ineris-00961897. doi:10.1016/S1775-8785(05)79161-X.
- Lee, D. S., D. W. Fahey, P. M. Forster, P. J. Newton, R. C. N. Wit, L. L. Lim, B. Owen, and R. Sausen. 2009. Aviation and global climate change in the 21st century. Atmos. Environ. 43 (22–23):3520–37. doi:10.1016/j.atmosenv.2009.04.024.
- Lee, J., and J. Mo. 2011. Analysis of technological innovation and environmental performance improvement in aviation sector. Int. J. Environ. Res. Public Health 8:3777–95. doi:10.3390/ijerph8093777.
- Lee, Y. N., X. Zhou, L. I. Kleinman, L. J. Nunnermacker, S. R. Springston, P. H. Daum, L. Newman, W. G. Keigley, M. W. Holdren, C. W. Spicer, et al. 1998. Atmospheric chemistry and distribution of formaldehyde and several multioxygenated carbonyl compounds during the 1995 Nashville/Middle Tennessee Ozone study. Journal of Geophys. Research. doi:10.1029/98JD01251.
- Légifrance. 2010. Code de l’environnement. Accessed 28 March, 2019. http://www.legifrance.gouv.fr.
- Lelielveld, J., P. J. Crutzen, and F. J. Dentener. 1998. Changing concentration, lifetime and climate forcing of atmospheric methane. Tellus B 50:128–50. doi:10.1034/j.1600-0889.1998.t01-1-00002.x.
- Lelielveld, J., S. Evans, D. Fnais, D. Giannadaki, and A. Pozzer. 2015. The contribution of outdoor air pollution sources to premature mortality on a global scale. Nature 525 (7569):367. doi:10.1038/nature15371.
- Levesque, S., M. J. Surace, J. McDonald, and M. L. Block. 2011. Air pollution & the brain: Subchronic diesel exhaust exposure causes neuroinflammation and elevates early markers of neurodegenerative disease. J. Neuroinflammation. 8:105. doi:10.1186/1742-2094-8-105.
- Liggio, J., S. G. Moussa, J. Wentzell, A. Darlington, P. Liu, A. Leithead, K. Hayden, J. O’Brien, R. L. Mittermeier, R. Staebler, et al. 2017. Understanding the primary emissions and secondary formation of gaseous organic acids in the oil sands region of Alberta, Canada. Atmos. Chem. Phys. 17:8411–27. doi:10.5194/acp-17-8411-2017.
- Liggio, J., S.-M. Li, K. Hayden, Y. M. Taha, C. Stroud, A. Darlington, B. D. Drollette, M. Gordon, P. Lee, P. Liu, et al. 2016. Oil sands operations as a large source of secondary organic aerosols. Nature 534:91–94. doi:10.1038/nature17646.
- Liggio, J., S.-M. Li, R. M. Staebler, K. Hayden, A. Darlington, R. L. Mittermeier, J. O’Brien, R. McLaren, M. Wolde, D. Worthy, et al. 2019. Measured Canadian oil sands CO2 emissions are higher than estimates made using internationally recommended method. Nat. Commun. 10:1863. doi:10.1038/41467-019-09714-9.
- Liu, M., X. Huang, Y. Song, T. Xu, S. Wang, Z. Wu, M. Hu, L. Zhang, Q. Zhang, Y. Pan, et al. 2018. Rapid SO2 emission reductions significantly increase tropospheric ammonia concentrations over the North China plain. Atmos. Chem. Phys. 18:17933–43. doi:10.5194/acp-18-17933-2018.
- Liu, T., X. Wang, B. Wang, X. Ding, W. Deng, S. Lü, and Y. Zhang. 2014. Emission factor of ammonia (NH3) from on-road vehicles in China: Tunnel tests in urban Guangzhou. Environ. Res. Lett. 9 (6):064027. doi:10.1088/1748-9326/9/6/064027.
- Lopes, M., A. Russo, J. Monjardino, C. Gouveia, and F. Ferreira. 2019. Monitoring of ultrafine particles in the surrounding urban area of a civilian airport. Atmos. Pollut. Res. 10:1454–63. doi:10.1016/j.apr.2019.04.002.
- LRTAP (Long Range Transboundary Air Pollution). 2016. Scientific assessment report 2016: North America. Accessed August 3, 2019). https://www.unece.org/index.php?id=42947.
- Lurmann, F. W., A. C. Lloyd, and R. Atkinson. 1986. A chemical mechanism for use in long-range transport/acid deposition computer modelling. J. Geophys. Res. 91:10905–36. doi:10.1029/JD091iD10p10905.
- MacDonald, A. M., P. A. Makar, K. G. Anlauf, K. Hayden, J. W. Bottenheim, D. Wang, and T. Dann. 2001. Summer formaldehyde at a high elevation site in Quebec. J. Geophys. Res. 106:32,361–32,374. doi:10.1029/2001JD000513.
- Maher, B. A., I. Ahmed, V. Karloukovski, D. A. MacLAren, P. G. Foulds, D. Allsop, D. Mann, R. Torres-Jardón, and L. Calderon-Garcidueñas. 2016. Magnetite pollution nanoparticles in the human brain. Proc. Natl. Acad. Sci. 113 (39):10797–801. doi:10.173/pnas.1605941113.
- Majd, A., A. Chehregani, M. Moin, M. Gholami, S. Kohno, T. Nabe, and M. A. Shariatzade. 2004. The effects of air pollution on structures, proteins and allergenicity of pollen grains. Aerobiologia 20:111–18. doi:10.1023/B:AERO.0000032950.12169.38.
- Makar, P. A., A. Akingunola, J. Aherne, A. S. Cole, Y. Aklilu, J. Zhang, I. Wong, K. Hayden, S.-M. Li, J. Kirk, et al. 2018. Estimates of exceedances of critical loads for acidifying deposition in Alberta and Saskatchewan. Atmos. Chem. Phys. 18:9897–927. doi:10.5194/acp-18-9897-2018.
- Marks, G. B., and R. K. Bush. 2007. It’s blowing in the wind: New insights into thunderstorm-related asthma. J. Allergy Clin. Immuno. 120:530–32. doi:10.1016/j.jaci.2007.07.012.
- Masiol, M., and R. M. Harrison. 2014. Aircraft engine exhaust emissions and other airport-related contributions to ambient air pollution: A review. Atmos. Env. 95:409–55. doi:10.1016/j.atmosenv.2014.05.070.
- Masiol, M., S. Squizzato, D. C. Chalupa, M. J. Utell, D. Q. Rich, and P. K. Hopke. 2018. Long-term trends in submicron particle concentrations in a metropolitan area of the northeastern United States. Sci. Total Environ. 633:59–70. doi:10.1016/j.scitotenv.2018.03.151.
- May, D. 2019. Mitigation of ultrafine particles from transportation – International and domestic policy overview. Presented at the Workshop on Ultrafine Particulate Emissions from Transportation, Toronto: University of Toronto, September 18.
- McKenzie, L. M., R. Guo, R. Z. Witter, D. A. Savitz, L. S. Newman, and J. L. Adate. 2014. Birth outcomes and maternal residential proximity to natural gas development in rural Colorado. Environ. Health Perspect. 122:412–17. doi:10.1289/ehp.1306722.
- McLinden, C. A., V. Fioletov, N. A. Krotkov, C. Li, K. F. Boersma, and C. Adams. 2016. A decade of change in NO2 and SO2 over the Canadian oil sands as seen from space. Environ. Sci. Technol. 50:331–37. doi:10.1021/acs.est.5b04985.
- MDDELCC (Ministère du Développement Durable, de l’Environnement et de la Lutte contre les Changements Climatiques). 2017. Impact des travaux de décontamination sur la qualité de l’air ambiant au Lac Mégantic. Bilan 2015. Accessed November 20, 2019. http://www.environnement.gouv.qc.ca/air/ambiant/lac-megantic/Lac-Megantic-impact-decontamination.pdf.
- Michaels, D. 2008. Doubt is their product: How industry’s assault on science threatens your health. Oxford, England: Oxford University Press.
- Miguel, A. G., P. E. Taylor, J. House, M. M. Glovsky, and R. C. Flagan. 2006. Meteorological influences on respirable fragment release from Chinese Elm pollen. Aerosol Sci. Techn. 40:690–96. doi:10.1080/02786820600798869.
- Mohler, O., P. J. DeMott, G. Vali, and Z. Levin. 2007. Microbiology and atmospheric processes: The role of biological particles in cloud physics. Biogeosciences 4:1059–71. doi:10.5194/bg-4-1059-2007.
- Molfino, N. A., S. C. Wright, I. Katz, S. Tarlo, F. Silverman, P. A. McClean, J. P. Szalai, M. Raizenne, A. S. Slutsky, and N. Zamel. 1991. Effect of low concentrations of ozone on inhaled allergen responses in asthmatic subjects. Lancet 338:199–203. doi:10.1016/0140-6736(91)90346-q.
- Moore, R. H., K. L. Thornhill, B. Weinzierl, D. Sauer, E. D’Ascoli, J. Kim, M. Lichtenstern, M. Scheibe, B. Beaton, A. J. Beyersdorf, et al. 2017. Biofuels blending reduces particles emissions from aircraft engines at cruise conditions. Nature 543:411–15. doi:10.1038/nature21420.
- Moore, R. H., M. Shook, A. Beyersdorf, C. Corr, S. Herndon, K. Berk, R. Miake-Lye, K. Lee Thornhill, E. L. Winstead., Z. Yu, et al. 2015. Influence of jet fuel composition on aircraft engine emissions: A synthesis of aerosol emissions data from the NASA APEX, AAFEX, and ACCESS missions. Energy Fuels 29 (4):2591–600. doi:10.1021/ef502618w.
- Moravek, A., J. G. Murphy, A. Hrdina, J. C. Lin, C. Pennell, A. Franchin, A. M. Middlebrook, D. L. Fibiger, C. C. Womack, E. E. McDuffie, et al. 2019. Wintertime spatial distribution of ammonia and its emission sources in the Great Salt Lake region. Atmos. Chem. Phys. Discuss. doi:10.5194/acp-2019-266.
- Morawska, L., Z. Ristovski, E. R. Jayaratne, D. U. Keogh, and X. Ling. 2008. Ambient nano and ultrafine particles from motor vehicles emissions: Characteristics, ambient processing and implications on human exposure. Atmos. Env. 42 (35):8113–38. doi:10.1016/j.atmosenv.2008.07.050.
- Morgenstern, V., A. Zutavern, J. Cyrys, I. Brockow, S. Koletzko, U. Kramer, H. Behrendt, O. Herbarth, A. von Berg, C. P. Bauer, et al. 2008. Atopic diseases, allergic sensitization, and exposure to traffic-related air pollution in children. Am. J. Respir. Crit. Care Med. 177 (12):1331–37. doi:10.1164/rccm.200701-036OC.
- NAS (National Academy of Sciences). 2016. The future of atmospheric chemistry research: Remembering yesterday, understanding today and anticipating tomorrow. Washington DC: The National Academic Press. doi:10.17226/235730.
- Nel, A. E., D. Diaz-Sanchez, D. NG., T. Hiura, and A. Saxon. 1998. Enhancement of allergic inflammation by the interaction between diesel exhaust particles and the immune system. J. Allergy Clin. Immunol. 102:539–54. doi:10.1016/s0091-6749(98)70269-6.
- NRDC (National Research Defense Council). 2015. Sneezing and wheezing. How climate change could increase ragweed allergies, air pollution and asthma. Accessed October 20, 2019. https://www.nrdc.org/sites/default/files/sneezing-report-2015.pdf.
- O’Dowd, C., and G. de Leeuw. 2007. Marine aerosol production: A review of the current knowledge. Phil. Trans. R. Soc.A. 365:1753–74. doi:10.1098/rsta.2007.2043.
- O’Sullivan, D., B. J. Murray, J. F. Ross, T. F. Whale, H. C. Price, J. D. Atkinson, and N. S. Umo. 2015. The relevance of nanoscale biological fragments for ice nucleation in clouds. Sci. Rep. 5. doi:10.1038/srep08082.
- Oberdörster, G., E. Oberdörster, and J. Oberdörster. 2005. Nanotoxicology: An emerging discipline evolving from studies of ultrafine particles. Environ. Health Perspect. 113:823–39. doi:10.1289/ehp.7339.
- Oberdörster, G., J. Ferin, and B. E. Lehnert. 1994. Correlation between particle size, in vivo particle persistence, and lung injury. Environ. Health Perspect. 102 (suppl 5):173–79. doi:10.1289/ehp.102-1567252.
- Oberdörster, G., R. M. Gelein, J. Ferin, and B. Weiss. 1995. Association of particulate air pollution and acute mortality: Involvement of ultrafine particles? Inhal. Toxicol. 7 (1):111–24. doi:10.3109/08958379509014275.
- Oberdörster, G., Z. Sharp, V. Atudore, A. Elder, R. Gelein, A. Lunts, W. Kreyling, and C. Cox. 2002. Extrapulmonary translocation of ultrafine carbon particles following whole-body inhalation exposure of rats. J. Toxicol. Environ. Health A. 65 (20):1531–43. doi:10.1080/00984100290071658.
- Oberdörster, G, Z. Sharp, V. Atudorei, A. Elder, R. Gelein, W. Keyling, and C. Cox. 2004. Translocation of inhaled ultrafine particles to the brain. Inhal. Toxicol. 16:437–45. doi:10.1080/08958370490439597.
- Ohlwein, S., R. Kappeler, M. K. Joss, N. Künzli, and B. Hoffmann. 2019. Health effects of ultrafine particles: A systematic literature review update of epidemiological evidence. Int. J. Public Health. 64 (4):547–59. doi:10.1007/s00038-019-01202-7.
- Osborne, N. J., I. S. Alcock, and I. E. Fleming. 2017. Pollen exposure and hospitalization due to asthma exacerbations: Daily time series in a European city. Int. J. Biomet. 61 (10):1837–48. doi:10.1007/s00484-017-1369-2.
- Parker, J. D., L. J. Akinbami, and T. J. Woodruff. 2009. Air pollution and childhood respiratory allergies in the United States. Environ. Health Perspect. 117 (1):140–47. doi:10.1289/ehp.11497.
- Parrish, D. D., H. B. Singh, L. Molina, and S. Madronich. 2011. Air quality progress in North American megacities: A review. Atmos. Environ. 45:7015–25. doi:10.1016/j.atmosenv.2011.09.039.
- Peltre, G. 1998. Inter-relationship between allergenic pollens and air pollution. Allerg. Immunol. 30 (10):324–26. PMID:9972354.
- Petsko, G. A. 2006. Comment. Genome Biol. 7:108. doi:10.1186/gb-2006-7-5-108.
- Petzold, A., R. Marsh, M. Johnson, M. Miller, Y. Sevcenco, D. Delhaye, A. Ibrahim, P. Williams, H. Bauer, A. Crayford, et al. 2011. Evaluation of methods for measuring particulate matter emissions from gas turbines. Environ. Sci. Technol. 45:3562–68. doi:10.1021/es103969v.
- Pieters, N., G. Koppen, M. Van Poppel, S. De Prins, B. Cox, E. Dons, V. Nelen, L. Int Panis, M. Plusquin, G. Schoeters, et al. 2015. Blood pressure and same-day exposure to air pollution at school: Associations with nano-sized to coarse PM in children. Environ. Health Perspect. 123 (7):737–42. doi:10.1289/ehp.1408121.
- Pinder, R. W., P. J. Adams, and S. N. Pandis. 2007. Ammonia emission controls as a cost-effective strategy for reducing atmospheric particulate matter in the eastern United States. Environ. Sci. Technology. 41:380–86. doi:10.1021/es060379a.
- Pollution Probe. 2019. Transportation program overview. Presented at the Workshop on Ultrafine Particulate Emissions from Transportation, Toronto: University of Toronto, September 18.
- Pope, C. A., III, R. T. Burnett, D. Michael, J. Thun, E. E. Calle, D. Krewski, K. Ito, and G. D. Thurston. 2002. Lung cancer, cardiopulmonary mortality, and long-term exposure to fine particulate air pollution. J. Am. Med. Assoc. 287 (9):1132–41. doi:10-1001/pubs.JAMA-ISSN-0098-7484-287-9-joc11435.
- Portejoie, S., J. Martinez, and G. Landmann. 2002. Ammonia of farm origin: impact on human and animal health and on the natural habitat. Internal report AGRIS Institute. Accessed June 2, 2018. http://agris.fao.org/agris-search/search.do?recordID=FR2002003459.
- Puc, M., D. Kotrych, A. Lipiec, P. Rapiejko, and G. Siergiejko. 2016. Birch pollen grains without cytoplasmic content in the air of Szczecin and Bialystok. Alergoprofil 12 (2):101–05.
- Quarg. 1996. Airborne particulate matter in the United Kingdom. Third report of the Quality of Urban Air Review Group, Department of the Environment, University of Birmingham, Birmingham, England. ISBN 0 9520771 3 2.
- Rahim, M. F., D. Pal, and P. A. Ariya. 2019. Physicochemical studies of aerosols at montreal trudeau airport: The importance of airborne nanoparticles containing metal contaminants. Environmen. Pollut. 246:734–44. doi:10.1016/j.envpol.2018.12.050.
- Rantio-Lehtimäki, A., M. Viander, and A. Koivikko. 1994. Airborne birch pollen antigens in different particle sizes. Clin. Exp. Allergy 24:23–28. doi:10.1111/j.1365-2222.1994.tb00912.x.
- Record. 2012. Substances émergentes, polluants émergents dans les déchets. Analyse et prospective (in French). Study 10-0143/1A. Accessed April 16, 2019. https://www.record-net.org/storage/etudes/10-0143-1A/rapport/Rapport_record10-0143_1A.pdf.
- Reeves, F. 2011. Planète Coeur. Santé cardiaque et environnement. Éditions MultiMondes et Éditions CHU Sainte-Justine, Montréal, Canada.
- Reid, N., D. Yap, and R. Bloxam. 2008. The potential role of background ozone on current and emerging air issues: An overview. Air Qual. Atmos. Health 1:19–29. doi:10.1007/s11869-008-0005-z.
- Ress, N. B., B. J. Chou, R. A. Renne, J. A. Dill, R. A. Miller, J. H. Roycroft, J. R. Hailey, J. K. Haseman, J. R. Bucher. 2003. Carcinogenicity of inhaled vanadium pentoxide in F344/N rats and B6C3F1 mice. Toxicol. Sci. 74 (2):287–96. doi:10.1093/toxsci/kfg136.
- Richardson, S. D., and T. A. Ternes. 2018. Water analysis: Emerging contaminants and current issues. Anal. Chem. 90:398–428. doi:10.1021/acs.analchem.7b04577.
- Riley, E. A., T. Gould, K. Hartin, S. A. Fruin, C. D. Simpson, M. G. Yost, and T. Larson. 2016. Ultrafine particle size as a tracer for aircraft turbine emissions. Atmos. Environ. 139:20–29. doi:10.1016/j.atmosenv.2016.05.016.
- Ring, J., U. Krämer, T. Schäfer, and H. Behrendt. 2001. Why are allergies increasing? Curr. Opin. Immunol. 13:701–08. PMID:11677093. doi:10.1016/S0952-7915(01)00282-5.
- Robichaud, A. 2019. Synergie entre la pollution anthropique et biologique et impacts sur la santé respiratoire au Québec durant le printemps. http://lodel.irevues.inist.fr/pollution-atmospherique/index.php?id=6767.
- Robichaud, A., A. Cole, M. D. Moran, A. Lupu, M. Shaw, G. Roy, M. Beauchemin, V. Fortin, and R. Vet. 2018. Total deposition maps evaluated from measurement-model fusion in North America (ADAGIO project). Paper presented at the International Technical Meeting in Air Quality, Ottawa, Canada, May 14–18.
- Robichaud, A., and P. Comtois. 2019. Environmental factors and asthma hospitalization in Montreal, Canada, during spring 2006–2008: A synergy perspective. Air Qual. Atmos. Health 12:1495–509. doi:10.1007/s11869-019-00744-2.
- Robichaud, A., and R. Ménard. 2014. Multi-year objective analyses of warm season ground-level ozone and PM2.5 over North America using real-time observations and Canadian operational air quality models. Atmos. Chem. Phys. 13 (5):13967–4035. doi:10.5194/acpd-13-13967-2013.
- Robichaud, A., R. Ménard, Y. Zaïtseva, and D. Anselmo. 2016. Multi-pollutant surface objective analyses and mapping of air quality health index over North America. Air Qual. Atmos. Health 9:743–59. doi:10.1007/s11869-015-0385-9.
- Rodriguez, S., R. Van Dingenen, J.-P. Putaud, A. Dell’Acqua, J. Pey, X. Querol, A. Alastuey, S. Chenery, K.-F. Ho, R. Harrison, et al. 2007. A study on the relationship between mass concentrations, chemistry and number size distribution of urban fine aerosols in Milan, Barcelona and London. Atmos. Chem. Phys. 7:2217–32. doi:10.5194/acp-7-2217-2007.
- Romieu, I., R. Garcia-Esteban, J. Sunyer, C. Rios, M. Alcaraz-Zubeldia, S. R. Velasco, F. Holguin. 2008. The effect of supplementation with omega-3 polyunsaturated fatty acids on markers of oxidative stress in elderly exposed to PM2.5. Environ. Health Perspect. 116 (9):1237–42. doi:10.1289/ehp.10578.
- Saenen, N. D., H. Bove, C. Steuwe, M. B. J. Roeffaers, E. B. Provost, W. Lefebvre, C. Vanpoucke, M. Ameloot, and T. S. Nawrot. 2017. Children’s urinary environmental carbon load. A novel marker reflecting residential ambient air pollution exposure? Am. J. Respir. Crit. Care Med. 196 (7):873–81. doi:10.1164/rccm.201704-0797OC.
- Saliba, G., R. Saleh, Y. Zhao, A. A. Presto, A. T. Lambe, B. Frodin, S. Sardar, H. Maldonado, C. Maddox, A. A. May, et al. 2017. Comparison of gasoline direct-injection (GDI) and port fuel injection (PFI) vehicle emissions: Emission certification standards, cold-start, secondary organic aerosol formation potential, and potential climate impacts. Environ. Sci. Technol. 51:6542–52. doi:10.1021/acs.est.6b06509.
- Sauvé, S., and M. Desrosiers. 2014. A review of what is an emerging contaminant. Chem. Cent. J. 8 (1):15. doi:10.1186/1752-153X-8-15.
- Schwede, D. B., and G. G. Lear. 2014. A novel hybrid approach for estimating total deposition in the United States. Atmos. Environ. 92:207–20. doi:10.1016/j.atmosenv.2014.04.00.
- Seinfeld, J. H., and S. N. Pandis. 2006. Atmospheric chemistry and physics: From air pollution to climate change. 2nd ed. New-York: Wiley-Interscience.
- Sénéchal, H., N. Visez, D. Charpin, Y. Shahali, G. Peltre, J. P. Biolley, F. Lhuissier, R. Couderc, O. Yamada, A. Malrat-Domenge, et al. 2015. A review of the effects of major atmospheric pollutants on pollen grains, pollen content and allergenicity. Sci. World J. 2015:1–29. doi:10.1155/2015/9402243.
- Shephard, M. W., and K. E. Cady-Pereira. 2015. Cross-track infrared sounder (CrIS) satellite observations of tropospheric ammonia. Atmos. Meas. Tech. 8:1323–36. doi:10.5194/amt-8-1323-2015.
- Silva, R. A., J. J. West, Y. Zhang, S. C. Anenberg, J. F. Lamarque, D. T. Shindell, W. J. Collins, S. Dalsoren, G. Faluvegi, G. Folberth, et al. 2013. Global premature mortality due to anthropogenic outdoor air pollution and the contribution of past climate change. Environ. Res. Lett. 8. doi:10.1088/1748-9326/8/3/034005.
- Simpson, I. J., J. E. Marrero, S. Batterman, S. Meinard, B. Barletta, and D. R. Blake. 2013. Air quality in the industrial heartland of Alberta, Canada and potential impacts on human health. Atmos. Environ. 81:702–09. doi:10.1016/j.atmosenv.2013.09.017.
- Simpson, I. J., N. J. Blake, B. Barletta, G. S. Diskin, H. E. Fuelberg, K. Gorham, L. G. Huey, S. Meinardi, F. S. Rowland, S. A. Vay, et al. 2010. Characterization of trace gases measured over Alberta oil sands mining operations: 76 speciated C2–C10 volatile organic compounds (VOCs), CO2, CH4, CO, NO, NO2, NOy, O3 and SO2. Atmos. Chem. Phys. 10:11931–54. doi:10.5194/acp-10-11931-2010.
- Sioris, C., C. McLinden, J. Dawson, B. Brisco, L. Fu, and T. Nunifu. 2018. AEP-ECCC workshop on current and emerging methods for satellite monitoring of the oil sands. Oil Sands Monitoring Program Technical Report Series No. 4. 19. ISBN: 978-1-4601-4195-3.
- Small, M. J., P. C. Stern, E. Bomberg, S. M. Christopherson, B. D. Goldstein, A. L. Israel, R. B. Jackson, A. Krupnick, M. S. Mauter, J. Nash, et al. 2014. Risks and risk governance in unconventional shale gas development. Env. Sci. Tech. 48:8289–97. doi:10.1021/es502111u.
- SOCAAR (Southern Ontario Centre for Atmospheric Aerosol Research). 2019. Near-road air pollution pilot study, University of Toronto. https://www.socaar.utoronto.ca/near-road-air-pollution-in-canada/.
- Sofiev, M., and K. C. Bergmann. 2013. Allergenic pollen. A review of the production, release, distribution and health impacts, 256. Dordrecht: Springer Science+Business Media. ISBN978-94-007-4880-4e-ISBN 978-94-94-007-4881–1.
- Stearns, R. C., G. G. K. Murthy, W. Skornik, V. Hatch, M. Katler, and J. J. Godleski. 1994. Detection of ultrafine copper oxide particles in the lungs of hamsters by electron spectroscopic imaging. In Proceedings of ICEM 13-PARIS, ed. B. Jouffrey and C. Colliex, 763–64. Paris: Les Editions de Physique.
- Stettler, M. E. J., A. M. Boies, A. Petzold, and S. R. H. Barrett. 2013. Global civil aviation black carbon emissions. Environ. Sci. Technol. 47 (18):10397–404. doi:10.1021/es401356v.
- Stiglitz, J. E. 2019. People, power, and profits. New York, London: W.W. Norton and Company Inc.
- Stroud, C. A., C. Zaganescu, J. Chen, C. A. McLinden, J. Zhang, and D. Wang. 2016. Toxic volatile organic air pollutants across Canada: Multi-year concentration trends, regional air quality modelling and source apportionment. J. Atmos. Chem. 73 (2):137–64. doi:10.1007/s10874-015-9319-z.
- Sun, Q., A. Wang, X. Jin, A. Natanzon, D. Duquaine, R. D. Brook, J. G. Aguinaldo, Z. A. Fayad, V. Fuster, M. Lippmann, et al. 2005. Long-term air pollution exposure and acceleration of atherosclerosis and vascular inflammation in an animal model. J. Am. Medical Assoc. 294:23. doi:10.1001/jama.294.23.3003.
- Tamburlini, G. 2002. Environmental hazards in specific settings and media: An overview. Chap. 2. In Children’s health and environment: A review of evidence. A joint report from the European Environment Agency and the World Health Organization Regional Office for Europe, ed. G. Tamburlini, O. S. von Ehrenstein, and R. Bertolini, 29–37. Copenhagen, Denmark: WHO Regional Office for Europe. ISBN 92-9167-412-5.
- Taylor, P. E., and H. Jonsson. 2004. Thunderstorm asthma. Curr. Allergy Asthma Rep. 4 (5):409–13. PMID: 15283882. doi:10.1007/s11882-004-0092-3.
- Taylor, P. E., R. C. Flagan, A. G. Miguel, R. Valenta, and M. Glovsky. 2004. Birch pollen rupture and the release of aerosols of respirable allergens. Clin. Exp. Allergy 34:1591–96. doi:10.1111/j.1365-2222.2004.02078.x.
- Taylor, P. E., R. C. Flagan, R. Valenta, and M. M. Glovsky. 2002. Release of allergens as respirable aerosols: A link between grass pollen and asthma. J. Allergy Clin. Immunol. 109:51–56. doi:10.1067/mai.2002.120759.
- Teichman, K. 2008. Accessed May 28, 2019. https://www.federalregister.gov/documents/2008/02/13/E8-2697/notice-of-availability-of-the-nanomaterial-research-strategy-external-review-draft-and-expert-peer.
- Terzano, C., F. Di Stefano, V. Conti, E. Graziani, and A. Petroianni. 2010. Air pollution ultrafine particles: Toxicity beyond the lung. Eur. Rev. Med. Pharmacol. Sci. 14:809–21. PMID: 21222367.
- Thibaudon, M. 2007. Pollen, allergies et changements climatiques. Press. Therm. Climat. 144:117–20.
- Touri, L., H. Marchetti, I. Sari-Minodier, N. Molinari, and P. Chanez. 2013. The airport atmospheric environment: respiratory health at work. Eur. Respir. Rev. 22 (128):124–30. doi:10.1183/09059180.00005712.
- Unal, A., Y. Hu, M. E. Chang, M. T. Odman, and A. G. Russel. 2005. Airport related emissions and impacts on air quality: Application to the Atlanta international airport. Atmos. Environ. 39 (32):5787–98. doi:10.1016/j.atmosenv.2005.05.051.
- US/EPA. 1991. Integrated risk information system (IRIS). Chemical assessment summary. Acrylonitrile. CASRN 107-13-1. National Center for Environmental Assessment, Office of Research and Development, Washington, D.C.
- US/EPA. 2003. Integrated risk information system (IRIS). Chemical assessment summary. Hydrogen sulfide; CASRN 7783-06-4; Acrolein CASRN 107-02-8. National Center for Environmental Assessment, Office of Research and Development, Washington, D.C.
- US/EPA. 2005. List of air toxics in the 2005 NATA assessment. Accessed April 18, 2019. https://www.epa.gov/sites/production/files/2015-10/documents/2005-nata-pollutants.pdf.
- US/EPA. 2011. Integrated Risk Information System (IRIS). Chemical assessment summary. Trichloroethylene; CASRN 79-01-6, National Center for Environmental Assessment, Office of Research and Development, Washington, D.C.
- US/EPA. 2019. Integrated science assessment (ISA) for particulate matter (final report). Accessed February 19, 2020. https://www.epa.gov/isa/integrated-science-assessment-isa-particulate-matter.
- Van Damme, M., L. Clarisse, S. Whitburn, J. Hadji-Lazaro, D. Hurtmans, C. Clerbaux, and P. F. Coheur. 2018. Industrial and agricultural ammonia point sources exposed. Nature 564:99–103. doi:10.1038/s41586-018-0747-1.
- Van Donkelaar, A., R. V. Martin, M. Brauer, R. Kahn, R. Levy, C. Verduzzo, and P. J. Villeneuve. 2010. Global estimates of ambient fine particulate matter concentrations from satellite-based aerosol optical depth: Development and application. Env. Health. Perspec. 118 (6):847–55. doi:10.1289/ehp.0901623.
- Vedal, S. 1997. Ambient particles and health: Lines that divide. J. Air. Waste Manage Assoc. 47:551–81. doi:10.1080/10473289.1997.10463922.
- Vengosh, A., W. A. Mitch, and L. M. McKenzie. 2017. Environmental and human impacts of unconventional energy development. Editorial comment. Env. Science Tech. 51:10271–73. doi:10.1021/acs.est/7b04336.
- Venkataraman, C., and J. Raymond. 1998. Estimating the lung deposition of particulate polycyclic aromatic hydrocarbons associated with multimodal urban aerosols. Inhal. Toxicol. 10:183–204. doi:10.1080/089583798197727.
- Wakefield, J. C. 2008. Formaldehyde-General Information, Report by Health Protection Agency, CHAPD HQ, HPA Version 1. Accessed March 31, 2018. https://www.gov.uk/government/uploads/system/uploads/attachment_data/file/341377/hpa_formaldehyde_general_information_v1.pdf.
- Wallace, J. 2019. UFPs from transportation: Sources and trends. Workshop on Ultrafine Particulate Emissions from Transportation, University of Toronto, Toronto, September 18.
- Wang, P. T., M. Holloway, and N. Harkey. 2019. Formaldehyde trend analysis from satellite observations and ground measurements. Poster presented at IUGG conference, Montreal, Canada, July 18–28.
- Weichenthal, S., E. Lavigne, M. F. Valois, M. Hatzopoulou, K. Van Ryswyk, M. Shekarrizfard, P. J. Villeneuve, M. S. Goldberg, and M. E. Parent. 2017. Spatial variations in ambient ultrafine particle concentrations and the risk of incident prostate cancer: A case-control study. Environ. Res. 156:374–80. doi:10.1016/j.envres.2017.03.035.
- Weichenthal, S., K. V. Ryswyk, A. Goldstein, M. Shekarrizfar, and M. Hatzopoulou. 2016. Characterizing the spatial distribution of ambient ultrafine particles in Toronto, Canada: A land use regression model. Environmen. Pollut. 208:241–48. doi:10.1016/j.envpol.2015.04.011.
- Wentworth, G. R., J. G. Murphy, K. B. Benedict, E. J. Bangs, and J. L. Collett Jr. 2016. The role of dew as a night-time reservoir and morning source for atmospheric ammonia. Atmos. Chem. Phys. 16:7435–49. doi:10.5194/acp-16-7435-20.
- Westerdahl, D., S. A. Fruin, P. L. Fine, and C. Sioutas. 2008. The los angeles international airport as a source of ultra fine particles and other pollutants to nearby communities. Atmospheric Environment 42:3143–3155. doi: 10.1016/j.atmosenv.2007.09.006.
- WHO. 2012b. Diesel engine exhaust carcinogenic. www.iarc.fr/wp-content/uploads/2018/07/pr213_E.pdf.
- WHO. 2013. Health risks of air pollution in Europe-HRAPIE project. New emerging risks to health from air pollution – Results from the survey of experts. http://www.euro.who.int/en/health-topics/environment-and-health/air-quality/publications/2013/health-risks-of-air-pollution-in-europe-hrapie-project.-new-emerging-risks-to-health-from-air-pollution-results-from-the-survey-of-experts.
- WHO. 2016a. WHO expert consultation: Available evidence for the future update of the WHO global air quality guidelines (AQGs). Meeting report, Bonn, Germany, September 29th – October 1st.
- WHO. 2016b. IARC monographs on the evaluation of carcinogenic risks to humans. Outdoor air pollution, Vol. 109. Geneva, Switzerland: WHO.
- WHO (Regional Office for Europe). 2012a. Health effects of black carbon. ISBN: 978 92 890 0265 3.
- WHO (World Health Organization). 2001. 1,3-butadiene: Human health aspect. Concise International Chemical Assessment Document 30, World Health Organization. Accessed August 3rd, 2019. http://www.who.int/ipcs/publications/cicad/en/cicad30.pdf.
- Winther, M., U. Kougsgaard, T. Ellermann, A. Massling, J. Klenø Nøjgaard, and M. Ketzel. 2015. Emissions of NOx, particle mass and particle numbers from aircraft main engines, APU’s and handling equipment at Copenhagen airport. Atmos. Environ. 100:218–29. doi:10.1016/j.atmosenv.2014.10.045.
- Wozniak, M. C., F. Solmon, and A. L. Steiner. 2018. Pollen rupture and its impact on precipitation in clean continental conditions. 45 1-7164: 45 1-7164. doi: 10.1029/2018GL077692.
- Wright, T. P., J. D. Hader, G. R. McMeeking, and M. D. Peters. 2014. High relative humidity as a trigger for widespread release of ice nulei. Aerosol Sci. Technol. 48:i–v. doi:10.1080/02786826.2014.968244.
- Xu, X., and C. P. Weisel. 2005. Human respiratory uptake of chloroform and haloketones during showering. J. Exposure Sci. Environ. Epidemiol. 15:6–16. doi:10.1038/sj.jea.7500374.
- Xu, X., S. Ha, and R. Basnet. 2016. A review of epidemiological research on adverse neurological effects of exposure to ambient air pollution. Front. Public Health 4:157. doi:10.3389/fpubh.2016.0015.
- Yu, F., G. Luo, T. Bates, B. Anderson, A. Clarke, V. Kapusin, R. Yantosca, Y. Wang, and S. Wu. 2010. Spatial distributions of particle number concentrations in the global troposphere: Simulations, observations, and implications for nucleation mechanisms. J. Geophys. Res.Atmos. 115 (17):1–14. doi:10.1029/2009JD013473.
- Zhang, R., T. Duhl, M. T. Salam, J. M. House, R. C. Flagan, E. L. Avol, F. D. Gilliland, A. Guenther, S. H. Chung, B. Lamb, et al. 2014. Development of a regional-scale pollen emission and transport modeling framework for investigating the impact of climate change on allergic airway disease. Biogeosciences 11:461–1478. doi:10.5194/bg-11-1461-2014.
- Zhu, L., D. J. Jacob, F. N. Keutsch, L. J. Mickley, R. Scheffe, M. Strum, A. G. González, K. Chance, K. Yang, B. Rappenglück, et al. 2017a. Formaldehyde (HCHO) as a hazardous air pollutant: Mapping surface air concentrations from satellite and inferring cancer risks in the United States. Environ. Sci. Technol. 51 (10):5650–57. doi:10.1021/acs.est.7b01356.
- Zhu, L., L. J. Mickley, D. J. Jacob, E. A. Marais, J. Sheng, L. Hu, G. G. Abad, and K. Chance. 2017b. Long-term (2005–2014) trends in formaldehyde (HCHO) columns across North America as seen by the OMI satellite instrument: Evidence of changing emissions of volatile organic compounds. Geophys. Res. Lett. 44:7079–86. doi:10.1002/2017GL073859.
- Zimmerman, N., J. M. Wang, C. H. Jeong, J. S. Wallace, and G. J. Evans. 2016. Assessing the climate trade-offs of gasoline direct injection engines. Environ. Sci. Technol. 50 (15):8385–92. doi:10.1021/acs.est.6b01800.