
 ?Mathematical formulae have been encoded as MathML and are displayed in this HTML version using MathJax in order to improve their display. Uncheck the box to turn MathJax off. This feature requires Javascript. Click on a formula to zoom.
ABSTRACT
A wide-angle diffuser installed at the entrance of an electrostatic precipitator (ESP) causes a non-uniform flow distribution due to the boundary layer separation. Because a non-uniform flow pattern decreases the particulate matter control efficiency of an ESP, it is important to maintain a uniform flow distribution. The objective of this study is therefore to understand flow distribution with the conditions of perforated plates placed in the diffuser and then to design an ESP to obtain uniform flow. Discharge coefficients were determined varying the porosity, thickness, and number of holes of the perforated plate inside the lab-scale duct system. The test results suggest that the perforated plate with a porosity of 50%, a thickness of 5 mm, and 0.104 hole/m2 perforated plate is most acceptable. This perforated plate was placed in the diffuser of the lab-scale ESP system. Velocity profiles in the body of the ESP were obtained depending on the number and arrangement of perforated plates in the diffuser. One perforated plate placed in the diffuser did not improve the flow distribution. Although more uniform flow distribution was found with two perforated plates, stalled flow regions still existed at the top and bottom of the ESP body. When three perforated plates were placed in the diffuser, the 2nd and 3rd perforated plates were important to obtain uniform flow distribution. When the 2nd and 3rd perforated plates were placed at the inlet side and outlet of the diffuser, respectively, the most uniform flow distribution was obtained in the body of the ESP.
Implications: In order to determine the optimal perforated plate for Electrostatic Precipitator (ESP), we investigated the discharge coefficient depending on the structure of the perforated plate in a square duct. We measured the velocity distribution in a laboratory ESP with perforated plates and found the effect of the number and arrangement of perforated plates on the flow distribution in the collection region. Based on the test results, we found the configuration of perforated plates for uniform flow distribution in the body of the ESP.
Introduction
Electrostatic precipitator (ESP) is widely used in the industry to reduce particulate matter emitted from power plants, incinerators, and coal boilers (Ali et al. Citation2016; Haque et al. Citation2009b; Yang et al. Citation2017). ESP has a high theoretical efficiency for particulate matter, but it is difficult to achieve theoretical efficiency in the field due to the several factors determined by design factors and operating conditions (Su et al. Citation2018; Ullum and Larsen Citation2005). Especially, the efficiency is significantly influenced by the flow distribution of flue gas in the collection area (Haque et al. Citation2009a; Hein Citation1989; Randolph Citation1953; Robinson Citation1968). However, a wide-angle diffuser with the large area ratio should be introduced at the inlet of the ESP due to the limited space in the field (Barratt and Kim Citation2015; Jędrusik, Świerczok, and Łuszkiewicz Citation2017). When the flue gas passes through a wide-angle diffuser, boundary layer separation occurs due to adverse pressure gradient formed around the diffuser wall (Dmitriev et al. Citation2016; Meng et al. Citation2020; Sagar, Paul, and Jain Citation2011). It causes axial core jet flow in central region and stalled flow near the wall. As a result, non-uniform flow is formed in the collection area, which interferes with the capture of particulate matter and causes re-entrainment of dust (Bhasker Citation2011; Hein Citation1989). Therefore, it is necessary to control the boundary layer separation in the wide-angle diffuser to achieve the high efficiency of ESP. Boundary layer separation can be controlled by perforated plate, which has the ability to reduce adverse pressure gradient and enhance fluid momentum in the boundary layer (Barratt and Kim Citation2015; Seltsam Citation1995). When perforated plates were applied to ESP, several factors should be considered for flow control, such as porosity, the arrangement, and the number of perforated plates (Sahin, Ward-Smith, and Lane Citation1995). However, it is difficult to consider these factors in the field (Haque et al. Citation2007). Therefore, many studies were conducted through an experimental approach to find the optimal conditions for ESP. The application of one perforated plate to the diffuser enlarged a core jet region, resulting in a non-uniform flow pattern in the collection area (Coghe, Mantegna, and Sotgia Citation2003; Sahin and Ward-Smith Citation1990). When two perforated plates were applied to ESP, the flow distribution in the collection chamber was significantly influenced by the configuration of perforated plates in the diffuser. When two perforated plates were close to each other, the depleted flow was found in a center of the diffuser exit, due to deflection of flow toward the wall (Sahin and Ward-Smith Citation1990; Ward-Smith et al. Citation1991). The perforated plate located at the inlet side of the diffuser was effective in controlling the flow separation, and uniform flow distribution was found in an arrangement condition in which two perforated plates were arranged at the inlet side and the outlet side of the diffuser (Noui-Mehidi et al. Citation2005; Sahin and Ward-Smith Citation1993). In addition, it was reported that the flow pattern in the downstream of the diffuser was also significantly affected by the porosity of perforated plate. The perforated plate of 50% porosity was able to control the flow separation and distribute the flow uniformly. On the other hand, flow separation was not prevented in a perforated plate with 58% porosity. In the case of a perforated plate with 40% porosity, non-uniform flow pattern appeared in downstream of the diffuser, because the flow was not distributed appropriately and deflected toward diffuser wall (Sahin and Ward-Smith Citation1987, Citation1993).
As the computer technology developed, recent studies on the flow distribution of ESP have been carried out using numerical simulation methods. Karthikeyan reported that the boundary layer separation occurred in a diffuser with one perforated plate, resulting in a non-uniform flow distribution in collection area (Karthikeyan et al. Citation2019). Fadilah and Swaminathan found that the uniform flow distribution was formed when two perforated plates were placed at the inlet side and outlet of the diffuser (Fadilah and Erawan Citation2018; Swaminathan and Mahalakshmi Citation2010). Malavasi showed that the pressure drop decreased as the number of holes increased at the same porosity of perforated plate (Malavasi et al. Citation2012). It was reported that the pressure drop across the perforated plate is mainly due to the eddy formed downstream of the plate, and the thinner plate in the turbulent flow, the larger the downstream eddy (Bayazit, Sparrow, and Joseph Citation2014; Guo et al. Citation2013). In this study, discharge coefficients of perforated plates with different porosities, thicknesses, and number of holes were investigated. In order to determine the optimal perforated plate for ESP, the pressure drop was measured in the velocity range of the ESP diffuser. When the designed perforated plate was placed in the diffuser, the flow characteristics in the body of the ESP according to the arrangements of the perforated plates were also studied. The optimal configuration of perforated plates in the diffuser was found to induce the most uniform flow pattern in the collection area.
Experiment
Duct test
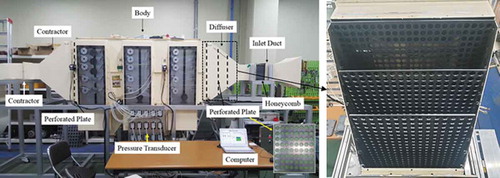
In order to design the optimal perforated plate for the ESP, the pressure loss and discharge coefficient depending on the structure of the perforated plate were investigated. As shown in , the air circulation loop system was set up to simulate the gas flow through the perforated plate installed in an acrylic square duct. The duct had a hydraulic diameter of 0.093 m and a length of 3.5 m. The inlet velocity was 6, 9, and 12 m/s. At this velocity range, it was calculated to be a fully developed turbulent flow at the perforated plate location as found from the experimental design and condition in other publications (Ahmed et al. Citation2012; Aly et al. Citation2010; Cengel Citation2010; Manshoor, Zaman, and Khalid Citation2013). The inlet velocity was measured using three hot wires (CTV-110, KIMO instruments, France). Pressure taps were installed 0.093 m upstream and downstream of the perforated plate, respectively. The pressure loss was measured using a differential pressure gauge (CP 210, KIMO instruments, France). In order to verify the reliability of the measurement, the pressure loss was measured at the same location with a multifunction instrument (AMI 310, KIMO Instruments). It was confirmed that the deviation between measured values of instruments was less than 1%. Differential pressure was measured once per second for 50 seconds. All tests were conducted 3 times at the same condition. All perforated plates used in the experiment were square steel plates with circular holes. shows the detailed structure of the perforated plate used in the tests. In order to evaluate the flow resistance, the discharge coefficient was determined from the pressure loss through the perforated plate. Discharge coefficient is a dimensionless number that represents the flow and pressure loss behavior in the contraction or enlargement of the cross-section in the flow path. Discharge coefficient (Cd) is calculated from EquationEquation (1)(1)
(1) (Albright Citation2008; Lipták Citation2003; Miller Citation1983).
Table 1. Structure of the perforated plate
Figure 1. Schematic and picture of the duct system

where K is the pressure loss coefficient (resistance coefficient) calculated from EquationEquation (2)(2)
(2) (Menon Citation2004; Uehleke and Werner Citation1975).
where ρ is the density of the fluid, V is the average velocity, ΔPL is the pressure loss.
Electrostatic precipitator test
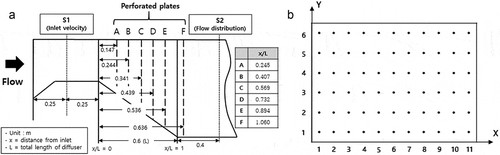
The flow distribution depending on the arrangement of perforated plates was investigated in a lab-scale ESP. As shown in , the lab-scale ESP includes an inlet duct, an outlet duct, a pyramidal wide-angle diffuser, a body with four hoppers, and a collection chamber. shows a detailed dimension of the ESP. The inlet and outlet were square ducts with a diameter of 0.25 m. A honeycomb-shaped flow distributor was placed at the inlet of the ESP. The pyramidal wide-angle diffuser was designed with a length of 0.6 m and an area ratio of 10. The divergency angle of the diffuser was vertically 2α = 92° and horizontally 2γ = 74°. Six slots were made in the diffuser to place perforated plates. All tests were conducted at a room temperature. Airflow rate was regulated operating a fan to obtain a velocity of 11 ~ 11.5 m/s at the inlet of the ESP. One perforated plate was always placed at the outlet of the body of the ESP.
Table 2. Dimensions of the lab-scale electrostatic precipitator
Figure 2. Pictures of the lab-scale electrostatic precipitator
shows the location of the perforated plate and measurement sections of the velocity. Perforated plates were placed in several locations (A ~ F) in the diffuser. All perforated plates for ESP were prepared with a porosity of 50%, a thickness of 5 mm, and 0.104 hole/m2 plate area. The inlet velocity was measured at the S1 plane shown in the figure using hot wires (CTV 110, KIMO instruments, France). The velocity distribution in the body of the ESP was measured at S2 plane located 0.4 m downstream of the outlet of the diffuser. As shown in , velocity was measured at 66 points (6 x 11) of the S2 plane. Six hot wires were installed in the vertical direction of S2 plane and then moved in the lateral direction. The velocity was measured 10 times at all points on the S2 plane. The flow distribution was evaluated using the root-mean-square index (RMS%) proposed by Industrial Gas Cleaning Institute of America as the following EquationEquation (3)(3)
(3) :
Figure 3. Schematic diagram of the diffuser, perforate plate and sampling grid
where n is the number of measuring points, is the local velocity measured at the point i.
is the average velocity for the streamwise direction.
Shih et al. suggested the RMS of less than 22% to achieve a uniform flow distribution and a high efficiency of an ESP (Shin et al. Citation2010).
Results and discussion
Duct test results
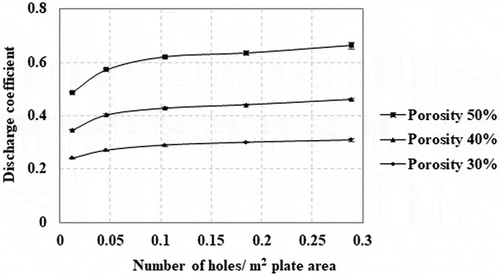
In order to design a perforated plate for an ESP, the effect of the number of holes in the plate on the discharge coefficient was first investigated. represents the discharge coefficients determined from the different number of holes in a perforated plate with the porosity of 30% ~50% and thickness of 5 mm. - also summarize the pressure loss, standard error, pressure loss coefficient, and discharge coefficient at each condition. The discharge coefficient in case of the number of holes exceeding 0.104 hole/m2 plate area more slowly increases with an increase in the number of holes, compared to the discharge coefficient in the range of 0.012 ~ 0.104 hole/m2 plate area. When the number of holes increases from 0.012 to 0.104 hole/m2 plate area, the distance between the holes (closed area) highly decreases from 18.7 to 4.7 mm. This may significantly reduce flow separation regions downstream of the perforated plate. On the other hand, when the number of holes increases from 0.104 to 0.289 hole/m2 plate area, the distance between the holes (closed area) decreases from 4.7 to 3.13 mm. This may be attributed to the slow increase in the discharge coefficient for case of the number of holes exceeding 0.104 hole/m2 plate area. In addition, the cost for manufacturing the perforated plate with 0.289 hole/m2 is estimated to be 25% higher than that with 0.104 hole/m2. Therefore, the perforated plate with 0.104 hole/m2 is selected in this study.
Table 3. Duct test results depending on the number of holes of the perforated plate with a thickness of 5 mm and a porosity of 50%
Table 4. Duct test results depending on the number of holes of the perforated plate with a thickness of 5 mm and a porosity of 40%
Table 5. Duct test results depending on the number of holes of the perforated plate with a thickness of 5 mm and a porosity of 30%
Figure 4. Discharge coefficient depending on the number of holes in the perforated plate with a thickness of 5 mm
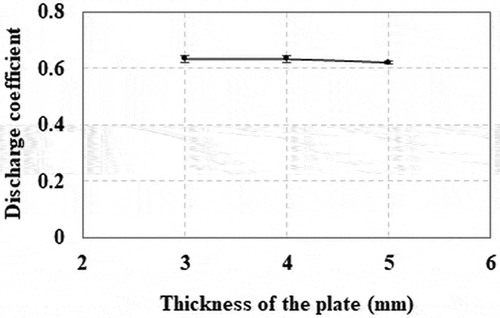
Pressure loss and discharge coefficient are then presented as a function of the porosity of a perforated plate with 0.104 hole/m2 plate area and a thickness of 5 mm. As shown in , discharge coefficient rapidly increases with an increase in the porosity of the perforated plate. Perforated plates with 0.104 hole/m2 plate area and porosity of 50% were prepared with different thicknesses. presents the discharge coefficient as a function of the thickness of the perforated plate. summarizes pressure drop, pressure loss coefficient, and discharge coefficient. As shown in the figure and table, the discharge coefficient is almost consistent with an increase in the thickness of the perforated plate. Therefore, the structure of the perforated plate is determined to be 0.104 hole/m2 plate area, a porosity of 50%, a thickness of 5 mm.
Table 6. Duct test results depending on the plate thickness with a porosity of 50% and 0.104 holes/m2 plate area
Figure 5. Discharge coefficient depending on the porosity of the perforated plate with a thickness of 5 mm and 0.104 hole/m2 plate area
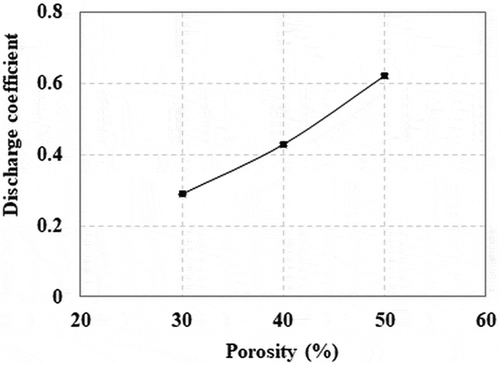
Figure 6. Discharge coefficient depending on the thickness of the perforated plate with a porosity of 50% and 0.104 hole/m2 plate area
Electrostatic precipitator test results
With one perforated plate
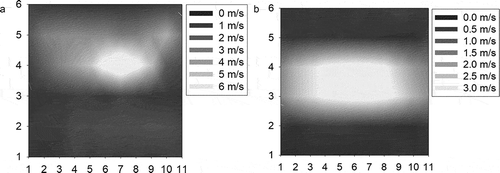
Based on the duct test results, a perforated plate was manufactured with a structure of 0.104 hole/m2 plate area, a thickness of 5 mm, and a porosity of 50%. The velocity distribution in the body of the ESP (S2 plane) was first investigated without placing the perforated plate in the diffuser of the lab-scale ESP. As shown in , a core jet with a velocity of around 8 m/s appeared at the central region, and a large-stalled flow region was observed. The velocity distribution was quite non-uniform with a RMS of 88.12%.
Figure 7. Velocity distribution without the perforated plate (a) and with one perforated plate
One perforated plate was then placed in the diffuser. shows the velocity distribution in the body of the ESP when one perforated plate was installed at the F. Similar to the velocity distribution in an empty diffuser, an axial core jet flow and a stalled flow region were found. This indicates that the boundary layer separation of the diffuser occurs with one perforated plate in the diffuser. The RMS of the velocity distribution is 97.55%, which is higher than the RMS obtained without placing the perforated plate.
With two perforated plates
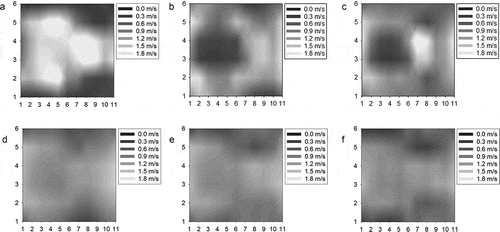
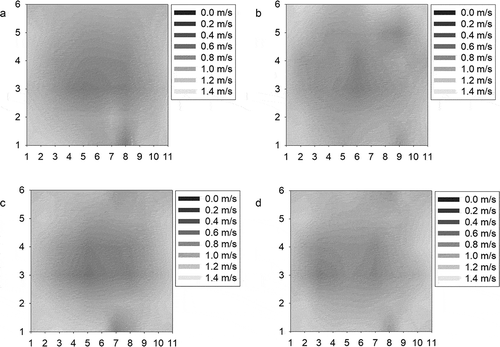
Two perforated plates were placed at different intervals in the diffuser. shows the flow distribution when two perforated plates are arranged at the interval of less than 0.2 m in the diffuser. also represents the inlet velocity, average velocity, RMS%, and standard error for mean velocity at each arrangement of two perforated plates. The inlet velocity was measured at 3 points in the inlet duct (S1 plane). shows the average inlet velocity. The mean velocity was obtained by averaging the velocity values measured at 66 points in the body of the ESP (S2 plane). In addition, standard error for the mean velocity values is obtained from 10 times repeated measurements and is given in the table. RMS% for the velocity values measured at the S2 plane is also shown. With two perforated plates at the inlet of the diffuser, a core jet and stalled flow regions were still observed as shown in . When the perforated plates were located in the middle of the diffuser such as BC and CD, non-uniform flow pattern with a RMS of higher than 40% was found. On the other hand, relatively uniform flow pattern is presented in by increasing the interval between two perforated plates.
Table 7. Summary of velocity distribution with two perforated plates at the interval of less than 0.2 m
Figure 8. Velocity distribution with two perforated plates at the interval of less than 0.2 m
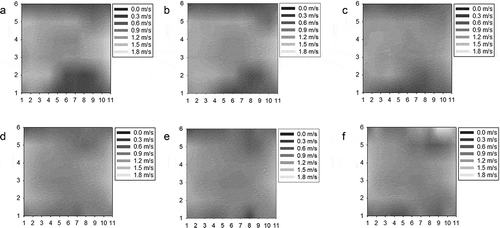
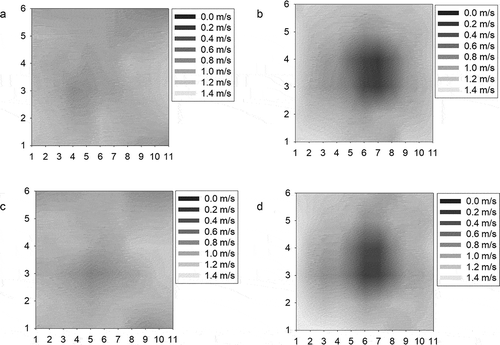
Because two perforated plates placed in the diffuser with an interval less than 0.2 m demonstrated non-uniform flow distribution, two perforated plates were placed with an interval exceeding 0.2 m. As presented in and , the velocity distribution was improved. Especially, in the case of the BE and BF configurations, the velocity profile was quite uniform with RMS values of 28.49% and 29.32%, respectively. However, some stalled flow regions were still found at the top and bottom. This suggests that a more perforated plate is required to obtain a more uniform flow pattern in the body of the ESP.
Table 8. Summary of velocity distribution with two perforated plates at the interval exceeding 0.2 m
Figure 9. Velocity distribution with two perforated plates at the interval exceeding 0.2 m
With three perforated plates
Among the test results obtained with two perforated plates at the interval of less than 0.2 m, the CE and DF configurations showed the lowest and the 3rd lowest RMS%, respectively, as shown in . One more perforated plate was placed upstream of the DF and CE configurations. The results are shown in and . and shows the velocity distribution when the 1st perforated plate was added to the A or the C in the DF configuration. As shown in the figure, low-velocity regions are not found in the ADF and CDF configurations. This indicates that flow separation was suppressed by the 1st perforated plate placed at the inlet side of the diffuser. and also show the velocity profile, when the 1st perforated plate was added to the CE configuration. Similar to the ADF and CDF configurations, low-velocity regions are not found from the ACE and BCE configurations. This shows that the 1st perforated plate has an ability to control the flow separation occurring at the inlet side of the diffuser for the configurations with three perforated plates. In addition, the effect of the 1st perforated plate position on the flow distribution is found to be negligible.
Table 9. Summary of velocity distribution by adding the 1st perforated plate to DF and CE configurations, respectively
Figure 10. Velocity distribution by adding the 1st perforated plate to DF and CE configurations, respectively
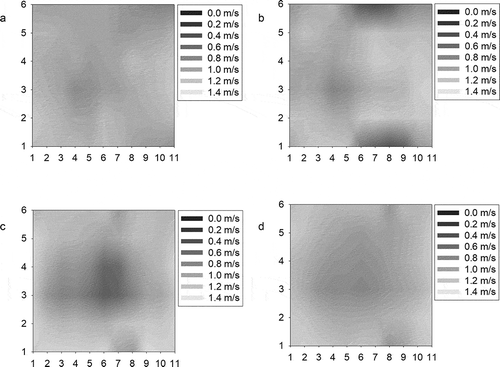
In order to investigate the effect of the 2nd perforated plate on the velocity profile, one more perforated plate was placed between the AF and AE configurations, respectively. Among the configurations with two perforated plates at the interval exceeding 0.2 m, the AF and AE configurations demonstrated the 3rd highest and the 2nd highest RMS%, respectively, as shown in . and show the results. When the 2nd perforated plate was placed in the B, uniform flow distribution was found as shown in and . However, when the 2nd perforated plate was in the E and D, respectively, a stalled flow region was found in the center as shown in and (). Different from the 1st perforated plate, the location of the 2nd perforated plate highly affects the velocity profile in the body of the ESP.
Table 10. Summary of velocity distribution by adding the 2nd perforated plate to AF and AE configurations, respectively
Figure 11. Velocity distribution by adding the 2nd perforated plate to AF and AE configurations, respectively
In order to investigate the effect of the 3rd perforated plate, one more perforated plate was added to the AB and BD configurations, respectively. Among the configurations with two perforated plates at the interval of less than 0.2 m, the AB and BD configurations demonstrated the highest and the 2nd lowest RMS%, respectively, as shown in . and show the velocity profile results. Compared to the velocity profile in the AB configuration, the addition of the 3rd perforated plate made much more uniform velocity distribution. Especially, the addition of the 3rd perforated plate to the F significantly decreased the velocity RMS% such as 20.64%. In addition, when the 3rd perforated plate was placed at the F in addition to the BD arrangement, the velocity RMS% was as low as 21.72%. Although the 3rd perforated plate improved the flow distribution for all configurations, the ABD configuration showed some stalled flow regions at the top and bottom as shown in . In addition, the BDE configuration showed a depleted flow region at the center in . This indicates that when the 3rd perforated plate is placed at the D or E, the flow separation occurring at the outlet side of the diffuser is not prevented. However, when the 3rd perforated plate is placed at the F, very uniform flow distribution is obtained. This suggests that the position of the 3rd perforated plate in the outlet of the diffuser is important to obtain uniform flow distribution in the body of the ESP.
Table 11. Summary of velocity distribution by adding the 3rd perforated plate to AB and BD configurations, respectively
Figure 12. Velocity distribution by adding the 3rd perforated plate to AB and BD configurations, respectively
Conclusion
Lab-scale duct and ESP tests were conducted to design the ESP with an appropriate structure and arrangement of perforated plates. In duct tests, the pressure loss and discharge coefficient depending on the structure of the perforated plate were investigated. As a result, a porosity of 50%, a thickness of 5 mm, and 0.104 hole/m2 plate area were found to be the most acceptable structure of a perforated plate. This structure of a perforated plate was then placed in the diffuser of the lab-scale ESP. Velocity profile in the body of the ESP was investigated depending on the number and arrangement of perforated plates. One perforated plate does not improve flow distribution. Two perforated plates placed with an interval exceeding 0.2 m result in more uniform flow distribution than do those with an interval of less than 0.2 m. However, the perforated plates placed with an interval exceeding 0.2 m still show stalled flow regions at the top and bottom of the cross section of the ESP body. Three perforated plates demonstrate uniform flow distribution. When the 2nd perforated plate is placed at the inlet side of the diffuser, uniform flow distribution is obtained. It is also important to place the 3rd perforated plate at the outlet of the diffuser. Therefore, when the 2nd and 3rd perforated plates are placed at the inlet side and outlet of the diffuser, respectively, very uniform flow distribution such as RMS value of around 20% is obtained. Although this study has suggested the structure and arrangement of perforated plates to obtain uniform flow distribution, it has a limitation on the understanding of flow separation occurred in the diffuser. Further research using computational fluid dynamics is recommended to understand the behavior of flow depending on the arrangement of perforated plates.
Disclosure statement
No potential conflict of interest was reported by the authors.
Additional information
Funding
Notes on contributors
Dong-Uk Kim
Dong-uk Kim is a graduate student in the Department of Environmental Engineering at Chungbuk National University, Korea.
Jin-Tae Kim
Jin-Tae Kim is a researcher in the Environmental System Research Division at Korea Institute of Machinery and Materials, Daejeon, Korea.
Sang Hyun Jeong
Sang Hyun Jeong is a principal researcher in the Environmental System Research Division at Korea Institute of Machinery and Materials, Daejeon, Korea.
Sang-Sup Lee
Sang-Sup Lee is a professor in the Department of Environmental Engineering at Chungbuk National University, Korea.
References
- Ahmed, W. H., M. M. Bello, M. El Nakla, and A. Al Sarkhi. 2012. Flow and mass transfer downstream of an orifice under flow accelerated corrosion conditions. Nucl. Eng. Des. 252:52–67. doi:https://doi.org/10.1016/j.nucengdes.2012.06.033.
- Albright, L. 2008. Albright’s chemical engineering handbook. Boca Raton, FL: CRC Press.
- Ali, M., H. Pasic, K. Alam, S. A. N. Tiji, N. Mannella, T. Silva, and T. Liu. 2016. Experimental study of cross-flow wet electrostatic precipitator. J. Air Waste Manage. 66 (12):1237–44. doi:https://doi.org/10.1080/10962247.2016.1209258.
- Aly, A. A. E. A., A. Chong, F. C. G. A. Nicolleau, and S. Beck. 2010. Experimental study of the pressure drop after fractal-shaped orifices in turbulent pipe flows. Exp. Therm. Fluid Sci. 34 (1):104–11. doi:https://doi.org/10.1016/j.expthermflusci.2009.09.008.
- Barratt, D., and T. Kim. 2015. A banked wide-angle diffuser with application to electrostatic precipitators. P. I. Mech. Eng. A-J. Pow 229 (1):88–98. doi:https://doi.org/10.1177/0957650914553458.
- Bayazit, Y., E. M. Sparrow, and D. D. Joseph. 2014. Perforated plates for fluid management: Plate geometry effects and flow regimes. Int. J. Therm. Sci. 85:104–11. doi:https://doi.org/10.1016/j.ijthermalsci.2014.06.002.
- Bhasker, C. 2011. Flow simulation in electro-static-precipitator (ESP) ducts with turning vanes. Adv, Eng. Softw. 42 (7):501–12. doi:https://doi.org/10.1016/j.advengsoft.2011.04.002.
- Cengel, Y. A. 2010. Fluid mechanics. New York: Tata McGraw-Hill Education.
- Coghe, A., M. Mantegna, and G. Sotgia. 2003. Fluid dynamics aspects of electrostatic precipitators: Turbulence characteristics in scale models. J. Fluids Eng. 125 (4):694–700. doi:https://doi.org/10.1115/1.1593704.
- Dmitriev, S. S., I. M. Borsch, M. O. Plodistiy, A. A. Gusev, and N. A. Larin. 2016. Research of influence of the installation of perforated plates on the flow in the diffuser ducts with turning of the flow at 90°. Therm. Eng+. 63 (1):28–34. doi:https://doi.org/10.1134/S0040601516010031.
- Fadilah, P. A., and D. F. Erawan. 2018. Effect of applying screen and honeycomb to the flow characteristics in wind tunnel based on CFD simulation. J. Phys. Conf. Ser. 1130 (1):012008. doi:https://doi.org/10.1088/1742-6596/1130/1/012008.
- Guo, B. Y., Q. F. Hou, A. B. Yu, L. F. Li, and J. Guo. 2013. Numerical modelling of the gas flow through perforated plates. Chem. Eng. Res. Des. 91 (3):403–08. doi:https://doi.org/10.1016/j.cherd.2012.10.004.
- Haque, S. M. E., M. G. Rasul, A. V. Deev, M. M. K. Khan, and N. Subaschandar. 2009a. Flow simulation in an electrostatic precipitator of a thermal power plant. Appl. Therm. Eng. 29 (10):2037–42. doi:https://doi.org/10.1016/j.applthermaleng.2008.10.019.
- Haque, S. M. E., M. G. Rasul, M. M. K. Khan, A. V. Deev, and N. Subaschandar. 2007. Flow distribution inside an electrostatic precipitator: Effects of uniform and variable porosity of perforated plate. Proceedings of the 5th IASME/WSEAS International Conference on Heat Transfer, Athens, August 25-27.
- Haque, S. M. E., M. G. Rasul, M. M. K. Khan, A. V. Deev, and N. Subaschandar. 2009b. Influence of the inlet velocity profiles on the prediction of velocity distribution inside an electrostatic precipitator. Exp. Therm. Fluid Sci. 33 (2):322–28. doi:https://doi.org/10.1016/j.expthermflusci.2008.09.010.
- Hein, A. G. 1989. Dust reentrainment, gas distribution and electrostatic precipitator performance. JAPCA J. Air Waste Ma. 39 (5):766–71. doi:https://doi.org/10.1080/08940630.1989.10466562.
- Jędrusik, M., A. Świerczok, and D. Łuszkiewicz. 2017. Physical and numerical modelling of gas flow in electrostatic precipitator. Przeglad Elektrotechniczny 93. doi:https://doi.org/10.15199/48.2017.02.50.
- Karthikeyan, P., A. Kumar, A. Aakash, A. A. Meshak, and V. Vimalprakash. 2019. Experimental and computational investigations of flow through diffuser with perforated plates. Int. J. Engg. Res. Technol. 7 (11):1–5.
- Lipták, B. 2003. Instrument engineers’ handbook, Vol. 1. Process Measurement and Analysis. Boca Raton, FL: CRC Press.
- Malavasi, S., G. Messa, U. Fratino, and A. Pagano. 2012. On the pressure losses through perforated plates. Flow Meas. Instrum. 28:57–66. doi:https://doi.org/10.1016/j.flowmeasinst.2012.07.006.
- Manshoor, B., I. Zaman, and A. Khalid. 2013. Experimental study of pressure drop after the circle grids fractal orifice. Appl. Mech. Mater. 390:111–15. doi:https://doi.org/10.4028/www.scientific.net/AWM.390.111.
- Meng, X., Z. Zuo, M. Nishi, and S. Liu. 2020. A numerical study on the flow mechanism of performance improvement of a wide-angle diffuser by inserting a short splitter vane. Processes 8 (2):143. doi:https://doi.org/10.3390/pr8020143.
- Menon, S. 2004. Piping calculations manual. New York: McGraw Hill Professional.
- Miller, R. W. 1983. Flow measurement engineering handbook. New York: McGraw-Hill.
- Noui-Mehidi, M. N., J. Wu, I. D. Utalo, and C. Grainger. 2005. Velocity distribution downstream of an asymmetric wide-angle diffuser. Exp. Therm. Fluid Sci 29 (6):649–57. doi:https://doi.org/10.1016/j.expthermflusci.2004.10.002.
- Randolph, S. W. 1953. A study of gas distribution in electrostatic precipitators. Air Repair, 3 (2):70–78. doi:https://doi.org/10.1080/00966665.1953.10467605
- Robinson, M. 1968. Turbulent gas flow and electrostatic precipitation. JAPCA J. Air Waste Ma. 18 (4):235–39. doi:https://doi.org/10.1080/00022470.1968.10469120.
- Sagar, D., A. R. Paul, and A. Jain. 2011. Computational fluid dynamics investigation of turbulent separated flows in axisymmetric diffusers. Int. J. Environ. Sci. Technol. 3 (2): 104–109.
- Sahin, B., and A. J. Ward-Smith. 1987. The use of perforated plates to control the flow emerging from a wide-angle diffuser, with application to electrostatic precipitator design. Int. J. Heat Fluid Fl. 8 (2):124–31. doi:https://doi.org/10.1016/0142-727X(87)90011-7.
- Sahin, B., and A. J. Ward-Smith. 1990. Effect of perforated plates on wide-angle diffuser-exit velocity profiles. J. Wind Eng. Ind. Aerod. 34 (2):113–25. doi:https://doi.org/10.1016/0167-6105(90)90139-4.
- Sahin, B., and A. J. Ward-Smith. 1993. The pressure distribution in and flow characteristics of wide-angle diffusers using perforated plates for flow control with application to electrostatic precipitators. Int. J. Mech. Sci. 35 (2):117–27. doi:https://doi.org/10.1016/0030-7403(93)90070-B.
- Sahin, B., A. J. Ward-Smith, and D. Lane. 1995. The pressure drop and flow characteristics of wide-angle screened diffusers of large area ratio. J. Wind Eng. Ind. Aerod. 58:33–50. doi:https://doi.org/10.1016/0167-6105(95)00018-M.
- Seltsam, M. M. 1995. Experimental and theoretical study of wide-angle diffuser flow with screens. Aiaa J. 33 (11):2092–100. doi:https://doi.org/10.2514/3.12952.
- Shin, W. H., W. S. Hong, and D. K. Song. 2010. Relationship between ICAC EP-7 and% RMS, standards for gas flow uniformity inside electrostatic precipitators. J. Korean Soc. Atmos. Environ. 26 (2):234–40. doi:https://doi.org/10.5572/KOSAE.2010.26.2.234.
- Su, L., Q. Du, Y. Wang, H. Dong, J. Gao, M. Wang, and P. Dong. 2018. Purification characteristics of fine particulate matter treated by a self-flushing wet electrostatic precipitator equipped with a flexible electrode. J. Air. Waste Manage. 68 (7):725–36. doi:https://doi.org/10.1080/10962247.2018.1460635.
- Swaminathan, M. R., and N. V. Mahalakshmi. 2010. Numerical modelling of flow through perforated plates applied to electrostatic precipitator. J. Applied Sci. 10 (20):2426–32. doi:https://doi.org/10.3923/jas.2010.2426.2432.
- Uehleke, H., and T. Werner. 1975. Flow of fluids through valves, fittings, and pipe (TP-410 (US edition)). Arch. Toxicol. 34:289–308. doi:https://doi.org/10.1007/BF00353849.
- Ullum, T., and P. S. Larsen. 2005. Swirling Flow Structures in Electrostatic Precipitator. Flow Turbul. Combust. 73 (3–4):25–275. doi:https://doi.org/10.1007/s10494-005-6772-9.
- Ward-Smith, A. J., D. L. Lane, A. J. Reynolds, B. Sahin, and D. J. Shawe. 1991. Flow regimes in wide-angle screened diffusers. Int. J. Mech. Sci. 33 (1):41–54. doi:https://doi.org/10.1016/0020-7403(91)90026-Y.
- Yang, Z., C. Zheng, Q. Chang, Y. Wan, Y. Wan, Y. Wang, X. Gao, and K. Cen. 2017. Fine particle migration and collection in a wet electrostatic precipitator. J. Air Waste Manage. 67 (4):498–506. doi:https://doi.org/10.1080/10962247.2016.1260074.