
 ?Mathematical formulae have been encoded as MathML and are displayed in this HTML version using MathJax in order to improve their display. Uncheck the box to turn MathJax off. This feature requires Javascript. Click on a formula to zoom.
ABSTRACT
Cooking is one of the most significant indoor sources of particles. This study investigated residential cooking and kitchen ventilation behaviors in Canadian homes, using data from 132 households in Halifax and Edmonton. Only 27% of the cooking activities were conducted with added ventilation (range hood use 10%, window opening 15%, and both 2%). The use pattern of the range hood was associated with mealtime and cooking method/device. The frequency of window opening was influenced by season and did not show a clear linkage to ventilation for cooking. Fine particle (PM2.5) decay rates, source strengths, emission masses, and exposure levels were estimated for cooking activities under different ventilation conditions. The results demonstrated the effect of kitchen ventilation on PM2.5 removal. Using a range hood and (or) opening kitchen windows increased the geometric mean (GM) decay rate by a factor of two. The GM source strength from cooking was 0.73 mg min−1 (geometric standard deviation (GSD) = 4.3) over an average cooking time of 17 minutes (GSD = 2.6). The GM emission mass was 12.6 mg (GSD = 5.3). The GM exposure from a single cooking event was 12 µg m−3 h (GSD = 6.6). The average number of cooking events per day was 2.4 (SD = 1.5) times. Cooking contributed about 22% to the total daily PM2.5 exposure in participating homes. The frequency and duration of cooking conducted at various temporal scales (mealtime, weekday/weekend, and season), as well as the use of different methods and devices, can support more accurate modeling of the impact of cooking on indoor air quality and human exposure.
Implications: The inadequate use of ventilation during cooking highlights the need for educational programs on cooking exposures and ventilation strategies, such as running a range hood fan or opening kitchen windows when possible. Exposures in newly built homes might be a bigger concern than older homes if not providing sufficient ventilation during cooking, due to the tighter building envelopes.
Introduction
Indoor aerosol exposure is recognized as a major environmental health concern, as people spend the majority of their time indoors (Klepeis et al. Citation2001; Matz et al. Citation2014). Cooking is one of the most significant indoor sources of aerosol particles (Abt et al. Citation2000; Özkaynak et al. Citation1996; Wallace Citation1996). The United States Environmental Protection Agency (U.S. EPA)’s Particle Total Exposure Assessment Methodology study estimated that 25% of both indoor fine particles (PM2.5) and coarse particles (PM10) are attributable to cooking and the proportion increased to 66% and 57%, respectively, when considering indoor sources only (Özkaynak et al. Citation1996). The chemical composition of particulate matter emitted during cooking (e.g. polycyclic aromatic hydrocarbons, organic carbon, and elemental carbon) may have harmful effects on the respiratory and nervous systems, causing inflammation, DNA damage, and altering the permeability of cells by inducing the production of oxygen species in tissues (Elder and Oberdörster Citation2006; Gemenetzis et al. Citation2006; Lu et al. Citation2008; Oberdörster et al. Citation2000). Epidemiological studies suggest that exposures to fine and ultrafine particles can lead to adverse health effects, especially on respiratory and cardiovascular systems (Delfino, Sioutas, and Malik Citation2005; Kennedy Citation2007; Timonen et al. Citation2006).
Characterizing cooking exposures is challenging due to the variable nature of cooking parameters, house conditions, and resident ventilation behaviors. Many studies have been carried out to evaluate influencing factors on cooking emissions (e.g. fuel type, cooking style, cooking oil, and cooking temperature) (Buonanno, Morawska, and Stabile Citation2009; Chen, Zhao, and Zhao Citation2018; See and Balasubramanian Citation2006; Torkmahalleh et al. Citation2018; Wallace et al. Citation2008). Other studies have demonstrated the effect of ventilation on reducing exposures from cooking (Dobbin et al. Citation2018; Kang et al. Citation2019; Rim et al. Citation2012; Singer et al. Citation2017; Sun et al. Citation2018). However, the prevalence of kitchen ventilation and use patterns are often ignored. Without knowing how natural and mechanical ventilation is normally used during cooking, exposure estimates could be erroneous.
Published data on residential cooking and ventilation behaviors are limited. Large-scale surveys conducted in North America, such as the earlier Canadian Human Activity Pattern Survey (CHAPS) (Leech et al. Citation1996), the more recent CHAP 2 (Matz et al. Citation2014), and the U.S. EPA National Human Activity Pattern Survey (NHAPS) (Klepeis et al. Citation2001) did not provide information on cooking or kitchen ventilation behaviors. Few studies have been conducted on these aspects (Huang et al. Citation2014; Klug, Lobscheid, and Singer Citation2011a; Klug et al. Citation2011b; Lee et al. Citation2012; Nagda et al. Citation1989; Parrott, Emmel, and Beamish Citation2003). In particular, little is known about cooking and kitchen ventilation behaviors in Canadian homes. This study aims to fill this information gap by characterizing cooking and the associated ventilation behaviors in 132 households of two Canadian cities. In addition, the behavior data were linked to continuous PM2.5 measurements to assess the effect of ventilation on pollutant removal, source strength, emission mass, and time-integrated exposure due to cooking.
Methods
Study design
In 2009 and 2010, Health Canada and its collaborators conducted residential indoor air quality (IAQ) studies in two Canadian cities, Halifax and Edmonton (Kearney et al. Citation2014; MacNeill et al. Citation2014). Nonsmoking households were recruited using stratified sampling based on home construction year (<1945, 1946–1960, 1961–1980, 1981–2000, and 2001–2008). For each home, an interviewer-administered baseline questionnaire was completed to obtain information on housing characteristics, such as age and type of home, cooktop fuel type (electric or gas), and range hood ventilation type (vented or unvented). A vented range hood is attached to a duct to extract the air to the outside. An unvented range hood (often called recirculating or ductless range hood) pulls the air through a filter and blows it back into the house. For each day of sampling, a daily participant-administered questionnaire was completed to obtain information on cooking and ventilation activities in the previous 24 hours. The cooking activities were collected for selected cooking devices (stove, oven, toaster oven, and toaster) and cooking methods (frying, sautéing, boiling, baking, grilling, broiling, toasting, and barbequing). For each cooking device/method conducted, the participants were asked to record the start time and duration of cooking. The information on range hood use and window opening was collected by recording the start time and duration. The location of the windows being opened was also recorded by the participants. A sample of the questionnaire is shown in the Supplemental Information (SI).
Continuous PM2.5 measurements (1-min integration) were made at each home for seven consecutive 24-hour periods in both winter (January to April) and summer (June to September) using a DustTrak (Model 8520, TSI, MN, U.S.). DustTrak measurements were adjusted using the zero-check values reported by the instrument. As DustTrak measurements typically overestimate PM2.5 (Wallace et al. Citation2011), in addition to continuous measurements, 24-hour filter-based PM2.5 samples were collected using Harvard Impactors (Air Diagnostics and Engineering Inc. Harrison, ME, U.S.) to estimate the bias. The Harvard Impactors were operated at a flow rate of 10 l/min, with a conditioned and pre-weighted Teflon filter (37 mm, 2 µm pore size, Pall Inc., Port Washington, NY, U.S.) to capture particles smaller than 2.5 µm in diameter. PM2.5 gravimetric concentrations were calculated using the method outlined in the Quality Assurance Guidance Document 2.12 by the U.S. EPA (EPA Citation1996). The sampling equipment was located in either the living or family room where participants spent the majority of their waking time. Participants were asked to continue with their normal activities throughout the sampling period.
Data analysis
Ventilation-related activities include both range hood operation and having one or more windows open in the kitchen or other parts of the home during cooking and for the following 15 minutes after cooking had stopped. To identify peak levels associated with cooking, time periods were restricted to known cooking events that were recorded by the participant. A participant-identified cooking event was selected for analysis if the data showed a clear increase in PM2.5 concentrations above background, followed by a return toward the background level.
The interval between activities was often not long enough to allow pollutant concentrations to return to the background levels before the next activity. For example, during the decay of a cooking episode, there might be an increase in pollutant concentrations caused by the next activity. In this case, a linear regression model was developed using data during the decay before the start of the next activity and the model was used to estimate the concentration without the impact of the next activity. Sometimes, two or more cooking activities occurred very closely in time, and the peak was caused by more than one activity. In this case, activities were combined and treated as a single event.
Decay rate, source strength, emission mass, and exposure estimation
The decay rate and source strength of cooking were estimated using a mass balance model and assuming a single well-mixed zone for the entire house (Koutrakis, Briggs, and Leaderer Citation1992).
where Cin and Cout are the indoor and outdoor PM2.5 concentrations (mg m−3), t is time (h), P is the penetration efficiency, α is the air exchange rate (h−1), k is the deposition rate (h−1), S is the source strength (mg h−1) and V is the volume of the house (m3).
EquationEquation (1)(1)
(1) can be simplified by making the further assumptions that P, Cout, S, α, and k are constant (Olson and Burke Citation2006; Wallace, Emmerich, and Howard-Reed Citation2004) and can be written as EquationEquations (2
(2)
(2) ) and (Equation3
(3)
(3) ) for estimating PM2.5 concentrations during and after cooking, respectively.
where Cpeak and Cb are the peak and background concentrations of PM2.5, t is measured from when the increase begins, and tp is the time when the peak concentration occurs, which is a little bit later than the source turned off.
The background concentrations (Cb) were estimated using the average value of the 15 minutes before cooking started if there are no other sources before a cooking event. If cooking started during the decay of a previous event, the background was estimated using the predicted concentrations of the previous event. To estimate the decay rate (k + α) of a cooking event using EquationEquation (3)(3)
(3) , a linear regression on the natural logarithms of the background-removed particle concentrations after the peak was performed. The negative slope of the regression is the decay rate, which incorporates all particle removal mechanisms including air exchange (α) and deposition rates (k). These mechanisms also include coagulation and condensation/evaporation. A restriction was imposed requiring the regression to explain at least 90% of the observed variance (R2 > 0.9). The source strength (S) of cooking was then calculated using EquationEquation (2)
(2)
(2) along with the estimated decay rate and participant’s house volume (excluding the basement). The emission mass was estimated by the product of source strength and cooking duration. The exposure (E) from cooking was estimated by integrating the background-removed PM2.5 concentrations (Cin) over the period when the particle concentration rises markedly (t = 0) till it drops down to the background level (t = t1).
Statistical analysis
Descriptive statistics summarized the characteristics of participant households, cooking activities (frequency and duration), ventilation patterns (frequency, timing, and duration), PM2.5 decay rates, source strengths, emission masses, and exposure levels. The cooking durations, decay rates, source strengths, emission masses, and exposure levels across all participants followed a log-normal distribution; therefore results were reported as geometric mean (GM), geometric standard deviation (GSD), 95% confidence interval (CI), and interquartile range (IQR).
Potential factors influencing cooking and ventilation behaviors were examined, including cooking method/device, mealtime (breakfast, lunch, or dinner), weekday vs. weekend, season, cooktop fuel type (electric or gas), range hood ventilation type (vented or unvented), city, home construction year, number of residents, total household income, and homeowner educational level.
For categorical variables, cross-tabulation, Pearson’s Chi-square test (Goodness-of-fit test, Independence test), and Fisher’s exact test (where the chi-square test is inappropriate) were used to determine whether there is a statistical relationship between a certain behavior and influential factors. The Cramer’s V correlation coefficient was used to quantify the effect size of the Chi-square test (less than 0.10: very weak, 0.10 to 0.19: weak, 0.20 to 0.29: moderate, 0.30 and above: strong). For continuous variables, a linear mixed model with a variance components covariance structure was employed on log-transformed dependent variables to assess significant factors. The Tukey-Kramer multiple comparison test (p < .05) was used to identify differences among influential factors. All the analyses were conducted using SAS EG 7.1 (Cary, North Carolina, USA).
Results
Household characteristics
A total of 132 homes were recruited in Halifax and Edmonton. A general description of the homes is presented in . Most homes were detached dwellings (92%) and had electric ranges (78%). The cooktop fuel type (78% electric, 22% gas) was in general agreement with the responses from the nationwide Canadian Human Activity Pattern Survey 2 (84% electric, 16% gas). The range hood ventilation type was vented (55%), unvented (22%), or unknown (5%). About 18% of the homes did not have a range hood. Home construction year had a large impact on the installation of range hoods (p < .0001): 79% of the homes with an unvented range hood and 96% of the homes with no range hood were built before 2000.
Table 1. General description of the sampling homes
Cooking behaviors
Frequency of cooking
There were 2748 indoor cooking activities reported by the participants. shows the cooking frequency by influential factors, including season, weekday vs. weekend, mealtime, and cooking method/device. People cooked more often in winter than in summer (57% in winter vs. 43% in summer, p < .0001). The difference remained significant after including the 96 outdoor barbecues in summer. In winter, people cooked more frequently at lunch (60% in winter vs. 40% in summer) and dinner (59% in winter vs. 41% in summer) than in summer. The seasonal variation was not significant for breakfast. High-heat cooking methods were used less often in summer than in winter, including oven baking, stove boiling, oven broiling, toaster oven toasting, and toaster toasting (all p < .05). People cooked most often at dinner (41%) and least often at breakfast (24%). There were no significant differences in weekday vs. weekend for dinner and breakfast, but lunch cooking occurred more extensively on weekends than during the week (62% on a weekend day vs. 38% on a weekday).
Table 2. Number and percentage of indoor cooking activities by influential factors
The four most popular cooking methods/devices were toaster toasting (29%), stove frying (18%), stove boiling (16%), and oven baking (16%). There was a strong association between mealtime and cooking method/device on cooking frequency (Cramer’s V = 0.39). As shown in the SI Figure S1, from breakfast to dinner, the frequencies of toasting by a toaster or toaster oven were decreased, and the frequencies of stove boiling and baking by an oven or toaster oven were increased dramatically. There was no seasonal impact on the correlation between mealtime and cooking method/device.
Duration of cooking
Across all cooking events, the GM cooking duration was 11 minutes (GSD = 3.1). The duration of cooking was associated with mealtime, weekday vs. weekend, and cooking method/device (). In the table, a letter group was used to summarize the results of multiple comparison tests. For each factor, groups with the same letter were not significantly different from each other (p > .05). For example, for the factor cooking method/device, the duration of stove boiling (BCD), stove frying (CD), and stove grilling (D) all contained the letter D. Therefore, the cooking durations of these three methods were not significantly different from each other. Results of multiple comparison tests for all pairs of groups are presented separately for each influential factor in SI Tables S1-S3.
Table 3. Duration of cooking activities by influential factors
People spent the longest time cooking at dinner and least at breakfast (p < .0001). People also cooked for longer times on weekends than on weekdays, especially for breakfast and dinner (p < .0001). There was no significant difference in the time spent on lunch between weekdays and weekends. The duration of cooking varied greatly by method/device (p < .0001), ranging from 3 minutes (toaster toasting) to 41 minutes (oven baking) on average. For certain cooking methods/devices, the duration of cooking was shown to be associated with mealtime (p < .05). Oven baking and toaster toasting took longer at lunch and breakfast than at dinner. Stove frying and stove boiling took longer at dinner than at breakfast and lunch. Other factors examined were not strongly associated with cooking frequency and duration, including cooktop fuel type, range hood ventilation type, city, home construction year, number of residents, total household income, and homeowner educational level.
Ventilation behaviors
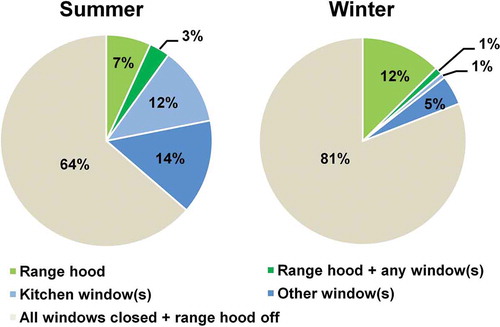
One important aspect of the behaviors related to cooking is kitchen ventilation. In this study, only 27% of the cooking activities were conducted with ventilation (range hood use 10%, window opening 15%, and both 2%). A strong seasonal effect was noted on ventilation conditions (Cramer’s V = 0.32). In summer, 36% of the cooking activities were carried out with ventilation (range hood, windows, or both), compared to only 19% in winter (). In summer, opening windows, especially kitchen windows, was a dominant ventilation method; while in winter, the window opening was decreased by 71%.
Figure 1. Ventilation conditions during cooking or within 15 minutes after cooking ended, by season
Frequency of range hood use
The frequency of range hood use was moderately associated with mealtime (Cramer’s V = 0.21) and cooking method/device (Cramer’s V = 0.26). The range hoods were used more often at dinner cooking (22%), followed by lunch (13%) and breakfast (5%). In terms of the cooking method/device, the range hoods were used more often for oven grilling (31%), stove sautéing (26%), stove frying (23%), and toaster oven grilling (20%). They were used less often for toaster oven toasting (5%), toaster oven baking (4%), and toaster toasting (2%). The ventilation type of range hood had a weak impact on use frequency (Cramer’s V = 0.12). Vented range hoods were used more often (16%) than unvented range hoods (9%) and range hoods of unknown ventilation type (6%). Although range hoods were used more often in winter than in summer, the difference was not statistically significant.
Timing of range hood use
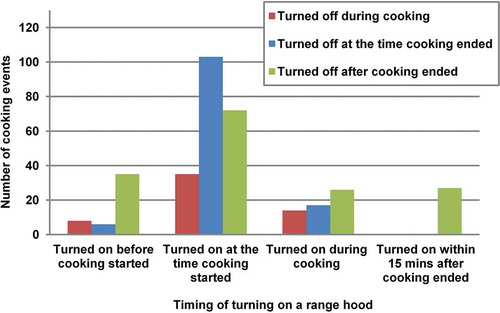
shows the timing of the range hood operation in comparison with cooking start and end time. When a range hood was used, the range hood was turned on before or at the time when cooking started for 76% of the cases and continually operated till the end of cooking for 63% of the cases. When range hoods were turned on at a later point (during or after cooking), for about four-fifths of such cases, the range hoods were kept running till the end of cooking or even after. For only 4% of cooking with range hood use, the fan was operated for a short time (turned on after cooking started and turned off before cooking ended). When range hoods were turned on during cooking, the average starting time was about halfway through the cooking period. The timing of the range hood operation was not correlated with any factors examined.
Figure 2. The timing of turning on and off a range hood due to cooking
Frequency of window opening
As has been mentioned earlier, window opening followed seasonal patterns (summer 26% vs. winter 6%). The kitchen windows were opened more often for homes that had an unknown ventilation type range hood (16%), followed by vented range hood (7%), unvented range hood (5%), and no range hood (3%). The factors that were found to be associated with range hood use (mealtime and cooking method/device) were not correlated with window opening frequency. It should be noted that the questionnaire did not ask if the windows were opened specifically to increase ventilation during cooking. The windows opened in summer may reflect general ventilation behaviors rather than any linkage to cooking.
Timing of window opening
shows the timing of window opening in comparison with cooking start and end time. The season was strongly correlated with the timing of window opening (Cramer’s V = 0.37). In summer, for the cooking activities while windows were opened, the length of window opening was sufficient to cover the entire cooking period for the majority of the cases (92%). In winter, for the cooking activities while windows were opened, only 61% of the cases had the windows opened for the entire cooking period.
Figure 3. The timing of opening and closing the windows related to cooking episodes
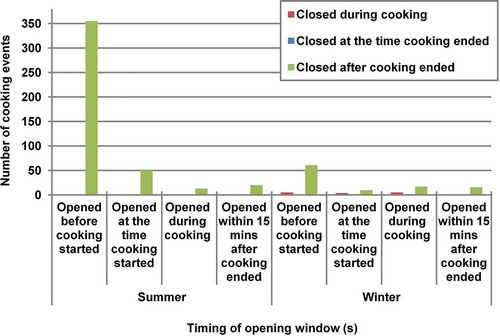
The timing of window opening was also related to cooking method/device, with a stronger correlation in winter (Cramer’s V = 0.30) than in summer (Cramer’s V = 0.15). For short-time cooking activities, such as toasting, frying, and sautéing, people tended to leave the windows open until the end of cooking. For longer time cooking activities, such as baking, it was less likely that the windows were opened for the entire cooking period, especially in winter.
Particle decay rates
A comparison of 24-h average DustTrak concentrations to the sum of co-located gravimetric samples showed that DustTrak overestimated gravimetric PM2.5 concentrations by a factor of 2.44 (Edmonton, winter), 2.76 (Edmonton, summer), and 1.88 (Halifax, winter and summer), respectively (Kearney et al. Citation2014; MacNeill et al. Citation2014). To reduce the bias, the DustTrak measurements were corrected for both cities to provide gravimetric estimates of PM2.5.
The GM PM2.5 decay rate was 1.34 h−1 (GSD = 2.0) across all selected cooking events (R2 > 0.9; N = 247). summarizes the estimated decay rates by ventilation condition. Results of multiple comparison tests for all pairs of groups are presented in SI Table S4. Ventilation had a large effect on particle decay rates, increasing the GM decay rate by a factor of two. There was no significant difference in particle decay rates resulting from running a range hood, opening kitchen windows, or both. Although the GM decay rate was higher when running a vented range hood (2.5 h−1, GSD = 1.7) than an unvented range hood (2.0 h−1, GSD = 1.6), the difference was not statistically significant.
Table 4. Estimated PM2.5 decay rates by ventilation condition
When there was no ventilation by a range hood or windows, the home construction year had a large impact on PM2.5 decay rates (, SI Table S5). For homes built after 2000, the GM particle decay rate was 37% lower than the homes built before 1941. Although range hoods were installed in almost all (96%) of the homes built after 2000, they were only used for 11% of the cooking activities, and kitchen windows were opened for only 5% of the cooking activities.
Table 5. Estimated PM2.5 decay rates by home construction year, under the condition of no range hood use and all windows closed
Source strengths and emission masses
The GM PM2.5 source strength of cooking was 0.73 mg min−1 (GSD = 4.3, N = 247) over an average cooking time of 17 minutes (GSD = 2.6). The GM emission mass was 12.6 mg (GSD = 5.3). Cooktop fuel type had a large impact on PM2.5 source strengths and emission masses. The GMs of source strength and emission mass by gas stoves were twice as high as electric stoves (p < .01) (). The differences were most evident in stove frying (p < .05). For sautéing, boiling, baking, and multiple cooking methods combined, although source strengths were higher with a gas stove than an electric one, the differences were not statistically significant. Results of multiple comparison tests for all pairs of groups are presented in SI Table S6 for source strength and Table S7 for emission mass.
Table 6. Estimated PM2.5 source strengths and emission masses by cooktop fuel type and cooking method/device
The ventilation condition was not strongly influenced by PM2.5 source strength and emission mass. Although not statistically significant, range hood use was associated with higher source strengths (GM 2.2 times higher than with range hood off) and emission masses (GM 1.4 times higher than with range hood off) (SI Table S8). The observed tendency of increased range hood use with higher source strengths and emission masses indicated that people tended to use the range hood when there were noticeable emissions from cooking, such as smokes or odors. It is noted that window opening was not likely due to high particle emissions from cooking. This was another evidence that window opening may not be closely related to cooking, but more influenced by season.
The cooking method/device was not strongly associated with source strength and emission mass (SI Table S9). Although the GM source strengths and emission masses of stove grilling, stove frying, stove sautéing, and multiple cooking styles were higher than stove boiling, the differences were not statistically significant.
Exposures
The GM cooking exposure of a person in the living or family room was 12 µg m−3 h (GSD = 6.6) over an average exposure time of 1.4 hours (GSD = 3.0). The exposure time includes both cooking and post-cooking decay period. summarizes the exposure estimates at different periods: during cooking, and each hour after cooking. On average, the exposure during the cooking period accounted for about 28% of the total exposure for a cooking episode. For 69% of the cooking activities, the PM2.5 concentrations dropped down to the background level within one hour after cooking. For 30% of the cooking events, it took up to four hours to return to pre-cooking levels. The GM of daily cumulative exposure to PM2.5 was 134 µg m−3 h (GSD = 2.3). The average number of cooking events per day was 2.4 (SD = 1.5) times. Therefore, cooking contributed about 22% to the total daily PM2.5 exposure.
Table 7. Exposure estimates for a person in the living or family room to PM2.5 due to cooking
The differences in cooking exposure levels with and without ventilation use were not statistically significant. The lack of a clear association between exposure and kitchen ventilation use does not conflict with the observation that kitchen ventilation had a strong effect on particle decay rates. Rather, the results suggest that people tended to use ventilation when the particle emission amount was high enough to be noticeable or cause uncomfortable air conditions.
Discussion
Kitchen ventilation during cooking is important to remove air pollutants emitted by cooking. In this study, it was found that more than two-thirds of the cooking activities were conducted without running a range hood or opening any windows. The inadequate use of range hood during cooking and the influential factors were also reported in other studies. Nagda et al. (Citation1989) reported that two-thirds of the 3000 homes surveyed in the U.S. had a range hood. For those homes, only 38% of the homes used the range hood frequently at dinner, 14% at lunch, and 19% at breakfast. A more recent Web-based survey was conducted by Klug, Lobscheid, and Singer (Citation2011) on cooking appliance use in 372 California homes. It showed that around 40–60% of the participants did not use a range hood or open any windows during cooking.
In this study, range hood use was associated with mealtime and cooking method/device. The influence of mealtime was consistent with the findings by Klug, Lobscheid, and Singer (Citation2011). Other reported influential factors include the duration of cooking and the presence of children and/or seniors residents (Klug, Lobscheid, and Singer Citation2011; Nagda et al. Citation1989). In this study, although range hood use was shown to increase with increased extent of cooking time for the majority of cooking methods/devices, the association was not statistically significant. The age of residents was not collected in the study and the number of residents was not correlated with range hood use.
The timing of running a range hood has a significant impact on reducing exposures due to cooking. The households benefit most from range hoods when using them frequently and turning them on before (or as soon as) burners are started and remain on beyond the end of cooking (Nagda et al. Citation1989; Singer et al. Citation2017). A recent study has demonstrated that running a range hood for an extra 15 minutes after cooking offers similar reductions in PM2.5 to that achieved by a 100 cubic feet per minute (CFM) increase in the flow rate of the range hood used while cooking (Dobbin et al. Citation2018). In this study, although range hoods were used for only 12% of the cooking activities, when they were used, the operation time was generally sufficient to cover the entire cooking period for most of the cases.
In this study, the decay rate was used to assess the effect of kitchen ventilation on particle removal. A more direct method to assess the performance of range hoods is to measure the capture efficiency, which quantifies the fraction of emitted pollutants that are exhausted by a range hood before mixing into the room air (Delp and Singer Citation2012; Lunden, Delp, and Singer Citation2015; Singer et al. Citation2012, Citation2017). As capture efficiency is usually measured from the range hood exhaust discharge or in the exhaust duct, it cannot be applied to assess the effect of window opening. Therefore, the decay rate was used to estimate particle losses due to ventilation. It incorporates particle loss due to air exchange, deposition, coagulation, and condensation/evaporation that are not considered by the capture efficiency.
In residential buildings, the performance of a range hood is influenced by many factors, such as the fan flow rate, range hood location, hood shape and cooktop coverage, kitchen design (enclosed, semi-open, or open), tightness, and air volume of the building (Cao et al. Citation2017; Kang et al. Citation2019; Singer et al. Citation2012, Citation2017). Despite the possible large variations, the results showed that the use of range hoods had a significant effect on PM2.5 decay rate. Similar rates of reduction due to range hood use were reported by other studies. Kang et al. (Citation2019) reported that the PM2.5 decay rate was increased by about 2.9 times on average with the operation of a range hood. Zhang et al. (Citation2010) reported that turning on an unvented range hood during cooking increased the particle decay rate by a factor of two. Wallace et al. (Citation2013) found that the use of a kitchen exhaust fan increased the PM2.5 decay rate by 3.5 times the mean value of 1.66 h−1. Dobbin et al. (Citation2018) found that running a range hood during cooking increased the PM2.5 decay rate by about up to four times the mean value of 1.9 h−1 when no ventilation was used.
Opening one or more kitchen windows was also shown as an effective way to remove particles emitted from cooking, increasing the decay rate by a factor of 2.5 on average. An early study by Wallace, Emmerich, and Howard-Reed (Citation2002) investigated the effect of temperature, wind, attic fan, and windows on air change rates in an occupied house. Opening windows were found to have the strongest influence on air change rate, increasing the rate as much as 2 h−1 for extended periods, and up to 3 h−1 for short periods of a few hours. It should be noted that the effect of open windows depends on many factors, including the size and location of the windows, wind speed, and direction, the turbulence characteristics in the wind, the pressure variations caused by wind gusts, the temperatures inside and outside the room, as well as outdoor pollutant concentrations if close to a roadway (Howard-Reed, Wallace, and Ott Citation2002; Tong et al. Citation2016). Many of these factors are not always controllable and the extent of use is also limited by weather conditions. Opening windows in other rooms did not increase the decay rate significantly, suggesting that the location of windows being opened is important when removing pollutants from locally emitted sources, such as cooking.
When there was no ventilation by range hood or windows, particle removal was correlated with home construction year. This can be explained by the improved airtightness of the newer houses. Over the years, Canadian houses are being built with more thermal insulation and better airtightness as required by building codes and standards (e.g. National Building Code of Canada, National Energy Code of Canada, ASHRAE standard, and R2000 standard) to reduce air leakage and energy consumption (Parekh, Roux, and Gallant Citation2007). Therefore, newer houses usually have lower natural air exchange rates than older houses, resulting in lower decay rates of particles. There are other factors influencing the loss rate of particles, such as deposition, coagulation, and condensation/evaporation. As the real-time air exchange rates were not measured in this study, the ranges and variations of these factors can not be assessed.
It is noted that the cooking-emitted PM2.5 source strengths and masses reported in this study were gravimetric results. Caution needs to be taken when comparing the results to other studies due to the differences in monitoring equipment and sampling method. In general, the results were within the range of values reported from the literature (Chan et al. Citation2017; He et al. Citation2004; Özkaynak et al. Citation1996; Wallace, Emmerich, and Howard-Reed Citation2004). Previous studies reported that frying and sautéing generated more PM2.5 than boiling (Lee, Li, and Chan Citation2001; See and Balasubramanian Citation2008). Although source strengths and emission masses showed similar patterns of particles emitted by different cooking methods, the differences were not statistically significant. This may due to the variation of other influential factors that have been shown to have a strong impact on particle emissions, such as ingredient weight, type of meat, meat/vegetable ratio, type of oil, and cooking temperature (Buonanno, Morawska, and Stabile Citation2009; Chen, Zhao, and Zhao Citation2018; Huboyo, Tohno, and Cao Citation2011; Kang et al. Citation2019; See and Balasubramanian Citation2006, Citation2008; Torkmahalleh et al. Citation2018; Zhang et al. Citation2010). This study found that the source strength of PM2.5 emitted by gas stoves was twice as high as electric stoves. Limited studies have assessed the influence of cooktop fuel type on fine particle emissions, with mixed results reported. Huang et al. (Citation2008), Wong et al. (Citation2011), and Zhang et al. (Citation2010) reported that gas stoves generated more PM2.5 than the electric stoves; while Olson and Burke (Citation2006) found that the mean source strengths of PM2.5 using electric appliances were typically a factor of two greater than those using gas appliances, although the difference was not statistically significant. Further investigations are needed to examine the influence of heat source on fine particle emissions during cooking.
Exposure to cooking-emitted PM2.5 was most significant during the first hour following cooking. This was consistent with the observations from experimental studies (Patel et al. Citation2020; Sun et al. Citation2018). On average, cooking contributed about 22% to the total daily exposure in participating homes. This estimate represented the exposure of the residents in the living or family room where the measurements were taken. According to Wan et al. (Citation2011), exposure to PM2.5 in the living room was about 45–80% of that in the kitchen during cooking. In general, the results are within the range of values reported in the literature. Özkaynak et al. (Citation1996) reported that cooking contributed 25% of daily personal PM2.5 exposure in 178 residents of Riverside, California. It is noted that personal exposure reflects a higher exposure level during cooking if the participant is the cook for the family. Kamens et al. (Citation1991) reported that cooking contribution of one meal to the total 8-h daytime fine particle exposure measured in three homes in North Carolina ranged from 5% to 18%. This corresponds to a range of 3–18% contribution to the total 24-h exposure if cooking for two to three meals per day. Isaxon et al. (Citation2015) reported that cooking contributed to the total daily particle (<0.3 µm) exposure with 31% in the 22 randomly selected homes in southern Sweden. Saksena, Rrasad, and Shankar (Citation2007) reported that cooking accounts for 23% of the daily PM10 exposure for housewives in 1100 households in Delhi.
Exposure from cooking may be substantial for many individuals, depending on the amount of cooking that is done, the ventilation conditions, and the duration of time spent in the home following cooking. Exposures in newly built homes might be a bigger concern than older homes if not providing sufficient ventilation during cooking. The tighter building envelopes result in longer air residence time and will cause pollutant levels to remain elevated longer inside the homes, resulting in reduced air quality and potential health issues.
Educational programs on cooking exposures and ventilation strategies can help people better understand the importance of ventilation and increase the use of range hood and (or) opening kitchen windows (when possible) during cooking. More survey studies on cooking and range hood usage will be beneficial to understand the reasons for the less use of the range hood. It is unclear if the low use of range hood was due to a lack of knowledge on the impact of cooking on IAQ, the inadequate performance of range hoods (e.g. noise, not removing smoke efficiently), or both. The design of quieter and more efficient range hoods would be advantageous. Continued development of smart control systems (e.g. auto-on, delay-off) is desirable.
There are some limitations of this study. The analyses of this study were limited by the levels of details on cooking and the ventilation behaviors asked in the questionnaires. Due to data availability, some cooking devices (e.g. microwave, air fryer, and slow cooker) and factors that affect the performance of a range hood (e.g. flow rate, cooktop coverage, and burner use) were not assessed. As most of the homes recruited were single-family detached homes, the impact of dwelling type on cooking and ventilation behaviors was not addressed. The reasons for not using a range hood during cooking and the user-perceived range hood performance were not collected. The reasons for opening windows were not collected. The self-reported cooking and ventilation activity data may contain recall bias or mistakes. The assumption of a well-mixed zone produced biases if the air was not perfectly mixed due to local airflow fluctuations or the actual mixing volume was less than the house volume. Although the study did not show any statistically significant differences in cooking characteristics and ventilation patterns between the two cities, data collected from a larger population will be beneficial to provide more generalizable information on cooking, associated ventilation, and their impacts on IAQ. Future research is necessary to provide further understanding of occupants’ cooking and the ventilation behaviors and to assess the changes in relevant behaviors.
Conclusion
This study evaluated the cooking and associated kitchen ventilation behaviors in 132 homes in two Canadian cities, Halifax, and Edmonton. Range hoods were only used for 12% of the cooking activities. Factors associated with the frequency and duration of cooking included mealtime, weekday vs. weekend, and cooking method/device. Season had an impact on cooking frequency. The use of the range hood was associated with mealtime and cooking method/device. Window opening was strongly influenced by season and did not show a clear linkage to ventilation for cooking. Using a range hood and (or) opening kitchen windows had a strong effect on PM2.5 removal. Opening windows in other rooms did not have a strong effect on particle removal. The inadequate use of ventilation during cooking highlighted the need for educational programs on cooking exposures and ventilation strategies. The results of this study can be used to support more accurate modeling of the impact of cooking on IAQ and human exposure.
Supplemental Material
Download MS Word (104 KB)Acknowledgment
The authors would like to thank current and former Health Canada staff (Amanda J. Wheeler, Marie-Eve Héroux, Morgan MacNeill, Keith Van Ryswyk, Ryan Kulka, Hongyu You, Jill Kearney, Mélissa St-Jean, and Tae Maen Shin) and its collaborators at Dalhousie University (Judy R. Guernsey and Mark D. Gibson) and the University of Alberta (Warren Kindzierski and Md. Aynul Bari) who contributed to the design, management, and implementation of the Halifax and Edmonton IAQ studies. The authors are grateful to the participants that generously provided their time and access to their home. The authors would also like to thank Dr. Brett Singer for his helpful comments in reviewing this manuscript. Funding for this work was provided by Health Canada through the Clean Air Regulatory Agenda.
Disclosure statement
No potential conflict of interest was reported by the authors.
Supplementary material
Supplemental data for this article can be accessed on the publisher’s website.
Additional information
Notes on contributors
Liu Sun
Liu Sun is a researcher with the Air Health Science Division, Health Canada, in Ottawa, ON, Canada.
Lance A. Wallace
Lance A. Wallace is an independent consultant on air pollution and environmental exposure, in Santa Rose, CA, USA.
References
- Abt, E., H. Suh, G. Allen, and P. Koutrakis. 2000. Characterization of indoor particle sources: A study conducted in the metropolitan Boston area. Environ. Health Perspect. 108:35–44. doi:10.1289/ehp.0010835.
- Buonanno, G., L. Morawska, and L. Stabile. 2009. Particle emission factors during cooking activities. Atmos. Environ. 43:3235–42. doi:10.1016/j.atmosenv.2009.03.044.
- Cao, C., J. Gao, L. Wu, X. Ding, and X. Zhang. 2017. Ventilation improvement for reducing individual exposure to cooking-generated particles in Chinese residential kitchen. Indoor Built Environ. 26:226–37. doi:10.1177/1420326X16673215.
- Chan, W. R., J. M. Logue, X. Wu, N. E. Klepeis, W. J. Fisk, F. Noris, and B. C. Singer. 2017. Quantifying fine particle emission events from time-resolved measurements: Method description and application to 18 California low-income apartments. Indoor Air 28 (1):89–101. doi:10.1111/ina.12425.
- Chen, C., Y. Zhao, and B. Zhao. 2018. Emission rates of multiple air pollutants generated from Chinese residential cooking. Environ. Sci. Technol. 52 (3):1081–87. doi:10.1021/acs.est.7b05600.
- Delfino, R. J., C. Sioutas, and S. Malik. 2005. Potential role of ultrafine particles in associations between airborne particle mass and cardiovascular disease. Environ. Health Perspect. 113 (8):934–46. doi:10.1289/ehp.7938.
- Delp, W. W., and B. C. Singer. 2012. Performance assessment of U.S. residential cooking exhaust hoods. Environ. Sci. Technol. 46 (11):6167–73. doi:10.1021/es3001079.
- Dobbin, N. A., L. Sun, L. A. Wallace, J. Kearney, R. Kulka, H. You, T. Shin, M. St-Jean, D. Aubin, and B. C. Singer. 2018. The benefit of kitchen exhaust fan use after cooking - an experimental assessment. Build Environ. 135 (1):286–96.
- Elder, A., and G. Oberdörster. 2006. Translocation and effects of ultrafine particles outside of the lung. J. Occup. Environ. Med. 5:785–96.
- EPA. 1996. Air quality criteria for particulate matter (final report). EPA 600/P-95/001, United States Environmental Protection Agency, Washington, DC.
- Gemenetzis, P., P. Moussas, A. Arditsoglou, and C. Samara. 2006. Mass concentration and elemental composition of indoor PM2.5 and PM10 in university rooms in Thessaloniki, northern Greece. Atmos. Environ. 40 (17):3195–206. doi:10.1016/j.atmosenv.2006.01.049.
- He, C., L. Morawska, J. Hitchins, and D. Gilbert. 2004. Contribution from indoor sources to particle number and mass concentrations in residential houses. Atmos. Environ. 38:3405–15. doi:10.1016/j.atmosenv.2004.03.027.
- Howard-Reed, C., L. A. Wallace, and W. R. Ott. 2002. The effect of opening windows on air change rates in two homes. J. Air Waste Manag. Assoc. 52:147–59. doi:10.1080/10473289.2002.10470775.
- Huang, Y. W., E. E. Andrew, T. C. Hu, B. C. Singer, L. Ding, and J. M. Logue. 2014. Residential cooking behavior in the United States: Data collected from a web-based survey. Accessed September, 2019. http://eta-publications.lbl.gov/sites/default/files/jennifer_logue_-_residential_cooking_behavior_in_the_united_states_data_collected_from_a_web_based_survey_lbnl_report_v3.pdf.
- Huang, Z. H., S. C. Li, D. X. Yu, H. Qiu, and X. L. Huang. 2008. Investigation on environment of Chinese restaurants in Hong Kong. Chin. J. Ind. Hyg. Occup. Dis. 26 (8):474–76.
- Huboyo, H. S., S. Tohno, and R. Cao. 2011. Indoor PM2.5 characteristics and CO concentration related to water-based and oil-based cooking emissions using a gas stove. Aerosol Air Qual. Res. 11 (4):401–11. doi:10.4209/aaqr.2011.02.0016.
- Isaxon, C., A. Gudmundsson, E. Z. Nordin, L. Lonnblad, A. Dahl, G. Wieslander, M. Bohgard, and A. Wierzbicka. 2015. Contribution of indoor-generated particles to residential exposure. Atmos. Environ. 106:458–66. doi:10.1016/j.atmosenv.2014.07.053.
- Kamens, R., C. T. Lee, R. Weiner, and D. Leith. 1991. A study to characterize indoor particles in three non-smoking homes. Atmos. Environ. 25:939–94. doi:10.1016/0960-1686(91)90136-U.
- Kang, K., H. Kim, D. D. Kim, Y. G. Lee, and T. Kim. 2019. Characteristics of cooking-generated PM10 and PM2.5 in residential buildings with different cooking and ventilation types. Sci. Total Environ. 668:56–66. doi:10.1016/j.scitotenv.2019.02.316.
- Kearney, J., L. A. Wallace, M. MacNeill, M. Héroux, W. Kindzierski, and A. J. Wheeler. 2014. Residential infiltration of fine and ultrafine particles in Edmonton. Atmos. Environ. 94:793–805. doi:10.1016/j.atmosenv.2014.05.020.
- Kennedy, I. M. 2007. The health effects of combustion-generated aerosols. P. Combust. Inst. 31:2757–70. doi:10.1016/j.proci.2006.08.116.
- Klepeis, N. E., W. C. Nelson, W. R. Ott, J. P. Robinson, A. M. Tsang, P. Switzer, J. V. Behar, S. C. Hern, and W. H. Engelmann. 2001. The national human activity pattern survey (NHAPS): A resource for assessing exposure to environmental pollutants. J. Expo. Sci. Environ. Epidemiol. 11 (3):231–52. doi:10.1038/sj.jea.7500165.
- Klug, V. L., A. B. Lobscheid, and B. C. Singer. 2011a. Cooking appliance use in California homes - data collected from a web-based survey. Accessed July, 2019. http://eta-publications.lbl.gov/sites/default/files/lbnl-5028e-cooking-appliance.pdf.
- Klug, V. L., B. C. Singer, T. Bedrosian, and C. D’Cruz. 2011b. Characteristics of range hoods in california homes - data collected from a real estate web site. Accessed October, 2019. http://eta-publications.lbl.gov/sites/default/files/lbnl-5067e.pdf.
- Koutrakis, P., S. L. K. Briggs, and B. P. Leaderer. 1992. Source apportionment of indoor aerosols in Suffolk and Onondaga Counties, New York. Environ. Sci. Technol. 26:521–27. doi:10.1021/es00027a012.
- Lee, H., Y. J. Lee, S. Y. Park, Y. W. Kim, and Y. Lee. 2012. The improvement of ventilation behaviours in kitchens of residential buildings. Indoor Built Environ. 21 (1):48–61. doi:10.1177/1420326X11419360.
- Lee, S. C., W. M. Li, and L. Y. Chan. 2001. Indoor air quality at restaurants with different styles of cooking in metropolitan Hong Kong. Sci. Total Environ. 279:181–93. doi:10.1016/S0048-9697(01)00765-3.
- Leech, J. A., K. Wilby, E. McMullen, and K. Laporte. 1996. The Canadian human activity pattern survey: Report of methods and population surveyed. Chronic Dis. Can. 17 (3–4):118–23.
- Lu, S. L., Z. K. Yao, X. H. Chen, M. H. Wu, G. Y. Sheng, J. M. Fu, and D. Paul. 2008. The relationship between physicochemical characterization and the potential toxicity of fine particulates (PM2.5) in Shanghai atmosphere. Atmos. Environ. 42 (31):7205–14. doi:10.1016/j.atmosenv.2008.07.030.
- Lunden, M. M., W. W. Delp, and B. C. Singer. 2015. Capture efficiency of cooking-related fine and ultrafine particles by residential exhaust hoods. Indoor Air 25 (1):45–58. doi:10.1111/ina.12118.
- MacNeill, M., J. Kearney, L. A. Wallace, M. Gibson, M. E. Héroux, J. Kuchta, J. R. Guernsey, and A. J. Wheeler. 2014. Quantifying the contribution of ambient and indoor-generated fine particles to indoor air in residential environments. Indoor Air 24:362–75. doi:10.1111/ina.12084.
- Matz, C. J., D. M. Stieb, K. Davis, M. Egyed, A. Rose, B. Chou, and O. Brion. 2014. Effects of age, season, gender and urban-rural status on time-activity: Canadian Human Activity Pattern Survey 2 (CHAPS 2). Int. J. Environ. Res. Public Health 11 (2):2108–24. doi:10.3390/ijerph110202108.
- Nagda, N. L., M. D. Koontz, R. C. Fortmann, and I. H. Billick. 1989. Prevalence, use and effectiveness of range-exhaust fans. Environ. Int. 15:615–20. doi:10.1016/0160-4120(89)90083-4.
- Oberdörster, G., J. N. Finkelstein, C. Johnston, R. Gelein, C. Cox, R. Baggs, and A. C. Elder. 2000. Acute pulmonary effects of ultrafine particles in rats and mice. Res. Rep. Health Eff. Inst. 96:5–74.
- Olson, D., and J. Burke. 2006. Distributions of PM2.5 source strengths for cooking from the Research Triangle Park particulate matter panel study. Environ. Sci. Technol. 40:163–69. doi:10.1021/es050359t.
- Özkaynak, H., J. Xue, J. Spengler, L. A. Wallace, E. Pellizzari, and P. Jenkins. 1996. Personal exposure to airborne particles and metals: Results from the particle TEAM study in Riverside, California. J. Expo. Sci. Environ. Epidemiol. 6:57–78.
- Parekh, A., L. Roux, and P. Gallant. 2007. Thermal and air leakage characteristics of Canadian housing. 11th Canadian Conferece on Building Science and Technology, Banff, Alberta.
- Parrott, K., J. Emmel, and J. Beamish. 2003. Use of kitchen ventilation: Impact on indoor air quality. Forum Family Consum. Issues 8 (1). Accessed September, 2019. https://www.theforumjournal.org/wp-content/uploads/2018/05/Use-of-Kitchen-Ventilation.pdf.
- Patel, S., S. Sankhyan, E. K. Boedicker, P. F. DeCarlo, D. K. Farmer, A. H. Goldstein, E. F. Katz, W. W. Nazaroff, Y. Tian, J. Vanhanen, et al. 2020. Indoor particulate matter during HOMEChem: Concentrations, size distributions, and exposures. Environ. Sci. Technol. 54:7107–16. doi:10.1021/acs.est.0c00740.
- Rim, D., L. A. Wallace, S. Nabinger, and A. Persily. 2012. Reduction of exposure to ultrafine particles by kitchen exhaust hoods: The effects of exhaust flow rates, particle size, and burner position. Sci. Total Environ. 432:350–56. doi:10.1016/j.scitotenv.2012.06.015.
- Saksena, S., R. K. Rrasad, and V. R. Shankar. 2007. Daily exposure to air pollutants in indoor, outdoor and in-vehicle microenvironments: A pilot study in Delhi. Indoor Built Environ. 16 (1):39–46. doi:10.1177/1420326X06074715.
- See, S., and R. Balasubramanian. 2006. Physical characteristics of ultrafine particles emitted from different gas cooking methods. Aerosol Air Qual. Res. 6:82–92. doi:10.4209/aaqr.2006.03.0007.
- See, S., and R. Balasubramanian. 2008. Chemical characteristics of fine particles emitted from different gas cooking methods. Atmos. Environ. 42:8852–62. doi:10.1016/j.atmosenv.2008.09.011.
- Singer, B. C., W. W. Delp, P. N. Price, and M. G. Apte. 2012. Performance of installed cooking exhaust devices. Indoor Air 22 (3):224–34. doi:10.1111/j.1600-0668.2011.00756.x.
- Singer, B. C., R. Z. Pass, W. W. Delp, D. M. Lorenzetti, and R. L. Maddalena. 2017. Pollutant concentrations and emission rates from natural gas cooking burners without and with range hood exhaust in nine California homes. Build Environ. 43:3235–42. doi:10.1016/j.buildenv.2017.06.021.
- Sun, L., L. A. Wallace, N. A. Dobbin, H. You, R. Kulka, T. Shin, M. St-Jean, D. Aubin, and B. C. Singer. 2018. Effect of venting range hood flow rate on size-resolved ultrafine particle concentrations from gas stove cooking. Aerosol Sci. Tech. 52 (12):1370–81. doi:10.1080/02786826.2018.1524572.
- Timonen, K. L., E. Vanninen, J. De Hartog, A. Ibald-Mulli, B. Brunekreef, D. R. Gold, J. Heinrich, G. Hoek, T. Lanki, A. Peters, et al. 2006. Effects of ultrafine and fine particulate and gaseous air pollution on cardiac autonomic control in subjects with coronary artery disease: The ULTRA study. J. Expo. Sci. Environ. Epidemiol. 16 (4):332–41.
- Tong, Z., Y. Chen, A. Malkawi, G. Adamkiewicz, and J. D. Spengler. 2016. Quantifying the impact of traffic-related air pollution on the indoor air quality of a naturally ventilated building. Environ. Int. 89-90:138–46. doi:10.1016/j.envint.2016.01.016.
- Torkmahalleh, A. M., S. Ospanova, A. Baibatyrova, S. Nurbay, G. Zhanakhmet, and D. Shah. 2018. Contributions of burner, pan, meat and salt to PM emission during grilling. Environ. Res. 164:11–17.
- Wallace, L. A. 1996. Indoor particles: A review. J. Air Waste Manag. Assoc. 46:98–126.
- Wallace, L. A., S. J. Emmerich, and C. Howard-Reed. 2002. Continuous measurements of air change rates in an occupied house for 1 year: The effect of temperature, wind, fans, and windows. J. Expo. Sci. Environ. Epidemiol. 12:296–306.
- Wallace, L. A., S. J. Emmerich, and C. Howard-Reed. 2004. Source strengths of ultrafine and fine particles due to cooking with a gas stove. Environ. Sci. Technol. 38:2304–11. doi:10.1021/es0306260.
- Wallace, L. A., W. Kindzierski, J. Kearney, M. MacNeill, M. Héroux, and A. J. Wheeler. 2013. Fine and ultrafine particle decay rates in multiple homes. Environ. Sci. Technol. 47:12929–37. doi:10.1021/es402580t.
- Wallace, L. A., F. Wang, C. Howard-Reed, and A. Persily. 2008. Contribution of gas and electric stoves to residential ultrafine particle concentrations between 2 nm and 64 nm: Size distributions and emission and coagulation rates. Environ. Sci. Technol. 42:8641–47. doi:10.1021/es801402v.
- Wallace, L. A., A. J. Wheeler, J. Kearney, K. Van Ryswyk, H. You, R. Kulka, P. E. Rasmussen, J. R. Brook, and X. Xu. 2011. Validation of continuous particle monitors for personal, indoor and outdoor exposures. J. Expo. Sci. Environ. Epidemiol. 21:49–64.
- Wan, M., C. Wu, G. S. To, T. Chan, and C. Y. Chao. 2011. Ultrafine particles, and PM2.5 generated from cooking in homes. Atmos. Environ. 45 (34):6141–48. doi:10.1016/j.atmosenv.2011.08.036.
- Wong, T. W., A. H. S. Wong, F. S. C. Lee, and H. Qiu. 2011. Respiratory health and lung function in Chinese restaurant kitchen workers. Occup. Environ. Med. 68:746–52. doi:10.1136/oem.2010.059378.
- Zhang, Q., R. H. Gangupomu, D. Ramirez, and Y. Zhu. 2010. Measurement of ultrafine particles and other air pollutants emitted by cooking activities. Int. J. Environ. Res. Public Health 7 (4):1744–59. doi:10.3390/ijerph7041744.