
ABSTRACT
In the current work, we provide measurements of size-resolved particle number concentration (PNC), particle mass concentration (PMC), lung-deposited surface area (LDSA), and black carbon (BC) concentration for three biomass fired hydronic heaters during operation in four different combustion conditions. The appliances include one woodchip-fueled hydronic heater and two outdoor cordwood-fueled hydronic heaters. The operating conditions included startup, low output, high output, and burnout. Measurements were made using a custom dilution sampling system and a suite of commercially available, time-resolved, ambient aerosol measurement instrumentation. The PNC, as measured using an Dekati Electrical Low Pressure Impactor+ (ELPI), had operating condition mean values ranging between 4.1 and 52 million particles per cubic centimeter (#/cm3). The highest reported PNC occurred during the startup condition in all cases. Calculating the particle size distribution measured across each operating phase for the same instrument gave geometric mean diameters (dg) in the range of 0.080–0.256 µm. The largest dg per appliance was nearly always attributable to the startup condition (for hydronic heater 1, startup dg ranked second).
We did not observe the same trends when we transformed the ELPI PNC to PMC and particle surface area concentration estimates across operating conditions, suggesting PNC and dg are highly variable. Furthermore, simultaneous measurements of PNC, PMC, and PSAC using instrumentation with different working principles gave varying results, potentially suggesting that particles of different composition and morphology are produced under different combustion conditions.Implications: In this work we compare the results from testing of 3 biomass fired hydronic heaters including one chip-fired appliance and two cordwood-fired appliances. The emissions from these appliances were made across four operating conditions and using three different non-regulatory emissions metrics. This work: describes the difference between chip and cordwood fired units and the effect of operating condition on emissions across the three emissions metrics.
Introduction
The use of wood as a fuel for heating has become increasingly popular and up to 30 million United States (US) residents are impacted by woodsmoke each year (Noonan, Ward, and Semmens Citation2015; Rogalsky et al. Citation2014). Net residential energy consumption of wood in New York State (NYS) in 2016 was 670 million cords or 13.5 trillion British thermal units (Btu) (New York State Energy Research and Development Authority Citation2019). Many of the wood burning appliances installed in NYS are uncertified resulting in significant emissions due to incomplete combustion. Use of wood for heating in NYS accounts for 2% of heating, but 90% of the fine particulate matter (with diameters that are 2.5 µm and smaller, PM2.5) emissions attributable to residential heating. In 2012, 15,968 tons of PM2.5 were attributed to residential heating in NYS (New York State Energy Research and Development Authority (NYSERDA) and Northeast States for Coordinated Air Use Management (NESCAUM Citation2016). In winter between 2008 and 2012, wood combustion sources produced up to 30% of PM2.5 measured in Rochester, NY (Rich et al. Citation2018). Additionally between 2014 and 2015, mobile and fixed-site air monitoring in NYS’s Adirondack Park indicated local woodsmoke sources were responsible for observed increases in PM2.5 (Allen and Rector Citation2020).
Wood combustion produces high concentrations of harmful air pollutants including ultrafine particles (UFP, <100 nm), fine (PM2.5) and coarse (≤10 µm, PM10) particulate matter (PM); volatile organic compounds (VOC); and hazardous air pollutants (HAP) (Bolling et al. Citation2009; Obaidullah, Bram and Verma, et al. Citation2012; Trojanowski and Fthenakis Citation2019). Adverse health effects associated with woodsmoke PM include changes in blood pressure, episodes of arrhythmias and ischemia, myocardial infarction (heart attacks), increase in cardiovascular emergency room visits, cardiac biomarkers, an increase in cardiovascular mortality (New York State Energy Research and Development Authority (NYSERDA) Citation2008), and premature mortality (Naeher et al. Citation2007; Penn et al. Citation2017). Exposure to PM near or at ambient levels could increase systemic oxidative stress in humans (Danielsen et al. Citation2008; Forchhammer et al. Citation2012; United States Environmental Protection Agency Citation2009; United States Environmental Protection Agency Citation2019). A study conducted by Rich et al. (Citation2018) examined the association between black carbon (BC), delta C (a marker for wood smoke) and ST-elevation myocardial infraction (STEMI) in Rochester, New York. No statistically significant association was found, but non-statistically significant associations were observed between interquartile increases in Delta C in the previous 3 days and increased rates of STEMI. Weichenthal, et al. (Citation2017) found a similar association between each 5 µg/m3 increase in mean PM2.5 concentrations and the risk for myocardial infraction in individuals over 65 years of age on lag day 0 or 3. A recent review of controlled, acute human exposures to wood smoke produced by different appliances, fuel types, and combustion conditions reported more consistent airway inflammation effects than systemic inflammation effects, oxidative stress, or cardiovascular endpoints (Schwartz, Bølling and Carlsten Citation2020). Particle characteristics will influence the health effect profile of woodsmoke (Corsini, Marinovich, and Vecch Citation2019). Characterization of woodsmoke emissions is thus critical to not only understand their emissions but also study health effects associated with different emission profiles.
Studies have shown that biomass combustion produces PM mainly in the sub-micron range from the number concentration perspective (Obaidullah et al. Citation2012). Particles of this size are especially important from a health perspective as their small size potentially magnifies their toxic effects. Several factors might modify the toxicity of such small particles including where particles deposit in the respiratory tract, with larger particles being more effectively deposited in the upper airways (Cohen, Sussman, and Lippmann Citation1990; Annals of the ICRP Citation1994). Smaller particles also have larger surface area per volume than large particles, which can enhance their solubility and provide additional area for adsorption of toxic compounds (Oberdorster, et al. Citation1992). Additionally, small particles may enter cells more readily than coarse particles and can be translocated or transported to other organs due to their small size (Gunter et al. Citation1992). These findings have been discussed in numerous review articles and in the US EPA’s PM Integrated Science Assessment as part of the periodic review of the National Ambient Air Quality Standards for particulate matter (United States Environmental Protection Agency Citation2019; Lighty, Veranth, and Sarofim Citation2000; Bolling et al. Citation2009; Naeher et al. Citation2007).
Lung-deposited surface area (LDSA) is being evaluated as a potential health-relevant exposure metric for health effects related to alveolar deposition, since it measures the surface area of particles in the respirable size range. Kuula et al. (Citation2019) found that LDSA measurements were sensitive to wood combustion, where average LDSA was lower in areas mainly impacted by wood combustion relative to urban locations and LDSA peaks were observed in the evenings during the winter (Kuula et al. Citation2019), suggesting residential wood combustion as a potential source. Black carbon (BC), a soot-like carbonaceous aerosol of non-regulatory metric for measuring wood smoke, is also well correlated with ambient and indoor PM concentration (Hoek and Meliefste, et al. Citation2002; Hoek and Kos, et al. Citation2008; World Health Organization Citation2012) and PM health effects (Janssen et al. Citation2011; World Health Organization Citation2012), making a good surrogate measure for PM.
Regulatory emission testing protocols for wood combustion appliances in the US and Europe test only under steady-state but not during other operating conditions such as startup or burn out. New integrated-duty-cycle protocols that better represent all phases of the burn as well as fueling and operational parameters closer to in-use conditions are being developed (New York State Energy Research and Development Authority (NYSERDA) and Northeast States for Coordinated Air Use Management (NESCAUM Citation2020). The morphology and composition of woodsmoke aerosol also have been found to change with a variety of factors including the fuel type used, fuel moisture content, the wood-burning appliance design, the different operating conditions, and the behavior of the operator (Chandrasekaran et al. Citation2013; Lillieblad et al. Citation2004; Obernberger, Brunner, and Barnthaler Citation2007; Bari et al. Citation2011). Particulate mass concentration, PNC, and particle size distributions are affected by appliance type, fuel properties, and operating condition (Obaidullah et al. Citation2012; Kinsey et al. Citation2012; Johansson et al. Citation2004; Obernberger, Brunner, and Barnthaler Citation2007; Boman et al. Citation2004; Gaegauf, Wieser, and Macquat Citation2001; Bari et al. Citation2011; Lillieblad et al. Citation2004; Wiinikka and Gebart Citation2005; Obernberger, Brunner, and Jöller Citation2001). In general, startup periods produced the highest PNC and mean particle diameters compared to steady state, shut down, and burnout phases, which produced lower PNC and smaller mean particle diameters. The PNC varied, especially during the burnout phase, depending upon appliance type and combustion parameters (Hueglin et al. Citation1997; Chandrasekaran et al. Citation2011).
It is vital to improve the collective understanding of academic, manufacturing, regulatory, and policy-making groups regarding the mixture of particulate emissions associated with the operation of biomass-fueled appliances, and the changes the particulate pollutants may bring to indoor and outdoor air quality. The purpose of this study was to characterize emissions from multiple biomass-fueled hydronic heaters (HHs) under operational modes that better reflect residential use and to compare different emission metrics. The particle emission metrics evaluated in this study rely on different technologies, require instrumentation with differing amenability for field measurement, and differ in the extent to which they have been associated with health effects. Determining the best metric, the best instrument, and the best test protocol to appropriately characterize health and environmental concerns is challenging. However, by comparing several metrics here, we offer data to inform test protocol development, and to inform future research seeking to characterize biomass combustion particulate emissions using non-regulatory metrics.
Materials and methods
Sampling approach
Measurements of appliance operating parameters and emissions were made during each test. Appliance operating parameters including heat output, thermal efficiency (by the stack-loss method), temperatures, concentrations of gaseous pollutants in the flue gas, and particle mass and emission rates were measured as per Test Method 28 WHH for Measurement of Particulate Emissions and Heating Efficiency of Outdoor Wood-Fired Hydronic Heating Appliances (United States Environmental Protection Agency Citation2017) by Brookhaven National Laboratory (BNL) and are summarized in other works (Trojanowski et al. Citation2022). Coincident with the BNL test, this group measured in-flue particulate concentration, size, and character from a sampling port mounted in the flue stack a few feet above the appliance (upstream of the dilution tunnel used for the BNL measurement). The in-stack measurements of flue emissions directed through the custom-made dilution system are the subject of this paper. Efforts were made to minimize experimental errors throughout testing, including calibration of instrument flow rates prior to testing, strict time keeping measures for calculation of period means, and exclusion of data points where extreme conditions or calibration procedures could impact data quality.
Dilution system
Aerosol particulate emission measurements were made using a custom-built dilution sampling system. The dilution system consists of a sampling probe and primary and secondary dilution sections. In all tests, a one liter per minute (LPM) critical flow orifice was installed in the dilution system to limit sample flow rate and to provide a point to monitor the inlet flow for occlusion via pressure drop. The dilution ratio of the system was set to 108:1 using the primary and secondary dilution air controls. Clean, dry dilution air was provided by a dual compressor system (two 20 horsepower reciprocating compressors with 20-gallon storage tanks) to avoid flow variability due to compressor cycling. The air was conditioned by filtration (Motor Guard M30 particle filter with M-723 filter element) and drying (Puregas VSA3 Heatless Air Dryer) before mixing with the flue sample air. The dilution factor was maintained throughout testing by periodic measurements of sample and dilution air gas flow rates, and consequent replacement of the critical flow orifice when sample flow rate deviated noticeably from the initial value.
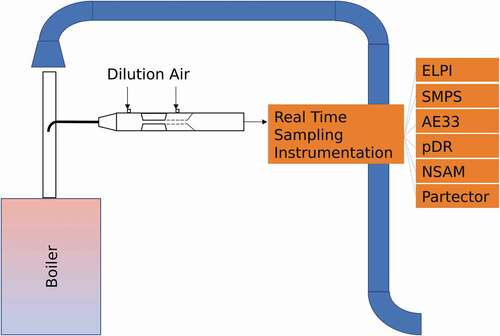
The aerosol measurement instruments were connected to the outlet of the dilution system as shown in . A broad suite of instrumentation was used for this purpose. Specifically, a Dekati Electrical Low-Pressure Impactor + (ELPI) and TSI Nanoscan Scanning Mobility Particle Sizer Model 3910 (SMPS) were used to measure real-time, size-resolved PNC. The ELPI PNC data was also used to estimate particle mass concentration (PMC) and particle surface area concentration (PSAC), using the standard methods for transforming size-resolved number concentration measurements to different relevant distributions. The assumptions used for the transformations are described below. A Thermo Scientific personal Data Ram Model 1500 (pDR) was used to measure PMC and a Magee Scientific Aethalometer Model AE33 (AE33) was used to estimate the BC component of the aerosol mass. Simultaneous measurements of LDSA were also made using a TSI Nanoparticle Surface Area Monitor Model 3550 (NSAM) in the case of Appliances 1 and 3. No NSAM measurements were collected for Appliance 2, due to equipment malfunction, instead measurements from a different set of test periods using a Naneos Partector are given. The pDR mass and NSAM/Partector LDSA results were compared with the ELPI estimates of PMC and PSAC, respectively.
Figure 1. Schematic of combustion test setup featuring locations of instrumentation, instrument flow requirements, and instrument groupings.
Electrical-Low-Pressure Impactor+
The ELPI is a 15-stage cascade impactor capable of measuring the concentration of particles with aerodynamic diameters between 6 nm and 10 µm in size. The ELPI was operated according to manufacturer’s recommendations for all experiments using standard settings for flow rate (10 LPM), corona charger voltage (4500 kV), current (1 µA), and trap voltage (20 V). The impactor stages were loaded with either 25 mm conditioned quartz fiber filter (Sunset Laboratories) for carbon analysis, or greased aluminum foil filters (Dekati). The ELPI data were collected at 1 Hz resolution and converted to 1-min averages during data analysis.
Nanoscan scanning mobility particle sizer
The SMPS is a scanning mobility particle sizer, which can measure the concentration of particles with electrodynamic diameters between 10 and 420 nm. The SMPS was operated using an aerosol inlet flow rate of 0.75 LPM and working fluid of 99.5+% pure spectroscopic grade isopropyl alcohol in scanning mode. Size-segregated particle concentrations were collected continuously on a 1-min time basis throughout each experiment.
Personal dataRam-1500
The pDR measures light scattering at a wavelength of 880 nm. This wavelength is also commonly used for aethalometer-based BC measurements. The pDR was operated with the 2.5 µm sharp-cut “blue” cyclone (BGI SCC 1.062 cyclone) at 1.8 LPM and without correction for relative humidity, as the relative humidity of the diluted sample was less than 20% consistently throughout operation of each appliance. One-minute average PMC measurements were collected throughout each experiment.
Magee scientific model 33
The AE33 is a multiwavelength aethalometer that uses seven wavelengths ranging between 370 and 950 nm to measure the light absorption characteristics of an aerosol. BC data corresponding to the 880 nm light channel of the AE33 will be discussed for the three appliances. The data shown include the standard correction factors applied by the AE33 software including multiple scattering and Drinovek dual-spot correction (Drinovec et al. Citation2015). Typical settings for the AE33 during these experiments are a sample flow rate of 2 LPM and an averaging time of 1 min. Due to the high concentration of emissions during some operating conditions tape advances occur periodically throughout the experimental run, resulting in periods where no data are collected as the tape advances and the instrument re-zeroes.
Nanoparticle surface area monitor and partector
The NSAM utilizes a corona charger, electrostatic trap, and Faraday cage in series to charge particles of interest, remove excess ions, apply an approximate International Commission on Radiological Protection (ICRP) deposition curve to the particle sample, and to measure the surface area of the particles. The NSAM measurement range is for particles with diameters between 10 nm and 1 µm. The upper size cut-point is achieved by using the 1-µm cyclone filter and an instrument inlet flow rate of 2.5 LPM. The result is an estimate of LDSA in square micrometers per cubic centimeter (µm2/cm3), which is a measure of the particle surface area that the ICRP model would predict to be deposited in the lung. By controlling NSAM trap voltage, the lung deposition prediction can be tuned to report results for the tracheobronchial or alveolar regions of the respiratory tract. For this study, we used the alveolar region trap voltage setting.
The Partector is a portable, battery operated instrument that uses diffusion charging and a Faraday cage to estimate LDSA in the alveolar region according to the ICRP deposition probability curve. The Partector measurement range is for particles with diameters between 10 nm and 10 µm.
Particle size distribution calculations
The size-segregated particle count instrumentation, including the ELPI and SMPS, were used to determine an aerosol particle size distribution (PSD) during each operating condition. The PSD was calculated by assuming a log-normal distribution and calculating the descriptive parameters N, dg, and σg using 1-min average measurements, where N is referred to as the scale parameter indicating distribution height (concentration), dg is the geometric mean diameter of the distribution, and σg is the geometric standard deviation of the distribution. Period mean values for each operating condition were then calculated from the 1-min average parameters. For more information on the specifics of this technique, please refer to Chapter 4 of Hind’s primer on aerosols (Hinds Citation1982). The ELPI results were limited to include stages with median diameter (D50) values less than 420 nm to compare with the SMPS results. Notably, the ELPI outputs aerodynamic diameter nominally, while the SMPS reports the electrical mobility diameter, due to the different sizing technologies employed by each instrument.
ELPI transformations
The ELPI data were transformed from size segregated PNC to PMC and PSAC using standard calculation procedures, to compare the ELPI estimates of PMC and PSAC with the pDR and NSAM results. The PNC measurement was transformed to PSAC and PMC estimates using the assumption of spherical particles with diameter equal to the D50 of each stage.
In the case of the PSAC estimate, ELPI stages 1 through 10 were used to limit the reported PSAC to particles with D50 < 1 µm to match the size range of the NSAM. It should be noted that these metrics are slightly different, namely the ELPI PSAC is an estimate of total particle surface area concentration, while the LDSA measured by the NSAM is an estimate of the exposure surface, i.e., the fraction of total particle surface area capable of reaching the alveolar region of the lung.
In the case of the PMC estimate, an estimated particle density of 1.0 g/cm3 was applied to the calculated particle volume to determine particle mass. The ELPI data set was then limited to PMC2.5 by including stages 1 through 11, to correspond to the particle size range mass estimate of the pDR.
Appliances
The three appliances featured in this study are representative of HH technology in the United States (US) and are compliant with the Step 2 emission limits of the 2015 New Source Performance Standards (NSPS). All three units include internal water volumes and were tested without external thermal storage. Some basic descriptive information about each appliance is shown in (United States Environmental Protection Agency Citation2015). All three units feature rated maximum heat outputs between 100,000 and 125,000 Btu/hr (29–37 kW) and are typical for residential use. Appliance 1 can be fueled using wood pellets or chips, in this study chips were used. The HH is of European design and US manufacture. This unit incorporates a forced draft airflow system with primary and secondary air controls based on an exhaust gas lambda sensor. Appliance 2 is an outdoor cordwood-fueled HH manufactured in the US. This unit features temperature and lambda sensors in conjunction with primary and secondary airflow dampers, as well as a catalytic secondary combustion system. Appliance 3 is also a US manufactured outdoor cordwood-fueled HH. This appliance also features a forced draft airflow system; however, this unit has only a single air damper, as it relies on a two-stage gasification-combustion technique to achieve low emission combustion.
Table 1. Comparison of the US EPA certification and design parameters for the wood chip/pellet and cordwood hydronic heaters featured in this study.
Fuel
The fuel used in each experiment was red oak. For Appliance 1, the wood was processed into roughly one-inch square chips, dried to approximately 30% moisture. For Appliances 2 and 3, red oak cord wood was custom cut to size, with length approximately 80% of the firebox’s depth, and dried in accordance with the procedures documented in Smith et al. 2014 (Smith Citation2014). Specifically, the cut wood underwent partial kiln drying and moisture measurement. The moisture content at the end of the process was between 19% and 25%.
Testing protocol
Data from four operating conditions will be presented for each HH: (1) startup, (2) low-output, (3) high-output, and (4) burnout.
In this study, we define the startup condition as the time period immediately following the addition of a fuel load into a hot firebox or coal bed. The definition of a fuel load is determined by the device. In the case of a Appliance 1, the fuel load is the amount of chips fed into the firebox by the device. For batch-fired appliances, such as Appliances 2 and 3, fuel loads are designated as an amount of cordwood corresponding to 120–160 kg/m3 firebox loading density. The exact test start time is determined by feed-screw actuation in the case of the chip unit, and by door closure following a fuel load addition in the case of the cordwood appliances. The startup period ends for a chip appliance when the unit indicates steady-state operation, and for a cordwood unit is defined as the period where the initial fuel charge burns down by 20%.
Low-output is defined based on heat output. Whenever a heat-load of <15% of the HH’s maximum rated output is applied to the HH, the HH will be considered in low-output. The low-output condition in this study is similar to a Category I heat load as described in EPA Method 28 OWHH (United States Environmental Protection Agency Citation2017).
High-output is also defined based on heat output. When the heat load applied to the HH is 100% of the maximum rated output, the HH will be operating in high-output. This output level is similar to an EPA Method 28 WHH Category IV (United States Environmental Protection Agency Citation2017).
The burnout condition is defined specifically for each appliance type. Burnout for a chip unit is defined as the period after initiating the shutdown procedure for the appliance, and for cordwood appliances as the time period within which the fuel charge mass decreases from 40% to 15% of the initial fuel charge.
For Appliance 1, the high- and low-output tests were performed explicitly according to EPA Method 28 WHH (United States Environmental Protection Agency Citation2017). The startup and burnout test periods were captured by measuring during the startup and posttest periods of the low-output experiments as prescribed by EPA Method 28 WHH (United States Environmental Protection Agency Citation2017). For Appliance 2 and 3 startup, low-output, high-output, and burnout data were collected, while the HHs were being tested using “A Test Method for Certification of Cord Wood-Fired Hydronic Heating Appliances Based on a Load Profile: Measurement of Particulate Matter (PM) and Carbon Monoxide (CO) Emissions and Heating Efficiency of Wood-Fired Hydronic Heating Appliances” (Northeast States for Coordinated Air Use Management Citation2021). Each test condition was captured in duplicate for each appliance.
Results and discussion
The three biomass-fueled HHs, operated under four different operating conditions, revealed differences in each particle instruments’ response even when reporting metrics overlapped. Different instrument response patterns emerged when comparing specific operating conditions for each appliance. Therefore, each appliance’s results will be discussed separately. However, a summary of PNC, PMC, and PSAC results are shown for each appliance in , and a summary of the PSD results is given in .
Table 2. Summary of operating condition mean PNC (units of: C (concentration #/cm3)/dlog (particle size (dp)), PMC (units: milligram per cubic meter), and PSAC (units: square micrometers per cubic centimeter) results.
Table 3. Summary of PSD results from ELPI and SMPS for all three appliances across each of four operating conditions.
Appliance 1
Operation
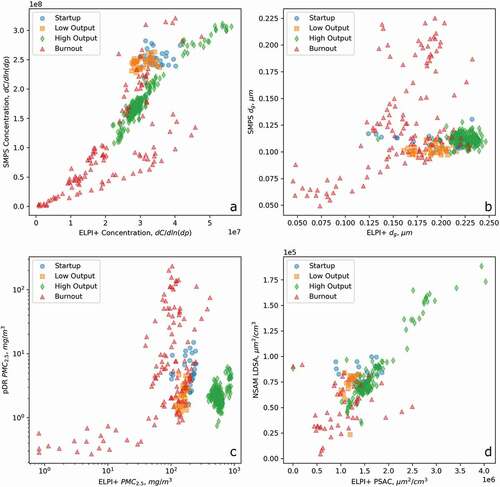
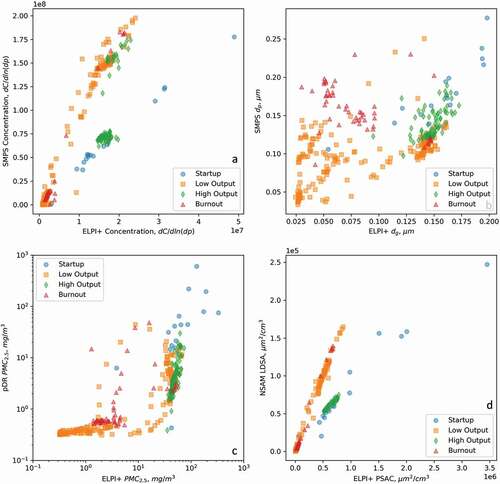
Appliance 1 was the only chip-fueled HH in our study. The operation condition-specific (startup, low-output, high-output, or burnout) means of all measured quantities for Appliance 1 can be found in , and comparison-related metrics are illustrated as scatter plots in .
Figure 2. Scatterplot comparisons of data collected during testing of Appliance 1 over four different operating conditions: startup, low-output, high-output, and burnout. (A) PNC comparison between ELPI and SMPS. (B) Comparison of dg as calculated from ELPI and SMPS data. (C) Comparison of PMC2.5 between the ELPI and pDR. (D) Comparison of PSAC results, specifically comparing the ELPI PSAC estimate versus the NSAM LDSA.
To provide context for the summary statistics presented, a set of timeseries plots of PNC measured by ELPI during duplicate testing of Appliance 1 during the four operating conditions of interest is given in .
Figure 3. Timeseries plots of PNC measured during testing of chip boiler during two duplicate experiments with the four operating conditions using the ELPI. Red solid lines illustrate the first test run and the black dashed lines illustrate the second test run.
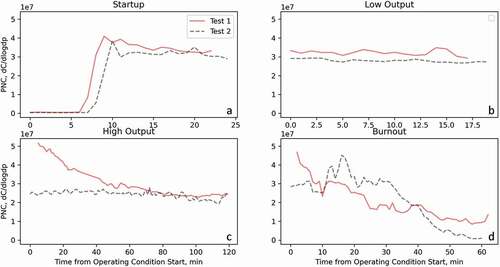
The main features observed in the time series are as follows: (1) the PNC was in the 107 range throughout the duration of each of the four conditions; (2) there is a notable ramping up of PNC during startup present in the first 10 min of both startups; (3) the low-output phase showed relatively constant PNC; (4) the high output condition exhibited decreasing PNC emissions throughout test one with a constant PNC during test 2, reaching a stable concentration approximately equivalent to the low output phase; and (5) a notable decline in PNC as the burnout phase progressed.
Particle number and size
A comparison of the SMPS PNC and ELPI PNC results is illustrated by the scatterplot in , panel A, and is shown explicitly as operational period means in . The combined SMPS PNC indicates a PNC between 107 and 108 #/cm3. The ranking of highest to lowest PNC by phase, as measured by both the ELPI and SMPS, is startup>low-output >high-output> burnout. In , it is apparent that a portion of the results during the burnout period deviates from the linear trend observed for most of the sample time points during burnout. Due to this observation, a linear regression analysis of all periods, excluding the burnout period was performed. This analysis showed that for most of the test (startup, low output, and high output) the trend line y = 6.88x – 1.7 × 10⁷ relates the two measurements with an r2 = 0.772.
We analyzed the PSD for Appliance 1 during each operating condition using both ELPI and SMPS measurements (detailed in ). The ELPI results gave similar PSD parameters across operating conditions. The fraction of size-resolved PNC data used for PSD calculations for Appliance 1 is greater than or equal to 0.97 for startup, low-output, and burnout, and equal to 0.65 for high-output. The low fraction for the high-output condition is potentially due to overcounting in the smallest size bin. The ELPI calculated dg ranged between 0.158 and 0.224 µm while the σg ranged between 1.65 and 1.94. Appliance 1 operating condition results for ELPI dg ranked from highest to lowest yields: high-output>startup>low-output>burnout. However, it should be noted that while the mean dg during high-output was larger than during startup, both values are larger than 0.200 µm. A σg around 1.8 is typically indicative of a polydisperse aerosol with values between 1 and 2 being common to many combustion processes.
The SMPS derived dg ranged between 0.102 and 0.128 µm, indicating a smaller dg than reported by the ELPI. The SMPS results produce the ranking: burnout>high-output>startup>low-output, which differs from the ELPI dg ranking. The σg range for the SMPS PSD was very small for Appliance1 with values between 1.43 and 1.56.
From the scatterplot given in , we observed that during startup, low-, and high-output conditions the ELPI dg results reflect a wide range of values, while the SMPS derived dg is relatively constant across those operational periods. In contrast, during burnout there is considerably more variation in dg as measured by both instruments, but the variation in both measures tend toward a linear relationship.
To further explore this behavior, the mean dg from both instruments for each operating phase were combined as a ratio. This analysis shows that during startup the dg ratio was 1.8, with similar values of 1.9 and 2.0 during low-output and high-output. In contrast, during burnout the calculated ratio was much lower with a value of 1.1. It follows, based on the calculated ratio and the trend apparent in , that for Appliance 1 the physicochemical properties of the particles are changing across a spectrum spanning from high-output type to low-output type particles and that the particles generated during burnout may fall outside that spectrum. Further, the nearly linear relationship between the ELPI and SPMS dg during burnout suggests that for this condition, the particles produced have characteristics approaching an idealized spherical and non-porous particle (i.e., conforming to the default assumptions used by both instruments to calculate particle diameter).
Particle mass and black carbon
Measurements of PMC2.5 in the flue emissions were made using the pDR and the ELPI following a PNC to PMC transformation as outlined in the methods section. These results are shown in detail in and compared in . The ELPI PMC estimate was drastically higher than the pDR measurement. Using the ELPI data, PMC ranged between 108 and 575 mg/m3. Ranking the mean PMC2.5 calculated for each operating condition yields: high-output> startup>low-output>burnout. The pDR-based PMC2.5 ranged between 2 and 31 mg/m3 with a ranking of: burnout>startup>high-output = low-output. The notable difference in PMC, and the reversed trend in terms of the rankings, indicates that the different detection and measurement techniques used in the ELPI and pDR influence particle mass estimates.
Further, the very large PMC2.5 estimated by the ELPI relative to the pDR, and to literature values for wood chip and pellet boilers (Obaidullah et al. Citation2012) indicate that a density assumption of 1 g/cm3 may be an overestimate. Notably, nephelometer-based instruments have been found to overestimate PMC relative to gravimetric Federal Reference Methods by as much as three-fold for some instruments, further indicating that the ELPI may overestimate in-flue measurements of PMC (Trent Citation2006).
It is also notable in that high-output conditions generate a separate grouping of points in the scatterplot compared to startup, low output, and burnout. High output as measured using the ELPI has the largest PMC, while the pDR PMC is lower or in the same range as the low output and startup conditions. This suggests some deviation in particle physicochemical characteristics, such as density, fractal shape, or light scattering behavior during high output.
Assessments of the BC concentration of the flue emissions were made using the AE33 measurements in tandem with ELPI PNC, and ELPI and pDR PMC measurements. The Appliance 1 BC concentration was relatively low compared to the PMC estimates across all operating conditions. The BC concentration ranged between 0.03 and 0.48 mg/m3. Ranking the operating conditions by mean BC concentration during each condition yields: burnout>startup>low-output>high-output. Comparing the pDR PMC and the AE33 BC concentration offers a relative idea of particle composition. This analysis indicates that during startup and low load, BC accounts for approximately 7% of the PMC2.5, while for high-output BC is 1% and for burnout 2% indicating that optically, BC comprises a small fraction of the overall PMC for this appliance.
Surface area
In addition to measurements of aerosol number and mass concentration, we collected aerosol particle surface area concentration data. This data was derived from the ELPI measurements using the PNC to PSAC transformation, and the NSAM instrument measurement of LDSA. PSAC data are shown explicitly in and appears in . The ELPI PSAC estimate ranged between 1.01 × 10⁶ and 1.67 × 106 µm2/cm3 with an operating condition ranking of high-output>startup>low-output>burnout, which is the same as the ELPI PMC for this boiler. The NSAM LDSA estimate ranged between 4.97 × 10⁴ and 8.59 × 104 µm2/cm3, two orders of magnitude lower than the total PSAC estimate. The corresponding ranking of the average LDSA result was startup>high-output>low-output>burnout, which is like the PNC and dg results.
Appliance 2
Operation
Appliance 2 was a cord wood fueled outdoor wood boiler outfitted with a catalytic combustion system designed to improve PM emission performance. Measurements for Appliance 2 were performed with the same instrumentation and instrumental procedure as Appliance 1. However, the operational protocol of the boiler was different due to batch fuel feeding as explained in the section on the testing protocol. The period mean measurements for all measured parameters for Appliance 2 can be found in , and comparison-related metrics are given as scatterplots in .
Figure 4. Scatterplot comparisons of data collected during testing of Appliance 2 over four different operating conditions: startup, low-output, high-output, and burnout. (A) PNC comparison between ELPI and SMPS. (B) Comparison of dg as calculated from ELPI and SMPS data. (C) Comparison of PMC2.5 between the ELPI and pDR. (D) Comparison of PSAC results, could not be performed due to a malfunction of the NSAM during this experiment.
Particle number and size
The PNC emissions measured from Appliance 2 were comparable to Appliance 1, but lower on average. The ELPI PNC ranged between 0.46 and 5.15 × 10⁷ #/cm3, while for the SMPS the PNC ranged between 0.11 and 1.44 × 10⁸ #/cm3. Results from both instruments produced the ranking: startup> burnout> high-output>low-output. While the SMPS concentration count was higher than that of the ELPI, the ELPI and SMPS PNC results were well correlated. The two instruments’ results are related through the line y = 2.57x + 1.4 × 10⁷ with an r2 = 0.737. This slope is roughly half that calculated for Appliance 1, which suggests differences in the physiochemical properties of particles generated by Appliance 1 versus Appliance 2, perhaps due to the difference in appliance feed/fuel strategy, i.e., continuous/chips versus batch fed/logs.
The fraction of size-resolved PNC data used for PSD calculations for Appliance 2 is greater than or equal to 0.99 for all operating conditions, thus resulting in the same rankings as PNC for both instruments. The ELPI calculated dg ranged between 0.178 and 0.256 µm, slightly larger than the results for Appliance 1. The ELPI σg was between 1.69 and 1.91, indicating relatively polydisperse particulate emissions across all operational conditions, again similar to the Appliance 1 result. Ranking the Appliance 2 operating phase data by ELPI dg results gives: startup>high-output>low-output>burnout. This ranking indicates larger particles were produced during startup than during high-output for Appliance 2.
The SMPS derived dg ranged between 0.094 and 0.190 µm, indicating a smaller mean particle diameter on average than the ELPI. The SMPS derived σg ranged between 1.59 and 1.78 suggesting a tighter distribution than the ELPI results. The SMPS dg results ranking was startup> low-output> high-output>burnout. Notably, this ranking has high- and low-output reversed from the ELPI rankings.
A comparison of the SMPS dg and ELPI dg for Appliance 2 is given in . While the dg values calculated for Appliance 2 were very similar to those calculated for Appliance 1, overall the observed trends between the ELPI and SMPS results were not similar. For Appliance 2 in general, the SMPS dg was smaller relative to ELPI dg, consistent with the findings for Appliance 1. However, the calculated dg is much closer in magnitude for Appliance 2, specifically during low output, where the calculated dg for Appliance 1 and 2 are nearly the same. For Appliance 2, the span of SMPS dg is much larger than that of the ELPI dg, rather than narrower as was observed for Appliance 1. This indicates that Appliance 2 produces particles with larger and more variable mobility diameters relative to Appliance 1, again possibly due to the different feeding/fuel strategies of the appliances.
The aerodynamic diameter range measured by the ELPI is similar between the two appliances, but larger than we observed for Appliance 1. The SMPS to ELPI dg ratio analysis gives values between 1.01 and 1.98, similar to Appliance 1, but with a different ranking order of: low-output>startup>high-output>burnout. This may suggest idealized particles are emitted during low-output for Appliance 2, whereas for Appliance 1 the ratio was at a minimum during burnout.
Particle mass and black carbon
Measurements of PMC were made for Appliance 2 in the same manner as for Appliance 1. The ELPI PMC estimate was again higher than the pDR measurement. The ELPI PMC ranged between 9 and 358 mg/m3. Ranking the Appliance 2 mean PMC results from the ELPI yields: startup>high-output>burnout>low-output. The pDR PMC ranged from 2 to 732 mg/m3 with identical rankings. A comparison of the PMC measured using the pDR and ELPI for Appliance 2 is given in . There is more overlap of points across operating conditions for the two instruments for Appliance 2 when compared to Appliance 1. The estimated mass during startup and low-output correlated fairly well for the two instruments, however their results diverged in the burnout and high-output conditions, suggesting changes in the physical and optical properties of particles emitted during these operational conditions led to a disparity in the results across measurement techniques.
The BC concentration measurements in the flue emissions were made using the AE33 in tandem with PNC and PMC measurements. Appliance 2 BC concentrations were higher than the BC concentrations measured for Appliance 1. The BC concentration range for Appliance 2 was between 0.5 and 8.1 mg/m3. Using these results to rank each operating condition yields: low-output> startup> high-output>burnout. Combined with the PMC estimates, BC accounts for 82% of PMC during low-output and for 32% during burnout, while accounting for only 1.3% and 8.2% during startup and high-output, respectively. The BC fraction is notably higher during the low-output and burnout conditions as compared to Appliance 1.
Surface area
Due to an issue with the NSAM’s corona charger, LDSA data was not collected for this appliance on the same test day as the other measurements. We used the Partector, which operates on similar principles to the NSAM, for tests of Appliance 2 on two other test days. For those tests, the Partector collected data during three operating conditions (startup, low-output, and high-output) for Appliance 2. When we used the NSAM and Partector instruments concurrently during tests of other appliances, the instruments demonstrated overall agreement (data not shown).
The ELPI PSAC data for the main test day for Appliance 2 is shown in . ELPI PSAC for Appliance 2 was between 0.15 and 3.56 × 106 µm2/cm3. Ranking the PSAC estimates by operating condition yields: startup>high-output> burnout>low-output, which is the same as the ELPI PMC2.5 for this appliance. ELPI PSAC for Appliance 2 on the test days with concurrent Partector data was between 3.8 × 10³ and 2.8 × 107 µm2/cm3 The Partector LDSA data ranged between 1.1 × 10² and 3.7 × 105 µm2/cm3 overall. There were no linear relationships between Partector LDSA and PSAC for the three operating conditions.
Appliance 3
Operation
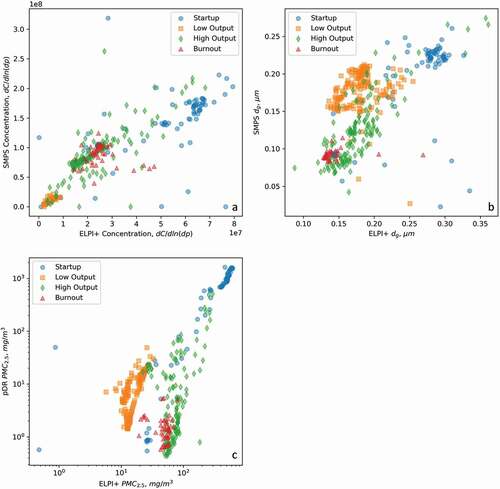
Appliance 3 was a cordwood fueled outdoor wood boiler with a two-stage combustion system. This two-stage system was designed to gasify the fuel prior to secondary combustion, to produce low emissions during all operating conditions. Measurements for Appliance 3 were performed with the same instrument appliance operating procedures as for Appliance 2. The operating condition means for all measured quantities for Appliance 3 can be found in . Comparisons of related metrics are presented as scatterplots in .
Figure 5. Scatterplot comparisons of data collected during testing of Appliance 3 over four different operating conditions: startup, low-output, high-output, and burnout. (A) PNC comparison between ELPI and SMPS. (B) Comparison of dg as calculated from ELPI and SMPS data. (C) Comparison of PMC2.5 between the ELPI and pDR. (D) Comparison of PSAC results, specifically comparing the ELPI PSAC estimate versus the NSAM LDSA.
Particle number and size
The measured PNC was comparable to the previous appliances. Appliance 3 had the lowest PNC of all three appliances. The ELPI PNC ranged between 0.41 and 1.89 × 10⁷ #/cm3. Ranking the operating conditions based on ELPI average PNC yields: startup>high-output>low-output>burnout. The PNC measured by the SMPS ranged between 2.79 and 9.40 × 10⁷ #/cm3; the resultant ranking was: high-output>startup>low-output>burnout. In the case of Appliance 3, the PNC rankings are not the same across the two instruments. As with the other appliances, the SMPS PNC was higher than that measured by the ELPI, but for Appliance 3 the ELPI and SMPS results were closer in magnitude.
Appliance 3 results produce two distinct groupings. Burnout and low-output follow the line y = 3.19x+1.5 × 10⁷ with an r2 = 0.906. High-output and startup follow the line 8.90x - 5.8 × 10⁶ with an r2 = 0.977. The clear delineation between phases was not seen in the other appliances’ data and could be due to the unique gasification-combustion process used in Appliance 3. Further, the slope of 8.90 calculated for the low-output and burnout conditions is much larger than the calculated results for Appliance 1 and 2, with values of 6.88 and 2.58, respectively. A comparison scatterplot of the SMPS PNC and ELPI PNC results collected during testing of Appliance 3 is given in .
The fraction of size-resolved PNC data used for PSD calculations for Appliance 3 is greater than or equal to 0.93 for all operating conditions. The dg results derived from ELPI data for Appliance 3 ranged between 0.80 and 0.155 µm, indicating particles with slightly smaller aerodynamic diameter are produced by Appliance 3 relative to Appliance 1 & 2. Ranking Appliance 3 ELPI dg results yields: startup>high-output>low-output>burnout. The ELPI σg ranged from 2.19 to 2.98, higher than Appliance 1 and 2.
The SMPS dg for Appliance 3 ranged between 0.097 and 0.178 µm, which is higher than the ELPI dg, representing a different trend than for the previous appliances. The SMPS σg was between 1.57 and 1.68, comparable to results for the other two appliances. The SMPS dg ranking was startup>burnout>low-output>high-output.
A comparison plot of the ELPI and SMPS dg results for Appliance 3 is given in . The dg comparative analysis for Appliance 3 shows some features in common with Appliance 2 and some unique features. The SMPS to ELPI dg ratio analysis yields values between 0.51 and 1.06, the lowest ratios observed of the three appliances. The ranking of these results with respect to operating conditions is high-output> low-output> startup>burnout. Appliance 3 data gave ratios near one during the startup, low and high-output conditions, similar to Appliance 2. However, with the exception of high-output, the ratios are less than 1, which is unique to this appliance. Furthermore, during the burnout condition the ratio was 0.51, well below 1. illustrates that during burnout and periods of low-output, similar particles with low dg ratio were produced. During startup, high-output, and a portion of low-output, particles of higher dg ratio were produced. By inspection, this bivariate particle nature is somewhat similar to Appliance 1, where burnout exhibited one trend for dg, separate from the other conditions. For Appliance 3, this trend extends to low-output as well as burnout.
Particle mass and black carbon
The mean PMC for Appliance 3 was between 9 and 88 mg/m3. Ranking the mean PMC results for Appliance 3 based on the ELPI estimate yields: startup>high-output> low-output> burnout. The pDR-based PMC ranged from 3 to 87 mg/m3, with the same ranking as the ELPI data. A comparison of the PMC measured using the pDR and the ELPI for Appliance 3 is given in . In the figure, the PMC data appear to form an S-shape, indicative of dynamic combustion processes and particle properties. Startup and high-output particles appear to form one grouping, indicating particles with similar properties are produced during these operating conditions. Specifically, during these conditions, it seems that the ELPI PMC estimate, and by extension the PNC and PSD which the estimate is derived from, is relatively stable, but the optical properties of the particulate vary.
The ELPI PMC range was smaller for Appliance 3 than for Appliances 1 and 2. During burnout and portions of low-output, both the ELPI PMC estimate and the pDR PMC measurement seem to vary cyclically for Appliance 3. This cyclic behavior could be due to the difference in design between Appliances 2 and 3. The catalytic unit (Appliance 2) achieves low emissions using a catalyst, whereas Appliance 3ʹs gasification-combustion technique approach may necessitate additional airflow adjustments to achieve the same effect.
The BC concentrations measured during testing of Appliance 3 were similar to those of Appliance 2. The BC concentration range for Appliance 3 was 0.67–12.4 mg/m3. Listing the results by decreasing BC concentration yields: startup> high-output> low-output>burnout. The relative BC composition during each operating condition was 14% during startup, 18% during high-output, 32% during low-output, and 20% for burnout. The BC was an important contributor to PM during all operating conditions for Appliance 3.
Surface area
The PSAC data are shown explicitly in , and . For Appliance 3, the ELPI PSAC estimate ranged between 1.16 × 10⁵ and 9.80 × 105 µm2/cm3, with an operating condition ranking of startup> high-output>low-output>burnout. This is like the ranking of PSAC for Appliance 1, with startup and high-output reversed. The NSAM LDSA estimate ranged between 2.36 × 10⁵ and 8.33 × 104 µm2/cm3, less than the total PSAC estimate, but with a smaller difference between results than was observed for Appliance 1. The LDSA ranking is the same as the Appliance 3 PSAC ranking. The ELPI PSAC and NSAM LDSA form two linear groupings of points with the same separation as in the PNC analysis, making similar in appearance. Consistent with Appliance 1 results, the operating condition with the largest dg (startup) for Appliance 3 does not correspond to the smallest LDSA, suggesting the influence of emission characteristics in addition to size on LDSA estimates.
Conclusion
In this study, we evaluated the performance of three biomass-fueled HHs using a suite of particle measurement instrumentation. The goal of these experiments was to characterize particulate emissions from the HHs in different phases of burn to determine if instrument response differences might suggest additional information about the character of particulate from each appliance using instruments outside the scope of regulatory testing. Overall, this study found differences in PNC, dg, and PMC as well as evidence of different particle composition in terms of optical BC concentration, and differences in respirable particle fraction during different combustion conditions and for different appliances.
We measured the PNC emitted by the three appliances and found values between 0.41 and 5.15 × 10⁷ #/cm3 using the ELPI and values between 0.11 and 2.54 × 10⁸ using the SMPS overall. PNC was highest during the startup and high-output phases, indicating sensitivity of PNC to fuel load condition and heat output. Appliance 3 had the lowest PNC. Appliance 2 had lower on average PNC emissions compared to Appliance 1. The unique feed/fuel requirements contributed to differences between Appliance 1 (chip-fueled HH) and the Appliances 2 and 3 (cordwood-fueled HHs). Specifically, the chip-fueled appliance had a higher PNC during low-output than the cordwood fueled appliances as measured using the ELPI, and higher PNC for all operating conditions when measured using the SMPS.
The PSD of the aerosol emitted from these appliances was also dependent on operating condition, showing a wide range of results. The calculated ELPI dg and SMPS dg of the particles differed during most operating conditions. The aerodynamic dg measured by the ELPI instrument ranged between 0.080 and 0.256 µm, while the dg measured by the SMPS ranged between 0.094 and 0.190 µm. The ratio of the calculated dg was found to be dependent on operating condition, and different trends in dg ratio and operating phase were found for each appliance. Both Appliances 1 and 2 had relatively polydisperse particulate emissions across all operating conditions. Appliance 2 produced particles with larger and more variable mobility diameters compared to Appliance 1. Appliance 3 produced particles with slightly smaller aerodynamic diameter compared to Appliances 1 and 2.
The ELPI and pDR PMC estimates also showed operating condition-dependent differences. The ELPI estimate ranged from 9 to 358 mg/m3, while the pDR estimates ranged from 2 to 732 mg/m3. The ELPI PMC range was smaller for Appliance 3 than for 1 and 2. However, the ELPI measurements were consistently one to two orders of magnitude larger than the pDR measurements, with minor exceptions (e.g., startup condition for Appliances 2 and 3). These findings suggest that the particle composition and morphology during startup for Appliances 2 and 3 were such that the optical and aerodynamic properties of the particles aligned to produce a correlated measurement, while in all other conditions the particle properties produced very different instrument responses and results.
Generally, the aethalometer-based BC mass comprised a small fraction of nephelometer and ELPI estimated particle mass measurements. The BC concentrations for Appliances 2 and 3 were similar and higher than the BC concentrations measured for Appliance 1. BC was an important contributor to PM during all operating conditions for Appliance 3. BC contributed mainly to PM during low-output and burnout for Appliance 2. BC comprised a small fraction of the overall PM for Appliance 1.
Particle surface area estimates using the ELPI, and lung-deposited surface area measurements using the NSAM, also demonstrated meaningful trends. The ELPI PSAC measurements ranged between 0.12 × 10⁶ and 3.56 × 106 µm2/cm3 overall, while the NSAM LDSA measurements ranged between 2.36 × 10⁴ and 8.59 × 104 µm2/cm3 for the two tests where NSAM LDSA was measured. The ELPI PSAC measurement was significantly higher than the LDSA measurement for all operating conditions for appliances where the NSAM was used. For Appliance 1, the LDSA and PSAC comparison showed a single grouping of points indicating little difference in particle properties regarding deposition efficiency with operating condition. For Appliance 3, however, burnout and low-output conditions were distinguished from high-output and startup conditions as having a higher LDSA per given PSAC measurement value. Generally, particles formed during startup, low-output, and burnout were reported as having higher potential for alveolar deposition than particles formed during high-output. The LDSA/PSAC1.0 ratios were 2 to 6 times higher for Appliance 3 than Appliance 1. These findings show that operating condition, appliance type, biomass fuel type, and loading type are likely to affect the fine particle fraction of emissions for some appliances.
In comparison, laboratory testing of a residential pellet stove using an ELPI to measure PNC, PSD, and PMC (PM1 and PM2.5) also observed varying concentration and particle size during three combustion phases (startup, combustion, and burnout) over a total of six experiments under two partial (2.5 kW) and four nominal load (5.0 kW) tests. The experimental variation was attributed to differences in fuel consumption and burner configuration with different fan speeds regulating air flow into the combustion chamber. PNC measured during the phases varied with values ranging from 2.98 × 10⁶ to 9.90 × 10⁷. The peak PNC was found for all the experiments between 0.025 and 0.070 µm for startup, 0.070 and 0.100 µm for combustion, and 0.020 and 0.080 µm for burnout. Maximum PMC was obtained at approximately 0.320 µm for startup and combustion and at 0.300 µm for burnout. The combustion phase in nominal load output produced considerably higher PM1 and PM2.5 emissions compared to startup and burnout. The startup phase in partial load output produced the highest PM1 and PM2.5 emissions compared to combustion and burnout (Obaidullah, Bram, and DeRuyck Citation2019).
Current certification test methods are largely focused on test integrated, mass-based metrics. Moreover, most regulatory methods use gravimetric filter-based methods. This study demonstrates that the most numerous particles emitted by the biomass hydronic heaters are in the 0.080 to 0.256 µm size range, which is within the trough in capture efficiency of most filter media. Currently, PSD is not evaluated during regulatory testing for residential combustion units but is a component of testing for other stationary and mobile sources. If regulatory testing moves toward more sophisticated protocols to better capture the types and changeability of particulate emissions emitted, it will be important to recognize that biomass combustion particles will have different aerodynamic and mobility diameters and optical properties, and that differences in those metrics are dependent on appliance operating condition, heat output and fuel load. Regulations that do not distinguish the magnitude and type of emissions from biomass fueled appliances for different operational conditions during normal use cannot fully capture the potential for emissions from these types of sources to contribute to community particulate air pollution over health-relevant time frames. This work provides support for the importance of fully assessing emissions during operational conditions representative of the intended use of the appliance. Research in this field can inform policy decisions at local, state, and federal levels to help manufacturers design and market cleaner burning appliances, and to help homeowners to burn biomass cleanly and efficiently, thus reducing heating costs and environmental and health risks.
Data availability
The data that support the findings of this study are available from the corresponding author, JL, upon reasonable request.
Acknowledgments
The authors would like to acknowledge everyone at the Energy Conversion Group at Brookhaven National Laboratory (BNL) for organizing the experiments and operating the appliances and Northeast States for Coordinated Air Use Management (NESCAUM) for developing the test method used in this study. Financial support from New York State Energy Research Development Authority (NYSERDA) has made this work possible. This research was funded through NYSERDA Agreement 63033.
Disclosure statement
No potential conflict of interest was reported by the author(s).
Additional information
Funding
Notes on contributors
Jake Lindberg
Jake Lindberg is a recent doctoral graduate at Stony Brook University in the Chemical and Molecular Engineering Department in Stony Brook, New York, USA and works closely with the Energy Conversion Group, at Brookhaven National Laboratory in Upton, New York, USA.
Nicole Vitillo
Nicole Vitillo is a research scientist at the New York State Department of Health, in the Center for Environmental Health, Bureau of Toxic Substance Assessment, Exposure Characterization and Response Section, in Albany, New York, USA.
Marilyn Wurth
Marilyn Wurth is a research scientist at the New York State Department of Environmental Conservation, in the Emissions Measurement Research Group within the Division of Air Resources, Bureau of Mobile Sources & Technology Development in Albany, New York, USA.
Brian P. Frank
Brian P. Frank is the section chief of the Emissions Measurement Research Group at the New York State Department of Environmental Conservation, Division of Air Resources, Bureau of Mobile Sources & Technology Development in Albany, New York, USA.
Shida Tang
Shida Tang is a research scientist at the New York State Department of Environmental Conservation, in the Emissions Measurement Research Group within the Division of Air Resources, Bureau of Mobile Sources & Technology Development in Albany, New York, USA.
Gil LaDuke
Gil LaDuke is a research scientist at the New York State Department of Environmental Conservation, in the Emissions Measurement Research Group within the Division of Air Resources, Bureau of Mobile Sources & Technology Development in Albany, New York, USA.
Patricia Mason Fritz
Patricia Mason Fritz is the section chief of the Exposure Characterization and Response Section at the New York State Department of Health, in the Center for Environmental Health, Bureau of Toxic Substance Assessment, in Albany, New York, USA.
Rebecca Trojanowski
Rebecca Trojanowski is a research scientist at Brookhaven National Laboratory, in the Interdisciplinary Science Department, Energy Conversion Group, in Upton, New York, USA, and is a doctoral candidate at Columbia University in the Department of Earth and Environmental Engineering, in New York, New York, USA.
References
- Allen, G., and L. Rector. 2020. Characterization of residential woodsmoke PM2.5 in the Adirondacks of New York. Aerosol Air Qual. Res. 20 (11):2419–32. doi:10.4209/aaqr.2020.01.0005.
- Annals of the ICRP. 1994. Human respiratory tract model for Radiological Protection. ICRP Publication, 52–54.
- Bari, Md. A., G., Baumbach, J., Brodbeck, M., Struschka, B., Kuch, W., Dreher, & G., Scheffknecht. 2011. Characterisation of particulates and carcinogenic polycyclic aromatic hydrocarbons in wintertime wood-fired heating in residential areas. Atmos. Environ. 45 (40):7627–34. doi:10.1016/j.atmosenv.2010.11.053.
- Bolling, A. K., J. Pagels, K. E. Yttri, L. Barregard, G. Sallsten, P. E. Schwarze, & C. Boman. 2009. Health effects of residential wood smoke particles: The importance of combustion conditions and physiochemical particle properties. Part. Fiber Toxicol. 6: 29. doi:10.1186/1743-8977-6-29
- Boman, C., A. Nordin, D. Bostrom, and M. Ohman. 2004. Characterization of inorganic particulate matter from residential combustion of pelletized biomass fuels. Energy & Fuels 18 (2):338–48. doi:10.1021/ef034028i.
- Chandrasekaran, S. R., J. R. Laing, T. M. Holsen, and P. K. Hopke Suresh Raja. 2011. Emission characterization and efficiency measurements of high-efficiency wood boilers. Energy & Fuels 25 (11):5015–21. doi:10.1021/ef2012563.
- Chandrasekaran, S. R., J. R. Laing, T. M. Holsen, S. Raja, and P. K. Hopke. 2013. Residential-scale biomass boiler emissions and efficiency. Energy & Fuels 27 (8):4840–49. doi:10.1021/ef400891r.
- Cohen, B. S., R. G. Sussman, and M. Lippmann. 1990. Ultrafine particle deposition in a human tracheobronchial cast. J. Aerosol Sci. Technol. 12 (4):1082–91. doi:10.1080/02786829008959418.
- Corsini, E., M. Marinovich, and R. Vecch. 2019. Ultrafine particles from residential biomass combustion: A review on experimental data and toxicological response. Int J Mol Sci 20 (20):4992. doi:10.3390/ijms20204992.
- Danielsen, P. H., E. V. Bräuner, L. Barregard, G. Sällsten, M. Wallin, R. Olinski, R. Rozalski, P. Møller, & S. Loft. 2008. Oxidatively damaged DNA and its repair after experimental exposure to wood smoke in healthy humans. Mutat. Res. 642 (1–2):37–42. doi:10.1016/j.mrfmmm.2008.04.001.
- Drinovec, L., G. Močnik, & P. Zotter. 2015. The ”dual-spot” Aethalometer: An improved measurement of aerosol black carbon with real-time loading compensation. Atmos. Measur. Tech. 8 (5):1965–79. doi:10.5194/amt-8-1965-2015.
- Forchhammer, L., et al. 2012. Controlled human wood smoke exposure: Oxidative stress, inflammation and microvascular function. Part Fibre Toxicol. 9 (1). doi:10.1186/1743-8977-9-7.
- Gaegauf, C., U. Wieser, and Y. Macquat. 2001. Field investigation of nanoparticle emissions from various biomass combustion systems. Aerosol from Biomass Combustion. Zurich: International Seminar at 27 June 2001 in Zurich by IEA Bioenergy Task. 81–85.
- Gunter, O., J. Ferin, R. Gelein, S. C. Soderholm, and J. Finkelstein. 1992. Role of aveolar macrophage in lung injury: Studies with ultrafine particles. Environ. Health Perspect. 97:193–99. doi:10.1289/ehp.97-1519541.
- Hinds, W. C. 1982. Particle Size Statistics. In Aerosol technology: Properties, behavior, and measurement of airborne particles, 69–103. New York: John Wiley & Sons.
- Hoek, G., G. Kos, R. Harrison, J. de Hartog, K. Meliefste, H. ten Brink, K. Katsouyanni, A. Karakatsani, M. Lianou, A. Kotronarou, & I. Kavouras. 2008. Indoor–outdoor relationships of particle number and mass in four European cities. Atmos. Environ. 42 (1):156–69. doi:10.1016/j.atmosenv.2007.09.026.
- Hoek, G., K. Meliefste, J. Cyrys, M. Lewné, T. Bellander, M. Brauer, P. Fischer, U. Gehring, J. Heinrich, P. van Vliet, et al. 2002. Spatial variability of fine particle concentrations in three European areas. Atmos. Environ. 36 (25):4077–88. doi:10.1016/S1352-2310(02)00297-2.
- Hueglin, C. H., C. H. Gaegauf, S. Kunzel, and H. Burtscher. 1997. Characterization of wood combustion particles: Morphology, mobility, and photoelectric activity. Environ.lSci. Technol. 31 (12):3439–47. doi:10.1021/es970139i.
- Janssen, N. A. H., G. Hoek, M. Simic-Lawson, P. Fischer, L. V. Bree, H. T. Brink, M. Keuken, R. W. Atkinson, H. R. Anderson, B. Brunekreef, F. R. Ja Cassee. 2011. Black carbon as an additional indicator of the adverse health effects of airborne particles compared with PM10 and PM2.5. Environ. Health Perspect. 119 (12):1691–99. doi:10.1289/ehp.1003369.
- Johansson, L. S., B. Leckner, L. Gustavsson, D. Cooper, C. Tullin, and A. Potter. 2004. Emission characteristics of modern and old-type residential boilers fired with wood logs and wood pellets. Atmos. Environ. 38 (25):4183–95. doi:10.1016/j.atmosenv.2004.04.020.
- Kinsey, J. S., A. Touati, T. L. Yelverton, J. Aurell, S. H. Cho, W. P. Linak, B. K. Gullett. 2012. Emissions characterization of residential wood-fired hydronic heater technologies. Atmos. Environ. 63:239–49. doi:10.1016/j.atmosenv.2012.08.064.
- Kuula, J. K., H. Kuuluvainen, J. V. Niemi, E. Saukko, H. Portin, A. Kousa, M. Aurela, T. Rönkkö, & H. Timonen. 2019. Long-term sensor measurements of lung deposited surgace area of particulate matter emitted from local vehicular and residential wood combustion sources. Aerosol Sci. Technol. 54 (2):190–202. doi:10.1080/02786826.2019.1668909
- Lighty, J. S., J. M. Veranth, and A. F. Sarofim. 2000. Combustion aerosols: Factors governing their size and composition and implications to human health. J. Air Waste Manage. Assoc. 50 (9):1565–618. doi:10.1080/10473289.2000.10464197.
- Lillieblad, L., A. Szpila, M. Strand, J. Pagels, K. Rupar-Gadd, A. Gudmundsson, E. Swietlicki, M. Bohgard, M. Sanati. 2004. Boiler operation influence on the emissions of submicrometer-sized particles and polycyclic aromatic hydrocarbons from biomass-fired grate boilers. Energy & Fuels. 18 (2):410–17. doi:10.1021/ef0300444.
- Naeher, L. P., M. Brauer, M. Lipsett, J. T. Zelikoff, C. D. Simpson, J. Q. Koenig, & K. R. Smith. 2007. Woodsmoke health effects: A review. Inhal. Toxicol. 19 (1):67–106. doi:10.1080/08958370600985875.
- New York State Energy Research and Development Authority. “Patterns and trends new york state energy profiles: 2002-2016.” 2019.
- New York State Energy Research and Development Authority (NYSERDA). “Assessment of carbonaceous PM2.5 for New York and the region.” 2008.
- New York State Energy Research and Development Authority (NYSERDA) and Northeast States for Coordinated Air Use Management (NESCAUM). “New York state wood heat report: An energy, environmental, and market assessment final report.” 2016.
- New York State Energy Research and Development Authority (NYSERDA) and Northeast States for Coordinated Air Use Management (NESCAUM). “Interim report: Development of an integrated duty-cycle test method for cordwood stoves.” 2020.
- Noonan, C. W., T. J. Ward, and E. O. Semmens. 2015. Estimating the Number of Vulnerable People in the United States Exposed to Residential Wood Smoke. Environ. Health Perspect. 123 (2): A30. doi:10.1289/ehp.1409136
- Northeast States for Coordinated Air Use Management. “Test Methods.” Northeast States for Coordinated Air Use Management. 2021 August. https://www.nescaum.org/documents/bnl-hydronic-heater-test-method.pdf/ .
- Obaidullah, M., S. Bram, and J. DeRuyck. 2019. Measurements of particle emissions and size distributions from a modern residential pellet stove under laboratory conditions. Int. J. Sys. Appl. Eng. Dev. 13:1–9.
- Obaidullah, M., S. Bram, V. K. Verma, and J. DeRuyck. 2012. A review on particle emissions from small scale biomass combustion. Int. J. Renew. Energy Res. 2.
- Obernberger, I., T. Brunner, and G. Barnthaler. 2007. “Fine particulate emissions from modern Austrian small-scale biomass combustion plants.” 15th European Biomass Conference & Exhibition. Berlin, 1546–57.
- Obernberger, I., T. Brunner, and M. Jöller. 2001. Characterisation and formation of aerosols and fly-ashesfrom fixed bed biomass combustion. Aerosol from Biomass Combustion, 69–74. Zurich: IEA Bioenergy Agreement.
- Penn, S. L., S. Arunachalam, M. Woody, W. Heiger-Bernays, Y. Tripodis, and J. I. Levy. 2017. Estimating state-specific contributions to PM2.5- and O3-Related health burden from residential combustion and electricity generating unit emissions in the United States. Environ. Health Perspect. 125 (3):324–32. doi:10.1289/EHP550.
- Rich, D. Q., et al. 2018. Daily land use regression estimated woodsmoke and traffic pollution concentrations and the triggering of ST-elevation myocardial infarction: A case-crossover study. Air Quality Atmos. Health 11 (2):239–44. doi:10.1007/s11869-017-0537-1.
- Rogalsky, D. K., P. Mendola, T. A. Metts, and W. J. Martin II. 2014. Estimating the number of low-income Americans exposed to household air pollution from burning solid fuels. Environ. Health Perspect. 122 (8):806–10. doi:10.1289/ehp.1306709.
- Schwartz, C., A. Kocbach Bølling, and C. Carlsten. 2020. Controlled human exposures to wood smoke: A synthesis of the evidence. Part Fibre Toxicol. 17 (1). doi:10.1186/s12989-020-00375-x.
- Smith, W. B. 2014. Evaluation of wood fuel moisture measurement accuracy for cordwood-fired advanced hydronic heaters. NYSERDA.
- Trent, A. 2006. Smoke particulate monitors: 2006 update. Missoula: USDA Forest Service Technology Development Program.
- Trojanowski, R., and V. Fthenakis. 2019. Nanoparticle emissions from residential wood combustion: A critical literature review, characterization, and recommendations. Renew. Sustain. Energy Rev. 103:515–28. doi:10.1016/j.rser.2019.01.007.
- Trojanowski, R., J. Lindberg, T. Butcher, and V. Fthenakis. Search wood stove database (central heaters). Accessed April 20, 2020. https://cfpub.epa.gov/oarweb/woodstove/index.cfm?fuseaction=app.searchwh.
- Trojanowski, R., J. Lindberg, T. Butcher, and V. Fthenakis. 2022. Realistic operation of two residential cordwood fired appliances part 1: Particulate mass and gaseous emissions. Review.
- United States Environmental Protection Agency. 2009. Integrated science assessment for particulate matter (final report). Washington D.C.: U.S. EPA.
- United States Environmental Protection Agency. “Standards of performance for new residential wood heaters, new residential hydronic heaters and forced-Air furnaces.” 2015.
- United States Environmental Protection Agency. “Test method 28 OWHH for measurement of particulate emissions and heating.” 2017.
- United States Environmental Protection Agency. “Integrated science assessment (ISA) for particulate matter (final report, 2019).” 2019.
- Wichenthal, S., et al. 2017. Biomass burning as a source of ambient fine particulate air pollution and acute myocardial infarction. Epidemiology. 28 (3):329–37. doi:10.1097/EDE.0000000000000636.
- Wiinikka, H., and R. Gebart. 2005. The influence of fuel type on particle emissions in combustion of biomass pellets. Combustion Sci. Technol. 177 (4):741–63. doi:10.1080/00102200590917257.
- World Health Organization. 2012. The health effects of black carbon. Copenhagen, Denmark.