
ABSTRACT
The U.S. Environmental Protection Agency (US EPA) requires residential wood heaters (RWHs) to meet particulate matter (PM) emission limits in order to lower ambient concentrations and reduce public exposure. The current US EPA dilution tunnel PM measurement methods for RWHs were developed several decades ago and use manual filter samples to generate a single PM value for tests that can last more than 12 hours for stoves and 30 hours for central heating appliances. This approach results in averaging periods of high and low emissions together and provides limited data on emissions over the entire burn profile. Over the last decade, the U.S. ambient fine particulate monitoring network has transitioned to the routine use of online automated methods. However, stationary source measurement methods have not made this transition. There are no substantial technical issues in implementing real-time automated methods to measure PM for RWH emission certification purposes. The Thermo Scientific Tapered Element Oscillating Microbalance (TEOM™) has been widely used for ambient PM measurements. It is a true inertial mass measurement with high time resolution and sensitivity. This work compares measurements obtained using a Thermo 1400 or 1405 TEOM with ASTM E2515 manual filter samples, the current US EPA Federal Reference Method, for 172 test runs across a wide range of stoves and PM loading conditions. The TEOM measurements used the same filter media, similar filter face velocities, and filter temperatures as manual methods. PM measurements were well correlated (R2 > 0.9), with TEOM values typically lower by 5% to 10%. TEOM data capture was high, with filter changes resulting in ~5 minutes of lost data, usually once or twice during a multi-hour test. We discuss differences between the two methods, such as post-sampling equilibration and measurement of PM on sample train surfaces (probe “catch”). We also provide examples of substantial non-water semi-volatile mass loss during sampling.
Implications: Measurement methods for continuous PM and our understanding of their performance has dramatically improved over the last thirty years. Highly time-resolved measurements of PM from residential wood heating appliances in an appliance certification testing context provide additional insight into both appliance performance and the suitability of the test method to assess that performance. This continuous measurement approach offers new opportunities to replace traditional US regulatory PM sampling integrated manual source methods like ASTM E2515 or EPA Method 5G testing. For measurement of combustion products that can have a wide range of physical and chemical characteristics, the TEOM’s actual mass measurement principle has advantages over the sensitivity of surrogate methods to different aerosols for use in a regulatory program. Although the TEOM is commonly used to measure ambient PM, it can readily be configured to meet the needs of continuous emission testing.
Introduction
Residential wood heaters (RWHs) are a significant source of particulate matter (PM) emissions in many parts of the U.S. (NESCAUM Citation2008; US EPA, Citation2018), and exposure to wood smoke has been shown to have a range of adverse health effects (Marin et al. Citation2022; Naeher et al. Citation2007; Sigsgaard et al. Citation2015; Weichenthal et al. Citation2017). The U.S. Environmental Protection Agency (US EPA) requires RWHs to meet PM emission limits to reduce public exposure to ambient wood smoke. The US EPA and stakeholders have expressed the need to improve PM measurement precision and address issues associated with existing EPA test methods for residential wood heaters (US EPA, Citation2016). Yet PM measurement methods for this source category have remained essentially unchanged since the state of Oregon first adopted these methods in the late 1970s and US EPA first promulgated emission regulations for RWHs in 1988. Since that time, our understanding of measurement issues with combustion-related PM, especially of semi-volatile organic carbon aerosol, has improved dramatically (Grover et al. Citation2006). Online (continuous or semi-continuous) PM measurement methods have matured to the point that they are now widely used in regulatory monitoring networks to determine compliance with the US EPA National Ambient Air Quality (NAAQS) for PM2.5 (particulate matter with a nominal diameter of 2.5 µm or smaller). The use of these methods for measurement of PM from RWHs is technically viable and would improve the precision and efficacy of the test method.
The current FRM, ASTM Method E2515-11, uses a dilution tunnel to obtain total PM measurements (ASTM Citation2011a; US EPA Citation2017). This manual method collects the particle sample on a 47 mm glass fiber filter that is weighed before and after sampling with desiccated equilibration to determine the collected mass. This approach provides a single integrated PM measurement for the entire test run, which can typically last 12 hours for stoves and 30 hours for central heating appliances, averaging periods of high emissions with those of low or almost no PM emissions. Time-resolved emission profiles can provide an improved understanding of RWH performance under different operating conditions and characterize peak PM emissions for durations of interest, such as rolling 1-hour averages. Many continuous methods have been used over the years for both ambient air and source PM measurements, but most are surrogate techniques such as particle charge, beta-attenuation, or optical measurements, rather than an actual mass measurement. The response of these surrogate measurements depends on the physical or optical properties and chemical composition of the PM, which can vary widely for different combustion conditions or source types.
The Thermo Scientific (Franklin, MA) Tapered Element Oscillating Microbalance (TEOM™) is a continuous true mass measurement method that has been widely used for ambient PM measurements (Patashnick and Rupprecht Citation1991; Rupprecht, Meyer, and Patashnick Citation1992). It is an online inertial ultra-microbalance with a resolution of 0.01 micrograms. The TEOM was developed initially for mass measurement in the zero-gravity conditions of space (Patashnick and Rupprecht Citation1977). PM is collected on a filter mounted on the tip of a hollow tapered glass tube (element), and the change in the element’s oscillating frequency is measured as the filter accumulates mass. The change in frequency from the filter mass loading is converted to a change in mass over an interval using the element’s calibration constant (K0), which is empirically determined by weighing a clean TEOM filter of known mass. The measured mass divided by the sampled volume over the interval equals the PM concentration for that interval. For a stable mass measurement, the TEOM filter must be maintained at a fixed temperature at least a few degrees C above the temperature of the instrument’s environment and also higher than the dewpoint of the sample stream. Unless the filter temperature is sufficiently elevated to prevent the collection of semi-volatile mass (SVM), such as nitrate, organic carbon, and unbound water, the dynamic nature of SVM can result in large and rapid positive and negative transient filter mass changes and thus large changes in reported concentrations (Allen Citation1998; Li et al. Citation2012). For this reason, early versions of the TEOM for ambient PM measurement heated the filter to 50°C, but this often resulted in an under-measurement of PM2.5 compared to the regulatory data from a Federal Reference Method (FRM) sampler (Allen et al. Citation1997). Over time, enhancements were made to the TEOM method to address this ambient PM measurement issue, such as the Sample Equilibration System (SES) that used a dried sample at 30°C to minimize loss of dry SVM (Meyer et al. Citation2000) and the Filter Dynamic Measurement System (FDMS) differential approach that measures the dry SVM indirectly in near real-time (Grover et al. Citation2005; Jaques et al. Citation2004).
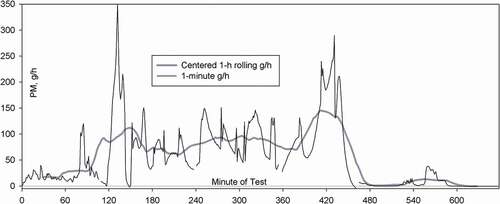
Highly time-resolved measurements (1 to 10 minutes) of RWH PM emissions provide a comprehensive assessment of an appliance’s emission performance compared to the current average measurement for the entire multi-hour test run. The US EPA recognized the need for enhanced PM emissions data in the 2015 revisions to the New Source Performance Standards (NSPS) for RWH (US EPA, Citation2015) and added a separate requirement to report the first hour of PM emissions. Time-resolved PM emissions measurements would allow alternative test method metrics to include other limits, such as a rolling 1-hour peak emission limit to protect against the very local (micro- to neighborhood-scale) potential for harmful or nuisance PM concentrations. is an example of 1-minute TEOM data showing the PM emission rate (g/h) from a 2015 NSPS Step-2 (2.5 g/h limit) certified cordwood stove for a 658-minute test run using the new NESCAUM Integrated Duty Cycle (IDC) cordwood fueling protocol (NESCAUM Citation2021a) which ends when 90% of the final fuel charge weight has been burned. Frequent periods of high emissions exceeding 100 g/h are followed by periods of low or almost no emissions. Gaps in the 1-minute data are four manual TEOM filter changes that result in three to five minutes of missing data.
Figure 1. Time-series of PM emissions from a Step-2 2015 NSPS cordwood stove in a dilution tunnel, IDC fueling protocol (Stove #9, August 7, 2019).
The TEOM is capable of high PM measurement precision even with very low PM emission RWH devices such as pellet stoves. The high sensitivity of the TEOM also allows the use of higher dilution tunnel flows of 600 to 800 cubic feet per minute (CFM), which are necessary to minimize elevated levels of tunnel water vapor and temperature at high burn rates.
Background
The TEOM has been used to measure PM from combustion sources, but that application has never achieved widespread use. A patent was awarded for TEOM stack measurements (Hiss and Patashnick Citation2000). ASTM D6831-11 is a 2002 method for TEOM stack PM measurements (ASTM Citation2011b) that was commercialized by Rupprecht and Patashnick (R&P, East Greenbush, NY) as the Series 7000 SPM (Burgher, Meyer, and Bailey Citation2001). A system that combined the Dekati (Kangasala, Finland) FPS4000 dilution system with a TEOM was marketed as the Series 6100 Microdiluter and the Series 1105 Diesel Particulate Monitor (Thermo, Citation2005). More recently, Thermo developed the Particulate Matter Continuous Emissions Monitoring System TEOM stack sampling system (Goohs Citation2014). None of these systems are currently commercially available.
In 2010, US EPA noted the following regarding the potential of the TEOM for use in measuring PM from combustion sources: “EPA evaluated the use of the tapered element oscillating micro-balance (TEOM) technology for quantifying low concentrations of total filterable PM and determined that this technology met Method 301 criteria and was suitable for approval as an alternative for Method 5 or 17 for a wide range of sources.” (US EPA, Citation2010) The TEOM has been used for measuring PM from diesel or wood combustion by several researchers using various sample dilution approaches. There has been limited use of the TEOM in non-regulatory research settings for measuring RWH PM from a dilution tunnel. Kinsey (Citation2009, supplemental info) reported good agreement between TEOM and manual filter samples. Kinsey (Citation2012) reports use of a TEOM in a dilution tunnel but does not report any data from that study due to low instrument reliability. Chandrasekaran et al. (Citation2011) used a FDMS TEOM sampler from a dilution chamber but does not report performance characteristics other than issues with short sampling durations due to filter loading. Corbin et al. (Citation2015) used a TEOM to measure PM from a wood stove stack with a dilution factor (DF) of 8, but did not collect gravimetric samples for comparison; they note loss of TEOM filter mass after large PM spikes, attributing it to volatilization of OC. Sullivan et al. (Citation2017) used a TEOM with a dilution tunnel followed by an additional dilution stage to collect 133 samples at different TEOM filter temperatures (50°C and 30°C) and reported that TEOM PM was 50% higher than manual filter PM samples. Kortelainen et al. (Citation2018) compared a TEOM sampling off a dilution system to 21 gravimetric PM samples; means were similar but R2 was 0.34.
This paper presents results from recent testing using a refined TEOM method for measuring dilution tunnel PM emissions from RWHs. It characterizes and validates performance relative to existing regulatory methods for PM measurements. The TEOM is used in its simplest configuration, without any sample conditioning or additional dilution upstream from the instrument’s inlet.
Methods
A Thermo Scientific (Franklin, MA) Model 1400AB or 1405 TEOM was used to sample PM in a dilution tunnel along with ASTM E2515 integrated gravimetric PM samples using 47 mm Pallflex Emfab TX40 Teflon-coated glass fiber filters (Pall Life Sciences, Ann Arbor, MI). For this application, the TEOM did not have any of the inlet hardware used for ambient PM measurements (PM size cut, sample conditioning, flow splitter, or bypass flow). The instrument’s 0.5 inch diameter down-tube served as the TEOM inlet, and a short length of 0.25 inch inner diameter anti-static polyethylene tubing was used to sample from the dilution tunnel, similar to the manual gravimetric samples. Sample flows were checked at the start and end of each test day with a TSI (Shoreview, MN) model 4140 mass flowmeter calibrated at 70°F (21.1°C) and 1 atm. TEOM PM concentrations were corrected to 20°C for comparison with the manual filter samples.
The TEOM sample flow was 0.50 standard liters per minute (SLPM) which is a filter face velocity of 6.3 cm/s, except for the work with the pre-NSPS stove where high PM concentrations required an inlet flow of 0.4 SLPM. The TEOM sample filter temperature was 30°C, except for some early work at 25°C during cold weather and test runs performed during the summer when filter temperature was increased to 33°C due to elevated laboratory temperatures. Filter temperature, sampling duration, and filter mass loadings for the TEOM and manual method were often not matched, which as described later can affect the relative PM measurements. The TEOM instrument parameters were changed to allow fast response and minimal data loss from filter changes; temporal resolution for the final data set is 1-minute. TEOM filter changes resulted in no more than 5 min of data loss. An alarm to alert the operator to change the filter to avoid plugging was triggered using the instrument’s contact closure outputs. The default PM10 Federal Equivalent Method (FEM) correction factors for slope (1.03) and intercept (+3 µg/m3) were not used (slope was set to 1.00 and intercept was set to 0.0). Negative PM concentrations (reported when the TEOM filter lost semi-volatile mass) were set to zero. The Standard Operating Protocols (SOP) for the operation of the TEOM in a dilution tunnel are publicly available (NESCAUM Citation2020a, Citation2021b). These SOPs list the instrument settings that were changed from the default ambient monitor configuration, and the recommended instrument parameters to be stored.
Samples were collected from pellet and cordwood stoves at two facilities between 2015 and 2019. Initial work used the 1400AB TEOM, but research transitioned to the current model (1405) in 2018. Twenty-five sample pairs of varying duration were collected from a large firebox non-catalytic 2015 NSPS Step-1 certified wood stove burning red oak cordwood in February 2015 at Brookhaven National Lab (BNL) in Upton, NY from a 425 CFM dilution tunnel using a 1400AB TEOM (Allen et al. Citation2017). Thirty-six sample pairs were collected between August 2016 and January 2017 from a 200 CFM dilution tunnel at Hearthlab Solutions (HLS) in Bethel, VT using a 1400AB TEOM and a pre-1988 US EPA NSPS cordwood stove burning dimensional lumber cribs built from several different wood species (Hearthlab Solutions Citation2017). Between October 2017 and January 2020, 172 valid sample pairs were collected from 17 different stoves at HLS. At least three replicate runs were performed for each stove in each tested configuration. A 1400AB TEOM was used for the first 46 samples and a 1405 TEOM for the remaining samples (the 1400AB is now obsolete and no longer supported by Thermo Scientific). Test methods for operation and fueling used EPA Method 28, ASTM E3053-17, and the NESCAUM IDC protocol. The filters for the manual samples were not heated. All PM concentrations are reported at 20°C and 1 atm. Sample volumes for the HLS manual filter samples are measured dry as required by the test methods allowed by US EPA; the TEOM sample volumes are not dried but are adjusted downwards by 2% (the ASTM E2515 correction) as an approximate dilution tunnel water vapor correction. A variety of cordwood and pellet stoves and wood species were used for these tests. These 172 samples are the primary dataset used for this analysis.
The method detection limit (MDL) was determined from the 1405 TEOM used at HLS, run in the same configuration used for PM measurements (total mass and mass rate/mass concentration averaging times both set at 30 seconds, and 1-minute storage interval), but sampling room air at 2 LPM with a high-efficiency particle filter on the inlet. 111 consecutive hours of particle-free data were collected. Data were block-averaged to 10-minute intervals and the standard deviation of all values was calculated. A 10-minute interval is used here because that is the shortest time period that may be of interest for the characterization of PM emissions in a regulatory context. The reported 10-minute MDL is three times the standard deviation, and the practical quantitation limit (PQL) is three times the MDL (US EPA Citation2019, Method 5i), or nine times the standard deviation. The PQL metric used by the US EPA is similar to the Limit of Quantitation, typically ten times the standard deviation.
The precision of the TEOM PM measurement was assessed at HLS with a 1405D “dichot” TEOM, which is two separate TEOM sensors in a single instrument package for the measurement of PM2.5 and PM-coarse in ambient air. The mass transducers and flow sensors for each channel are identical but independent measurement systems that share a single filter temperature control system for the filter temperature control zones. For this application, the reported PM concentration for the coarse mass channel must be manually corrected as follows:
Actual coarse channel concentration = reported concentration * coarse flow/16.67
This is because the instrument’s reported coarse mass concentration assumes the use of a dichotomous virtual impactor inlet with a 10:1 coarse to total flow ratio and 1.67 LPM coarse channel TEOM sample flow.
Because the TEOM PM measurement is always without any post-sampling equilibration, it can be helpful to better understand the relative roles of water and SVOC in the observed filter mass loss for manual filter methods during desiccated post-sampling equilibration. ASTM E2515 explicitly states that loss is water, but was written when hygroscopic glass fiber filters were used and where liquid water on the filter was considered acceptable. When Emfab Teflon coated filters are used and liquid water is not present in the sample train, water should be a smaller component of this loss. The majority of the PM is usually organic carbon (OC), so while un-bound water could still account for some of the mass loss, it is also expected that loss of SVOC occurs during equilibration when OC loading is dominant.
Quantitative measurements were performed to assess how much of the mass loss from a filter during TEOM sampling was SVOC by diluting the stack sample with dry air to reduce the sample stream’s relative humidity (R.H.) before collection on a TEOM filter, producing a dry sample. Once the sample was collected, the input of the dilution system was switched to dry particle-free air, and the mass lost from the TEOM filter was measured over time. This is similar in concept to Wallace et al. (Citation2021), who used a piezobalance to estimate the fraction of a fresh aerosol mixture that is volatile, as well as the time required for evaporation from the impaction surface (but without the active ventilation after sample collection that is present for the TEOM filtration method). For this work, a modified Dekati eDiluter-Pro 2-stage ejector diluter with a dilution factor of 35 was used to sample stack PM from a Step-2 wood stove during a burn phase with high PM emissions. The eDiluter inlet was customized by Dekati to provide counterflow axial dilution upstream of the first ejector diluter to enhance condensation of volatile species, similar to the initial high-temperature dilution stage used in the Dekati high-temperature eDiluter Pro model 1200C and now sold as the “eDilMix” option. The eDiluter dilution air source used the Dekati DI-1032 membrane dryer, which is a SPX Flow (Charlotte, NC) Hankison model HMD 20–3 that supplies air with a dewpoint no higher than −40°C for this application. Assuming 14% v/v water in the stack gas and 130 ppmv water in the dilution air, the relative humidity of the diluted sample is approximately 10% at the TEOM filter temperature of 30°C, using calculations based on British Standard 1339–1:2002 (Michell Instruments web moisture calculator).
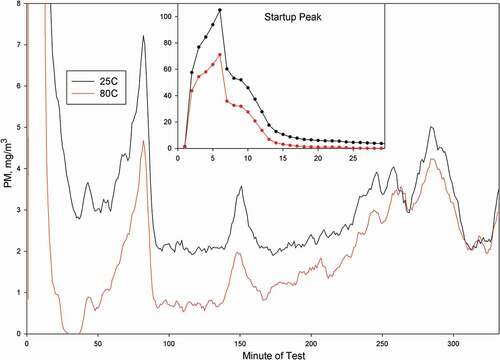
The presence of SVOC in fresh woodsmoke was qualitatively assessed by measuring dilution tunnel PM from a cordwood boiler with two model 1400AB TEOMs simultaneously, running at 25 and 80°C. This older model of the TEOM can operate at a wider range of filter temperatures than the 1405 TEOM that is limited to between 30 and 55°C. These tests were performed during the winter at a test lab in CT where laboratory temperatures were low enough to allow stable operation of the TEOM at 25°C. Operational parameters of both TEOMs were identical except the temperature settings; sample flow was 0.5 LPM. With a sampling temperature difference of 55°C, when SVOC is present some of it would be expected to volatilize both in the heated TEOM tube before collection on the filter and also from PM deposited on the filter, resulting in lower reported PM concentration from the 80°C TEOM.
Results
Method Detection Limit (MDL) and Practical Quantitation Limit (PQL)
For 573 10-minute average blank (filtered air) TEOM PM concentrations with a sample flow of 2.0 LPM, the average was −0.2 µg/m3, with a median of +0.3 and range of 25.2 µg/m3. The samples passed the Shapiro-Wilk test for normality (W-Statistic of 0.997, P = .462), indicating that the noise was normally distributed. The standard deviation (sigma) of 10-minute block-average particle-free samples for the 1405 TEOM configuration used here with 2 LPM sensor flow was 4.2 µg/m3. For comparison, the 1405 specification sheet lists precision as 2 µg/m3 for 1-hour at 3 LPM sensor flow; precision is not defined. The 10-minute MDL used here is three times sigma, or 0.012 mg/m3, and the PQL (defined as three times the MDL) is 0.036 mg/m3. shows the TEOM PQL for different measurement scenarios. In addition to PM concentration, PQL is shown for the g/h regulatory metric used to measure wood stove PM emission rate for a 500 CFM dilution tunnel and (for when an extractive dilution sample is measured with a STP stack flow of 20 CFM) a DF of 50. For flows other than 2 LPM, the values are proportionally scaled up or down as appropriate. Note that these values may be degraded under non-optimal operating conditions. For longer averaging intervals, the PQL would decrease. Since the noise is normally distributed, a 1-hour interval decreases the PQL by a factor of approximately 2.5 (the square root of 6).
Table 1. 1405 TEOM 10-minute practical quantitation limit (PQL) at different sample flows, based on measurements made at 2 LPM sample flow.
Collocated PM measurements using a 1405D dichot 2-channel TEOM showed very good correlation and numerical agreement across a wide range of tunnel PM concentrations. shows the Deming regression of 10-minute block average data from the two dichot TEOM PM measurements during a single 610 minute IDC test run on a 2015 NSPS Step-2 cordwood stove in a 230 CFM dilution tunnel at HLS. TEOM sample flows were 0.5 LPM to minimize filter changes. The means are 13.26 and 13.49 mg/m3, representing a PM emission rate of 5.2 g/h. The regression slope is 1.015, non-significant intercept is 0.02 mg/m3, and R2 is 0.9999. The coefficient of variation for PM from the two measurement channels at 0.5 LPM is 4.1%, and the RMSE is 0.59 mg/m3. We have observed that the agreement between paired TEOM measurements (especially at sub-hourly time scales) can be substantially degraded by incomplete dilution tunnel mixing even in a tunnel that meets US EPA specifications for RWH testing (Rousta, Ahmadi, and Allen Citation2022), and it is difficult to distinguish TEOM measurement problems from mixing problems without additional diagnostic testing that ensures both channels are getting the same aerosol concentration. In the example shown here, the excellent agreement between TEOM channels indicates that both the HLS tunnel mixing and the instrument performance were functioning properly.
Figure 2. Deming regression of collocated PM from a 1405D 2-channel TEOM, 10-minute block average data from a high emitting NSPS Step-2 cordwood stove.
Comparisons between TEOM and manual filter sampling for PM
Initial testing to characterize TEOM performance for this application was conducted at BNL in February 2015, comparing PM measurements between TEOM and manual filter sampling (Allen et al. Citation2017). Manual filter PM samples for the BNL comparison were weighed on a semi-microbalance (0.01 mg resolution) with no equilibration (0-day) and with equilibration of 1-day and 7-days in a desiccant chamber per the regulatory method. The results shown in demonstrate excellent correlation of filter and 1400AB TEOM PM for all of these equilibration times, with the regression intercepts not significantly different from zero. As expected, the filters lost weight with equilibration, with approximately half the loss during the first day. The 1-week equilibration gave the best numerical agreement, with TEOM PM being 13% lower than the filter PM.
Figure 3. Model 1400AB Teom vs. Manual Emfab Filter PM (mg/m3) in a dilution tunnel at BNL, desiccated equilibration times of 0-Day, 1-Day, and 1-Week. Dotted lines are 1:1.
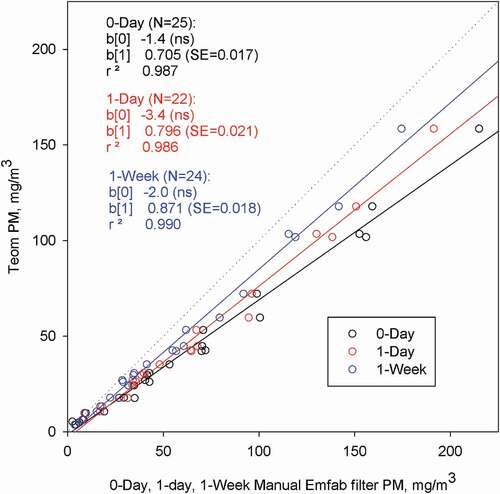
Figure 4. 1400AB Teom vs. Filter PM Concentration in a dilution tunnel, August 2016 – January 2017. Dotted line is 1:1.
In 2016, 36 paired samples from a pre-1988 NSPS stove burning dimensional lumber cribs of different wood species were collected at HLS using a manual filter pull with Emfab filters and a Model 1400AB TEOM sampling at 0.4 LPM. As shown in , the methods were highly correlated, with TEOM PM being about 12% lower than equilibrated manual samples. The standard error (SE) of the regression slope is 0.031. For reference, 10 mg/m3 = 3.4 g/h at the HLS 200 CFM tunnel flow.
Integrated Duty Cycle testing, October 2017 – January 2020
One hundred and seventy-two valid collocated TEOM and manual filter samples were collected as part of developing the IDC operation and fueling test method (Morin et al. Citation2022; NESCAUM Citation2020b). One hundred and thirty test runs used various species of cordwood on 17 different stoves, and 42 test runs used various species of wood pellets on 4 different stoves. Two samples with the highest PM values, where the TEOM PM was substantially greater than the manual filter samples, were removed from further analysis. While these are valid samples, they are from the same high-emitting stove on sequential test days where there were five TEOM filters and one manual filter used (to prevent filter plugging, the manual filter sample was collected at 0.045 CFM, a lower flow than usual). Using Cook’s D and DFFITS tests, only the highest point is an outlier, but both points are from the same atypical scenario and excluded from further analysis.
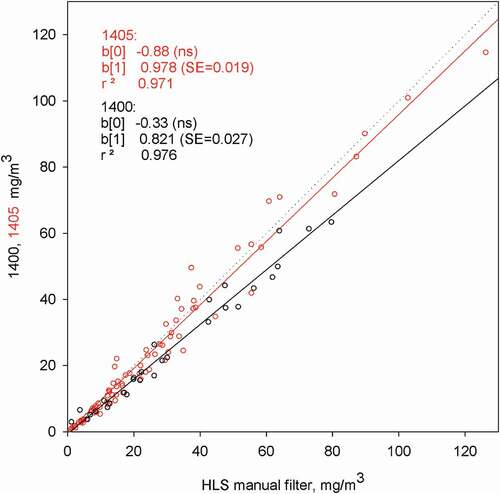
For the remaining 170 samples, the first 46 (all cordwood) were from a 1400AB TEOM, and the rest (124 samples) were from a 1405 TEOM. When the change from the 1400AB to the 1405 was made, a single test day of data was collected with both instruments to assess comparability. The agreement was excellent, with a 1.5% difference in average PM and an R2 of 0.998 for 10-minute block average PM concentration data. However, there was a large observed difference between the 1400AB and the 1405 TEOM cordwood tests when compared to the manual filter samples. While both models of TEOM were well correlated with the manual filter samples and with non-significant intercepts, the 1400 slope was 0.82 (SE = 0.02), and the 1405 slope was 0.98 (SE = 0.02), as shown in . There are some differences in the two TEOM models that could explain some of this divergence. First, the heated inlet down-tube in the 1400 is ~30% longer, providing more surface area and residence time for SVOC aerosol to condense on the tube surface. Second, this work identified a measurement error in the 1405 caused by a software timing issue (confirmed via personal communication, Maria Johncox, Thermo Scientific) that results in an approximately 5% positive bias in the reported PM data when combined with other instrument software characteristics. Additional collocation of the 1400 and 1405 TEOMs were performed at ClearStak (Putnam and Willington, CT), a US EPA-certified test laboratory, in July and August 2018. These tests showed the 1400 to be between 8 and 13% lower than the 1405, but well correlated, with R2 > 0.99. Because of this difference between TEOM models for this application, and because the 1400AB TEOM is now obsolete and no longer supported by the manufacturer, the remaining data analysis is from 1405 data only.
Figure 5. TEOM model 1400 and 1405 vs. manual filter sample PM (mg/m3) for HLS cordwood tests.
Because wood pellet stoves tend to have lower PM emissions than cordwood stoves, the regression analysis for wood pellets was performed separately. shows results for pellet stoves only, with one outlier shown but not included in the regression. The SE of the regression slope is 0.058.
Figure 6. 1405 TEOM vs. manual filter sample PM (mg/m3) for pellet stove tests.
Another variable that can affect the measured PM is the number of filters used for each test run. Filters for both methods were only changed when flow could not be maintained due to filter loading, and although the filter media was the same, varying differences in filter face velocities resulted in different filter run times. shows the regression of (a) TEOM PM on manual filter sample for pellet and cordwood tests that used the same number of filters (slope of 0.909) and (b) samples where the TEOM used more filters than the manual filter samples (slope of 0.983). The SE for both regression slopes is 0.02. When more TEOM filters are used than for the manual filter method, the average TEOM response increases by approximately 7%. This is consistent with less loss of SVOC from the filter during shorter duration sampling. An extreme example of this is the two highest PM concentration samples from a high PM emitting stove that have been excluded from analysis as atypical; both had five TEOM filters and a single manual filter sample and are shown as squares in ). For these two samples, the ratio of TEOM PM to manual filter samples was 1.10 and 1.22, and with them included in the regression the slope is 1.07 with an intercept of −2.3.
Figure 7. (a) 1405 TEOM vs. manual filter sample PM (mg/m3), same number of filters. (b) 1405 TEOM vs. manual filter sample PM (mg/m3), more TEOM than manual filters. Square symbols represent two samples removed from the analysis.
summarizes the regression results for all test configurations with TEOM PM as the dependent variable. The TEOM PM10 US EPA Federal Equivalent Method factors of 1.03 and +3 µg/m3 were not used. Two consecutive test runs on a high-emitting cordwood stove measured with the 1405 TEOM were atypical and excluded from analysis, as noted above in . When the same number of filters are used for both the TEOM and the manual filter samples, the slope is lower than all other configurations. This difference is expected due to less loss of semi-volatile mass with shorter filter run times when multiple filters are used in a test run. The correlation for the pellet stove runs is lower than all the others, but the precision of both TEOM and manual filter samples is very good for those lower PM concentrations; this issue needs further investigation. Note that two 1405 TEOM operating factors (water vapor corrections and instrument software changes) could be changed in the future, as summarized in the discussion section. These would have modest effects on the results presented here.
Table 2. Summary of regression parameters, TEOM (model indicated in parentheses) vs. equilibrated manual filter sample (intercepts are not significant).
Discussion
There are several factors to consider when comparing the manual filter sampling method to the TEOM data presented here. Two factors result in lower reported TEOM PM relative to the manual filter method:
1. The TEOM PM measurement does not include any sample train “catch” (PM collected on the sample train upstream of the first or front filter that is included in the manual filter method). This additional PM can be zero to as much as 10% of the total collected mass with the manual filter method, and thus biasing the TEOM PM low.
2. There is a variable filter temperature differential between the two methods. The manual filter sample is collected at room temperature, while the TEOM sample is collected at 30°C to 33°C. Higher filter temperatures increase the loss of SVOC. In cold weather, the filter temperature differential could be as much as 15°C.
Two factors result in higher reported TEOM PM relative to the manual filter method;
1. The TEOM PM measurement has no post-sampling equilibration and thus includes more SVOC and possibly water than the manual sampling method. This difference could be as much as 10% on average, and more when TEOM filters are changed more frequently than manual filters.
2. There is a low-level 1405 TEOM software error (versions 1.74 and older) identified during this work that introduces a bias in the reported average PM concentration from the 1405 TEOM of +5% that is not related to any slope or intercept terms in the TEOM configuration. This is expected to be fixed by Thermo in a future instrument software release. As of March 2022, three years after reporting the problem, no date for a fix is available.
Another uncontrolled variable is water vapor. TEOM flows for this work are not dried, while the manual filter sample volume is desiccated before being measured. While a 2% water vapor correction (from ASTM E2515) has been applied to the reported TEOM concentrations, this is only an approximate correction, representing an average tunnel dewpoint of 17°C.
The inability to easily incorporate probe “catch” and the lack of equilibration are inherent in the TEOM method; these factors bias the TEOM data in opposite directions. The software error can be fixed, and issues with water vapor corrections can be resolved by having all flow measurements (TEOM, manual filter, and dilution tunnel flow) on the same wet moisture basis, eliminating the need for an estimated (fixed value) water vapor correction to tunnel flows as required by current test methods. Despite these uncontrolled effects, the TEOM and manual filter sampling methods were well correlated for all comparisons. For most comparisons, the TEOM results were somewhat lower. This is not due to uncertainties in the actual captured filter mass or flow measurements because those are robust for both the TEOM and the manual filter samples. Rather, it is driven by the unmeasured TEOM PM catch noted above and the collected particle mass retained on the filters. For SVM (which includes SVOC and water), the filter mass can be dynamic as PM on the filter desorbs (volatilizes) and absorbs during sampling. These dynamic conditions occur on both the TEOM and manual sample filters during sampling but cannot be observed on the manual filters because they are integrated samples.
The retained filter mass could be different in either direction between these two methods when semi-volatile PM is present. There are several possible reasons for differences, including filter media, filter face velocity, sample duration, and filter temperature. Filter mass loading (a function of face velocity and sample duration) is also a factor; when PM loading on the filter is lower, the potential for losing mass is also lower. The Emfab filter media is the same for both the TEOM and manual sampling method used here. For this work, filter temperatures are not well-matched, with the TEOM being ~ 3 to 12°C warmer, resulting in less collected and retained particle mass; Li et al. (Citation2012) ran TEOMs at 50 and 30°C and reported lower PM at the higher filter temperature due to increased loss of SVM. Filter face velocity and sampling duration (and thus filter loading) were not controlled but were usually within a factor of two. Longer sample duration on a single filter typically results in lower reported average PM, primarily when most mass loading occurs early in the sampling period; this can occur with both the TEOM and the manual sampling method.
The sensitivity of PM measurements to filter temperature for fresh wood smoke PM was qualitatively assessed by running a pair of 1400AB TEOMs at 25 and 80°C. shows PM measured at these two temperatures for a 5.5 hour test run with a cordwood boiler. The startup peak is shown in the insert at a different y-axis scale. For the first 200 minutes there is a substantial difference between the PM concentrations, with the hot sample about 30 to 50% lower than the cool sample. The average PM is 5.2 and 3.1 mg/m3 for 25 and 80°C, respectively, a decrease of 40% for this 55°C difference in filter temperature. Toward the end of the test run when most of the fuel charge is burned the two measurements converge. Although the higher sample temperature also reduces the relative humidity at the filter which could reduce the measured mass, the good agreement toward the end of the test period suggests that water is not a substantial component of the differences observed here.
Figure 8. PM from a cordwood boiler measured with TEOMs at 25 and 80°C.
The potential difference in reported PM due to sampling at different face velocities (and thus filter mass loading and the number of filters used in a test run) tends to be larger than the other differences discussed above. For this work, filter face velocity was usually higher for the TEOM than the manual filter samples; this would tend to make the TEOM PM read lower when SVOC is present due to increased filter ventilation (Liu et al. Citation2014; Swanson and Kittleson, Citation2009). However, higher face velocity also results in more rapid PM filter loading, which requires more frequent filter changes and thus shorter sampling durations for each filter and less time for collected SVOC to be lost off the filter. This can result in the number of TEOM filters used in a test run being greater than the number of manual sampling filters used and cause the TEOM to read higher. An extreme example of this effect is the two test runs reported here () where five TEOM filters were used compared to a single manual filter sample.
For a comparison of face velocities in the TEOM and manual filter methods, ASTM E2515 places a limit of 15 cm/s face velocity (a TEOM sample flow of 1.2 LPM) but can be lower. shows the calculated filter face velocity for different methods. Filter diameter is the exposed (wetted) diameter, not the actual filter diameter.
Table 3. Filter face velocities for different sampling methods.
Unlike the manual filter sample method, the TEOM method used here does not include measuring the sample train “catch.” The TEOM PM measurement also does not include stabilization of filter measurements using a desiccant chamber according to ASTM E2515. During the desiccation period, manual filters usually lose mass. While this mass loss can vary widely, it is typically on the order of 10 to 15%, as shown in and Allen et al. (Citation2017). ASTM E2515 explicitly states that equilibration is designed to remove “uncombined water.” It specifies the use of hygroscopic glass fiber filters, often resulting in wet filters which the method considers a valid sample. The TEOM uses Emfab Teflon-coated glass fiber filters that are not hygroscopic, and condensation of water vapor in the sample train is avoided by the use of higher dilution tunnel flows in the IDC test method.
It has been assumed that the mass loss during the ASTM E2515 desiccation process was water. However, the PM composition from fresh wood smoke is usually dominated by OC, and thus SVOC may account for the majority of the mass loss because un-aged primary OC has minimal water uptake (Carrico et al. Citation2018; Shingler et al. Citation2016). However, when the burn is very hot and clean, soot and ash salts make up a larger fraction of PM emissions; these components are relatively stable. Equivalent (optical) black carbon (eBC) was measured from seven different wood stoves on 18 test days with an Aethalometer in the HLS dilution tunnel over different burn conditions (NESCAUM Citation2019). shows the eBC to TEOM PM ratio by burn phase for 12 IDC runs on four different cordwood stoves (three replicate runs on each stove). One stove was Step-2 certified, and three were Step-1. Because most cordwood stove PM is either eBC or OC (Holder et al. Citation2019), the eBC to PM ratio is an indicator of the extent of OC in the sample, with a low ratio indicating high OC content.
Table 4. eBC to PM Ratio for twelve IDC runs on four different wood stoves.
While it is difficult to quantify how much of the mass loss on a filter is water versus SVOC, qualitative measurements sampling the dried and diluted stack sample using the Dekati eDiluter and a TEOM suggest that a substantial portion of the loss is SVOC. 2815 µg of PM was collected on a TEOM filter during 55 minutes of sampling at 2 LPM, corresponding to a filter face velocity of 25 cm/s. The eDiluter was then switched to Standby mode, where excess air from the same source as the dilution air is introduced in excess at the eDiluter inlet. There is no change in sample pressure at the TEOM inlet because the second dilution stage inlet is always at atmospheric pressure, while the RH drops from approximately 10 to less than 1%. As shown in , after 253 minutes (4.2 hours) of sampling clean air, the TEOM filter mass had dropped from 2815 to 2084 µg, a 26% reduction, and was still slowly dropping. The total mass lost is somewhat greater than this because the mass lost in the first 55 minutes of sampling is not measured. Nearly all of this mass loss is SVOC as the sample was collected dry. Because the TEOM filter was at 30°C and was actively ventilated, the SVOC loss observed here is likely faster than what would occur on a filter equilibrating at room temperature without flow through it, but not necessarily greater.
Figure 9. Mass loss from the TEOM filter when sampling dry clean air.
Another example of mass loss after sampling is shown in , where a test run ended, PM emissions became very low, and TEOM sampling continued for another 52 hours with tunnel flow. This example used a typical dilution tunnel sample so it is possible that some of the 35% mass loss could be water. However, it is unlikely that the majority of this loss is water because this is not a desiccated equilibration, and this result is consistent with the dry mass loss example shown above.
Figure 10. TEOM filter mass loss for 52 hours after the end of a dilution tunnel test run.
Another example of mass loss after filter collection is the difference in the TEOM to manual filter sample relationship when more filters are used during a TEOM test run than for the manual sample. ) shows that the regression slope increases from 0.91 with the same number of filter changes to 0.98 with the TEOM having more filter changes. The two highest points omitted from the analysis are an extreme example of this effect, with five TEOM filters used and a single filter used for the manual sample. More frequent TEOM filter changes result in less SVOC mass loss from the TEOM filter during active sampling and thus higher reported PM emissions. This effect was also observed using collocated manual filter samples measuring dilution tunnel PM from a residential cordwood boiler, where the number of filters used for the run was different (Trojanowski et al. Citation2019). One sample train was changed only when sample flow dropped due to excessive mass loading, and the other was changed for each different burn phase (i.e., changed more often). shows that changing filters more often increased run average PM emission rates by 30 to 65%. Because all of these filters were equilibrated in a desiccator, this difference is primarily due to increased retention of SVOC on more frequently changed filters and not from water.
Table 5. Test run average PM emission rate (g/h) with different numbers of filters used.
These data demonstrate that the results of PM emission tests can vary substantially as a function of the number of filters used to collect the PM. Longer sampling time (fewer filters) increases the PM loading on the filter and provides greater opportunity for SVOC loss off the filter during sampling. How often filters are changed (for both manual filter and TEOM sampling) is a large and uncontrolled variable in existing test methods, especially with devices that have high PM emissions during some portion of the test duration that are followed by a period of low PM emissions.
Conclusion
The model 1405 TEOM was designed for measuring ambient PM. However, the upper end of its specified range is 1 g/m3, and thus it can also be used to measure PM from combustion sources as long as the sample stream dewpoint is lower than the TEOM filter temperature. With some simple changes to the TEOM operating configuration, it is suitable for measuring the high PM concentrations (hundreds of mg/m3) sometimes present in dilution tunnels used for characterizing emission rates from RWH. These configuration changes also minimize data loss during a filter change to no more than 5 minutes. The instrument can also precisely measure the very low dilution tunnel concentrations (hundreds of µg/m3) resulting from low emitting RWH such as pellet stoves with PM emission rates as low as 0.5 g/h even when using the higher tunnel flows necessary to properly control dilution tunnel temperature and water vapor when burn rates are high.
Extensive testing has demonstrated that TEOM PM measurements are highly correlated with manual filter PM data from the current regulatory method. Regression intercepts are not significantly different from zero, and the slope of the regression is usually slightly less than 1.0, with the TEOM being lower than the manual filter method. Qualitative measurements suggest that there can be substantial amounts of SVOC in RWH PM sampled from a dilution tunnel. When the sample has a large amount of SVOC, several factors can influence the relationship between PM measured with the TEOM and the manual filter sample method. Matching filter face velocity and temperature and changing both manual and TEOM filters simultaneously minimize measurement variability. In general, changing filters more often results in an increase in measured PM emissions by as much as 20 to 30% because frequent changes minimize the loss of SVOC from the filter during sampling. Thus, minimizing filter changes by reducing sample flow for either the TEOM or manual filter samples can cause a substantial difference in PM emission test results. This factor may be the most influential uncontrolled variable in the current PM FRM (ASTM E2515) for RWH test method since there is no minimum filter flow specified in ASTM E2515, and common test laboratory practice is to avoid or minimize filter changes during a test run by using lower sample flows when heavy PM loading is expected.
These results demonstrate that TEOM PM emission measurements are generally comparable to the FRM approach while providing highly time-resolved emissions data across different burn phases. The TEOM offers an improved approach for measuring PM for regulatory purposes compared to the existing manual PM regulatory measurement method and is consistent with the move to real-time PM measurement methods for the ambient PM monitoring network. Compared to manual filter sampling, the TEOM provides more precise data with high time resolution and eliminates the need for filter weighing facilities. Maintaining proportionality between tunnel flow and the sample flow is unnecessary because g/h calculations can be done using 1-minute tunnel flow and PM concentration data. Drying the sample stream before flow measurement is required for the current regulatory method but is not needed for PM emission rate measurements with a TEOM if the tunnel flow is also measured on a wet basis (eliminating the use of a fixed water vapor correction) and tunnel air dewpoint is properly controlled with higher tunnel flows. Continuous PM measurements show the variations in the PM emissions rate throughout the burn and enable the determination of PM emissions during different phases of the burn and at various test endpoints, such as when 90 and 100% of the fuel load has been consumed or when 100% of emissions have been measured (e.g., at the time of maximum collected TEOM filter PM). The high sensitivity of the TEOM allows for precise characterization of emissions from RWH with low PM emission rates even when using the higher tunnel flows needed to control tunnel temperature and dewpoint properly. The use of a TEOM during the appliance design process facilitates the development of the improved designs necessary to meet current and future RWH PM emission requirements. Finally, combining the TEOM measurement approach with new portable dilution systems could provide a robust mechanism for conducting in-use field measurements of RWH PM emissions.
Acknowledgment
Funding for this project was provided by the New York State Energy Research and Development Authority (NYSERDA), Agreement #101132 and #123059, and the authors thank Dr. Ellen Burkhard, NYSERDA Project Manager, for helpful comments throughout the project. The opinions expressed in this report do not necessarily reflect those of NYSERDA or the State of New York. Additional funding for the HLS 2016 Vigilant species crib testing was provided by the US EPA. Mention of product manufacturer names or trademarks does not imply endorsement by NESCAUM or NYSERDA.
Data availability statement
The data that support the findings of this study are available from the corresponding author, [GA], upon reasonable request.
Disclosure statement
No potential conflict of interest was reported by the author(s).
Additional information
Funding
Notes on contributors
George Allen
George Allen is the Chief Scientist at Northeast States for Coordinated Air Use Management (NESCAUM) in Boston, MA.
Barbara Morin
Barbara Morin worked for the Rhode Island Department of Environmental Management and Department of Health and is currently an Environmental Analyst at Northeast States for Coordinated Air Use Management (NESCAUM) in Boston, MA.
Mahdi Ahmadi
Mahdi Ahmadi was an Environmental and Energy Analyst at Northeast States for Coordinated Air Use Management (NESCAUM) in Boston, MA. and is currently a consultant based in Austin, TX.
Lisa Rector
Lisa Rector is the Policy and Program Director at Northeast States for Coordinated Air Use Management (NESCAUM) in Boston, MA.
References
- Alaska department of environmental conservation air quality regulations, section 18 AAC 50.077 2020. Accessed August 27, 2020. https://dec.alaska.gov/air/burnwise/standards/
- Allen, G. 1998. Invited comments on: Real-Time liquid water mass measurement for airborne particulates. Aerosol Science and Technology 29 (6):563–65. doi:10.1080/02786829808965591.
- Allen, G., L. Rector, T. Butcher, and R. Trojanowski. 2017. Evaluation of alternative filter media for particulate matter emission testing of residential wood heating devices. Journal of the Air & Waste Management Association 67 (10):1055–60. doi:10.1080/10962247.2017.1349011.
- Allen, G., C. Sioutas, P. Koutrakis, R. Reiss, F. W. Lurmann, and P. T. Roberts. 1997. Evaluation of the TEOM method for measurement of ambient particulate mass in urban areas. Journal of the Air & Waste Management Association 47 (6):682–89. doi:10.1080/10473289.1997.10463923.
- ASTM. 2011a. Method E2515-11, standard test method for determination of particulate matter emissions collected by a dilution tunnel. ASTM, West Conshohocken, PA. Accessed June 1, 2020. https://www.astm.org/Standards/E2515.htm
- ASTM. 2011b. Method ASTM D6831-11, standard test method for sampling and determining particulate matter in stack gases using an in-stack, inertial microbalance. ASTM, West Conshohocken, PA. Accessed June 1, 2020 https://www.astm.org/Standards/D6831.htm
- Burgher, E., M. Meyer, and G. Bailey. 2001. Validation of a new method for in-stack measurement of particulate matter emissions from large stationary sources. Presented at: Electric Utilities Environmental Conference on “Air Quality & Global Climate Change, Tucson, AZ January 8-12, 2001. Accessed June 24, 2021. https://www.envirotech-online.com/white-paper/air-monitoring/6/cem/validation-of-a-new-method-for-in-stack-measurement-ofnbspparticulate-matter-emissions-from-large-stationary-sources/74
- Carrico, C. M., S. L. Gomez, M. K. Dubey, and A. C. Aiken. 2018. Low hygroscopicity of ambient fresh carbonaceous aerosols from pyrotechnics smoke. Atmospheric Environment 178:101–08. doi:10.1016/j.atmosenv.2018.01.024.
- Chandrasekaran, S. R., J. R. Laing, T. M. Holsen, S. Raja, and P. K. Hopke. 2011. Emission characterization and efficiency measurements of high-efficiency wood boilers. Energy & Fuels 25 (11):5015–21. doi:10.1021/ef2012563.
- Corbin, J. C., A. Keller, U. Lohmann, H. Burtscher, B. Sierau, and A. A. Mensah. 2015. Organic emissions from a wood stove and a pellet stove before and after simulated atmospheric aging. Aerosol Science and Technology 49 (11):1037–50. doi:10.1080/02786826.2015.1079586.
- Goohs, K. 2014. Thermo Scientific PM CEMS: A dual-sensing technology. White Paper. Accessed June 1, 2020. https://assets.thermofisher.com/TFS-Assets/LSG/Vector-Information/EPM-PMCEMS-white-paper.pdf
- Grover, B. D., N. L. Eatough, D. J. Eatough, J. C. Chow, J. G. Watson, J. L. Ambs, M. B. Meyer, P. K. Hopke, R. Al-Horr, D. W. Later, et al. 2006. Measurement of both nonvolatile and semi-volatile fractions of fine particulate matter in Fresno, CA. Aerosol Science and Technology 40 (10):811–26. doi:10.1080/02786820600615071.
- Grover, B. D., M. Kleinman, N. L. Eatough, D. J. Eatough, P. K. Hopke, R. W. Long, W. E. Wilson, M. B. Meyer, and J. L. Ambs. 2005. Measurement of total PM2. 5 mass (nonvolatile plus semivolatile) with the Filter Dynamic Measurement System tapered element oscillating microbalance monitor. Journal of Geophysical Research: Atmospheres 110 (D7). doi:10.1029/2004JD004995.
- Hearth, Patio and Barbecue Association (HPBA). May 2, 2014 Comments of the hearth, patio & barbecue association on EPA’s proposed standards of performance for new residential wood heaters, new residential hydronic heaters and forced-air furnaces, and new residential masonry heaters. Accessed October 17, 2020. https://www.hpba.org/Portals/26/Documents/Government%20Affairs/NSPS%20Members/HPBA%202014%20NSPS/HPBACommentsMay22014.pdf
- Hearthlab Solutions. 2017. Wood species testing using crib and cordwood in a pre-NSPS residential wood heater. EPA-HQ-OAR-2016-0130-0010. Accessed June 1, 2020. https://www.nescaum.org/documents/epa-hq-oar-2016-0130-0010-1.pdf/
- Hiss, J., and H. Patashnick. 2000. Patent for “In-stack direct particulate mass measurement apparatus and method with pressure/flow compensation.” Accessed July 21, 2020. https://pdfpiw.uspto.gov/.piw?PageNum=0&docid=06016688
- Holder, A., T. Yelverton, A. Brashear, and P. Kariher. 2019. Black carbon emissions from residential wood combustion appliances. Report # EPA/600/R-20/039. Accessed August 9, 2020. https://cfpub.epa.gov/si/si_public_record_Report.cfm?Lab=CEMM&dirEntryId=348245
- Jaques, P. A., J. L. Ambs, W. L. Grant, and C. Sioutas. 2004. Field evaluation of the differential TEOM monitor for continuous PM2. 5 mass concentrations. Aerosol Science and Technology 38 (S1):49–59. doi:10.1080/02786820390229435.
- Kinsey, J. S., P. H. Kariher, and Y. Dong. 2009. Evaluation of methods for the physical characterization of the fine particle emissions from two residential wood combustion appliances. Atmospheric Environment 43 (32):4959–67. doi:10.1016/j.atmosenv.2009.07.008.
- Kinsey, J. S., A. Touati, T. L. Yelverton, J. Aurell, S. H. Cho, W. P. Linak, and B. K. Gullett. 2012. Emissions characterization of residential wood-fired hydronic heater technologies. Atmospheric Environment 63:239–49. doi:10.1016/j.atmosenv.2012.08.064.
- Kortelainen, M., J. Jokiniemi, P. Tiitta, J. Tissari, H. Lamberg, J. Leskinen, J. G. L. Rodriguez, H. Koponen, S. Antikainen, I. Nuutinen, et al. 2018. Time-resolved chemical composition of small-scale batch combustion emissions from various wood species. Fuel 233 (6):224–36. doi:10.1016/j.fuel.2018.06.056.
- Li, Q. F., L. Wang-Li, Z. Liu, and A. J. Heber. 2012. Field evaluation of particulate matter measurements using tapered element oscillating microbalance in a layer house. Journal of the Air & Waste Management Association 62 (3):322–35. doi:10.1080/10473289.2011.650316.
- Liu, C. N., S. F. Lin, A. Awasthi, C. J. Tsai, Y. C. Wu, and C. F. Chen. 2014. Sampling and conditioning artifacts of PM2.5 in filter-based samplers. Atmospheric Environment 85:48–53. doi:10.1016/j.atmosenv.2013.11.075.
- Marin, A., L. Rector, B. Morin, and G. Allen. 2022. Residential wood heating: An overview of U.S. impacts and regulations. Journal of the Air & Waste Management Association this issue.
- Meyer, M. B., H. Patashnick, J. Ambs, and E. Rupprecht. 2000. Development of a sample equilibration system for the TEOM continuous PM monitor. Journal of the Air & Waste Management Association 50 (8):1345–49. doi:10.1080/10473289.2000.10464180.
- Michell instruments humidity calculator, based on British Standards Institution BS 1339-1:2002. Accessed August 4, 2020. http://www.michell.com/us/calculator/
- Morin, B., M. Ahmadi, L. Rector, and G. Allen. 2022. Development of an integrated duty cycle test method to assess cordwood stove performance. Journal of the Air & Waste Management Association this issue.
- Naeher, L. P., M. Brauer, M. Lipsett, J. T. Zelikoff, C. D. Simpson, J. Q. Koenig, and K. R. Smith. 2007. Woodsmoke health effects: A review. Inhal. Toxicol 19 (1):67–106. doi:10.1080/08958370600985875.
- NESCAUM. 2008. Contribution of wood smoke to particle matter levels in connecticut: Source characterization of outdoor wood furnaces. Accessed July 21, 2020. http://www.nescaum.org/documents/source-characterization-of-outdoor-wood-furnaces
- NESCAUM. 2019. Measurement of black carbon in a wood stove method 5g dilution tunnel. Accessed December 30, 2021. http://www.nescaum.org/documents/measurement-of-black-carbon-28feb19-final.pdf/
- NESCAUM. 2020a. Standard operation procedures for thermo 1405 TEOM for use in a dilution tunnel or with an extractive dilution system. Accessed July 28, 2020. http://www.nescaum.org/topics/test-methods
- NESCAUM. 2020b. Interim report: Development of integrated duty-cycle test method for cordwood stoves. Accessed April 1, 2021. https://www.nyserda.ny.gov/About/Publications/Research-and-Development-Technical-Reports/-/media/925394CA61C54492B91930A3B5881377.ashx
- NESCAUM. 2021a. NYSERDA integrated duty cycle test method for certification of wood-fired stoves using cordwood: Measurement of Particulate Matter (PM) and Carbon Monoxide (CO) emissions and heating efficiency. Accessed June 3, 2021. https://www.nescaum.org/documents/nyserda-idc-protocols-for-epa-wood-stove-test-method-research/
- NESCAUM. 2021b. NYSERDA standard operation procedures for thermo scientific 1405-D TEOM for use in a dilution tunnel. Accessed June 3, 2021. https://www.nescaum.org/documents/nyserda-idc-protocols-for-epa-wood-stove-test-method-research/
- Patashnick, H., and G. Rupprecht. 1977. Development of a microbalance suitable for space application. NASA Report # NASA-CR-150334. Accessed July 28, 2020.https://ntrs.nasa.gov/search.jsp?R=19770020232
- Patashnick, H., and E. Rupprecht. 1991. Continuous PM-10 measurements using the tapered element oscillating microbalance. Journal of the Air & Waste Management Association 41 (8):1079–83. doi:10.1080/10473289.1991.10466903.
- Rousta, F., G. Ahmadi, and G. Allen. 2022. Computational modeling of woodstove pollutants in dilution tunnels. Journal of the Air & Waste Management Association this issue.
- Rupprecht, E., M. Meyer, and H. Patashnick. 1992. The tapered element oscillating microbalance as a tool for measuring ambient particulate concentrations in real time. Journal of Aerosol Science 23:635–38. doi:10.1016/0021-8502(92)90492-E.
- Shingler, T., A. Sorooshian, A. Ortega, E. Crosbie, A. Wonaschütz, A. E. Perring, A. Beyersdorf, L. Ziemba, J. L. Jimenez, P. Campuzano-Jost, et al. 2016. Ambient observations of hygroscopic growth factor and f(RH) below 1: Case studies from surface and airborne measurements. Journal of Geophysical Research: Atmospheres 121 (22):13–661.
- Sigsgaard, T., B. Forsberg, I. Annesi-Maesano, A. Blomberg, A. Bølling, C. Boman, J. Bønløkke, M. Brauer, N. Bruce, M. E. Héroux, et al. 2015. Health impacts of anthropogenic biomass burning in the developed world. European Respiratory Journal 46 (6):1577–88. doi:10.1183/13993003.01865-2014.
- Sullivan, B., G. Allawatt, A. Emery, P. Means, J. Kramlich, and J. Posner. 2017. Time-resolved particulate emissions monitoring of cookstove biomass combustion using a tapered element oscillating microbalance. Combustion Science and Technology 189 (6):923–36. doi:10.1080/00102202.2016.1253564.
- Swanson, J., and D. Kittelson. 2009. Factors influencing mass collected during 2007 diesel PM filter sampling. SAE International Journal of Fuels and Lubricants 2 (1):718–29. doi:10.4271/2009-01-1517.
- Thermo scientific series 1105/6100 diesel PM monitor brochure. 2005. Accessed July 21, 2020. https://www.thermo.com.cn/Resources/200802/productPDF_27325.pdf
- Trojanowski, R., T. A. Butcher, G. Wei, and Y. Celebi. 2019. Performance of a biomass boiler in a load profile test. BNL Report # BNL-211372-2019-INRE. Accessed August 5, 2020. https://www.osti.gov/biblio/1501610-performance-biomass-boiler-load-profile-test
- U.S. Environmental Protection Agency. 2010. Summary of public comments and responses for: Methods for measurement of filterable PM10 and PM2.5 and measurement of condensable particulate matter emissions from stationary sources. Docket ID: EPA-HQ-OAR-2008-0348. Accessed April 1, 2021. https://www3.epa.gov/ttnemc01/methods/comments201a202.pdf
- U.S. Environmental Protection Agency. 2015. Standards of performance for new residential wood heaters. 40 CFR Part 60.534(d), 80 FR 13702.March 16, 2015
- U.S. Environmental Protection Agency. 2016. Process for developing improved cordwood test methods for wood heaters discussion paper. Accessed October 15, 2020. https://www.epa.gov/sites/production/files/2016-03/documents/discussion_paper_-_process_for_dev_imp_cwtm_030916.pdf
- U.S. Environmental Protection Agency. 2017. Method 5G, Determination of Particulate Matter Emissions from Wood Heaters. Accessed December 2, 2020. https://www.epa.gov/emc/method-5G3-particulate-matter-wood-heaters-dilution-tunnel
- U.S. Environmental Protection Agency. 2018. 2014 national emissions inventory. Accessed November 6, 2019. https://gispub.epa.gov/neireport/2014/
- U.S. Environmental Protection Agency. 2019. Method 5I, determination of low level particulate matter emissions from stationary sources. Accessed July 21, 2020. https://www.epa.gov/emc/method-5i-determination-low-level-particulate-matter-emissions
- Wallace, L. A., W. R. Ott, K. C. Cheng, T. Zhao, and L. Hildemann. 2021. Method for estimating the volatility of aerosols using the piezobalance: Examples from vaping e-cigarette and marijuana liquids. Atmospheric Environment 253:118379. doi:10.1016/j.atmosenv.2021.118379.
- Weichenthal, S., R. Kulka, E. Lavigne, D. Van Rijswijk, M. Brauer, P. J. Villeneuve, … R. T. Burnett. 2017. Biomass burning as a source of ambient fine particulate air pollution and acute myocardial infarction. Epidemiology 28 (3):329. doi:10.1097/EDE.0000000000000636.