
 ?Mathematical formulae have been encoded as MathML and are displayed in this HTML version using MathJax in order to improve their display. Uncheck the box to turn MathJax off. This feature requires Javascript. Click on a formula to zoom.
ABSTRACT
To meet net-zero emissions and cost targets for power production, recent analysis indicates that photovoltaic (PV) capacity in the United States could exceed 1 TW by 2050 alongside comparable levels of energy storage capacity, mostly from batteries. For comparison, the total U.S. utility-scale power capacity from all energy sources in 2020 was 1.2 TW, of which solar satisfied approximately 3%. With such massive scales of deployment, questions have arisen regarding issues of material supply for manufacturing, end-of-life management of technologies, environmental impacts across the life cycle, and economic costs to both individual consumers and society at large. A set of solutions to address these issues center on the development of a circular economy – shifting from a take-make-waste linear economic model to one that retains the value of materials and products as long as possible, recovering materials at end of life to recirculate back into the economy. With limited global experience, scholars and practitioners have begun to investigate circular economy pathways, focusing on applying novel technologies and analytical methods to fast-growing sectors like renewable energy. This critical review aims to synthesize the growing literature to identify key insights, gaps, and opportunities for research and implementation of a circular economy for two of the leading technologies that enable the transition to a renewable energy economy: solar PV and lithium-ion batteries (LIBs). We apply state-of-the-science systematic literature review procedures to critically analyze over 3,000 publications on the circular economy of solar PV and LIBs, categorizing those that pass a series of objective screens in ways that can illuminate the current state of the art, highlight existing impediments to a circular economy, and recommend future technological and analytical research. We conclude that while neither PV nor LIB industries have reached a circular economy, they are both on a path towards increased circularity. Based on our assessment of the state of current literature and scientific understanding, we recommend research move beyond its prior emphasis on recycling technology development to more comprehensively investigate other CE strategies, more holistically consider economic, environmental and policy aspects of CE strategies, increase leveraging of digital information systems that can support acceleration towards a CE, and to continue to study CE-related aspects of LIB and PV markets.
Introduction
Global society and our planet face many challenges, including climate change, air pollution, finite resources to support growing population and affluence, and equity. These challenges are related in a simple but powerful formulation known as the IPAT equation: environmental impact (I) = population (P) × affluence (A) × technology (T) (Ehrlich and Holdren Citation1971). Without affecting P or A, a reduction in impact requires changes to T. While many candidate technologies could address the above-named challenges, we focus on clean energy technologies, which are typically identified as being among the least-cost approaches to energy sector decarbonization.
Garvin A. Heath

Dwarakanath Ravikumar

Many clean energy technologies exist, each with different benefits and challenges. Photovoltaics (PV) have been found to likely play a prominent future role in the energy transition (DOE Citation2021; IEA Citation2021a) because of their extremely low greenhouse gas (GHG) emissions (e.g., Scott and Heath Garvin Citation2021) and rapidly falling costs (Barbose et al. Citation2021). For instance, shows projected sources of U.S. electricity generation through 2050 under a reference scenario that assumes business-as-usual policies, and under two decarbonization scenarios that achieve net-zero greenhouse gas emissions by 2050 (see supplementary information (SI) Section 2.1 for further explanation of these scenarios). In these scenarios, PV provides the largest share of renewable electricity in each future year and scenario, and the largest share of any technology in the decarbonization scenarios (~45%) (DOE Citation2021).
Figure 1. Electricity generation by technology in 2020, 2035, and 2050 as simulated in the Solar Futures Study (reproduced with permission (DOE Citation2021)). Ref. = reference scenario; Decarb = decarbonization of the electric sector scenario; Decarb + E = electric sector decarbonization plus electrification of other parts of the economy; Bio = biomass, Geo = geothermal, Hydro = hydropower (including pumped hydro-storage), CT = combustion turbine, CSP = concentrating solar power. See SI Section S2.1 for further explanation).
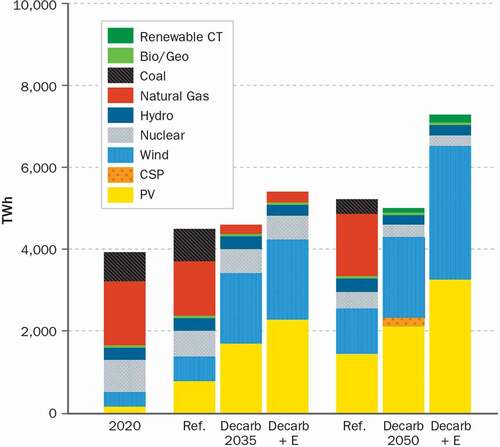
To reach these levels of solar generation, installed PV capacity would need to grow from 80 GW in 2020 up to 1.6 TW in 2050 (DOE Citation2021). However, PV only generates electricity when the sun is shining; its capacity factor is about 25%, meaning a PV power plant generates electricity about a quarter of its rated capacity over a typical year (NREL Citation2022a). Energy storage solutions are expected to play a prominent role in expanding the share of electricity demand that can be met by PV-generated electricity. In addition, energy storage provides firm capacity, can mitigate solar forecast errors, and it aligns well with the sharp demand peaks that can be induced by widespread solar deployment, among other benefits (NREL Citation2022b). Indeed, energy storage enables greater cost-effective deployment of PV, as was concluded in the 2021 DOE Solar Futures Study (DOE Citation2021).
Lithium-ion batteries (LIBs) are a leading technology for providing electricity storage and are available on the market today at both residential and utility scales (Fluence Citation2022; Tesla Citation2022). When carbon-free generation sources are used to charge the batteries in electric vehicles (EV), a pathway emerges to decarbonize transportation, which is currently the largest GHG-emitting sector in the United States (EPA Citation2021). This pathway is most mature for the light-duty vehicle fleet, with LIBs as the dominant technology, but is also proposed for medium- and heavy-duty vehicles (Mai et al. Citation2018), at least in the near term (Castelvecchi Citation2021; ORNL/NREL Citation2019). These two markets for LIBs – transportation and grid (electricity) storage – are both projected to grow exponentially as prices continue to decrease, although the EV market is many times greater than the “stationary” market (named in contrast to the mobility of EVs) that supports the electric grid (). The farther into the future, the more uncertain are projections about the role of different battery chemistries, but it is clear that LIBs are critical in at least the near term.
Figure 2. Time series illustrating historical and forecasted global prices (dotted line, left vertical axis) and cumulative demand (shaded area, right vertical axis) for LIBs in stationary and transportation (EV) markets from 2010 to 2035. (BloombergNEF Citation2021). According to BloombergNEF, in the past decade the unit price for LIBs has dropped to less than 12% of what it was in 2010 and is expected to further decrease to about 4% of the 2010 price by 2035. As the price continues to decrease, LIB demand is projected to increase 44,000-fold from 2010 to 2035.
One challenge created by the growth of PV and LIBs is a concomitant increase in demand for materials to support the manufacture of these technologies. By far the largest mass fraction in a PV module is from bulk materials like glass, aluminum (for the frame), and silicon (for crystalline silicon (c-Si)-based modules, the dominant PV technology) (IEA PVPS/IRENA Citation2016). (See SI Section S2.2 for schematics of the construction of a typical c-Si PV module and LIB and see the Methods section for a discussion of different PV module technologies). Demand for these bulk materials is not expected to cause market disruption or supply shortages (Calvo and Valero Citation2021; DOE Citation2021). However, c-Si modules currently use silver, and although in small and decreasing quantities per module, PV’s silver demand as a share of global production could increase to nearly 40% by 2050 under the Solar Future Study’s global decarbonization scenario (DOE Citation2021). As another example, for cadmium-telluride (CdTe) thin film PV modules (which has the second-greatest global market share), the European Commission’s Joint Research Centre has found that projected global PV demand for tellurium will reach or exceed 2018 global supply by 2030 and beyond (). In addition, several other materials in PV modules are considered critical by different governments, such as aluminum and tin (Department of the Interior: Geological Survey Citation2022), and silicon metal (European Commission Citation2020).
Figure 3. Projected annual global material demand for PV manufacturing in 2030 and 2050 relative to 2018 global supply, data extracted from (Carrara et al. Citation2020). Results for the low and medium scenarios from the International Energy Agency and the high scenario from the Institute for Sustainable Futures of the University of Technology Sydney are shown, where medium is the baseline scenario (see SI Section S2.1 for more information). Note that Te, Si, and Glass use the y-axis on the left side, whereas all others refer to the y-axis scale on the right side. The levels of projected demand for c-Si module bulk materials, Si and Ag, are below 2018 global supply. The projected Cd demand for CdTe modules also remains under 2018 availability. In contrast, the projected demand for Te in 2030 is over 4 times, and in 2050 over 6 times the 2018 supply.
Material constraints are projected to be even more acute for LIBs. For instance, LIB demand for cobalt is expected to be approximately 50% greater than all current supply by 2025 () (Campagnol et al. Citation2018). Similarly, projected LIB growth by 2025 is expected to drive the demand for nickel to levels greater than current supply, even including projected supply increases (Campagnol et al. Citation2018).
Figure 4. Comparison of projected global demand and current supply for cobalt by sector (duplicated with permission from Campagnol et al. Citation2018). Demand for cobalt from the battery industry is forecasted to dominate cobalt demand by 2025. Furthermore, demand from all sectors by 2025 is projected to be 201 kt, more than double the supply available in 2018 (~95 kt). Demand versus supply projections like this have motivated research into how to recover metals from end-of-life technologies to dampen demand for virgin materials. (p.a. = per annum).
One way to mitigate material supply challenges is to recover materials from products at the end of their lifetime through recycling. Considerable research has focused on investigating the potential of this strategy and developing technological solutions, as described in this article. However, recycling is not the only way to address material supply challenges even if it is the most obvious end-of-pipe solution (and conforms best to linear economy thinking – see next sentence). A broader conception of such solutions is posited as the circular economy (CE), which is named in contrast to the current global economic model that treats materials in a linear take-make-waste manner. While many definitions of the CE exist – 114 according to (Kirchherr, Reike, and Hekkert Citation2017) – the World Economic Forum (WEF Citation2014) defined CE as follows..
A circular economy is an industrial system that is restorative or regenerative by intention and design. It replaces the end-of-life concept with restoration, shifts towards the use of renewable energy, eliminates the use of toxic chemicals, which impair reuse and return to the biosphere, and aims for the elimination of waste through the superior design of materials, products, systems and business models.
As will be elaborated in this article, the CE literature has generally coalesced around the classification of 10 CE strategies, of which recycling is but one. Examples of others include rethink, which suggests we design products with circularity in mind (e.g., using less materials), or reuse, which extends a product's lifetime by finding another owner after the product stops fulfilling the needs of the previous owner. However, there remains some ambiguity and distinctions in using these terms, which introduces uncertainty and variability to our review and is discussed in the Methods section. One purpose of this critical review is to reconcile and resolve such ambiguities.
CE is not a new concept, evolving from and incorporating multiple intellectual approaches such as design for environment, pollution prevention, industrial ecology, business and economic theory, and more (Geissdoerfer et al. Citation2017; Merli, Preziosi, and Acampora Citation2018; Saavedra et al. Citation2018). Several aspects of CE are motivated by market economics and are thus longstanding business practices. For example, certain manufacturing cost minimization actions or product performance improvements have the co-benefit of reducing the material intensity of a product per unit of the product's output. In the context of PV, examples include reduction in silver content (VDMA Citation2021), which is done to minimize cost of material inputs, and improvement in module efficiency for converting sunlight to electrical energy (NREL Citation2022c), which provides better product performance for customers. These actions are primarily motivated to reduce cost, enhance product competitiveness, or increase market share.
CE success stories exist in related industries. For instance, lead-acid batteries have one of the highest recycling rates of any product (99% in the United States) because it is required by regulation, landfills are not allowed to accept them, and consumers do not want a hazardous product in their homes (EPA Citation1985; SmithBucklin Statistics Group Citation2019). The automotive industry has a robust secondary market for used vehicles; the industry also reuses parts from non-functional vehicles, remanufactures engines, regularly repairs components, and recycles around 95% (in the United States) of vehicles at end of life (EOL) (Aguilar Esteva et al. Citation2021). It is estimated that 75% of aluminum ever produced is still in active use (Kvande Citation2014). In all of these cases, a combination of economics and human behavior, sometimes with and sometimes without policy, have led to widespread producer or consumer adoption of CE strategies once technologies and systems were available. A theme we will return to is how technology development alone does not ensure that industries and consumers (including businesses, governments, and individuals) move toward a circular economy; instead, multiple factors influence adoption, which is the necessary condition to achieve a CE (please refer below to sections “Research beyond technology development for LIB” and “Research beyond technology development for PV”).
There is an increasing call to embrace a more circular global economy, especially from non-governmental organizations (e.g., Ellen MacArthur Foundation (Ellen MacArthur Foundation Citation2022a), Platform for Accelerating the CE (PACE Citation2022)). Some countries have established policies, the most well-known being the European Union's CE Action Plan (European Commission Citation2015, Citation2021) and China's Law for the Promotion of the Circular Economy (Standing Committee of the National Peoples Congress Citation2008), though most countries take a non-regulatory approach, such as supporting research and development (REMADE Citation2022; U.S. Department of Energy Citation2022). It is important to note that despite the intuitive attractiveness of increasing material circularity, this should not be a goal in and of itself. A CE is proposed as a strategy to advance other societal goals, especially improvement to environmental quality; long-term security, reliability, and resilience of industrial supply chains; and improved standards of living. Many benefits are claimed by connecting the CE to different industries, fields of study, and global challenges. These include increasing manufacturer competitiveness; boosting economic growth; creating jobs; addressing United Nations Sustainable Development Goals, particularly Goal 12: Sustainable production and consumption; securing material supplies; managing waste; improving resource efficiency; retaining value of materials; using less materials; reducing GHG, air pollutant, and water emissions; and addressing environmental justice (McKinsey & Company Citation2017; EPA Citation2020; European Parliament Citation2021, Ellen MacArthur Foundation Citation2022b). However, there are cases where higher material circularity comes with trade-offs, such as higher cost or worse environmental impact (Dias et al. Citation2021; Li and An Citation2019; Tammaro et al. Citation2015). Thus, it is necessary to evaluate CE strategies using a holistic systems perspective to assess achievement of ultimate objectives, identify trade-offs in advance to inform decision-making, and align key factors influencing adoption.
It is fair to say that CE is not yet mature in the PV and LIB industries. Yet, as will be shown in this review, there has been a growing interest in the research community to investigate potential circular economy strategies for these two technologies. The aim of this critical review is to establish the state of the science for research related to the CE as applied to PV and LIBs, and in doing so, illuminate knowledge gaps as well as opportunities for future research to better develop a CE for these two technologies.
Though many reviews of specific or small sets of CE strategies for PV and LIBs exist – 112 and 21, respectively, were identified through this review – this work is novel for several reasons. First, our review considers all 10 CE strategies, whereas most consider only 1, and none consider more than 5. (See SI Section S2.3 for elaboration of the comparison of our review to others.) Second, few prior reviews can be classified as systematic (see the Methods section for description), and none that examine more than 1 CE strategy follow the consensus PRISMA (Preferred Reporting Items for Systematic Reviews and Meta-Analyses) guidelines, endorsed by the Cochrane Collaboration, the World Association of Medical Editors, the Council of Science Editors, and 187 journals (PRISMA Citation2021b). Third, of the few reviews that both consider multiple CE strategies and are systematic, ours is the only review that simultaneously:
Analyzes reviewed literature quantitatively.
Considers CE all three major life cycle phases of the technologies (manufacture, use, and end of life).
Transparently reports results of literature screening.
Considers not just material but also digital CE pathways.
Makes research and development recommendations based on results and synthesis of the review.
Furthermore, we evaluate a greater number of publications than past studies: Our systematic review procedures identified for screening 1,103 journal publications and 251 government reports for LIBs, and 1,349 journal publications and 408 government reports for PV. We consider this review a comprehensive evaluation of the state of the science; whereas other authors have contributed valuable work with a narrower scope and perhaps greater detail on specific CE topics – publications of whom are cited extensively throughout this review – we take stock of the entire subject's literature. We hope that the breadth of scope, methodological rigor, scale of reviewed literature, and depth of analysis in this review can motivate and guide more targeted and high-impact future research.
Methods
This review is focused on the CE of LIBs and PV, and the methods to collect, screen, and analyze literature centered around this topic. We followed standard systematic review protocols outlined by the Cochrane Handbook and reported these methods by following PRISMA guidelines; this ensures that the process by which we performed this review is as transparent and reproducible as possible (PRISMA Citation2021a; The Cochrane Collaboration Citation2022). In the next sections we describe the CE strategies and technologies in focus of our review as well as our review and analysis procedures.
Scope of CE strategies
CE literature generally agrees on the classification of 10 CE strategies, labelled R0 to R9, to signify their stage of the life cycle: R0 = Refuse, R1 = Rethink, R2 = Reduce, R3 = Reuse, R4 = Repair, R5 = Refurbish, R6 = Remanufacture, R7 = Repurpose, R8 = Recycle, and R9 = Recover (energy). It is also generally advised to use lower-numbered R strategies first and only after exhausting those to proceed to higher-numbered R strategies (Potting et al. Citation2017, Ellen MacArthur Foundation Citation2022c). For instance, it is preferred to reduce the amount of materials used in manufacturing products then, if possible, to reuse them after a first owner no longer needs the product, and then repair products, all before recycling them. General descriptions of these terms applied broadly are shown in . Application of these definitions for both LIBs and PV are detailed in sections “Review of Available CE Pathways for LIBs from a Systems Perspective” and “Review of Available CE Pathways for PV from a Systems Perspective.” Definitions of the lower-numbered CE strategies (R0–R2) can vary, for instance by whether it is from the consumer or producer (manufacturer) perspective. Publications such as (Morseletto Citation2020; Potting et al. Citation2017; Reike, Vermeulen, and Witjes Citation2018) include consumer-based definitions for these CE strategies, so we included those definitions here for completeness. Individuals are often more familiar with the consumer perspective, which is why we decided to include those definitions; however, the literature that we collected was focused on the manufacturer's perspective and thus is the target of this review. These terms and their synonyms that were used in the literature search are detailed in SI sections S3.1.
Table 1. R strategy description with examples from a manufacturer’s and consumer’s (for R0–R2) perspective (adapted from Potting et al. Citation2017 and supplemented by Morseletto Citation2020; Reike, Vermeulen, and Witjes Citation2018)
Table 2. Inclusion criteria for each screen of the systematic literature review
Although these definitions are generally agreed upon, there are discrepancies in how authors use them when applied to LIBs and PV. CE strategies such as refurbish, repair, and remanufacture are often used synonymously, along with additional terms such as recondition or renovation (Ciobotaru, Benga, and Văireanu Citation2021; Liu and Gong Citation2014). Specifically for LIBs, the term reuse is often used instead of repurpose when defining the process of using decommissioned electric vehicle batteries in stationary energy storage applications (Cusenza et al. Citation2019a). Similarly for PV, the terms reuse and recover are used instead of recycle to define the processing of silicon from kerf (silicon ingot cutting losses). Despite authors using conflicting terms, we classified each publication according to the definitions in . For instance, what the literature calls LIB “direct recycling” we feel is properly characterized as remanufacturing (see Section “LIB CE in the EOL phase – Material Flows).
While all 10 of the above CE strategies were considered in our review, we did not focus on rethink and reduce strategies that are not primarily intended to improve circularity. As discussed above, this means that the large body of literature, for instance, on how to improve round-trip efficiency for LIBs or module efficiency for PV, as well as dematerialization strategies intended primarily to reduce cost or improve supply security, such as reducing cobalt usage in LIBs or silver in c-Si PV modules, were not of interest in this review. Given that our review captured over 3,000 publications, it was beyond our ability to include these topics. That does not mean that these strategies are unimportant to achieving a CE, even in cases when improving circularity was not their primary purpose. In fact, identifying CE strategies that align with market economics and other important goals is critical to the successful uptake of CE.
We offer a further clarification of the scope of our review in the form of a novel distinction between intrinsic and extrinsic circularity. Intrinsic circularity pertains to improving the circularity of the product itself and is the focus of this review. Extrinsic circularity is improving the circularity of the society or economy in which the product is used. For instance, as the Ellen MacArthur Foundation (a thought leader for CE) frames it: “[a CE] is underpinned by a transition to renewable energy” (Ellen MacArthur Foundation Citation2022b). Accordingly, anything that increases deployment of renewable energy technologies (e.g., PV), like LIBs, would support a more circular economy. This would include strategies such as ways to decrease the price of renewables, improve their performance, or otherwise increase their deployment. While inherently supporting increased renewable energy utilization and thus economy-wide circularity outcomes, extrinsic circularity strategies are not a focus of this review.
Digital platforms and information systems are key enablers to the implementation of a CE, serving as tools to facilitate stakeholders making and communicating decisions across the supply chain. To our awareness, this is the first time they are being considered within a review of CE for PV and LIB technologies. Primary pathways include the use of machine learning, artificial intelligence, or automation in the design and use of a product or process (e.g., facility optimization, selection of materials, automation of manufacturing), as well as product labelling, real-time monitoring, alternative business models (e.g., product-service systems (PSS)), computer-based tools to design a product to enable circularity, and other technology-specific pathways. Although many of these pathways are still relatively new, there is significant potential for deployment and discussion among both industry leaders and CE scholars (Chauhan, Parida, and Dhir Citation2022).
Scope of technologies
Although there exist many commercialized LIB cathode chemistries, this review focuses on lithium ferrophosphates (LFP), lithium manganese oxides (LMO), lithium nickel cobalt aluminum oxides (NCA), and lithium nickel manganese cobalt oxides (NMC). These chemistries currently constitute the majority of the transportation and stationary energy storage markets, as seen in , and are projected to remain leaders.
Figure 5. Global market projections of LIBs in the transportation and stationary energy storage markets categorized by cathode chemistry (IEA Citation2021c; Wood Mackenzie Citation2021). The largest fraction of demand is for NMC, driven by the transportation market, with projected 2040 demand being more than double the second highest chemistry, LFP. Furthermore, the demand for LIBs by the transportation sector in 2040 dwarfs the demand for stationary LIBs. The category “other” includes LMO and other chemistries that are still in early research and development phases. Sources: IEA (Citation2021), [The Role of Critical Minerals in Clean Energy Transitions], All rights reserved. Wood Mackenzie (Citation2021), [Battery Raw Materials Service – 2021 update to 2040: Demand – H1 2021].
![Figure 5. Global market projections of LIBs in the transportation and stationary energy storage markets categorized by cathode chemistry (IEA Citation2021c; Wood Mackenzie Citation2021). The largest fraction of demand is for NMC, driven by the transportation market, with projected 2040 demand being more than double the second highest chemistry, LFP. Furthermore, the demand for LIBs by the transportation sector in 2040 dwarfs the demand for stationary LIBs. The category “other” includes LMO and other chemistries that are still in early research and development phases. Sources: IEA (Citation2021), [The Role of Critical Minerals in Clean Energy Transitions], All rights reserved. Wood Mackenzie (Citation2021), [Battery Raw Materials Service – 2021 update to 2040: Demand – H1 2021].](/cms/asset/7e0e1e30-9a1b-4e6d-9be0-73c0e688ef0a/uawm_a_2068878_f0005_c.jpg)
The scope of PV technologies in this review are c-Si and CdTe. These two technologies were chosen because together they make up more than 98% of the current global module market – c-Si at 95%, and CdTe at approximately 3%, with 2% consisting of other thin-film technologies that are not within the scope of this review () (Miller, Peters, and Zaveri Citation2020; Mints Citation2018). Note that, in part due to the largest U.S. PV manufacturer being a CdTe manufacturer, CdTe is about 16% of the U.S. market with the remainder c-Si (NREL Citation2021), as of 2020.
Figure 6. Projection of global PV capacity (GWp) and market share (%) for c-Si and thin-film technologies, data extracted from (SPV Market Research, 2021) (Mints Citation2018). CdTe makes up the largest segment of thin-film technologies, with the U.S. CdTe manufacturer First Solar alone manufacturing 6 GW, or 3% of the PV market in 2020 (Miller, Peters, and Zaveri Citation2020). Together, c-Si and CdTe represent almost 100% of the annual capacity additions today through 2025. (Note: Results from SPV’s “conservative” scenario are shown).
Moreover, a PV system includes the module and the balance of system components that are required to generate and transmit alternating current (e.g., inverter, electrical cables) and provide mechanical support (e.g., mounting structure). This article focuses on PV modules because they account for the largest mass component and the largest single hardware cost of the PV system, and they are the most challenging for implementing circular economy strategies. Therefore, use of “PV” in the text can be understood to mean PV modules, with exceptions noted by explicit mention of other components or the system as a whole.
For readers not familiar with LIBs or PV modules, schematic diagrams for each are included in the SI section S2.2 to better understand their design, constituent components, and materials which will be discussed to throughout this paper.
Collection and screening of publications
The process of collecting and screening publications for this study followed state-of-the-science systematic review procedures, as described in the Cochrane Handbook, and reporting of methods and results follows the PRISMA guidelines (The Cochrane Collaboration Citation2022). These methods were chosen due to their ability to collect maximal information with minimal bias while utilizing a standardized reporting procedure to allow for consistent intercomparison and to ensure transparency, completeness, and potential for reproducibility (Mallett et al. Citation2012). Utilizing standardized reporting procedures (PRISMA) allows better contextualization of our research as we identify the common methods, gaps, and potentials for growth in circular economy literature (Santos and D. Silva Citation2013).
Our process involved multiple database searches and four screening phases (). We performed three searches in Scopus for LIB publications in June, September, and December 2021, and two searches for PV publications in October and December 2021. Additionally, we searched in the Office of Scientific and Technical Information (OSTI) database – a repository of U.S. Department of Energy-funded publications consisting mostly of technical reports – in September and November for LIBs and PV, respectively. Because of the predominance of recycling in CE literature obtained from Scopus for both technologies, these additional OSTI searches focused on other CE strategies by excluding recycling terms. The final collection of publications obtained from these searches, referred to as “universe,” totaled 3,111 inclusive of both LIB and PV.
Figure 7. Process by which the systematic literature review was performed, following Preferred Reporting Items for Systematic Reviews and Meta-Analyses (PRISMA) guidelines. Specific steps used certain database and computer programs (see color-coded legend). The total number of publications obtained from the searches is represented by n = universe. The number of publications included in each screening process is represented by nin_x, where x represents the screen iteration (see left side labels). The number of publications excluded by each step is represented by nex_x. The values of nin_x for each screen per technology can be seen in . The criteria for inclusion at each step can be found in
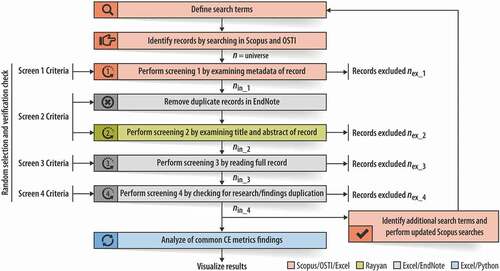
Figure 8. Number of publications of the universe and those that passed each screen for LIBs and PV. “Universe” refers to all publications identified based on the search terms used in SCOPUS and OSTI cumulatively from all search rounds, and equals 1,354 for LIBs and 1,757 for PV.
The terms used in the search query represented CE, CE strategies (R0–R9, except the OSTI search which excluded R8), and either LIBs or PV, as well as synonyms that are commonly found in the literature for each. Details about each search round, the determination of additional search terms, key differences between Scopus and OSTI searches, and the final search query are detailed in the SI section S3.1. Note that publications included in this review were not limited by geography, though we did require the publication be written in English.
Once the universe was established, we screened the publications. Publications that passed a given screen were moved on to the next; those that did not pass a screen were excluded from the rest of the study. The criteria for inclusion at each step for both LIBs and PV is shown in . More details and examples about each screen's inclusion criteria can be found in the SI section S3.2.
Screen 3 was the most intensive and thus we emphasize and elaborate what is shown in here. This screen required review of each publication in its entirety to decide whether to include the publication based on the following criteria:
The research must be relevant to CE. This is an extension of Screen 2 and was included since some publications’ abstracts suggested potential relevance to CE but proved to be irrelevant upon a full-text review.
The CE strategy must be applied to or start with a product or process that is specific to the LIB or PV industry. For example, publications solely discussing material processing improvements for lithium mining or how to recover lithium from wastewater generated in the LIB recycling process were not included as they could apply to other industries. A CE strategy must be applied to the LIB or PV module or the materials used to create it once they have entered the LIB or PV manufacturing process or in the design phase. (See the SI section S3.2.3 for elaboration of examples of this criterion).
The research cannot focus solely on LIBs or PV cells built into consumer products. LIBs must be in electric vehicle or stationary energy storage applications; PV cells must be at the residential, commercial, or utility scale.
The research cannot soley study LIB cathode chemistry or PV technology outside of the those named in . This criterion allowed inclusion of publications that did not report which LIB cathode chemistry or PV technology was studied. Our judgement was that most such publications indeed studied the chemistries and technologies of interest, and in any case, only affected a very small number of publications in most instances.
The research cannot solely focus on open-loop recycling wherein materials recovered from a non-LIB or non-PV technology are used in the manufacture of a LIB or PV, respectively. Although this is still relevant to the global circular economy, this type of recycling is not as relevant to the CE of each technology considered in this review.
The total number of publications from the searches that passed each screen is shown in . In addition, we classified each publication as either an original research publication or a review. Analysis of original research publications were the focus of this critical review, but prior published reviews helped to also inform our understanding of the state of the science. Out of 444 publications passing all screens for CE of LIB, 332 are original research publications and 112 are reviews. Out of 181 publications passing all screens for CE of PV, 160 are original research publications and 21 are reviews.
Literature classification
From the set of publications passing all screens, we classified the research conducted in each publication along 70 different dimensions. Our classifications establish the prevalence of various attributes which inform the state of the science in the field of CE research on LIBs and PV. First, we categorized the publications as “yes” or “no” for the following eight literature classifiers: Sustainability and Circular Economy Indicators, CE Strategies, Life Cycle Phase, Scope of CE Solution(s), Scale of Operations, Study Types, Publication Type, Recycling Type, Cathode Chemistry (LIB), LIB component, LIB Cell Component, LIB Application, PV Technologies and Materials Recovered from Recycling (PV only). Publications may have received zero counts for Indicators but required at least one count for the other classifiers. More details and examples regarding literature classification can be found in and SI section S3.3.
Table 3. Classifiers and sub-classifiers of LIB and PV publications
Note that because many publications were typically found for each classifier and each technology, in substantiating our findings from the literature as a whole, we have only cited a limited number. The reader can implicitly understand our citations as examples; it would be beyond our capacity in this review to list them all substantiating publications for each point and would have risked making the paper unreadable.
Literature analysis
The counts of publications within each classifier and sub-classifier were analyzed to establish prevalence of research attention to the attributes of focus. It was of interest to distinguish publications that only researched one sub-classifier – referred to as “exclusive” – from publications that researched multiple sub-classifiers – referred to as “multiple”. Through this further differentiation we could identify the prevalence of research that was more integrative in nature (i.e., including multiple sub-classifiers).
Classification of LIB and PV literature was performed independently by two reviewers: one focusing exclusively on LIBs and the other on PV. To quantify and minimize potential errors in the classification, we performed verification checks, in which each reviewer classified a random sample of literature from the other’s technology. A total of 8% of the literature that passed all screens was verified (25 for each LIB and PV) with a combined error rate of 1.4%. This error rate was calculated through formula (1).
In addition, we identified two sets of publications that were not recognized as duplicates, representing an error rate of 0.2% (out of the total 929 publications passing Screen 2 when the duplication check was performed). These two publications passed all screens, but the count inflation by maximum of two for certain classifiers did not affect any finding or conclusion. More information can be found in the supplementary information, Section 3.3.2.
One informative way to visually display the prevalence of publications researching specific combinations of sub-classifiers (as well as those with exclusive focus) is through what is known as an upset plot, for instance Figure S4 in the SI. (More information on the python code used for creation of the upset plots can be found in the SI, Section S3.4.2). Other ways to visually display our analysis of the literature are included in the results sections for each technology (LIB and PV) below, with additional display items included in the SI Section S4.
State of the Science: CE for LIBs
Review of available CE pathways for LIBs from a systems perspective
Based on the literature encountered in this review, we designed a systems diagram that comprehensively depicts the CE for LIBs (). The diagram tracks CE strategies across LIB life cycle phases (manufacturing, use, and end of life) by showing possible information (blue arrows) and material flows (black arrows) across the LIB lifespan. For these flows, we show the allied industries that can source materials from or supply recovered materials to the LIB industry, the decision enablers that affect CE actions, and relevant stakeholders (panel on the right in ). We also account for the potential opportunity to integrate renewable electricity to decarbonize the energy used in the different life cycle phases (orange circles in ) and the potential for the different life cycle phases to impact ecological services (green circles in ).
Figure 9. A systems diagram representing the CE strategies for the manufacturing (M), installation and use (U), and the collection and recycling (EOL) phases of the life cycle of LIB systems, which are depicted as black circles. Physical material flows, shown on the right side of the black circles with black lines, are the CE pathways traditionally depicted in systems diagrams; we have added digital platforms and information system (Info Sys) pathways in blue which can enable or enhance the material ones. Because a transition to renewable energy is a goal of the CE, we mark the life cycle phases that could incorporate renewable energy with Orange circles. The stakeholders include various actors who participate in and contribute towards the CE of LIB. The decision enablers include the different policies that incentivize the CE, and analytical tools, which help quantify the economic and environmental impacts of the CE. Allied industries manufacture non-LIB products which can either utilize secondary materials recovered from a CE for LIBs or supply secondary materials to be utilized in the manufacture of LIBs. (EV: Electric Vehicle, S: Stationary, PSS: product-service system, SOH: State of Health).
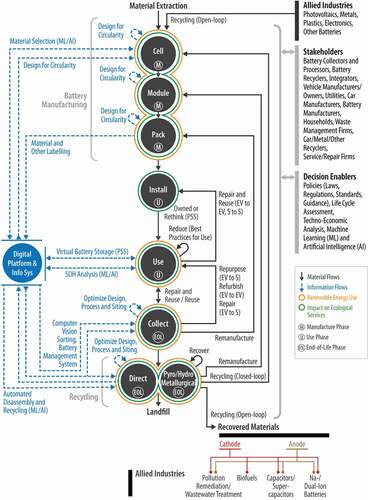
There are significant similarities between the stakeholders and decision enablers for the CE for LIB and PV, as well as potential impacts on ecological services and renewable energy use (). As a result, we combine the discussion of these facets for LIB and PV systems in sections titled “Stakeholders in the CE for LIB and PV,” “Decision enablers for the CE for LIB and PV,” “Renewable energy use for PV and LIB CE” and “Impact on ecological services in the PV and LIB CE”, which appear in the PV results section below.
By convention, we categorize the CE strategies in this section based on the life cycle stages in which they are applied. Each CE strategy either recovers or supplies material or energy in its respective life cycle stage.
LIB CE in the manufacturing phase – material flows
Three CE strategies – closed-loop recycling, open-loop recycling, and remanufacturing – bring materials from the EOL phase back into the manufacturing phase of the LIB. Recycling approaches are described in the “LIB CE in the EOL phase – Material flows” section below.
In closed-loop recycling, materials recovered from LIBs at EOL are reused in the manufacture of a new LIB (Gaines Citation2018; Harper et al. Citation2019). For example, the cathode is recovered from a spent LIB, relithiated, and reused in a new LIB (Sloop et al. Citation2020).
Open-loop recycling includes two possible scenarios:
Materials recovered from non-LIB products are used in the manufacturing of LIB. Examples include LIB manufacturing using
Silicon recovered from PV manufacturing (Wagner et al. Citation2019)
Soot recovered from merchant ships (Lee et al. Citation2018b).
Materials recovered from LIB are used in the manufacturing of non-LIB products. Examples include using material recovered from LIBs to produce
Lubricants (Parikh et al. Citation2019)
Sorbents in remediation of contaminated air or water (Anh Nguyen and Oh Citation2021; Cao et al. Citation2018)
Metal organic frameworks (Cognet et al. Citation2020)
Graphene nanosheets (Zhao et al. Citation2018)
Catalysts (Shen et al. Citation2019, Chen, Wang et al. Citation2021).
In remanufacturing, individual components of the collected, spent LIBs are recovered, checked for quality standards, and reused in the manufacture of a new LIB. For example, in practice, the cathode (Song, Hu, Chen, et al. Citation2017; Gangaja, Nair, and Santhanagopalan Citation2021; Sloop et al. Citation2019), the anode foil, and the anode (Cao et al. Citation2021) from spent LIBs have been recovered and reused in new LIBs.
LIB CE in the use phase – material flows
Various CE strategies can be employed in the use phase of LIBs, helping to preserve LIB functionality, extend product lifetime, and avoid recycling steps that degrade the product into constituent materials. There are strategies that maintain the product within the use phase: repair (R4) and direct reuse (R3) of LIBs as well as rethink (R1) (through alternative ownership models like product-service systems) and reduce (R2) (through application of operational best practices). There are also use-phase CE strategies that receive LIBs from the EOL phase: repurpose (R7) and refurbish (R5) as well as when LIBs are collected at EOL for repair (R4) and then reused (R3).
Upon installation, an LIB can be operated under direct ownership or with PSS, which we classify as a rethink CE strategy (). In PSS, the entity owning the LIB and the entity utilizing the energy storage service of the LIB are separate (Wrålsen et al. Citation2021). PSS for LIBs include business models such as battery swapping and leasing (Li and Ouyang Citation2011; Zhang and Rao Citation2016) and virtual battery systems (Renewable Energy World Citation2020), which enable multiple services from a single unit.
During use, the durability of an LIB can be increased when the user follows recommended best practices for operation, which include minimizing exposure to high and low temperatures, minimizing times spent at 0 and 100% charge, following manufacturing calibration instructions, minimizing usage in high moisture conditions, and minimizing fast charging (Woody et al. Citation2020). The increased durability corresponds to the CE strategy of reduce (R2) because the service delivered per unit of raw material used in manufacturing (e.g., energy storage per unit mass of cobalt) increases when the functional life of the LIB increases. Digital monitoring of performance, operational conditions, and health enables this reduce strategy.
LIB CE in the EOL phase – material flows
In the EOL phase, CE strategies that can be applied include refurbish (R5), remanufacture (R6), repurpose (R7), open-loop and closed-loop recycling (R8), and recover (R9). After EOL LIBs are collected, they can be evaluated for their potential for refurbishing, repurposing, and remanufacturing. In refurbishing, the LIB is collected, restored to its original working condition, and then used in its original application (Green Car Reports Citation2018; Spiers New Technologies Citation2021). Repurposing is when the energy storage capability of the LIB is restored through a series of steps at the end of life so that the LIB can be reused in an alternate application. For example, an EV LIB can be repurposed for use in a stationary energy storage application for such purposes as load levelling, transmission support, and grid frequency regulation (Ahmadi et al. Citation2015; Bräuer Citation2016; Jiao and Evans Citation2016, White, White, Thompson, and Swan Citation2020). The series of steps involved in repurposing include collection at specific locations; presorting based on chemistry, design, and damage; disassembly and testing for degradation (Liao et al. Citation2017; Rallo et al. Citation2020); performance assessment based on charge and discharge measurements (Liao et al. Citation2017; Neubauer, Wood, and Pesaran Citation2015; Rallo et al. Citation2020); and classification for suitable second life applications leading to reassembly, and certification (Bräuer Citation2016).
If evaluated EOL LIBs do not meet qualifications for refurbishing, repurposing, or remanufacturing, the next-preferred CE strategy would be recycling.
Widely used LIB recycling methods (both in open- and closed-loop applications) are hydrometallurgical, pyrometallurgical, and direct recycling (Chen et al. Citation2019). With the exception of pyrometallurgical processing for certain recyclers (like Umicore), LIB recycling requires a common first step of mechanical preprocessing (e.g., sieving and crushing). In this first step, the LIB is crushed and reduced in size into a mixture consisting of a coarse fraction (steel casing, plastics, metal foils) and a fine product called black mass (Wang, Gaustad, and Babbitt Citation2016), which consists of electrode materials (metal oxides) and carbon (Harper et al. Citation2019; Lv et al. Citation2018). Variations in properties such as ferromagnetism, density, and hydrophobicity (Wang, Gaustad, and Babbitt Citation2016) are leveraged to separate the black mass from the coarse fraction (Harper et al. Citation2019; Lv et al. Citation2018). The recycling methods described in the literature use the following processes:
Hydrometallurgical recycling uses low-temperature chemical processes such as leaching, precipitation, ion-exchange, solvent extraction, and electrolysis to separate, recover and purify the metals from the black mass (Brückner, Frank, and Elwert Citation2020; Harper et al. Citation2019; Yang et al. Citation2021).
Pyrometallurgical recycling uses furnace- or smelter-based high-temperature processes such as incineration, calcination, pyrolysis, roasting, and smelting to separate and recover the metals in EOL LIBs (Makuza et al. Citation2021). As noted above, pre-processing is optional for certain recyclers using pyrometallurgical methods i.e., when the whole LIB is fed into a high-temperature furnace (Gaines Citation2019). In pyrometallurgical methods, the electrolyte and the organic materials including the separator and the plastics are combusted, providing energy for the process (Chen et al. Citation2019). Co, Ni, Cu and Fe are reduced and recovered in a residue called matte (Chen et al. Citation2019; Samarukha Citation2020). Al and Li are typically oxidized, separated as slag, and subsequently recovered through additional processing (e.g., though chlorination roasting (Dang et al. Citation2018)) (Lv et al. Citation2018; Samarukha Citation2020). Pyrometallurgical recycling requires subsequent hydrometallurgical processes to further purify the metals present in the matte (Samarukha Citation2020; Velázquez et al. Citation2019).
Direct recycling focuses on the recovery and enhancement of the cathode active materials (CAM), which are subsequently used in the manufacturing of LIB cathodes (Ji et al. Citation2021). In contrast to hydrometallurgical methods, which dissolve the CAM into a solution, direct recycling maintains the morphology of the cathode crystals (Gaines Citation2018). Because of this, we have classified direct recycling as remanufacturing (R6) since the materials in the EOL LIB are not reduced to more elemental form after destroying the component, like in recycling. The key processes in direct recycling are: obtaining the black mass, separating CAM from other materials (e.g., Polyvinylidene fluoride (PVDF), graphite) through thermal and floatation processes, overcoming the PVDF binder to delaminate the CAM from the cathode, and regeneration of the degraded CAM through relithiation (e.g., solid-state relithiation, hydrothermal relithiation) (Ji et al. Citation2021). Unlike hydrometallurgical and pyrometallurgical processes, regenerated CAM from direct recycling can be used immediately in remanufacturing new LIB without further purification steps.
Recover includes the recovery of energy from the combustion of materials, such as the electrolyte and the organic materials including the separator and the plastics (Chen et al. Citation2019), and the remnant charge in the LIB prior to recycling (Harper et al. Citation2019). The recovered energy can be used in the recycling operations.
Enabling the CE for LIBs through digital platforms and information systems
Beyond the physical material and energy flows, digital platforms and information systems can help to improve operationalization of a CE for LIB. These pathways are less mature than the material pathways and can include:
Design for circularity (DfC): DfC is considered one approach to rethink (R1), by incorporating CE principles into the design of the product or the manufacturing process with the goal of increasing the circularity of the product. Design for recycling (DfR) is one subset of DfC, and design for disassembly is an enabler of DfR. Various DfC approaches include:
Designing to facilitate easier disassembly (Li et al. Citation2021b) and more efficient recycling (Jin et al. Citation2020).
Standardizing designs (Gaines Citation2018).
Using materials which have lower environmental toxicity and human health impact (Gong et al. Citation2016; Li et al. Citation2020; Nirmale, Kale, and Varma Citation2017; Zhao et al. Citation2020).
Selecting materials that facilitate easier recycling (e.g., lowering aluminum content can enable easier pyrometallurgical recycling) (Tao et al. Citation2021), reducing the quantity of materials that are scarce (Gourley, Or, and Chen Citation2020) or have a negative social impact associated with extraction (Banza Lubaba Nkulu et al. Citation2018; Li, Lee, and Manthiram Citation2020; Zhu et al. Citation2020).
Improving durability (Cui, Xie, and Manthiram Citation2021).
Lowering the material intensity of manufacturing and use (Thompson et al. Citation2020).
Interested readers can find a review of DfR application to several clean energy technologies including LIBs in (Norgren, Carpenter, and Heath Citation2020). Their review presents a list of principles, both general and specific for LIBs (and PV), which we have included in the SI Section S.4.3 because they are clear and succinct.
Labels of materials and other attributes: Enhancing product labeling can enable more efficient decommissioning, sorting, and subsequent allocation of the LIB to the most suitable recycling process (Gaines, Richa, and Spangenberger Citation2018). Information not included in typical product labels that could enable and improve CE strategies and outcomes include the chemistry, material origin, design (e.g., manufacturer name, location of manufacturing), and material constituents of each LIB. The labeling information can be stored on the LIB as a radio frequency identification tag (RFID), material passport, or QR (quick response) code (Bai et al. Citation2020). It is important for the product itself to carry this information since information provided separately by the manufacturer (e.g., specification sheets, bill of materials) doesn't always transfer with the LIB as ownership changes, including to decommissioning teams, recyclers, and others, who are the ones most in need of the information.
Blockchain is an approach to labeling that can protect copyrighted and commercially sensitive data such as the material constituents and the design of an LIB (Everledger Citation2020). Blockchain can also help manufacturers meet regulatory requirements (e.g., the European Union's requirement of recycling 70% of the mass of EOL LIBs by 2030) (Halleux Citation2021), for instance, by sharing LIB details with authorized recyclers, remanufacturers, and refurbishers.
Artificial intelligence (AI) and machine learning (ML): AI and ML can be used in all LIB life cycle phases. AI and ML refer to a broad class of computer-driven data analysis tools that can be effective at using manufacture- and use-phase data to discover efficiencies and automate processes.
AI and ML can be applied in the manufacturing phase to identify environmentally preferable, less toxic, and earth-abundant materials; key design parameters and material properties that drive performance; and novel materials that improve energy storage and durability (Attarian Shandiz and Gauvin Citation2016; Mao et al. Citation2021; Wu et al. Citation2018; Zhang et al. Citation2019). Examples include materials screening to improve anode and electrolyte performance (Deringer Citation2020; Zhang et al. Citation2019), or to improve electrolytes that can suppress dendritic growth (Ahmad et al. Citation2018). As a result, implementing CE strategies that seek to drive economic and environmental improvements in LIB manufacturing will require an incremental approach and can impose significant economic costs (Kwade et al. Citation2018; Thomitzek et al. Citation2018). AI and ML have also been shown to enable streamlining of moving from lab to pilot and commercial scale and, identifying CE strategies that decrease manufacturing costs, improve manufacturing process efficiencies, decrease the production of manufacturing scrap, and improve the quality of the LIB (Liu et al. Citation2021; Schnell et al. Citation2019).
In the use phase, ML-based analyses have combined manufacturer's data and results from accelerated aging tests to improve in-use battery state-of-health assessment (refer to section titled “Specific applications, chemistries, and components” for definition of state of health); identify optimal repair times and change operation to ensure LIB performance and reliability; and allow for reuse or repurposing (Tang et al. Citation2021).
In the EOL phase, ML and AI have been shown to improve computer vision algorithms helping streamline and automate the LIB waste management and recycling processes (Harper et al. Citation2019) Additionally, AI and ML techniques can increase process efficiencies and decrease labor costs in LIB recycling by providing the controls for automating disassembly (Li et al. Citation2019; Wegener et al. Citation2015), determining state of health (Basia et al. Citation2021) and determining the potential for reuse and grouping by ageing characteristics and state of charge for different reuse applications (Chen, Shen, and Xu Citation2017; Zhou et al. Citation2020) (Lai et al. Citation2019; Rastegarpanah et al. Citation2020).
Virtual battery storage or product-service systems (PSS): In PSS, which are considered one approach to rethink (), the entity owning the LIB is separate from the entity consuming the energy storage function of the LIB. Digital platforms are used to implement the virtual battery storage and enable customers to virtually access energy storage services from the LIB systems, which are remotely located (Centrica Citation2022; Energy Storage News Citation2022).
Optimize design, process and siting: The economic and environmental cost of LIB recycling operations depend on multiple factors such as the volume of EOL LIBs available; the transportation distance; the cost of storage and handling; regulations; preprocessing steps required before recycling; and the choice of recycling technology (Tadaros et al. Citation2020). The application of digital platforms and analytical tools (e.g., geographical information systems) to optimize the design, process and siting of LIB recycling operations based on the above-mentioned factors, which vary spatio-temporally, can help maximize the economic and environmental benefits from LIB recycling (Hao et al. Citation2021; Hendrickson et al. Citation2015).
Preprocessing and metallurgical operations in LIB recycling
Despite the significant variability in the design and chemistries of various LIB suppliers, our literature review revealed that recycling for LIB systems can be categorized into a fundamental set of pre-processing and metallurgical operations (), which are listed in the boxes in the center of the figure and described below. This is analogously true for PV module recycling also, which is discussed in the section “PV CE in the EOL phase – Material flows.”
Figure 10. A distillation of pre-processing and metallurgical operations of selected commercial LIB (left) and PV (right) recyclers. Pre-processing (in Orange) and metallurgical (in green) operations are listed in the center. These operations typically occur sequentially from top down, however some recyclers perform them in different orders or can skip certain operations based on their specific process and target materials. A circle within a cell in a row indicates the operation corresponding to the row is used by the LIB or PV recycler. A blank cell in a row indicates the operation is not used by that recycler. (Umi = Umicore (Samarukha Citation2020; Velázquez et al. Citation2019), Akk = Akuuser (Pudas, Erkkila, and Viljamaa Citation2011; Akuuser Citation2021; Harper et al. Citation2019; Samarukha Citation2020; Velázquez et al. Citation2019), Due = Duesenfeld (Duesenfeld Citation2021; Hanisch Citation2019; Harper et al. Citation2019; Samarukha Citation2020; Velázquez et al. Citation2019), Rec = Recupyl (Harper et al. Citation2019; Meshram, Pandey, and Mankhand Citation2014; Recupyl Citation2013; Samarukha Citation2020; Velázquez et al. Citation2019), Ret = Retriev (Harper et al. Citation2019; Novis Smith and Swoffer Citation2013; Retriev Technologies Citation2021; Samarukha Citation2020; Velázquez et al. Citation2019), Ont = OnTo Technologies (BEST Magazine Citation2020; Samarukha Citation2020; Sloop et al. Citation2020; Velázquez et al. Citation2019), Sum = Sumitomo-Sony (Cardarelli and Dube Citation2007; Samarukha Citation2020; Velázquez et al. Citation2019), Acc = Accurec (Gratz et al. Citation2014; Samarukha Citation2020; Velázquez et al. Citation2019), Lit = Lithorec (Samarukha Citation2020), Bat = Battery Resourcers (Gratz et al. Citation2014; Samarukha Citation2020; Velázquez et al. Citation2019), Fre = FRELP/Sasil (Latunussa et al. Citation2016), Veo = Veolia (Veolia Citation2021a), Fir = First Solar (Sinha, Cossette, and Ménard Citation2012), Sol = SolarRecyclingExperts (SolarRecyclingExperts Citation2021)).
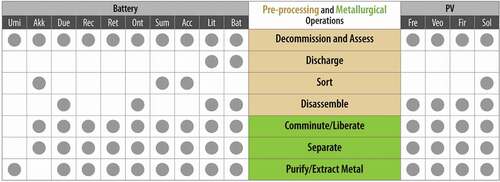
Decommission and assess: In decommissioning, an LIB is removed from the EV or stationary application (Alfaro-Algaba and Ramirez Citation2020; Rallo et al. Citation2020; Wegener et al. Citation2014). Decommissioning is followed by non-destructive assessment to evaluate the mechanical integrity and electrochemical safety of the battery (Rallo et al. Citation2020; Zhu et al. Citation2021). This assessment helps ensure safe conditions for further treatment, such as preventing the release of toxic hydrogen fluoride and phosphoryl fluoride gas due to short circuiting during disassembly causing thermal runaway (Larsson et al. Citation2017), or residual voltage which is an electrical safety issue for personnel (Diekmann et al. Citation2016).
Discharge: Removing electrical charge from each LIB is critical for worker and facility electrical safety. Researchers have developed many discharge methods, such as the use of electrical conductors (e.g., metal chips, graphite, powders) (Nembhard Citation2020; Sommerville et al. Citation2020; Yu et al. Citation2021), resistors (Samarukha Citation2020), solutions (e.g., discharging in 5% water solution of Na2CO3 and metal powder) (Samarukha Citation2020), cryogenic treatment (Yu et al. Citation2021), and thermal processes (Yu et al. Citation2021).
Sort: LIBs can be sorted based on chemistry, size, shape, and state of health (Yu et al. Citation2021). The goal is to minimize processing costs by decreasing variability in the above-mentioned parameters. This is especially relevant, for instance, when downstream recycling processes are designed for specific LIB chemistries and sizes (e.g., size restrictions for furnace-based recycling) (Nembhard Citation2020; Yu et al. Citation2021). For perspective, one recycler reported receiving 29 multiple chemistries in their comingled input waste feedstock (Gaines, Richa, and Spangenberger Citation2018).
Disassemble: Disassembly involves a series of steps to separate the pack into its components (e.g., battery junction box, busbars, cell-module controller, and battery management system) by removing the module and then the cells. The cells can then also be disassembled (e.g., carrier plates, temperature sensing plates). Interested readers can refer to SI Figure S1 for further elaboration of LIB components.
Comminute/Liberate: In metallurgy, comminution focuses on reducing the particle size of the ore. Comminution facilitates liberation wherein the valuable metal is freed from surrounding unvaluable (called gangue) material (Al-Thyabat et al. Citation2013; Wills and Napier-Munn Citation2006). In the case of LIB recycling, comminution can be achieved through cutting, rotary shearing, milling and grinding, or shredding the LIB (Velázquez et al. Citation2019).
Separate: In metallurgy, the fundamental principle of separation is to concentrate the liberated metals or minerals by further separating them from gangue (Al-Thyabat et al. Citation2013; Wills and Napier-Munn Citation2006). For LIBs, the precious metals contained in the cathode (e.g., cobalt, lithium, nickel, manganese) are separated from the other materials such as electrolyte, foils, and anode (Harper et al. Citation2019). Separation in commercial LIB recycling facilities uses magnetism, density, size (screening), surface properties (e.g., froth floatation), and hydrolysis and filtration to concentrate the metals (Harper et al. Citation2019; Velázquez et al. Citation2019).
Purify/Extract Metal: In the purification (also called metal extraction) step, the metal is purified through either hydrometallurgical, pyrometallurgical or direct recycling, which have been explained in preceding sections.
It is important to note that not all the pre-processing and metallurgical operations are mandatory. One or more can be skipped based on the process adopted by the LIB recycler. For example, some operations use pyrometallurgical recycling in which pre-processing steps are not required, and commercial operations might skip from decommissioning directly to purification.
Analysis and discussion of CE for LIB literature
Our analysis of CE for LIB publications depicts the current state of the science () reflecting which aspects are currently prioritized over others by categorizing papers into one or more classifiers (). The concentration on particular aspects of CE for LIBs is in some cases consistent with those topics’ market importance, and in other cases reveals which relevant aspects of CE for LIBs have been under-investigated, which raises opportunities for future research. At a high level, we found that the literature currently emphasizes the following topics:
Recycling, underemphasizing other CE strategies and indicators.
Technology development, underemphasizing many other aspects of a technology such as environmental, social, and economic performance as well as policy, regulation, behavior, and other aspects.
Lab-scale research, emphasized over pilot- and commercial-scale studies.
Certain chemistries, components, and applications, de-emphasizing alternative designs, materials, etc.
Single-topic research, under-investigating how attributes interact and can lead to trade-offs or synergies
Prior focus on recycling over other CE strategies
The results in show that the emphasis on LIB recycling is significantly greater than for other CE strategies: Recycling publications are greater in number than all other CE strategies combined. Because of its predominance, we performed a deeper analysis of LIB recycling publications passing our screens, reported in SI Section S4.1.2, including more detailed plots for the results shown in this sub-section, classification results of the recycling-based literature, and further discussion. More information about the classification of the literature can be found in SI Section S3.3.
Figure 11. Prevalence (counts) of LIB CE strategies reported in original research publications (columns in top panel) along with corresponding prevalence (percentage) by cathode chemistry in each CE strategy (pie charts in bottom panel). “Exclusive” indicates that the publication reports only one sub-classifier or can be classified as only one study type, “Multiple” indicates that the publication reports multiple sub-classifiers or can be classified as multiple study types. (n = 332; note that for the pie charts, a given publication may report multiple chemistries. The total number of publications of the pie charts for the different CE strategies from Refuse (R0) to Recover (R9) are 1, 10, 2, 16, 4, 7, 69, 66, 232, and 2).
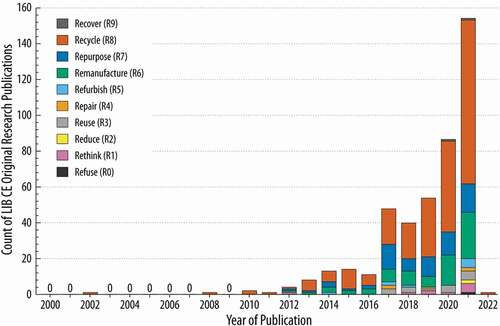
Figure 12. Annual count of the different LIB CE strategies which were reported in original research publications from 2000 to 2021. (n = 332). Note that publications that analyze multiple CE strategies were counted under each. Year of publication reflects a journal’s planned official publication date, even if made available on-line earlier. Thus, there were some publications released in December 2021, with official publication dates in 2022.
We can also observe from that there is no consistent pattern of prevalence for certain chemistries to be favored in research of certain CE strategies, despite more publications overall on NMC chemistry ( (a)).
Although papers discussing non-recycling CE strategies are increasing in number since ~2014, recycling research still dominates as a proportion of the growing publication count (). The emergence of four other strategies – repurpose, remanufacture, refurbish, and reuse – can be attributed to an increase in the volume of LIB waste (WEF Citation2018) and the emergence of market opportunities to apply the decommissioned LIBs in second life applications (Ahmadi et al. Citation2015; Bräuer Citation2016; Jiao and Evans Citation2016, White, White, Thompson, and Swan Citation2020).
Recycling is an important CE strategy and is a backstop to avoid landfilling after other strategies have been exhausted. Yet, current literature’s overwhelming emphasis on recycling is somewhat misdirected.
Non-recycling CE pathways are generally preferred in the CE hierarchy because they usually retain a greater proportion of the value of the original products (Richa, Babbitt, and Gaustad Citation2017). Also, reuse, repair, refurbish, remanufacture, and repurpose CE pathways typically have been shown to have greater environmental and economic benefits and are preferable to recycling (Richa, Babbitt, and Gaustad Citation2017; Tao et al. Citation2021). This is because by extending LIB lifetimes, the embodied energy, carbon emissions, cost, labor, etc. required to manufacture the LIB now produces a greater lifetime amount of kWh of electricity stored, reducing per-unit impact (Richa et al. Citation2015). Disassembling a product and separating its constituent materials (i.e., recycling) is an intensive process, especially for highly engineered energy technologies like LIBs and PV.
In addition, the non-recycling CE strategy of rethink (e.g., PSS) can generate multiple benefits for the various stakeholders in the CE for LIB. For the customer, PSS can help lower the cost of using an energy storage service, decrease the space requirements for the LIB, and ensure guaranteed service levels (NREL Citation2015, Renewable Energy World Citation2020; SMUD Citation2021). For the LIB owner, PSS can help customers realize cost savings from economies of scale, as it is cheaper to install, service, and maintain an aggregated large-scale installation than multiple small-scale installations (Li and Ouyang Citation2011; NREL Citation2015; Zhang and Rao Citation2016, Renewable Energy World Citation2020; SMUD Citation2021; Wrålsen et al. Citation2021).
The benefits of non-recycling CE strategies are important to better understand, especially in light of their expected growth worldwide (Engel, Hertzke, and Siccardo Citation2019; WEF Citation2018) and because a CE pathway preceding recycling can alter attributes such as form factor, material quantity and quality that can affect recycling outcomes such as profitability.
Our analysis found that emphasis on recycling manifests in other ways, too. For example, the literature focuses most heavily on the EOL phases given that is where recycling is typically implemented ( (b)). Similarly, extant research heavily emphasizes mass-based indicators, which is a traditional way to quantify recycling efficiency (Dodbiba et al. Citation2013; Dunn et al. Citation2021; Fu et al. Citation2020; Gao et al. Citation2017) ( (a)). This is despite effort-based indicators being better suited to quantify time and costs required to remanufacture, reuse, or repair the LIB (Alfaro-Algaba and Ramirez Citation2020; Rallo et al. Citation2020) and determine the economic and environmental impacts of an extended lifetime (Cusenza et al. Citation2019; Schulz-Mönninghoff et al. Citation2021).
Figure 13. Counts of LIB CE publications based on the classifiers listed in : of Indicators (A), Life Cycle Phase (B), Scope of CE Strategy (C), Scale of Operations (D) or based on the study type (where E includes all publications and F just reviews). (See for explanation of “Exclusive” and “Multiple”. Count of analyzed publications in panels A–D is 332 original research publications, panel E is 444 total publications, and panel F is 112 review publications, all of which passed the four screens. Since reviews were further classified in (F), they were considered their own study type in (E) and categorized exclusively as reviews). (Life. Ext. = lifetime extension; Raw Mat. Ext. = raw material extraction; Tech. Dev. = technology development; Perf. = performance; LCA = life cycle assessment; TEA = technoeconomic analysis).
Figure 14. Counts of LIB CE original research publications based on the Cathode Chemistry (A) and Application (B). Frame (B) displays both the publication counts (left column chart) and proportion of publications from each chemistry (right side pie charts). (See for explanation of “Exclusive” and “Multiple”; n = 332.).
also shows that CE strategies have typically been considered individually. Yet, sometimes certain approaches to improving one CE strategy can affect another. For example, the hermetical sealing of cells and gluing together of modules and packs favors the CE strategy of reuse of a LIB by increasing durability, but makes the CE strategy of recycling more costly and environmentally burdensome as the disassembly of sealed and glued modules is a complex and time-intensive process (Thompson et al. Citation2020). As another example, increased adoption of CE strategies such as reuse and refurbishment will decrease the volume of waste LIB being sent to recycling, thus potentially affecting economies of scale. Thus, we observe a need for more integrated analyses across more than one CE pathway to inform decisions about trade-offs.
Research beyond technology development for LIB
As stated in the Introduction, prevalence of adoption determines whether and to what degree circular economy as a concept and strategy succeeds in providing its numerous potential benefits. First and foremost, especially in unregulated spheres typical of the two technologies being evaluated in this article, adoption requires favorable economics, though behavioral factors also play a critical role. If a chief motivation to pursue CE is because of purported environmental benefits (like contribution to decarbonization), then these benefits must be proven and documented. Finally, even for unregulated markets, policies and regulations play a critical role in shaping the marketplace. Yet, as seen in (e), only research studying technical performance is reported in significant numbers, with all the others (i.e., studies of economics, environmental impacts, policy, and social behavior ()) summing to just over half of that of technology development alone. In this section, observations stemming from the results shown in (e) are elaborated to define the state of the science in understanding CE strategies, especially recycling, from perspectives other than the development of the technology itself and that technology’s technical performance.
Environmental and economic analyses
From an environmental (LCA) perspective, our literature review has revealed a lack of data describing material constituents for LIB chemistries, battery designs, and manufacturing conditions, which can be used to assess the environmental impact of the CE for LIBs. Design decisions, material choices, and process changes (e.g., as proposed by green chemistry principles) (Li et al. Citation2021b) can generate environmental trade-offs across multiple life cycle phases, which can be robustly evaluated through an LCA.
The replacement of flammable, toxic, and fluorinated electrolytes and solvents with water can potentially impact all life cycle phases of LIBs: The manufacturing phase due to the switch in materials, the use phase as the energy density may be lower and lifespan reduced, and the recycling phase as the recycling process will no longer be required to recover the toxic solvents (Li et al. Citation2021b). Similarly, the use of recycled materials instead of virgin materials to manufacture LIBs does not always generate an environmental benefit. This could be due to a variation in factors such as LIB chemistry, recycling energy requirements, recycling process parameters, recovery efficiencies of the three different recycling technologies, and grid mix of the electricity used in recycling (Ciez and Whitacre Citation2019). As these factors change in the market, and with evolving research, parametric sensitivity analysis could help to reveal whether and under what conditions use of recycled materials yields benefits and to whom (the recycler, the manufacturer, or society).
Our analysis also identifies a lack of robust uncertainty assessment when presenting results of LCAs and TEAs for CE strategies, which are typically in the early stages of technology development or commercial maturity. A review of the 29 LCA studies shows that only 3 accounted for data uncertainty. Future TEAs and LCAs for CE of LIB can leverage existing methods (Cucurachi, Borgonovo, and Heijungs Citation2016; Ravikumar et al. Citation2018) to account for and assess the impact of data uncertainty.
We find a need to account for non-recycling CE strategies in LCAs and TEAs. For example, of 51 LCAs and TEAs of CE for LIB, only 22 focus on non-recycling CE strategies. This can be attributed to a lack of publicly available primary data on the bill of materials and process parameters for non-recycling CE strategies, which are required to conduct LCAs or TEAs. For example, there are no publicly available primary data on the balance – of systems for stationary LIB (e.g., the housing, cooling system, insulation, fire suppression, battery management system) (Pellow et al. Citation2020). This lack of primary data inhibits study of the economic value of recovery of balance – of systems materials, the assessment of feasibility of decommissioning and recycling the whole system, and any environmental trade-offs (Pellow et al. Citation2020). In addition, the economic and environmental impacts of using LIBs to provide a wide range of grid services in second-life applications currently remain unquantified (Pellow et al. Citation2020).
Moreover, there can be potential trade-offs between economic, environmental, and social impacts of different CE strategies. Not only could these attributes simply be quantified as separate dimensions in the same research, the application of methods such as multi-criteria decision analysis (Brans and De Smet Citation2016; Prado, Rogers, and Seager Citation2012) can help formally and quantitatively evaluate the trade-offs between the three sustainability indicators. For instance, (Kiker et al. Citation2005) used multi-criteria decision analysis to identify the most optimal and sustainable CE strategy, also incorporating the sensitivity of the stakeholders to the three dimensions of sustainability.
Policy and regulatory research
(e,f) show a low count of policy and regulation related publications, which limits efforts to identify how current or potential policies could hinder or incentivize the CE for LIBs. There are several areas where policies have been identified as helpful to addressing barriers to a CE for LIB, including lack of standardized designs, which inhibits efficient automation of decommissioning and disassembly (Li et al. Citation2021b; Wegener et al. Citation2015). Policies could approach standardized designs as a mandate, or could create incentives for manufacturers to collaborate and share data in protected ways, even with consumers (e.g., through blockchain) (Melin Citation2021). Policies requiring a threshold of mass of EOL LIBs to be recycled can put certain recycling technologies at a disadvantage. For example, pyrometallurgy can easily achieve the European Union's 50% mass recovery target for recycled spent LIBs and may be incentivized over hydrometallurgy and direct recycling, which are competing technologies that have higher recovery efficiencies for cathode and anode materials yet are more expensive (Harper et al. Citation2019).
There are further knowledge gaps in policy that impact the adoption of CE strategies beyond recycling. For second life applications, we find a lack of clarity on how electrical, building, and fire regulations will apply to second life LIBs in grid and non-grid applications (Curtis et al. Citation2021c). With EV original equipment manufacturers providing a warranty for the LIB in only first life application, there is a lack of clarity around liability of LIBs in second life applications, which can disincentivize the large-scale adoption of LIBs in second life applications and thereby hinder CE strategies such as reuse, repurpose, and refurbishment (Curtis et al. Citation2021c; Elkind Citation2014). Since the CE for LIB will require transport of LIBs to recycling or other facilities (e.g., plants for remanufacturing, repurposing, etc.), regulatory clarity and consistency are required for LIB waste classification across different geographies through which the LIB is transported. However, most states in the United States do not have waste classification regulations defined specifically for LIBs at end of life (Bird et al. Citation2022; Curtis et al. Citation2021c).
Geospatial research to augment other analyses
LIB installations are expected to become more geographically dispersed and there will be a corresponding increase in the transportation distances and costs when retired LIBs are transported back to waste processing facilities (Slattery, Slattery, Dunn, and Kendall Citation2021). This is due to LIBs typically being classified as hazardous waste which increases transportation costs (Gaines, Richa, and Spangenberger Citation2018).
We identify a need for geospatial tools and methods to analyze how to
Decease transportation costs by exploring alternate models of LIB recycling such as decentralized recycling (which also has been proposed for other technologies such as PV).
Optimize the location of LIB recycling facilities (Hendrickson et al. Citation2015; Wang, Wang, and Yang Citation2020)
Use an optimal mix of transportation modes where possible (Hendrickson et al. Citation2015)
Prevent avoidable transport through accurate state-of-health-based sorting, wherein only LIB that cannot be salvaged by repurpose, reuse, or refurbish are sent to recycling facilities.
Preprocess LIBs near installation sites.
Transport only the smaller mass of black mass to centralized recycling facilities (electrive.com Citation2020, Slattery, Slattery, Dunn, and Kendall Citation2021).
Non-technology development aspects of LIB recycling
We found that a key knowledge gap in extent research on LIB recycling is the lack of integrated and detailed data on processes and associated costs for all key steps in LIB recycling, limiting the ability to perform derivative TEA, LCA and other analyses. Despite recent efforts that show promise (Dai et al. Citation2019; Lander et al. Citation2021), studies generally focus on specific processes in isolation, such as upstream operations (e.g., disassembly) and downstream steps (e.g., recycling the module and cell components). We identify a need for research on:
More robust and integrated cost models that account for various steps and process parameters of LIB recycling under different pathways.
Potential changes in recycling processes that affect material constituents and components for stationary LIBs (e.g., balance – of systems components) (Pellow et al. Citation2020)
Differences in recycling operations in different geographies (Ferrara et al. Citation2021)
Recycling with emerging technologies (e.g., bioleaching, deep eutectic solvents) (Ferrara et al. Citation2021; Roy et al. Citation2021)
Changes in economic viability due to potential improvements in recycling processes.
The impact of data uncertainties on the cost estimates and the increasing diversity in LIB designs (Doose et al. Citation2021).
Below is a summary of the state of knowledge regarding recycling process selection (among the three basic classes defined above) considering trade-offs, especially with regard to economic, environmental (e.g., energy intensity, waste production), and circularity performance.
Hydrometallurgical recycling has been found to have lower energy requirements than pyrometallurgical recycling, can be tailored to recover valuable metals (e.g., cobalt, lithium) with high efficiencies, and has minimal air pollutant emissions (Forte et al. Citation2020). However, hydrometallurgy produces a significant quantity of liquid wastes from solvent use and sludge (Forte et al. Citation2020) has been found to not be economically viable for chemistries with low cobalt content (e.g., LFP) (Chen et al. Citation2019) and has slower reaction kinetics, leading to longer processing times which can impact process economics (Harper et al. Citation2019).
Pyrometallurgical recycling has been found to be easy to scale up and useful for recycling comingled waste streams consisting of multiple LIB chemistries without the need for time- and labor-intensive sorting and grouping operations (Yang et al. Citation2021). However, pyrometallurgical recycling is energy-intensive and requires control equipment for environmentally hazardous air emissions. Also, recovery of metals like lithium and aluminum from the slag is currently not economically viable (Gaines Citation2019), nor is recovery of material components such as in the binders and electrolyte, which are combusted at high temperatures (Harper et al. Citation2019; Yang et al. Citation2021). The anode is also not recovered (Harper et al. Citation2019; Yang et al. Citation2021)
Direct recycling (which we classify as remanufacturing) has been shown to have lower environmental and economic impacts (Ciez and Whitacre Citation2019; Yang et al. Citation2021) than pyrometallurgical and hydrometallurgical recycling, and is more circular since the recovered cathode materials can be directly reused in a new LIB (Gaines Citation2019). However, direct recycling is not as commercially mature compared to hydrometallurgical and pyrometallurgical recycling. It requires robust sorting of LIB waste by cathode chemistry (Harper et al. Citation2019). Furthermore, research has found direct recycling to be more viable at smaller, decentralized recycling scales (Gaines Citation2019), sensitive to impurities (e.g., Al and Cu), and may not meet exacting quality requirements for reuse of cathode materials (Chen et al. Citation2019).
It is important to reiterate that the existing analysis of the environmental and economic impacts of the three recycling technologies are based on factors such as current models of sorting recycling facilities and operations, mix of LIB chemistries, and geospatial availability of LIB waste. Further research is needed to analyze newer recycling system designs and LIBs. For example, with the economics of recycling processes depending significantly on cobalt content in the LIB (Lander et al. Citation2021) there is a need to understand if recycling LIBs of decreasing or zero cobalt content (e.g., LFP) will be financially viable.
Research beyond lab-scale to pilot- and commercial-scales
The results in ( (d) show that there is a prevalence of publications around CE strategies for LIB at a lab scale. While lab-scale research is useful in demonstrating proofs – of concept and identifying economically, environmentally, and socially promising CE strategies, there is a need for follow-up analysis to ensure that the benefits can also be realized at a commercial scale.
While it is unclear if the current rate of scaling up needs to be accelerated to meet projected EOL volumes, successful scaling of CE strategies beyond the lab should account for:
Data uncertainty (Ravikumar et al. Citation2018), which is typical in assessing lab-scale technologies (Ravikumar et al. Citation2018; Wender et al. Citation2014)
Impacts from economies of scale(Lander et al. Citation2021; Wang et al. Citation2014)
Directing research and development toward areas which generate the greatest improvements in CE strategies (Wender et al. Citation2017)
Identifying opportunities and challenges that become relevant at a commercial scale (e.g., benefits from regulations (Chembessi, Beaurain, and Cloutier Citation2021; Curtis et al. Citation2021c), scalable business models (Hultberg and Pal Citation2021), costs of transportation (Lander et al. Citation2021), and need for automation at scale).
As an example of possible issues that emerge from scaling, lab-scale demonstrations may show that automation for LIB disassembly is safer, prevents material losses, and is economically efficient (Li et al. Citation2019; Oak Ridge National Laboratory Citation2021). At the same time, however, there is a need to assess the potential social implications from reduced employment if automation is adapted at an industrial scale and offsets labor-intensive recycling operations (Guyot Phung Citation2019; Zheng et al. Citation2021).
Specific chemistries, applications, and components
Chemistries
Reflecting the higher market share of NMC (BloombergNEF Citation2021; Wood Mackenzie Citation2021), the publication count for NMC-based LIBs is higher than LFP, LMO, and NCA (). However, the amount of other chemistries is expected to grow (BloombergNEF Citation2021) so further research will be helpful to understand whether CE strategies for one chemistry can be applied to other chemistries.
The economics of LIB recycling processes depends significantly on the resale value of cobalt recovered from the LIB (Lander et al. Citation2021). Therefore, further research is required to understand if existing recycling processes will be economically feasible when applied to LIB chemistries with lower or no cobalt content (e.g., LFP). Potential challenges in the commercial scaling of LFP and LMO recycling technologies that are relatively immature need to be addressed. For example, manual disassembly processes for LFP LIBs, which are labor-intensive and are currently used in low-technology readiness level solutions, need to be automated at a commercial scale to decrease costs and avoid potential health hazards to employees (Forte et al. Citation2020).
Since direct recycling and hydrometallurgical recycling processes are typically designed for a specific chemistry, new flow sheets will be necessary for each LIB chemistry. Figure S4 in the SI displays counts of publications with different combinations of classifiers and chemistry. Among the publications focusing on LFP, LMO, and NCA, a significant share considers recycling of multiple chemistries (e.g., mixed cathode recycling (Zheng et al. Citation2017)).
Applications
Reflecting its higher market share (BloombergNEF Citation2021), vehicle LIBs show a significantly higher publication count than that of stationary applications (). Both applications are projected to grow significantly (BloombergNEF Citation2021). Thus, there will be a need for future research on the CE for stationary LIB and include its diverse range of grid-service applications (Faessler Citation2021), and its differences in the decommissioning processes, design, hardware, and form factors compared to vehicle LIBs (Hesse et al. Citation2017; Renewance Citation2021).
Research has shown that there is significant variability in the environmental and economic (Canals Casals, Barbero, and Corchero Citation2019) benefits realized depending on factors such as the LIB second life application (Casals, Amante Garcia, and Canal Citation2019; Richa, Babbitt, and Gaustad Citation2017), and if the LIB is reused in the industrial or residential sector (Mirzaei Omrani and Jannesari Citation2019). A comprehensive analysis grounded in principles of LCA and TEA and using consistent assumptions for the system boundary and the product being offset could rank the various second-life applications of LIB based on economic and environment benefits.
Components
shows that the count of publications related to the CE of cathodes is significantly greater than the anode, electrolyte, and other components in a cell. This emphasis is also motivated by the economic value of the cathode, which is 65 to 70% of the overall material cost of the LIB, and includes materials such as cobalt that face supply chain risks (Thompson et al. Citation2021). Consequently, the count of CE publications for cells, which includes publications about cell components (i.e., cathodes), is significantly greater than the module, pack, and system ( (b)).
Figure 15. Counts of original research publications which applied CE strategies for different LIB Cell Components (A) and LIB Components (B). Explanations of “Exclusive”, “Multiple”, and “Not reported” can be found in . Both graphs represent 332 original research publications, all of which passed the 4 screens.
While recycling is the most used CE strategy for cathode materials (Figure S15), the results in SI Figure S4 show that there are no integrated recycling technologies to recover the cathode, anode, and the electrolyte. There are multiple reasons why the development of high-efficiency low-cost recycling beyond the cathode could be beneficial (Dunn et al. Citation2021).
First, recent regulations have targeted recycling a minimum mass of the LIB (Halleux Citation2021). The anode and electrolytes are attractive candidates for recovery as they contribute 30–35% of the mass of LIB (Gaines, Richa, and Spangenberger Citation2018; Larouche et al. Citation2020). Moreover, as LIB manufacturers actively pursue chemistries of lower cobalt content (e.g., NMC811) (Gaines Citation2018; Mayyas, Steward, and Mann Citation2019) due to the social and environmental burdens in the cobalt supply chain (Gourley, Or, and Chen Citation2020), the recovery of cathode materials may be disincentivized. As a result, the anode and electrolyte may become increasingly attractive candidates as their share of LIB material cost grows. Despite currently contributing only around 19% of the overall LIB material costs, recycling processes that integrate recovery of all three components could be necessary to improve recycling economics in the future if cobalt-based value decreases (Kwade et al. Citation2018). Second, the recycling of graphite, which is the most commonly used anode material, can help to decrease reliance on its global supply chains which are susceptible to socio-political risks (Mayyas, Steward, and Mann Citation2019). Third, novel and lower-cost methods to synthetically produce materials used in the anode, electrolyte, and other LIB components (e.g., synthetic graphite for the anode) are appearing (Mayyas, Steward, and Mann Citation2019). As a result, the recovery of anode and electrolyte could have to compete with emerging synthetic pathways of production, thus motivating research to enhance value from recycling by recovering more materials at higher quality and lower cost.
Future efforts to improve the circularity for the entire LIB will need to consider CE strategies that are applicable to the entire pack instead of just the cell. One approach could be to operationalize non-recycling CE strategies such as rethink, reuse, repurpose and repair, which are typically more favorable from a CE and environmental perspective than recycling (King et al. Citation2006; Richa, Babbitt, and Gaustad Citation2017), but are currently not widely investigated or applied. Despite the economic and environmental promise, there are technical and analytical challenges to non-recycling CE strategies for LIB.
One such challenge is the need for standardized methods to estimate state of charge (SOC), state of health (SOH) and the rest of useful life (RUL). These diagnoses are used to assess the general health and performance of LIBs: SOC is used to assess the remaining capacity of LIB during charge-discharge cycles, SOH to examine the aging of LIBs and assess the remaining charge-discharge cycles, and RUL to measure the period of time until the end of the useful LIB life (Wang et al. Citation2021; Wei, Dong, and Chen Citation2018).
Variance in manufacturing (Kenney et al. Citation2012) and operational conditions introduces variability in the SOH and RUL of cells in the LIB. For example, EV batteries operate over a temperature range of −20 to 70°C and undergo around 1,000 incomplete charge/discharge cycles over 5 to 10 years (Zhu et al. Citation2021). The variance in the SOH at the end of life, in addition to the diversity in the design and form factors (Groenewald et al. Citation2017), presents a logistical challenge for grouping cells based on SOH before reuse in a second life application. We have found that research is needed on standardizing methods and technologies to lower cost and time (Groenewald et al. Citation2017) for rapid SOH evaluation and grouping of LIBs at end of life without sacrificing accuracy (e.g., through AI and ML) (Basia et al. Citation2021; Chen, Shen, and Xu Citation2017; Zhou et al. Citation2020).
Expanding research focus to be more holistic
The count for studies focusing exclusively on one classifier (marked “Exclusive” in our figures) is significantly higher than those considering multiple classifiers (marked “Multiple”) for sub-classifiers with a high publication count (e.g., Mass in (a), End of Life in (b), Nano in (c), Lab in (d)). This indicates a narrow focus on certain sub-classifiers with a lack of simultaneous analysis on how the CE for one sub-classifier impacts other sub-classifiers. For example, in (b), the significantly higher count for “Exclusive” than “Multiple” for the end of life sub-classifier indicates that there is a need for publications to analyze how the CE at end – of life impacts other life cycle phases. Publications presenting CE strategies to repurpose, refurbish or reuse LIBs at end of life () can benefit from corresponding analysis on the regulatory needs, quality and performance requirements for second life LIBs to ensure that the LIBs are successfully circulated back into the use phase (Curtis et al. Citation2021c)
Necessity for robust estimates of global LIB waste volumes
Beyond a limited body of literature for specific countries (Randell Environmental Consulting Citation2016, Song, Hu, Liang, et al. Citation2017; Morita et al. Citation2021), there is a lack of robust estimates of LIB waste volumes which account for
Decommissioned LIB systems and waste flows at the level of states, counties, and districts.
The relative market shares of various LIB chemistries across different geographical regions, which increases heterogeneity in the LIB waste flows and can influence the choice of recycling process (Campagnol et al. Citation2018)
The potential impact of emerging policies and incentives seeking to increase electricity storage and the adoption of electric vehicles on future waste flows (IEA Citation2021b; Pacific Northwest National Laboratory Citation2021)
The expected growth in allied renewable energy technologies that can accelerate the deployment of LIB (Peters et al. Citation2021)
The state of health and state of charge of legacy and more recently installed LIB systems which could impact the choice of CE strategy.
Robust, publicly available and dynamically updated waste estimates for LIB waste, which account for the above factors and are spatially granular, could inform commercial decisions to site and scale infrastructure for recycling and non-recycling CE operations for LIBs.
Socio-technical considerations and approaches
Social impacts of recycling infrastructure, both past and potential, can affect the ability to site new facilities and operate current ones. For instance, air pollution from the recycling of LIBs can negatively impact adjacent neighborhoods, and has a greater impact on public health as population density increases (Hendrickson et al. Citation2015). Furthermore, given past instances of battery waste management operations generating negative air and water quality impacts (ABC7 Citation2020), there have been documented cases of community resistance to the siting of new LIB recycling infrastructure (WSKG Citation2021).
With regard to addressing community concerns, socio-technical research can be particularly helpful. Here we highlight three opportunities to advance such research.
First, because we know that humans (both individuals and within groups) do not use economic rationality or policy prescription solely to make decisions, techniques have been developed within the field of complex systems science to study and better model behavior. Such techniques have begun to be applied to the CE (Walzberg et al. Citation2021), including systems dynamics (Guzzo et al. Citation2022) and agent-based modeling (Stevens and Supekar Citation2021), but are still limited. From our review, we identify a need for more robust socio-technical assessments that account for:
A more complete set of stakeholders () and their interactions across the different LIB life cycle phases.
The impact of economic factors (e.g., market pricing, value of secondary materials).
A wider variety of policy instruments.
Technical factors (e.g., recovery rate of materials, choice of recycling technology).
The role of product design and business models on the effectiveness of CE (Franco Citation2019)
The impact of social norms on the effectiveness of community level CE programs (Tong et al. Citation2018)
For reference, the above factors have been studied in agent-based modeling and systems dynamics models investigating technologies like PV (Walzberg, Carpenter, and Heath Citation2021), computer hardware (Walzberg et al. Citation2022), biowaste (Skeldon et al. Citation2018), e-waste (Putri and Kusumastuti Citation2021), and construction waste (Beaudet, Larouche et al. Citation2020). The goal of such socio-technical analysis is to identify key levers to successful implementation of a CE for LIBs and simulate the corresponding economic and environmental benefits at micro and macroeconomic levels.
Second, there are significant differences in policy approaches to incentivize CE for LIBs across different geographies. For example, policy in China promotes EV manufacturers to take back EV batteries and share the procedures and information for disassembly across the various stakeholders to enable wider adoption of recycling of LIB. This is currently not the case in the United States (Bird et al. Citation2022; Curtis et al. Citation2021c; Dunn et al. Citation2021). Approaches such as agent-based modeling could be used to study market responses to policy initiatives in specific juridictions, and how juridictions can adopt, modify, and implement the policies for markets in their control.
Third, a repository of specialized jobs and skills in the CE for LIB could help in the design, communication, and implementation of training and skill development programs at the federal, state, and local levels to develop the work force for a CE for LIB (Curtis et al. Citation2021c; Drabik and Rizos Citation2018; Wrålsen et al. Citation2021).
State of the science: CE for PV
Review of available CE Pathways for PV from a systems perspective
We organized CE pathways for PV into another systems diagram () analogous to that for LIBs (). The diagram comprehensively tracks strategies across all life cycle phases to show CE material and information flows. A schematic diagram of the design of a typical crystalline silicon PV module is provided for reference in Figure S3.
Figure 16. A systems diagram representing the CE strategies for the manufacture (M), install and use (U), and the collect and recycle (EOL) phases of the life cycle of PV. For an explanation of the different CE strategies, the stakeholders, information and material flows and the legend used please refer to .
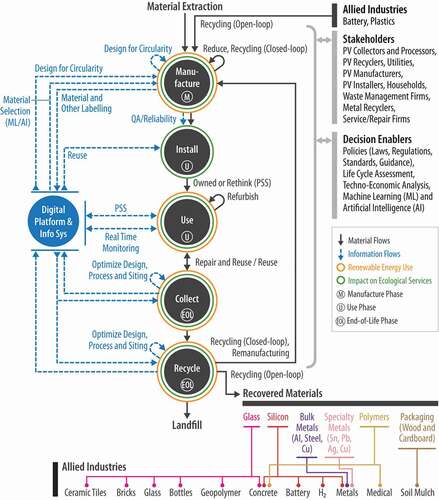
PV CE in the manufacturing phase – material flows
Two CE strategies – refuse and reduce – are applied in the manufacturing phase. Two additional CE strategies – remanufacturing and recycling (both open- and closed-loop) – bring materials from the EOL phase back into the manufacturing phase.
In the refuse strategy, materials that are environmentally toxic and pose hazards to human health are minimized or eliminated when manufacturing a PV system. These include, for instance, fluorinated backsheets and lead-based solders. Fluorinated backsheets can be replaced with polymer materials that are fluorine-free (Aryan, Font-Brucart, and Maga Citation2018; Oreski et al. Citation2021; Richard Citation2011) or have a double glass design (Deng et al. Citation2019) (Fraunhofer UMSICHT Citation2017). Eliminating fluorinated backsheets decreases the economic costs of c-Si PV recycling by eliminating the need for additional processes and equipment (Fraunhofer UMSICHT Citation2017) to manage fluorinated emissions and wastes (Deng et al. Citation2019). As an alternative to the toxicity and environmental hazards of lead-based solders in Si PV panels, electrically conductive adhesives (Oreski et al. Citation2021; VDMA Citation2020) and tin-bismuth-based solders (De Rose et al. Citation2017) are also being utilized.
In the reduce strategy, the material requirements to manufacture PV panels are decreased. More specifically, research has focused on decreasing the use of bulk materials such as glass, aluminum, and solar-grade silicon, which contribute the highest share of mass and are the most energy-intensive material components in a crystalline silicon PV panel (Mann, Fthenakis, and de Wild-scholten Citation2013; Wong, Royapoor, and Chan Citation2016); lowering the use of expensive materials such as silver which are significant cost contributors to manufacturing PV panels (VDMA Citation2021); and reducing the use of materials such as tellurium and indium which are not earth abundant.
Glass use has decreased as the thickness of front glass decreased from 3.2 mm (Oreski et al. Citation2021) to between 2 and 3 mm (VDMA Citation2019), and aluminum use can be reduced through frameless modules (Norgren, Carpenter, and Heath Citation2020). Strategies to reduce solar-grade silicon usage include decreasing thickness of the wafer (e.g., 300 mm in the 2000s to 180 mm in 2020) (Oreski et al. Citation2021), decreasing kerf losses though improved sawing methods (Kumar and Melkote Citation2018; Schwinde, Berg, and Kunert Citation2015), and kerf-free wafering (Henley et al. Citation2011). (The amount of silicon that is lost as “kerf” from the cutting of wafers out of silicon ingots is based on the width of that cut.) Silver can be both reduced in weight per module and substituted (e.g., with copper) (VDMA Citation2021). The thickness of layers of Cd and Te can be thinned (Krishnakumar et al. Citation2013).
In remanufacture, individual components of a decommissioned PV panel are recovered, purified and reused in the manufacture of a new PV panel (Deng et al. Citation2020). For example, research has demonstrated that silicon wafers can be recovered from spent crystalline PV panels when subjected to etching to remove the dopants (e.g., boron), back contacts (e.g., Al), metallization, (e.g., silver), and anti-reflective coating (SiNx), and then reused in the manufacture of new Si PV panels (Lee et al. Citation2018a, Citation2017; Shin, Park, and Park Citation2017). However, such strategies face numerous challenges, as discussed in (Heath et al. Citation2020).
In open-loop recycling, materials from non-PV products such as batteries (Chen et al. Citation2014) and plastics (DuPont Teijin Films Citation2020) are recovered and used in PV module manufacturing.
In closed-loop recycling, the following materials can be recovered from EOL PV panels and either can be reused directly to manufacture new PV panels or reused after subsequent purification:
silicon, glass (Rubino et al. Citation2020),
cadmium (Berger et al. Citation2010; Sinha, Cossette, and Ménard Citation2012),
tellurium (Berger et al. Citation2010; Sinha, Cossette, and Ménard Citation2012),
tin (Huang et al. Citation2017),
lead (Huang et al. Citation2017; Jung et al. Citation2016),
copper (Huang et al. Citation2017; Jung et al. Citation2016), and
silver (Huang et al. Citation2017; Jung et al. Citation2016).
For example, some research is focused on recovering and reusing solar-grade silicon that is lost from cutting the top and bottom of the silicon ingot, (Bronsveld et al. Citation2013) and as kerf during the wafering process (Li et al. Citation2021a; Wang et al. Citation2008).
PV CE in the use phase – material flows
In the use phase, the rethink strategy of PSS can contribute to a CE for PV wherein the entity owning the PV system is different from the entity utilizing the PV electricity. For example, in 37% of the U.S. residential market, the PV system is owned by a third-party owner (Galen Barbose et al. Citation2020). A PSS is advantageous as it reduces the economic burdens of accessing solar PV electricity for the end consumer (Rai and Sigrin Citation2013), relieving the time and operational burdens of financing, purchasing, installing, and maintaining the PV system, which are managed by the owner instead (Rai, Reeves, and Margolis Citation2016). By lowering the cost to access PV electricity, PSS can have positive environmental and social justice outcomes such as easier and cheaper access to renewable energy in communities with lower incomes and energy poverty (Drury et al. Citation2012; OShaughnessy et al. Citation2020).
In repair, functional issues and defects of a PV system are resolved and the PV system continues to be used. To date, repair has been found to be capable of addressing defects in a module’s bypass diodes, encapsulant, junction box, backsheet, glass, and connectors (Beaucarne et al. Citation2021; Heide et al. Citation2021). Repair increases the life span of PV modules and generates an environmental benefit by preventing premature and destructive recycling or landfilling of a significant volume of PV. Wood Mackenzie projects that the PV repair market could reach a market value of $9 billion USD by 2025 (Wood Mackenzie Citation2020). Repaired modules can potentially be sold at a lower price than new modules, which could help drive adoption of PV energy in price-sensitive markets (Solar Power World Citation2021).
PV CE in the EOL phase – material flows
The EOL phase consists of decommissioning, collection, recycling and (energy) recovery. During collection, PV components that haven’t reached EOL can be decommissioned prematurely to be replaced with newer PV components to improve electricity generation (e.g., modules with higher efficiency), avoid maintenance issues (e.g., hard to find and highly customized parts), and prevent electricity losses due to frequent faults in older components (Jean, Woodhouse, and Bulović Citation2019; Longi Solar Citation2018). This premature replacement is referred to in this industry as repowering. PV components such as the module and the inverter are typically repowered, whereby these and other decommissioned balance-of-system PV system components can be directly reused, repaired, and then reused or recycled.
The EOL phase offers multiple open-loop recycling alternatives. Research has demonstrated that materials recovered from PV modules can be reused in:
Building materials (Cerchier et al. Citation2021)
Ceramics (Lin et al. Citation2012)
Cement and concrete (Fernández et al. Citation2011; Guojian et al. Citation2015; Stehlík, Knapová, and Kostka Citation2019)
Tiles (Lin, Lee, and Hwang Citation2014)
Paper (Palitzsch and Loser Citation2011)
Geoploymers (Hao et al. Citation2015)
Bricks (Lin et al. Citation2013)
Medical applications (Qin et al. Citation2020)
LIBs (Eshraghi et al. Citation2020).
Of course, it is also theoretically possible to employ closed-loop recycling, but this has proven more challenging given high material purity requirements and other specifications that are hard to meet with EOL PV modules (Heath et al. Citation2020).
There are three key processes in the recycling of PV systems, which are understood with reference to :
System disassembly: The PV system is disassembled to remove the PV module from the balance of system (Ravikumar et al. Citation2016; Sinha et al. Citation2018). System disassembly, which occurs during the decommissioning operation, corresponds with the Decommission and Assess operation shown in . (Note that precautions should be taken to eliminate possibility of electricity generation during disassembly and storage.)
Module separation: The first objective of this step is to separate the PV module components (i.e., diodes, junction box, cables, frame) from the sandwich consisting of the silicon wafer and specialty materials (e.g., silver, lead, tin, cadmium, tellurium) held in between glass-backsheet or glass-glass layers (Latunussa et al. Citation2016; Sinha et al. Citation2018). The PV module components external to the backsheet and glass are typically removed through a mechanical process (e.g., cutting or a robotic arm) (Latunussa et al. Citation2016), which corresponds with the Disassemble operation shown in .
The second objective is to further separate bulk (e.g., glass, encapsulant, Si wafer, backsheet) and specialty materials from the sandwich. Processes used to separate the bulk and specialty materials include:
○ Mechanical (Latunussa et al. Citation2016; Sinha, Cossette, and Ménard Citation2012)
○ Chemical (Doi et al. Citation2001; Huang and Tao Citation2015; Radziemska et al. Citation2010)
○ Thermal (Jung et al. Citation2016; Lee et al. Citation2013; Wang, Hsiao, and Du Citation2012)
○ Optical (Palitzsch et al. Citation2018)
○ Cryogenic (Dassisti, Florio, and Maddalena Citation2017).
○ It is important to note that the degree of separation and the form in which a material is recovered varies based on the process used. For example, the Si wafer can be recovered intact through a chemical process (Lee et al. Citation2018a) or in a broken form through a mechanical process (Latunussa et al. Citation2016). The processes used to achieve the separation of bulk from specialty materials are represented in as part of the Community/Liberate and Separate operations.
• Purification/metal extraction: The separated materials from within the sandwich (e.g., Si wafer, silver, lead, tin, copper, cadmium, and tellurium) can be further purified through electrochemical (Huang et al. Citation2017), leaching and precipitation (Huang et al. Citation2016; Huang and Tao Citation2015; Sinha, Cossette, and Ménard Citation2012), solvent extraction (Mezei et al. Citation2008), or ion-exchange processes (Fthenakis et al. Citation2006). The purification/metal-extraction step corresponds to the Separate operation shown in .
In addition, the CE strategy of recover can be pursued in the EOL phase, wherein energy is recovered by the combustion of organic materials (e.g., ethylene-vinyl acetate and the backsheet) and used in the recycling process (Ardente, Latunussa, and Blengini Citation2019; Rubino et al. Citation2020). Sorting is required if the PV recycler accepts more than one PV technology as a part of the input waste stream (e.g., SolarRecyclingExperts in ). The Discharge operation in is not applicable to PV because PV modules do not store energy.
Enabling the CE for PV through digital platforms and information systems
Digital platforms and information systems can be leveraged to implement CE strategies across the different life cycle phases of a PV system (). These pathways are less mature than the material pathways, so we rely on non-peer-reviewed publications more heavily to document them. The emerging digital pathways for PV CE include:
Design for Circularity: The DfC strategy prioritizes circularity prospectively during the manufacturing stage through improved design. The CE strategies of refuse, rethink and reduce contribute to DfC (). Guidelines for design for recycling of c-Si PV modules have been proposed (Norgren, Carpenter, and Heath Citation2020) and are summarized in SI Section S4.3 for reference for the reader. (Comments on CdTe module design for recycling can also be found in (Norgren, Carpenter, and Heath Citation2020)). Different DfC options that have been explored to-date include using environmentally benign alternatives to hazardous materials (e.g., tin-bismuth instead of lead solders) (De Rose et al. Citation2017) decreasing the material requirements of PV manufacturing (e.g., eliminating ethylene-vinyl acetate) (Saint-Sernin et al. Citation2008), and designing the PV module to be more easily recyclable (e.g., using non-adhesive release layers) (Doi et al. Citation2003)). Alternatives to lead-based solders (e.g., electrically conductive adhesives (Oreski et al. Citation2021; VDMA Citation2020) and tin-bismuth-based solders) (De Rose et al. Citation2017) will help prevent the potential release of lead to the environment at end of life and could potentially prevent modules from being classified as hazardous waste, with its accompanying increase in cost of recycling and disposal. PV modules can be designed to include recyclable materials which enables more efficient recycling at end of life (DSM Citation2021).
One particular challenge in DfC are the laminates (e.g., encapsulants, the most popular of which is ethylene-vinyl acetate). They are integral to PV modules being able to withstand multiple decades of outdoor deployment anywhere on the globe, yet they make separating the layers and materials in the PV module sandwich challenging, resulting in it being an economic and environmental hot spot for PV recycling (Ravikumar et al. Citation2016, Citation2020; Bilbao et al. Citation2021, Cui et al. Citation2022). The economic and environmental burdens associated with recycling PV modules can be decreased (Norgren, Carpenter, and Heath Citation2020) by eliminating ethylene-vinyl acetate (Saint-Sernin et al. Citation2008), using non-adhesive release layers between the ethylene-vinyl acetate and the glass layers (Doi et al. Citation2003), and substituting ethylene-vinyl acetate with alternatives that can be eliminated at lower temperatures (Goris Citation2014) during recycling.
Labels of materials and other attributes: Digital technologies such as RFIDs, material passports, QR codes, bill of materials, and ecolabels (Arup Citation2020; Chowdhury and Chowdhury Citation2007) can help embed and communicate data on the material origin and constitution, design, and technical specifications of the PV system between manufacturers, installers, and recyclers. This communication and transparency of data can help stakeholders in the use phase to select appropriate maintenance and repair activities, and in the EOL phase to select suitable processes to transport and subsequently repair, refurbish, remanufacture or recycle the PV module.
AI and ML: Modern data methods can facilitate the CE strategy of refuse by aiding material selection decisions such as choosing alternatives to environmentally toxic and hazardous materials (Rajan et al. Citation2020) Web-based information systems and the internet have enabled the creation of PSS-based business models for PV systems such as leasing (Loritz Citation2018), coordinated supply of PV from remote generators to the grid (deX Citation2020), and access to PV electricity from the grid (Svatikova et al. Citation2015)
Performance diagnostic technologies: In the use phase, digital and information technologies can enable more efficient repair and thereby increase the functional life of in-use PV systems. Examples of using digital technologies for repair include electroluminescence imaging (Djordjevic, Parlevliet, and Jennings Citation2014) real-time performance monitoring (Rapaport et al. Citation2021) infrared thermographic imaging,(Tsanakas, Ha, and Buerhop Citation2016; Tsanakas et al. Citation2015) and AI-based diagnostic approaches (Haque et al. Citation2019)
Digital-based business models: Web and internet platforms (Hirshman Citation2016; Secondsol Citation2020) and blockchain (Hasegawa Citation2021) enable business models for the CE strategy of reuse wherein used PV modules procured from sellers in one location can be used by buyers from another location. Blockchain-based platforms can be leveraged to implement smart contracts and link the supply from decentralized producers with the demand of decentralized consumers of PV electricity (Petri et al. Citation2020)
Optimizing siting of EOL infrastructure through geospatial analysis tools: EOL PV waste is going to be increasingly sourced from geographically disperse installation locations. The economic and environmental costs of transportation, especially if PV waste is categorized as hazardous, increases with the distance to recycling facilities. As a result, there are trade-offs to analyze: small-scale decentralized facilities at the installation site could avoid transportation, while large-scale centralized collection could benefit from economies – of scale. Analytical tools such as geographical information systems and operational research methods can be used to optimally locate reverse logistics infrastructure to minimize the impact of PV recycling (Choi and Fthenakis Citation2010a, Citation2014; Goe, Gaustad, and Tomaszewski Citation2015; Guo and Guo Citation2019; Ravikumar et al. Citation2020)
Stakeholders in the CE for LIB and PV
A successful CE for LIB and PV requires the participation of diverse stakeholders, each of whom have different and often complementary functions.
For recycling in the CE, stakeholders include:
Collectors and processors who have important roles such as collecting, temporarily storing, and processing the waste before the PV modules or LIB systems are sent to the recycling facilities (Choi and Fthenakis Citation2014; Latunussa et al. Citation2016)
Entities such as waste management firms and metal recyclers which recycle LIB and PV systems along with other products (e.g., minerals, metals, electronics) (Cascade Eco Minerals Citation2021).
Organizations which specialize in recycling LIB and PV systems (Veolia Citation2021b; ROSI Solar Citation2022; We Recycle Solar Citation2022)
LIB or PV manufacturers who operate their own recycling facilities (First Solar Citation2021) or partner with external entities (Call2recycle Citation2022) to close the material loop.
Firms that recycle or upgrade/purify specialized materials contained in LIB and PV (e.g., semiconductor-grade Cd and Te for thin film PV, cathode materials for LIBs). (5N Plus Citation2021; Battery Resourcers Citation2022)
Associations of industrial, governmental, and nongovernmental (e.g., researchers, non-profit organizations) members who are seeking to expand the commercial markets for recycling by developing compliance services, standards, skills, research and development, and location-specific consulting services (SAE Citation2016, Citation2019; Call2Recycle Citation2021; ReCell Citation2021; PVCycle Citation2022, SSEIA Citation2022).
Owners of LIB and PV such as residential, commercial or utility PV and stationary LIB and electric vehicles, as well as installers (Carroll Citation2021)(Brasch and Kobold Citation2020). These owners and installers can accelerate a transition to a CE (e.g., through increased recycling rates) being affected by societal norms, peer influence, and incentives (e.g., rewards, warranties for used PV modules) (Hansmann et al. Citation2006, Tang, Zhang et al. Citation2019; Deng, Chang, and Green Citation2021; Walzberg, Carpenter, and Heath Citation2021).
Outside of recycling, stakeholders include
System owners, as well as commercial entities such as vehicle manufacturers who offer services to realize other CE strategies such as repair, refurbish, repurpose, and remanufacture of LIB and PV systems (Nissan Motor Corporation Citation2021, Mercedez-Benz Group Citation2022; Phoenix Renewable Services Citation2022; Rinovasol Citation2022).
PV installers and utilities who play an important role in informing the standards, regulations, or best practices for decommissioning (EPRI Citation2018), facilitating the repair and reuse of PV panels, reuse of secondlife LIBs in grid connected applications (Curtis et al. Citation2021c) and switching of installed PV panels for more efficient panels (i.e., repowering) (Zoco Citation2018).
Decision enablers for the CE for LIB and PV
Decision enablers include policy mechanisms, analytical frameworks, and technologies that can inform decisions and incentivize stakeholders when participating in the CE for LIB and PV systems.
Policy mechanisms include regulations, laws, voluntary standards, and guidance which can mandate, motivate, or incentivize various stakeholders to adopt a CE for LIBs and PV, and, conversely, sometimes through regulation or prohibition of linear economy options like landfilling. Regulations can incentivize recycling by requiring manufacturers to collect and manage end-of-life waste through reuse and recycling without cost to the owner (Washington State Legislature Citation2017), mandating a minimum mass to be collected and recycled (Chowdhury et al. Citation2020; Wambach Citation2012), defining best practices and standards for the various CE pathways (California Legislative Information Citation2018; Curtis et al. Citation2021c), and classifying the end-of-life system under specific waste categories to decrease compliance, transportation, and waste management costs (e.g., universal waste in the U.S. state of California) (Curtis et al. Citation2021a).
Through standards and guidance, the LIB and PV industry has voluntarily defined and adopted, to a varying degree, approaches to operationalize a CE, and thereby improve the sustainability of the LIB and PV industries (Curtis et al. Citation2021b; SAE Citation2016, Citation2019; UL Standards Citation2018; Wade et al. Citation2018). These standards are developed by engaging multiple stakeholders and building consensus (Curtis et al. Citation2021b). For example, the American National Standard Institute's NSF/ANSI 457 Sustainability Leadership Standard for Photovoltaic Modules and Photovoltaic Inverters enables a CE by incentivizing manufacturers through a points and rating mechanism to declare recycled material content, define the take-back process requirements at the end of life, and set targets for the different material components in a PV system (NSF International Standard/American National Standard Citation2019). Similarly, the Silicon Valley Toxics Coalition Solar Scorecard uses a points-based ranking system to enable a CE by incentivizing lower toxic material content and increasing transparency on extended producer responsibilities at EOL (Silicon Valley Toxics Coalition (SVTC) Citation2019).
Life cycle assessment (LCA) and techno-economic assessment (TEA): LCA (Cucchiella, D׳Adamo, and Rosa Citation2015, Cui, et al. Citation2022) and TEA (Cucchiella, D׳Adamo, and Rosa Citation2015; Lander et al. Citation2021, Cui et al. Citation2022) are widely used analytical frameworks to evaluate and improve environmental and economic outcomes, respectively, of CE strategies for LIB and PV systems. LCA and TCA have been found to be applied to
Recycling (Lander et al. Citation2021; Mohr et al. Citation2020; Ravikumar et al. Citation2020, Citation2016)
Remanufacturing (Deng et al. Citation2020; Xu et al. Citation2020)
Repair (Lunardi et al. Citation2018; Rajagopalan et al. Citation2021)
Repurpose (Foster et al. Citation2014)
Reuse (Rajagopalan et al. Citation2021; Richa, Babbitt, and Gaustad Citation2017).
LCAs and TEAs improve the sustainability outcomes of a CE by
Assessing the environmental (Aryan, Font-Brucart, and Maga Citation2018; Chung et al. Citation2021; Rocchetti and Beolchini Citation2015; Rubino et al. Citation2020) and economic (Choi and Fthenakis Citation2010a, Citation2010b; Cucchiella, D׳Adamo, and Rosa Citation2015; Mahmoudi, Huda, and Behnia Citation2020) impacts of CE strategies.
Identifying the most preferable CE technology or strategy from multiple alternatives (Deng et al. Citation2019, Cui et al. Citation2022)
Identifying environmental (Ravikumar et al. Citation2020, Citation2016; Xu et al. Citation2021) and economic hotspots (Deng et al. Citation2019, Cui et al. Citation2022)
Defining the most effective research and technology development strategies to address the hotspots (Lander et al. Citation2021; Ravikumar et al. Citation2020, Citation2016; Xu et al. Citation2021).
Technologies that can inform CE decisions: These include AI, ML, and blockchain. These have been explained in the sections above titled “Enabling the CE for LIB through digital platforms and information systems” and “Enabling the CE for PV through digital platforms and information systems.”
Renewable energy use for PV and LIB CE
As introduced in the “Scope of CE strategies” part of the Methods section, a CE is underpinned by a transition to renewable energy. That is because the sources of renewable energy are regenerative and constantly replenished, thus not depleting finite resources, and are supportive of a CE. Therefore, utilization of renewable energy in any part of a product’s life cycle is considered another CE strategy. The black circles in note which life cycle stages of LIB and PV have the potential for utilization of renewable energy. For an energy-generating technology like PV, the ideal scenario to increase climate benefits would be powering with PV throughout the PV supply chain (Ravikumar et al. Citation2014, Citation2017), which some PV manufacturers are starting to espouse (Ultra Low Carbon Solar Alliance Citation2020; Longi Solar Citation2022).
Impact on ecological services in the PV and LIB CE
All stages in the life cycle of LIB and PV are expected to have trade-offs between positive and negative impacts to ecological services. Based on the Ellen MacArthur Foundation conception of the CE, it is important to consider such trade-offs when accounting for restorative impacts of the CE to ecological systems (Ellen MacArthur Foundation Citation2022b). Impacts to air, water, or land ecological systems can result from emissions (Aryan, Font-Brucart, and Maga Citation2018; Sinha et al. Citation2019) and land use change (e.g., during decommissioning of installed PV systems) (Sinha et al. Citation2018).
Analysis and discussion of CE for PV literature
The current breadth of research on CE for PV is presented in , which show the distribution of publications across classifiers (). In the following, we discuss how observed tendencies in research can lead to possible missed opportunities within current scientific literature pertaining to CE for PV. At a high level, the state of the science in PV CE literature is observed to:
Overwhelmingly focus on recycling (and only a subset of current recycling challenges) over other CE strategies.
Place less attention on non-recycling CE strategies for PV, and the associated key challenges with operationalizing non-recycling CE strategies.
Prioritize technology development, deprioritizing many other aspects of a technology such as environmental, social, and economic performance as well as policy, regulation, behavior, and other considerations.
More often consider single-topic research, paying less attention to how attributes interact and can lead to trade-offs or synergies.
The balance across classifiers in for PV are, by and large, similar to those for LIBs (). There are some differences however, which will be discussed below. One key difference is the significantly higher count of publications passing our screens for LIBs than for PV. This means that in some cases, classifier pattern observations for PV are based on very small sample sizes, and should be understood as less definitive until more research confirms them.
PV module recycling and selected current challenges
The results in show that the emphasis on PV recycling is significantly greater than other CE strategies: Recycling publications are greater in number than all other CE strategies combined, and even more skewed than for LIBs (). With regard to the prevalence by PV technology for certain CE strategies, including recycling, it is interesting to note the higher-than-market-share prevalence of CdTe publications. This is likely because the company manufacturing most of the world’s CdTe runs its own recycling program and has been notably open about its practices. By contrast, prevalence by chemistry for LIBs () roughly followed market share. However, the proportion of publications studying c-Si for each CE strategy generally reflects the overall technology prevalence of c-Si publications passing our screens (approximately 70%).
Figure 17. Prevalence (counts) of CE strategies reported in original research publications (columns) along with corresponding prevalence (percentage) for PV technology in each CE strategy (pies). (See for explanation of “Exclusive” and “Multiple”. (n = 160). Note that for the pie charts, a given publication may report multiple technologies).
A time series of CE strategies shows that 2021 is the only year displaying substantial interest in non-recycling CE strategies (), with the exception of recover which has been studied fairly consistently since 2015. Reuse and repair have been the subject of a few studies since 2010. Also, the first publications on repurpose appear in 2021. Increasing volumes of decommissioned PV panels, including those with remaining capacity greater than the common warranty level of 80% rated nameplate capacity, should motivate more research into non-recycling CE strategies such as repair and reuse. Preliminary estimates suggest that 80% of decommissioned PV modules are younger than 4 years from the date of manufacture, and that 45–55% of these modules can be repaired or refurbished (Tsanakas et al. Citation2020).
Figure 18. Annual count of the different CE strategies for PV systems which were reported in original research publications from 2000 to 2021. (n = 160. Note that publications that analyze multiple CE strategies were counted under each. The counts account for c-Si and CdTe, as well as publications that did not report which technology they studied. Year of publication reflects a journal’s planned official publication date, even if made available on-line earlier).
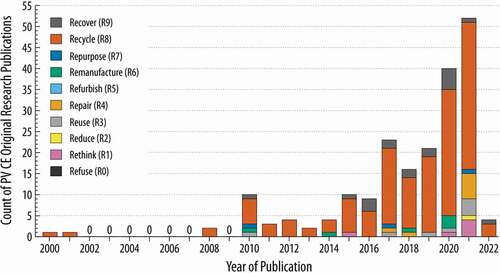
As stated in the LIB section, recycling is an important CE strategy and is a backstop to avoid landfilling after other strategies have been exhausted. Yet, current literature’s overwhelming emphasis on recycling is somewhat misguided. Non-recycling CE pathways are generally preferred in the CE hierarchy because they usually retain a greater proportion of the value of the original products, and amortize the input energy, emissions, and materials over a longer lifetime yielding higher lifetime generation (Ellen MacArthur Foundation Citation2022b). We refer the reader to the corresponding LIB section above for additional discussion points that apply equally to the case of PV.
With the clear focus of recycling in the PV CE literature, there are also many articles reviewing the state of published recycling research (Chowdhury et al. Citation2020; Heath et al. Citation2020; Sica et al. Citation2018). Instead of attempting to repeat the depth of attention those articles provide to the topic, we focus on just three main challenges we observed in the current status of PV recycling, in order to give equal attention to the smaller body of literature on non-recycling CE strategies. The three observations are that:
There is no integrated process to recycle all materials in a c-Si PV module.
Challenges and opportunities exist in recycling energy-intensive solar-grade silicon.
Cost is perhaps the greatest challenge for increased adoption of PV recycling.
Lack of an integrated process to recycle all materials in a c-Si PV module
The results in ) show that there is a significant emphasis in extant research on recovering bulk materials such as the aluminum frame, glass, junction box, and the silicon wafer from c-Si modules. Not only does the higher mass fraction make them easier recycling targets, but focusing on them enables compliance with mass fraction-based recycling regulations, where they exist (Tsanakas et al. Citation2020). A largely separate set of publications have focused on the recovery of specialty materials such as solder metals (e.g., lead, tin) or precious metals like silver to increase revenues from recovered materials. An analysis of c-Si publications over time ()) illustrates an initial emphasis on bulk materials, later adding specialty materials. Similar results are observed for CdTe PV modules ()).
Figure 19. Materials recovered from recycling (A) c-Si PV modules (n = 69 publications), and (C) CdTe modules (n = 30) based on counts of publications reporting original research; and annual count of original research publications by the materials recovered from recycling of (B) c-Si PV modules and (D) CdTe PV modules. Note that the encapsulant is typically EVA, and “Al/Cu” refers to aluminum and copper inside of the module. (11 c-Si and 23 CdTe publications which studied recycling did not report the recovery of any material and thus were excluded from the graphs. See for explanation of “Exclusive” and “Multiple”).
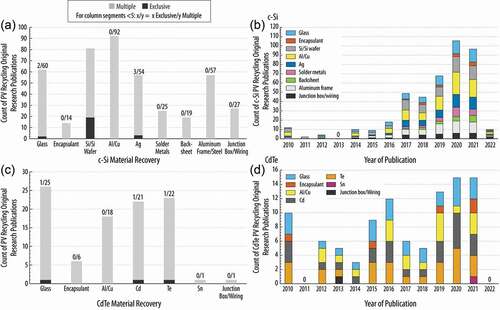
However, currently there is no commercial-scale integrated process to recycle all of the materials – both bulk and specialty – in a c-Si PV module (Heath et al. Citation2020). This can be seen in Figure S20 which displays the precise combination of materials each recycling publication asserts it can recover. An integrated process that recovers both the bulk and specialty materials will ensure complete circularity of the PV module and meet potential new regulations requiring such recovery (Heath et al. Citation2020; Cui et al. Citation2022). Note that CdTe recycling, which is dominated by CdTe's largest manufacturer and is now in its third commercial-scale design, does recover all materials (Search for “First Solar” here: https://www.cdp.net/en).
Challenges and opportunities in recycling energy-intensive solar-grade silicon in silicon manufacturing
The increasing focus over time on recovering Si ()) can be attributed to solar-grade Si representing 25% of the cost (VDMA Citation2019) and 40–50% of the embodied energy of a Si PV panel (Peng, Lu, and Yang Citation2013). Though likely improved in practice, prior research suggests that 40–50% of the solar-grade silicon is lost as kerf, top cut and bottom cut from a purified silicon ingot (Bronsveld et al. Citation2013; Yang et al. Citation2019).
We identified two broad approaches to mitigate solar-grade Si losses in cell manufacturing: (1) Reduce the kerf losses by applying sawing methods that are less wasteful (Kumar and Melkote Citation2018; Schwinde, Berg, and Kunert Citation2015) or by developing kerf-free wafering processes (Henley et al. Citation2011); and (2) recover and reuse silicon from kerf (Li et al. Citation2021a; Wang et al. Citation2008) and recycle and reuse the silicon from ingot cuts. However, impurities in ingot cuts and kerf can degrade cell performance (Davis et al. Citation1980). Further research is needed to investigate and characterize the type and level of impurities in ingot cuts and kerf and how these compare with those in virgin solar-grade silicon (SEMI Citation2012). Optimizing methods of recovery of ingot cuts and kerf to minimize impurities (Drouiche et al. Citation2014; Li et al. Citation2021a) and evaluating any trade-offs in PV cell performance, economic costs, and environmental impact from replacing virgin solar-grade silicon with secondary silicon across a broad range of silicon manufacturing conditions could improve CE outcomes for Si PV modules (Heath et al. Citation2022). In addition, the supply of kerf as feedstock in open-loop recycling to allied industries (e.g., hydrogen production (Kao, Kao, Huang, and Tuan Citation2016), lithium-ion batteries (Kim et al. Citation2019)) may be economically and environmentally preferable to landfilling.
Cost is perhaps the greatest challenge for increased adoption of PV recycling
Although there are other important factors, especially socio-behavioral (Walzberg, Carpenter, and Heath Citation2021), as stated above, cost is a critical metric influencing adoption of CE strategies. Publicly available data, albeit limited, indicate that the value obtained from recovered materials of PV modules does not exceed the cost of recycling (Deng et al. Citation2019; Rubino et al. Citation2020; Tao et al. Citation2020, Cui et al. Citation2022), which may be the most significant challenge to scaling recycling capacities to manage the projected increase in PV waste and operationalize a CE for PV. The lack of cost-revenue balance is further aggravated by the absence of robust analysis on how heterogeneity in the design of PV modules (e.g., double glass versus backsheet glass, fluorinated versus non-fluorinated back sheets) will impact the recyclability of modules and the economic sustainability of future recycling operations. For example, decreasing silver content in PV modules (VDMA Citation2020) will lower the recycling revenues from resale of recovered materials and further increase the challenge of making PV recycling profitable. Similarly, the use of Tedlar backsheets, which contain fluorine, may increase the cost of high-temperature recycling operations by requiring additional emission control equipment to manage fluorinate emissions (Aryan, Font-Brucart, and Maga Citation2018).
Challenges in non-recycling CE strategies for PV
The disproportionate emphasis on recycling leaves many unanswered questions and challenges for non-recycling CE strategies, a selection of which are discussed below. Addressing them can aid the successful scaling of CE for PV.
Refuse
Potential trade-offs are a key concern with regard to increased adoption and impact of the refuse CE strategy. We find that several performance-related trade-offs are less frequently studied, such as economic, material availability, and environmental trade-offs, yet are important to achieving the goals of a CE. Additional studies will be necessary to draw more definitive conclusions and identify options with the greatest benefits and fewest trade-offs.
An example of an environmental trade-off is that while the elimination of toxic and critical materials can generate environmental benefits in certain life cycle phases (e.g., at end of life) and improve rankings per sustainability standards (such as the Sustainability Leadership Standard for PV Modules and Inverters (NSF International Standard/American National Standard Citation2019)), it can also degrade the panel during the use phase due to a decrease in durability or performance. This could result in decreased electricity generation and lower revenues, and increased operations and maintenance costs (see below).
Further examples of refuse strategy performance-related trade-offs that we found in the literature include:
Fluorine-free backsheets could have lower durability than fluorinated backsheets (DuPont Citation2020).
Replacing silver with copper metallization could negatively impact the durability and performance of the Si PV module (Phua et al. Citation2020).
Replacing indium tin oxide with Al-doped zinc oxide could impact the durability and conductivity of this layer (Zhang et al. Citation2021).
Frame-free designs for PV modules can negatively impact the economic feasibility of downstream PV recycling operations since revenues from resale of recovered aluminum are significant (DAdamo, Miliacca, and Rosa Citation2017; Deng et al. Citation2019).
Lead-free and low-temperature soldering alternatives may have lower thermal fatigue resistance than conventional lead-based solders (Spinella and Bosco Citation2021), which could impact module durability and performance.
A consequence shared by many of the above-listed trade-offs is degradation of the panel during the use phase, which could result in increased operations and maintenance costs and decreased longevity leading to decreased electricity generation. This in turn leads to lower revenues as well as increased environmental impacts per unit generation (which is the typical unit of comparison for LCAs).
We also note that the inclusion of novel materials in the design of PV modules as a part of the refuse strategy will require continuous review of the relevance, accuracy, and applicability of existing technical standards. For example, it has been found that new standards may be required to more accurately test the performance of lead-free solders (Spinella and Bosco Citation2021).
Reduce
Another underrepresented strategy in the extant PV CE literature is the reduce strategy. Here, we found concerns that dematerialization poses trade-offs in other life cycle phases and to other CE strategies. For example, the continual thinning of silicon wafers (VDMA Citation2020) could negatively impact recycling revenue once recycling companies find markets for recovered silicon. This is analogous to the previously mentioned silver content reduction and its already-observed impacts on recycling economics (Crownhart Citation2021).
Remanufacturing
The main remanufacturing strategy for PV modules found in the literature is the recovery of intact silicon wafers as substitutes for virgin wafers. This strategy, while demonstrated as possible in the laboratory (Frisson et al. Citation2000), has numerous practical, economic, performance, and environmental challenges (Heath et al. Citation2020). Heath et al. (Citation2020) went so far as to title a section of their article “Deemphasize research and development on recovery of intact silicon wafers.” Tao et al. suggest there might come a time in the future when recovery of intact wafers could be used in new modules (Tao et al. Citation2020), but considerable research and investment would be required to commercialize. For instance, we find that is first necessary to perform research on the key process concerns for manufacturers and to ensure that recovered Si wafers meet manufacturing purity requirements.
Repair and Reuse
A broad set of challenges prevent wider adoption of repair and reuse of a PV module. Cost is the key barrier, which manifests in two forms. First, what little is publicly reported about the cost of repairs suggests they are high: Total repair costs are estimated to vary between €20 and €90 per module in Europe (Tsanakas et al. Citation2020), with unknown variability in these costs by geography. Even when modules can be directly reused (no repair required), the value proposition can still be challenging for many second use scenarios (Lunardi et al. Citation2018; Rajagopalan et al. Citation2021). Second, a primary alternative to repair in jurisdictions without regulatory preclusions is landfilling, which is inexpensive in a relative sense, especially in the United States. Low-cost alternatives disincentivize private investments to scale up repair operations, which could be a solution to reduce their cost (ASES Citation2020; CPUC Citation2019; CSSA Citation2020; Curtis et al. Citation2021a). Furthermore, costs of repair have only been reported for certain components (e.g., bypass diode, junction boxes) and not others (e.g., backsheets), which calls for more comprehensive research and commercial analyses (Heide et al. Citation2021; Voronko et al. Citation2021)).
An additional issue confronting repair is spare parts. Beyond theoretical estimates (Walker et al. Citation2020), there is no empirically grounded research on how a diverse range of spare parts can be sourced in a timely, operationally feasible (e.g., storage space for spare parts) (IFC Citation2015), and economic manner to repair fielded modules, which span decades from the year of manufacture. The lack of suitable spare parts can make repair of PV modules infeasible and make recycling or landfilling unavoidable.
Lack of ability to finance, insure, maintain warranty, and obtain permits for second use PV modules significantly inhibits growth of this market (Curtis et al. Citation2021b). It is generally viewed that to address these impediments, standards for safety, durability, and performance will be required, underpinned by the development of testing procedures (Curtis et al. Citation2021b; Heide et al. Citation2021). Such standards could help to develop objective pricing mechanisms, design robust business models, and enhance customer trust (Tsanakas et al. Citation2020). Separately, we note that it is important to ensure that if PV modules are sold or donated, that the recipient is in a location with access to repair and recycling facilities. This is to avoid a short circuit to landfilling simply in another location that perhaps does not have adequate environmental safeguards. We also note that this is another value proposition for digital systems (e.g., RFIDs) to track and monitor the flow of second life PV modules globally.
Rethink (product-service system (PSS))
There are also challenges to realizing the rethink strategy of PSS for PV systems. Whereas third-party ownership is a common business model in the United States, it is not in other countries, and there is a lack of research on how PSS affects PV circularity. We note that the PSS business model can help to increase the share of PV owned by low- and medium-income households (O’Shaughnessy et al. Citation2020).
Research beyond technology development for PV
Environmental and economic analyses
Despite a significant number of publications () and Figure S30 (E)), we identify persistent methodological challenges in the application of LCAs and TEAs to CE strategies for PV systems. There is a lack of quality data on the bill of materials and unit processes that are required to accurately model the environmental and economic impacts of CE strategies through LCAs and TEAs. This is especially true for non-recycling CE strategies, which have not been as widely studied and commercialized as recycling (Rajagopalan et al. Citation2021; Tsanakas et al. Citation2020). Uncertainty in inventory and process data, which is typical of low-technology readiness level CE technologies, introduces uncertainty and variability in LCA (Ravikumar et al. Citation2020) and TEA results (Deng et al. Citation2019; Dias et al. Citation2021), and thereby uncertainty in the decision-making process (e.g., choice of the best CE strategy, best approach to improve a CE strategy). Assessing sustainability impacts of CE strategies requires a broader systems perspective as CE strategies can generate economic or environmental benefit in one life cycle phase while introducing burdens in another. For example, a decrease of silver content in the manufacturing phase (Hamann et al. Citation2013; Karas et al. Citation2020; Oreski et al. Citation2021) can make the manufacture of modules cheaper but can also negatively impact the economic feasibility of recycling operations by decreasing the revenues earned from resale of recovered silver.
Figure 20. Counts of PV CE publications based on the classifiers listed in : of Indicators (A), Life Cycle Phase (B), Scope of CE Strategy (C), Scale of Operations (D) or Study Type (where E includes all publications and F just reviews). (See for explanation of “Exclusive” and “Multiple”, and for explanation of abbreviations and acronyms. Count of analyzed publications in panels A–D is 160 original research publications, panel E is 181 total publications, and panel F is 21 review publications, all of which passed the four screens. Since reviews were further classified in (F), they were considered their own study type in (E) and categorized exclusively as reviews. Some publications were not able to be classified when they did not report that aspect. For each panel, publications not reporting, and thus excluded from the count displayed, are: (A) = 71; (D) = 8); with all of the other panels = 0 publications not reporting. Note that since a given publication could have analyzed both PV technologies, that publication will count towards both in the pie charts of panel D).
Variability, which is introduced through multiple factors across the life cycle and across different CE strategies (e.g., scale of operation, change in module design, geographical region of operation) can impact the results of LCAs and TEAs and needs to be robustly accounted for. For example, the electricity consumed by a CE strategy, that electricity’s CO2 intensity, cost and displacement (e.g., electricity avoided by second life PV systems in reuse) varies by geography, which introduces variability in the results of the TEA and LCA. Also, there may be trade-offs across different environmental impact categories (e.g., GHG emissions, water use, land use) as well as between the environmental and economic performance of various CE strategies. For example, a recent study showed that a novel thermal process to recycling CdTe PV systems is preferable to the currently deployed process, but while being preferable in nine environmental impact categories, the process is worse off in the ozone depletion category (Ravikumar et al. Citation2020). It is beneficial to be aware of such trade-offs ahead of time so more optimal choices can be made and remaining trade-offs accepted.
Recent advances in LCA and TEA can be leveraged to address the above-mentioned methodological challenges and improve the robustness of their findings. These include:
Anticipatory LCA (Wender et al. Citation2014), which has methodological features that can better evaluate low-technology readiness level technologies.
Advanced methods of uncertainty and sensitivity analysis to better account for data uncertainty and variability (Cucurachi, Borgonovo, and Heijungs Citation2016; Ravikumar et al. Citation2018; Wender et al. Citation2017)
Methods of multi-criteria decision analysis (Prado-Lopez et al. Citation2013, Citation2016) that can better evaluate and account for trade-offs across economic and environmental impacts (and others).
Policy and regulatory gaps in CE for PV
Research on policy and standards for non-recycling CE strategies ()) and recycling (Figure S30 (E)) for PV has been less frequent than technology development, LCA, and TEA. As a result, knowledge gaps persist in policy and standards which can hinder the adoption of different PV CE strategies such as reuse and repair. As explained in the previous section, we discuss potential knowledge gaps in the non-recycling and recycling CE strategies that can be addressed to improve the CE outcomes for PV.
Non-recycling CE strategies: It has been observed that there are no publicly available data on policies regarding the legal liability associated with installation or use of repaired modules (Curtis et al. Citation2021a). From our review we propose that some of the key questions needing clarity include: Who bears legal liability – the original equipment manufacturer, the entity repairing the module, or the owner in the second life? How will existing fire, electric, and interconnection codes impact the use of repaired modules in rooftop and grid-tied settings? Will original manufacturer certifications for reliability apply to repaired modules? We also direct the same questions to the reuse CE strategies. Addressing these questions and others could help to accelerate the repair and reuse of PV systems.
Recycling: The low number of publications on policy and standards for PV recycling (Figure S30 (E)) has resulted in knowledge gaps that can impede scaling of PV recycling. Variability in regulations and how they apply to PV waste can introduce uncertainty in how EOL PV systems are collected and managed prior to recycling. For example, a lack of clarity as to when a PV system becomes a waste to be regulated by the Resource Conservation and Recovery Act of 1976 (RCRA) has been observed (Curtis et al. Citation2021a). The PV system can potentially be defined as waste after the end of first life when it’s decommissioned or after the second life (e.g., after repair and reuse). This determination impacts who is subjected to the RCRA regulations (e.g., owner of PV systems at the end of first or second life) and processes used to manage the PV systems between the first and second life. Another important policy question is if the RCRA household hazardous waste exclusion applies to residential PV systems, which impacts how the PV module can be collected and disposed and who bears liability. In addition, there is a lack of consensus around standardized testing protocols to assess the toxicity compliance and classify PV modules into hazardous and non-hazardous waste categories (Curtis et al. Citation2021b). Waste categorization of PV modules impacts choice and cost of downstream processes like transport and storage, which precede module recycling. Finally, regulations for bulk PV materials can drive increased recycling and impact siting decisions for recycling infrastructure. For example, potential future regulations restricting import and export of metal scraps such as aluminum and copper could lead to a need for increased capacity in local recycling operations for the aluminum and copper contained in the PV module (Reuters Citation2020; S & P Global Commodity Insights Citation2021).
We posit that the above knowledge gaps can be addressed through future research that engages multiple stakeholders, elucidates their viewpoints, and identifies key regulatory challenges that hinder PV recycling, as such input can inform policy makers of priority stakeholder needs in terms of regulatory clarity.
Social and behavioral aspects of the CE for PV
The results in ) show that quantifying the social impacts and behavioral aspects of the various stakeholders () on the CE for PV is limited. We make similar observations for PV recycling (Figure S30(A) and S30(E)). The following bullets discuss opportunities to address knowledge gaps in social and behavioral aspects that we identified in our review that could potentially improve the CE for PV. Given that recycling dominates existing PV CE research and is relatively more commercially mature than non-recycling strategies, we separate the discussion for recycling and non-recycling CE strategies.
Non-recycling CE strategies: We identified key knowledge gaps for (1) the social drivers that influence the effectiveness of a CE for PV and (2) the social impacts that are realized after a CE for PV is implemented.
From a social drivers perspective, there is a lack of a robust understanding of customer attitudes (e.g., public perception and awareness towards PV recycling) (Daniela-Abigail et al. Citation2022) which can prevent a successful rollout of a CE (Walzberg, Carpenter, and Heath Citation2021). To enhance stakeholder participation in a CE for PV, it is vital to identify stakeholder concerns (Salim et al. Citation2019) and preferences (e.g., through interviews and surveys (Daniela-Abigail et al. Citation2022)) (Marjamaa et al. Citation2021) and identify strategies to effectively communicate the goals and benefits. We find that further research is required on how diversity in existing policies, market incentives, price sensitivity to secondary PV panels, and purchasing power in the secondary markets impacts a CE for PV. A better understanding of customer preferences and market conditions will help develop more effective business models (Svatikova et al. Citation2015), which will increase profitability and social acceptance for the CE for PV. Tools in socio-technical analysis such as agent-based modeling and systems dynamics modeling can be applied to help incorporate stakeholder preferences, quantify the effectiveness of various incentives (e.g., policy incentives, pricing), and simulate CE outcomes for PV (Skeldon et al. Citation2018, Beaudet, Larouche et al. Citation2020; Walzberg, Carpenter, and Heath Citation2021; Putri and Kusumastuti Citation2021; Walzberg et al. Citation2022).
From a social impacts perspective, despite emerging studies (Markert, Celik, and Apul Citation2020), we find a lack of robust and comprehensive analysis on the social impacts of a CE for PV. Potential social impacts that would benefit from further investigation include the creation of employment opportunities, decrease in energy poverty through lowering the cost barriers to access PV (e.g., secondary PV modules), and prevention of environmental release of hazardous materials (Mies and Gold Citation2021; Vanhuyse et al. Citation2021).
Recycling: We find that further research is required to understand the potential jobs that can be created from recycling PV operations and trade-offs from automation (e.g., loss of employment versus reduction in labor costs). Obtaining robust estimates of employment opportunities through PV recycling is especially important as PV is one of the fastest growing job creating sectors in the United States (Bureau of Labor Statistics Citation2021). We find that beyond aggregated employment estimates, there is a need for in-depth analysis to create a repository of job profiles and the required expertise and skills to develop an effective PV recycling workforce. Such analysis could help develop and roll-out the training programs required to develop the workforce. Workforce development will require a strong collaboration between multiple stakeholders such as PV manufacturers and recyclers, waste management industry recyclers, policy makers, non-governmental organizations, national labs, and universities. Further research is required to address the knowledge gap on the human health and social and environmental justice outcomes of PV recycling operations. PV recycling prevents the illegal exports of EOL PV panels (Bellini Citation2020), which is a persistent problem, and avoids the negative human health impacts from waste management, which have disproportionately impacted low-income and minority communities (Burwell-Naney et al. Citation2013; Kramar et al. Citation2018; Maranville, Ting, and Zhang Citation2009; Martuzzi, Mitis, and Forastiere Citation2010; Mohai and Saha Citation2015).
Expanding research focus to be more holistic
The count for studies focusing exclusively on one classifier (marked “Exclusive” in our figures) is significantly higher than those considering multiple classifiers (marked “Multiple”) for sub-classifiers with a high publication count (e.g., End of Life in ), Nano in ), Lab in )). This indicates a narrow focus on certain sub-classifiers with a lack of simultaneous analysis on how the CE for one sub-classifier impacts other sub-classifiers.
Moreover, the field would benefit from incorporation of a broader and combined set of indicators to assess different CE strategies. The most widely used CE indicator in the current PV CE literature is mass ()). This can be attributed to publications typically using mass-based indicators to quantify the amount of materials recovered through PV recycling (Granata et al. Citation2014; Huang et al. Citation2017), which is the most dominant CE strategy for PV (). However, lifetime extension indicators are better suited than mass-based indicators to quantify the effectiveness of many CE strategies such as repair, refurbish, and reuse which increase the functional life of the PV module and are increasingly being adopted in the PV market. Similarly, effort-based metrics are better suited to quantify the effectiveness of CE strategies which require human labor. For example, an effort-based metric quantifying the amount of time required to disassemble a PV module can be applied to compare and rank different design-for-recycling approaches, which is a part of the rethink CE strategy.
Even for recycling, we note that a combined set of indicators can more holistically assess the effectiveness of the circularity of recycling processes. Cost is a crucial determinant of manufacturing viability and consumer adoption, and identification of cost-intensive process steps (whether in recycling or manufacturing) can help prioritize research and development efforts. While important in their own right, effort indicators can be valuable inputs to make TEAs more accurate and impactful. Effort-based indicators can identify labor-intensive steps in the recycling processes, the potential for automation to decrease effort, and the potential to proactively decrease labor requirements through design for recyclability. For example, PV module designs without ethylene-vinyl acetate can make the disassembly of the PV module less labor- and time-intensive. Unlike mass-based indicators which incentivize the recovery of bulk materials that contribute a significant share of the mass of the PV module, economic indicators emphasize the recovery of trace materials which are economically valuable but make an insignificant contribution to the mass of the module (e.g., silver). As a result, combining mass- and economic-based indicators can help identify more integrated and complete recycling processes which recover both bulk and economically valuable materials from a PV module.
Necessity for robust estimates of global volumes of EOL PV
The lack of robust and regularly updated projections of PV reaching EOL hinders entities from opening or scaling commercial PV CE operations (e.g., recycling, reuse, and repair). One way this challenge can be addressed through open-source and dynamic modeling approaches (Ovaitt et al. Citation2021, Citation2022). To ensure relevance to industry, these projections should be reported at investment-relevant spatial resolution (e.g., sub-state scale), updated at least annually, and report not just total module mass but amounts of individual materials inclusive of all components in the PV system (Heath et al. Citation2020). These projections should be informed by data sources and inputs from various stakeholders regarding: installed and decommissioned capacity, technology, location and age; module reliability differentiated by year of manufacture, technology and region of installation; bill of material and design differentiated by manufacturer, technology, and year of manufacture; and projections of extreme weather events (Heath et al. Citation2020; Ovaitt et al. Citation2022). Such approaches should then be able to inform investors, regulators and analysts on decisions on sizing, location and choice of technology for PV recycling facilities.
Assessing CE at the macro scale is underrepresented
A significant share of the CE publications in our analysis focus on the nano scale (), Figure S30(C)). Research investigating the macro scale wherein CE strategies are implemented at the level of city, state, nation, or world, is underrepresented in the literature. This will become more important in the future considering that deployment is expected to become more geographically disparate (DOE Citation2021). Especially in the near term when EOL volumes are low, to minimize prices, economies of scale will require serving larger geographic regions. Such operations will need to consider distance and jurisdiction-dependent variations in operational expenses, market and pricing mechanisms, regulations, and the complexity of transporting PV waste across state and national boundaries. Despite the complexity, variations due to the above factors offer opportunities to modify and optimize CE operations for specific geographies. For example, as explained in the section titled “Enabling the CE for PV through digital platforms and information systems,” PV recycling can be conducted at scales ranging from decentralized in-situ recycling to centralized operations in order to balance trade-offs of transportation distance and economies of scale. Additionally, the macro scale may offer opportunities to adopt open-loop recycling (e.g., through industrial symbiosis (Mathur, Singh, and Sutherland Citation2020)) when closed-loop recycling for certain materials is not possible in specific geographies.
Conclusion
This critical review is motivated by the potential for dramatic growth of two clean energy technologies – photovoltaics and lithium-ion batteries – and the desire to sustainably manage both the increased demand for materials and their handling at each technology’s end of life. A circular economy aims to address such issues by avoiding the waste endpoint of our current linear economy’s take-make-waste path. Instead, a circular economy closes loops such that raw materials, components, and products lose as little value as possible over many lifetimes of use; prioritizes renewable energy sources; and employs systems thinking at its core (Het Groene Brein Citation2022). A CE is a proposed approach to mitigate the expected growth in greenhouse gas emissions from increased demand for virgin materials, reduce the environmental and social impacts of material extraction, and address the United Nations Sustainable Development goals, especially Goal 12: Sustainable production and consumption (Geng, Joseph, and Bleischwitz Citation2019). Yet, despite its intuitive attractiveness and broad purported benefits, circularity should not be a goal in and of itself; it is an approach to achieving these other goals. It also entails trade-offs – examples of which were identified in this article and for which a holistic, systems-based analytical approach will be required to further elucidate. Moreover, because a CE is a completely different economic model from current, it will be challenging to achieve even with the necessary effort of all corners of industry, government, civil society, and individuals.
This critical review embarked to understand the status, challenges, and opportunities of a CE for LIB and PV. We have completed what we believe to be the most comprehensive review to-date in this domain, identifying 3,111 potentially relevant archival journal articles, book chapters, and government reports, and then classifying and analyzing the 444 LIB and 181 PV CE publications that passed through four objective screening stages. We additionally utilized many supplemental publications, websites, and trade journal articles to bolster understanding, especially about current practices.
The state-of-the-science systematic review method we employed (PRISMA) was chosen because of its demonstrated capability to collect maximal information with minimal bias, which achieves both transparency and reproducibility. Our method is unique compared to the many other prior reviews that partially overlap ours in that we assessed all 10 CE strategies across all three life cycle phases and catalogued for the first time both material and digital CE pathways. Based on objective classification of 70 study dimensions and subsequent analysis of the 43,820 potential data points, we hope this review can form a solid foundation from which others can develop targeted and impactful future research.
We considered both LIBs and PV in this review because they have synergies leading to increasing co-deployment and are both key technologies in the energy transition. What we have learned is that they also share roughly the same status, challenges, and opportunities with regard to advancing toward a CE. Thus, while noting differences, this conclusion addresses both together.
Key findings
Those coming directly to the conclusion section might arrive with a few questions about the state of the science. Here we seek to answer some of the most naturally occurring and relevant questions based on our assessment of the totality of the current literature analyzed in this study.
First, have we achieved a circular economy for LIB and PV yet? Not yet. However, the increasing awareness and growing body of research we have documented indicates that researchers and decision makers in industry and government are actively seeking to better define the scope of the challenges and develop technical and policy solutions.
Are PV and LIB moving toward a CE? Yes. While the CE is immature with regard to both technologies and their industries, progress has been made. A few examples can illustrate this. Recycling technologies have been developed and to a limited extent deployed. Yet they are, by and large, not economically sustainable in current form and are certainly not at the capacity nor properly sited to have the impact that is needed now and in the near future to support a CE. Regulatory frameworks for recycling, and to a lesser extent other CE pathways, have been developed in some world regions but lack the breadth and depth necessary to fully support CE strategies, and are not consistently applied across jurisdictions (e.g., across European countries or across states within the United States).
Is academic research the only area of activity in CE for PV and LIB? No. We have documented just a sample of the developments in industry, which we believe are substantial and growing. Also, government policies are increasing, some of which are also documented herein, and more so in the references we cite.
What research and other programs can help make a CE for PV and LIB succeed? We provide many detailed suggestions in the body of this article. High-level observations from our literature review point to very similar recommendations for both an LIB and PV CE:
Expand research beyond recycling. Recycling is an important CE strategy that helps decrease the reliance on environmentally intensive virgin raw materials and is a backstop to avoid landfilling after other strategies have been exhausted. However, an overwhelming focus on recycling within CE literature for both technologies is disproportionate to the hierarchical preference for other CE pathways that can have superior environmental and social outcomes to recycling. The emphasis on recycling will miss the challenges and opportunities that could be revealed by research on other CE pathways. This is not to say that we believe research on recycling should stop; rather, that attention to other CE strategies should increase, which is beginning to happen and we believe should accelerate as the amount of decommissioned PV modules and LIBs increases. Non-recycling CE strategies are often preferred because they retain a greater proportion of the value of the original products and have typically been shown to yield greater environmental and economic benefits.
Support technology deployment with economic, environmental and policy analysis. Non-technological aspects of a CE are understudied – such as the role of social, environmental, and economic influences – when compared to the proportion of literature on technological innovation. Development of technologies, whether material or digital, is necessary but insufficient to achieve a CE. The adoption of such technologies determines the extent that a CE succeeds in achieving its purported benefits. First and foremost, adoption requires favorable economics, especially in markets without mandates like the United States and most of the rest of the world. Even for markets without specific mandates, policies and regulations can play a critical role in shaping the marketplace and technology adoption. For instance, policies incentivizing eco-industrial parks based on the principles of industrial symbiosis, wherein materials recovered from PV and LIB can be used in manufacturing other products (e.g., open loop pathways in ), can establish a market for recovered materials and support the adoption and scaling of recycling technologies and the CE for PV and LIB. Likewise, behavioral and environmental aspects of CE strategies should not be overlooked; for example, since promised environmental benefits are a chief motivator for supporting a CE, these benefits must be proven and documented. However, all of these non-technological aspects are significantly understudied – even for recycling, but especially for other CE strategies – compared to the development of technologies and characterization of their technical performance. Research and implementation of these non-technological aspects are important to inform decisions, enable participation, and enhance knowledge for a diverse set of stakeholders.
Leverage digital information systems. Circular economy strategies deal not only with physical products, components, and materials, but also digital. Digital platforms and information systems can be leveraged to implement and improve CE strategies across all three life cycle stages. These strategies include designing for enhanced circularity; digitally labelling materials and other attributes for downstream entities; and using artificial intelligence or machine learning-enabled technologies for such activities as selecting alternative materials and monitoring performance to identify repairs and optimize operation, automating sorting at end of life, and employing digital-based business models to track PV modules for remote ownership or assure buyers of avoidance of child labor in mineral extraction. This is the first review to include mapping of digital CE pathways alongside material ones, and we find that digital pathways deserve more attention to explore their technical potential, benefits and trade-offs.
Improve recycling technologies. We provide the following three observations of current challenges for recycling PV and LIBs. First, there is a lack of integrated recycling processes that can recover all constituent materials. Second, cost remains the greatest challenge for increased recycling in countries that have not mandated recycling. Third, research has focused more on lab-scale applications and will need to account for potential challenges that emerge in the transition to commercial scale. Such challenges include obtaining reliable and commercially relevant data, implementing sustainable business models, automating operations, and transporting end-of-life PV and LIBs.
Study and design CE-related aspects of LIB and PV markets. To better understand the status of the CE for PV and LIBs, data will need to be collected at regular intervals on both the markets for each of LIB and PV (e.g., changes to designs and materials inventory) and their developing CE markets. For instance, regarding recycling of PV modules in the United States, it is not known how many firms offer this service, nor their locations for collection and recycling, their capacity, the annual mass recycled, their process, end markets, etc. If either private or public investments are to efficiently develop U.S. capability to recycle PV modules, such information would be critical to know with as much certainty as possible. In addition, publicly available projections of decommissioned PV modules (or LIBs) that incorporate all factors leading to end of life (e.g., failure modes, performance degradation, extreme weather events, economic alternatives such as repowering), and do so at relevant geographic scales (sub-state) and temporal frequency (at least annual), are also critical to efficient capital allocation.
With much to be done, benefits of the journey to a CE for PV and LIB can be realized along the way. With the observed acceleration of research interest, regular updates to the state of the science can mark progress, provide opportunity for course correction, and help fulfill the sustainability promise of a circular economy for photovoltaics and lithium-ion batteries. Ultimately, our recommendations from this critical review could inform and complement recent governmental action plans (U.S. Department of Energy Citation2022) to implement a CE for LIB and PV and be applied to other similar products as the world seeks to reduce material impacts of technology transitions.
Supplemental Material
Download Zip (7.3 MB)Acknowledgment
This work was authored in part by the National Renewable Energy Laboratory, operated by Alliance for Sustainable Energy, LLC, for the U.S. Department of Energy (DOE) under Contract No. DE-AC36-08GO28308. Funding was provided by the DOE's Advanced Manufacturing Office and Solar Energy Technologies Office, as well as through internal funding from the National Renewable Energy Laboratory. The views expressed in the article do not necessarily represent the views of the DOE or the U.S. Government. The U.S. Government retains and the publisher, by accepting the article for publication, acknowledges that the U.S. Government retains a non-exclusive, paid-up, irrevocable, worldwide license to publish or reproduce the published form of this work, or allow others to do so, for U.S. Government purposes. We would like to thank Teresa Barnes, Jill Engel-Cox, Hao Cui, Taylor Curtis, Matthew Keyser, Caitlin Murphy, Silvana Ovaitt, Stephanie Shaw, Timothy Silverman, Julien Walzberg, and the reviewers for their detailed feedback that helped us significantly improve this work. We would also like to thank Al Hicks for graphics support and Connor O'Neill for editorial support as well as Jen Walker, Jason Youngstrom and Claire Bolyard from the National Renewable Energy Laboratory library for helping us obtain scientific literature supporting this review.
Disclosure Statement
No potential conflict of interest was reported by the author(s).
Supplemental data
Supplemental data for this paper can be accessed on the publisher’s website.
Additional information
Notes on contributors
Garvin A. Heath
Garvin A. Heath, Ph.D., is an inaugural Distinguished Member of the Research Staff at the National Renewable Energy Laboratory (NREL), USA, specializing in the analysis of environmental impacts of energy systems – renewable and conventional, electricity and fuels.
Dwarakanath Ravikumar
Dwarakanath Ravikumar, Ph.D., is a Scientist at the National Renewable Energy Laboratory (NREL), USA, and focusses his research on operationalizing a circular economy for renewable energy infrastructure systems, especially photovoltaics (PV), and carbon dioxide through carbon capture and utilization (CCU).
Brianna Hansen
Brianna Hansen is a post-undergraduate intern at the National Renewable Energy Laboratory (NREL), USA, and focuses her research on the application of the circular economy to renewable energy systems, as well as the decarbonization of manufacturing industries and supply chains.
Elaine Kupets
Elaine Kupets is a post-undergraduate intern at the National Renewable Energy Laboratory (NREL), USA, researching applications of the circular economy to photovoltaics (PV), along with a focus in analyzing environmental health issues associated with end-of-life PV.
References
- 5N Plus. 2021. “Tellurium 2N5 - 7N.” Retrieved April 1, 2022, from https://www.5nplus.com/tellurium.html.
- ABC7. 2020. “Exide allowed to abandon Vernon battery recycling plant, leaving taxpayers to foot cleanup bill.” Retrieved March 10, 2022, from https://abc7.com/exide-battery-plant-in-vernon-bankruptcy-doj/7167011/.
- Aguilar Esteva, L. C., A. Kasliwal, M. S. Kinzler, H. C. Kim, and G. A. Keoleian. 2021. Circular economy framework for automobiles: Closing energy and material loops. J. Ind. Ecol. 25 (4):877–89. doi:https://doi.org/10.1111/jiec.13088.
- Ahmad, Z., T. Xie, C. Maheshwari, J. C. Grossman, and V. Viswanathan. 2018. Machine learning enabled computational screening of inorganic solid electrolytes for suppression of dendrite formation in lithium metal anodes. ACS Cent Sci 4 (8):996–1006. doi:https://doi.org/10.1021/acscentsci.8b00229.
- Ahmadi, L., S. B. Young, M. Fowler, R. A. Fraser, and M. A. Achachlouei. 2015. A cascaded life cycle: Reuse of electric vehicle lithium-ion battery packs in energy storage systems. Int. J. Life Cycle Assess. 22 (1):111–24. doi:https://doi.org/10.1007/s11367-015-0959-7.
- Akuuser. 2021. “Recycling of high-grade cobalt Li-ion batteries.” Retrieved December 20, 2021, from https://www.akkuser.fi/en/process-descriptions/high-grade-cobalt-li-ion-battery/.
- Al-Thyabat, S., T. Nakamura, E. Shibata, and A. Iizuka. 2013. Adaptation of minerals processing operations for lithium-ion (LiBs) and nickel metal hydride (NiMH) batteries recycling: Critical review. Minerals Engineering 45:4–17. doi:https://doi.org/10.1016/j.mineng.2012.12.005.
- Alfaro-Algaba, M., and F. J. Ramirez. 2020. Techno-economic and environmental disassembly planning of lithium-ion electric vehicle battery packs for remanufacturing. Resour. Conserv. Recycl. 154, 104461.
- Anh Nguyen, T. H., and S. Y. Oh. 2021. Anode carbonaceous material recovered from spent lithium-ion batteries in electric vehicles for environmental application. Waste Management 120:755–61. doi:https://doi.org/10.1016/j.wasman.2020.10.044.
- Ardente, F., C. E. L. Latunussa, and G. A. Blengini. 2019. Resource efficient recovery of critical and precious metals from waste silicon PV panel recycling. Waste Management 91:156–67. doi:https://doi.org/10.1016/j.wasman.2019.04.059.
- Arup. 2020. Circular photovoltaics - circular business models for Australia’s solar photovoltaics industry. London, UK: Arup.
- Aryan, V., M. Font-Brucart, and D. Maga. 2018. A comparative life cycle assessment of end-of-life treatment pathways for photovoltaic backsheets. Prog. Photovolt: Res. Appl. 26 (7):443–59. doi:https://doi.org/10.1002/pip.3003.
- ASES. 2020. “Ases webinar: PV recycling.” American Solar Energy Society. Retrieved January 18, 2022, from https://www.gotostage.com/channel/5496676f274b47dfafbdee37cf439cef/recording/239d6df25dad44a3a7217fc5ed783b58/watch?source=CHANNEL.
- Attarian Shandiz, M., and R. Gauvin. 2016. Application of machine learning methods for the prediction of crystal system of cathode materials in lithium-ion batteries. Comput. Mater. Sci. 117:270–78. doi:https://doi.org/10.1016/j.commatsci.2016.02.021.
- Bai, Y., N. Muralidharan, Y.-K. Sun, S. Passerini, M. Stanley Whittingham, and I. Belharouak. 2020. Energy and environmental aspects in recycling lithium-ion batteries: Concept of battery identity global passport. Mater. Today 41:304–15. doi:https://doi.org/10.1016/j.mattod.2020.09.001.
- Banza Lubaba Nkulu, C., L. Casas, V. Haufroid, T. De Putter, N. D. Saenen, T. Kayembe-Kitenge, P. Musa Obadia, D. Kyanika Wa Mukoma, J. M. Lunda Ilunga, T. S. Nawrot, et al. 2018. Sustainability of artisanal mining of cobalt in DR Congo. Nat Sustain 1 (9):495–504. doi:https://doi.org/10.1038/s41893-018-0139-4.
- Barbose, G., N. Darghouth, E. O’Shaughnessy, and S. Forrester. 2021. Tracking the sun: Pricing and design trends for distributed photovoltaic systems in the United States, 2021. Lawrence Berkeley National Laboratory.
- Basia, A., Z. Simeu-Abazi, E. Gascard, and P. Zwolinski. 2021. Review on state of health estimation methodologies for lithium-ion batteries in the context of circular economy. CIRP J Manuf Sci Technol. 32:517–28. doi:https://doi.org/10.1016/j.cirpj.2021.02.004.
- Battery Resourcers. 2022. “Premium battery materials, sustainably sourced.” Retrieved January 17 2022, from https://www.batteryresourcers.com/products.
- Beaucarne, G., G. Eder, E. Jadot, Y. Voronko, and W. Mühleisen. 2021. Repair and preventive maintenance of photovoltaic modules with degrading backsheets using flowable silicone sealant. Prog. Photovolt: Res. Appl. doi:https://doi.org/10.1002/pip.3492.
- Beaudet, A., F. Larouche, K. Amouzegar, P. Bouchard, and K. Zaghib. 2020. Key challenges and opportunities for recycling electric vehicle battery materials. Sustainability 12 (14):5837. doi:https://doi.org/10.3390/su12145837.
- Bellini, E. 2020. “Italian PV panels sent for recycling were instead smuggled to Syria and Africa.” Retrieved January 6, 2022, from https://www.pv-magazine.com/2020/02/05/italian-pv-panels-sent-for-recycling-were-instead-smuggled-to-syria-and-africa/.
- Berger, W., F.-G. Simon, K. Weimann, and E. A. Alsema. 2010. A novel approach for the recycling of thin film photovoltaic modules. Resour. Conserv. Recycl. 54 (10):711–18. doi:https://doi.org/10.1016/j.resconrec.2009.12.001.
- BEST Magazine. 2020. “How direct recycling can repair battery cathodes.” Batteries and Energy Storage Technology. Retrieved January 5, 2022, from https://www.bestmag.co.uk/content/play-it-again-steve%26#x2014;-how-direct-recycling-can-repair-battery-cathodes.
- Bilbao, J. I., G. Heath, A. Norgren, M. M. Lunardi, A. Carpenter, and R. Corkish. 2021. PV module design for recycling. International Energy Agency (IEA) PVPS Task 12:1–90. Report T12-23:2021.
- Bird, R., Z. J. Baum, X. Yu, and J. Ma. 2022. The regulatory environment for lithium-ion battery recycling. ACS Energy Letters 7 (2):736–40. doi:https://doi.org/10.1021/acsenergylett.1c02724.
- BloombergNEF. 2021. Lithium-ion battery pack price and demand outlook. London, UK: BloombergNEF.
- Brans, J. P., and Y. De Smet. 2016. PROMETHEE methods. In Multiple criteria decision analysis, ed. S. Greco, M. Ehrgott, and J. R. Figueira, 187–219. New York: Springer.
- Brasch, J., and D. Kobold. 2020. Solar panel recycling research from the counties of Butte and San Mateo and the City of Santa Monica in California. In 47th IEEE Photovoltaic Specialists Conference (PVSC), Virtual. 2627–30.
- Bräuer, S. 2016. They not only live once–towards product-service systems for repurposed electric vehicle batteries. In Proceedings of the Multikonferenz Wirtschaftsinformatik (MKWI 2016), 1299–310. Thuringia, Germany.
- Bronsveld, P. C. P., P. Manshanden, F. O. Lenzmann, Ø. Gjerstad, and E. J. Øvrelid. 2013. Recycling of p-type mc-si top cuts into p-type mono c-si solar cells. Energy Procedia 38:536–41. doi:https://doi.org/10.1016/j.egypro.2013.07.314.
- Brückner, L., J. Frank, and T. Elwert. 2020. Industrial recycling of lithium-ion batteries—A critical review of metallurgical process routes. Metals 10 (8):1107. doi:https://doi.org/10.3390/met10081107.
- Bureau of Labor Statistics. 2021. “Solar photovoltaic installers.” Retrieved April 5, 2022, from https://www.bls.gov/ooh/construction-and-extraction/solar-photovoltaic-installers.htm.
- Burwell-Naney, K., H. Zhang, A. Samantapudi, C. Jiang, L. Dalemarre, L. Rice, E. Williams, and S. Wilson. 2013. Spatial disparity in the distribution of superfund sites in South Carolina: An ecological study. J. Environ. Health 12 (1):1–11. doi:https://doi.org/10.1186/1476-069X-12-96.
- California Legislative Information. 2018. “ARTICLE 3. lithium-ion batteries [42450.5- 42450.5.].” Retrieved April 5, 2022, from https://leginfo.legislature.ca.gov/faces/codes_displayText.xhtml?lawCode=PRC&division=30.&title=&part=3.&chapter=8.&article=3.
- Call2Recycle. (2021). “About Call2Recycle.” Retrieved December 1, 2021, from https://www.call2recycle.org/about-us/.
- Call2recycle. 2022. “Panasonic, call2recycle team for battery recycling initiative – environmental leader.” Retrieved January 1, 2022, from https://www.call2recycle.org/environmental-leader-recycling-waste-reduction-report/.
- Calvo, G., and A. Valero. 2021. Strategic mineral resources: Availability and future estimations for the renewable energy sector. Environ. Dev. 41: 100640.
- Campagnol, N., J. Eddy, T. Hagenbruch, K. Diederik, C. Mulligan, and J. van de Staaij. 2018. “Metal mining constraints on the electric mobility horizon.” Retrieved January 31, 2022, from https://www.mckinsey.com/industries/oil-and-gas/our-insights/metal-mining-constraints-on-the-electric-mobility-horizon.
- Canals Casals, L., M. Barbero, and C. Corchero. 2019. Reused second life batteries for aggregated demand response services. J. Clean. Prod. 212:99–108. doi:https://doi.org/10.1016/j.jclepro.2018.12.005.
- Cao, Z., X. Zheng, H. Cao, H. Zhao, Z. Sun, Z. Guo, K. Wang, and B. Zhou. 2018. Efficient reuse of anode scrap from lithium-ion batteries as cathode for pollutant degradation in electro-Fenton process: Role of different recovery processes. Chem. Eng. J. 337:256–64. doi:https://doi.org/10.1016/j.cej.2017.12.104.
- Cao, N., Y. Zhang, L. Chen, W. Chu, Y. Huang, Y. Jia, and M. Wang. 2021. An innovative approach to recover anode from spent lithium-ion battery. J. Power. Sources. 483:229163. doi:https://doi.org/10.1016/j.jpowsour.2020.229163.
- Cardarelli, F., and J. Dube (2007). “Method for recycling spent lithium metal polymer rechargeable batteries and related materials.” Retrieved February 16, 2022, from https://patents.google.com/patent/US7192564B2/en.
- Carrara, S., P. Alves Dias, B. Plazzotta, and C. Pavel. 2020. Raw materials demand for wind and solar PV technologies in the transition towards a decarbonised energy system. Luxembourg: Publications Office of the European Union.
- Carroll, D. (2021). “Installers to play key role in UNSW solar module recycling strategy.” Retrieved April 5, 2022, from https://www.pv-magazine-australia.com/2021/12/23/installers-to-play-key-role-in-unsw-solar-module-recycling-strategy/ .
- Casals, L. C., B. Amante Garcia, and C. Canal. 2019. Second life batteries lifespan: Rest of useful life and environmental analysis. J. Environ. Manage. 232:354–63. doi:https://doi.org/10.1016/j.jenvman.2018.11.046.
- Cascade Eco Minerals. (2021). “The next generation of PV recycling.” Retrieved March 13, 2021, from https://www.cascadeecominerals.com .
- Castelvecchi, D. (2021). “Electric cars and batteries: How will the world produce enough?” Retrieved February 14, 2022, from https://www.nature.com/articles/d41586-021-02222-1.
- Centrica. (2022). “Virtual power plants are transforming energy. Here’s how.” Retrieved January 13, 2022, from https://www.centrica.com/Story/Virtual-power-plants-are-transforming-energy-Here%27s-how/.
- Cerchier, P., K. Brunelli, L. Pezzato, C. Audoin, J. P. Rakotoniaina, T. Sessa, M. Tammaro, G. Sabia, A. Attanasio, C. Forte, et al. 2021. Innovative recycling of end of life silicon PV panels: ReSiELP. Detritus 16:41–47. doi:https://doi.org/10.31025/2611-4135/2021.15118.
- Chauhan, C., V. Parida, and A. Dhir. 2022. Linking circular economy and digitalisation technologies: A systematic literature review of past achievements and future promises. Technol Forecast Soc Change 177:121508. doi:https://doi.org/10.1016/j.techfore.2022.121508.
- Chembessi, C., C. Beaurain, and G. Cloutier. 2021. Understanding the scaling-up of a circular economy (CE) through a strategic niche management (SNM) theory: A socio-political perspective from Quebec. Environ. Challenges. 5: 100362.
- Chen, P.-Y., J. Qi, M. T. Klug, X. Dang, P. T. Hammond, and A. M. Belcher. 2014. Environmentally responsible fabrication of efficient perovskite solar cells from recycled car batteries. Energy Environ. Sci. 7 (11):3659–65. doi:https://doi.org/10.1039/C4EE00965G.
- Chen, H., J. Shen, and J. Xu. 2017. A degradation-based sorting method for lithium-ion battery reuse. PLoS One 12 (10):e0185922. doi:https://doi.org/10.1371/journal.pone.0185922.
- Chen, M., X. Ma, B. Chen, R. Arsenault, P. Karlson, N. Simon, and Y. Wang. 2019. Recycling end-of-life electric vehicle lithium-ion batteries. Joule 3 (11):2622–46. doi:https://doi.org/10.1016/j.joule.2019.09.014.
- Chen, L., P. Wang, Y. Shen, and M. Guo. 2021. Spent lithium-ion battery materials recycling for catalytic pyrolysis or gasification of biomass. Bioresour. Technol. 323:124584. doi:https://doi.org/10.1016/j.biortech.2020.124584.
- Choi, J.-K., and V. Fthenakis. 2010a. Design and optimization of photovoltaics recycling infrastructure. Environ. Sci. Technol. 44 (22):8678–83. doi:https://doi.org/10.1021/es101710g.
- Choi, J.-K., and V. Fthenakis. 2010b. Economic feasibility of recycling photovoltaic modules. J. Ind. Ecol. 14 (6):947–64. doi:https://doi.org/10.1111/j.1530-9290.2010.00289.x.
- Choi, J.-K., and V. Fthenakis. 2014. Crystalline silicon photovoltaic recycling planning: Macro and micro perspectives. J. Clean. Prod. 66:443–49. doi:https://doi.org/10.1016/j.jclepro.2013.11.022.
- Chowdhury, B., and M. U. Chowdhury (2007). RFID-based real-time smart waste management system. Australasian Telecommunication Networks and Applications Conference, Christchurch, New Zealand.
- Chowdhury, M. S., K. S. Rahman, T. Chowdhury, N. Nuthammachot, K. Techato, M. Akhtaruzzaman, S. K. Tiong, K. Sopian, and N. Amin. 2020. An overview of solar photovoltaic panels’ end-of-life material recycling. Energy Strategy Rev. 27:100431. doi:https://doi.org/10.1016/j.esr.2019.100431.
- Chung, J., B. Seo, J. Lee, and J. Y. Kim. 2021. Comparative analysis of I2-KI and HNO3 leaching in a life cycle perspective: Towards sustainable recycling of end-of-life c-Si PV panel. J. Hazard. Mater. 404( Pt B):123989. doi:https://doi.org/10.1016/j.jhazmat.2020.123989.
- Ciez, R. E., and J. F. Whitacre. 2019. Examining different recycling processes for lithium-ion batteries. Nat. Sustainability 2 (2):148–56. doi:https://doi.org/10.1038/s41893-019-0222-5.
- Ciobotaru, I. A., F. M. Benga, and D. I. Văireanu. 2021. Reconditioning of li-ion rechargeable batteries, a possible solution for batteries circular economy. UPB Scientific Bulletin, Series B: Chemistry and Materials Science 83 (1):17–22.
- Cognet, M., J. Condomines, J. Cambedouzou, S. Madhavi, M. Carboni, and D. Meyer. 2020. An original recycling method for Li-ion batteries through large scale production of metal organic frameworks. J. Hazard. Mater. 385:121603. doi:https://doi.org/10.1016/j.jhazmat.2019.121603.
- CPUC. (2019). “From cradle to grave: Addressing end-of-life management for photovoltaic panels and batteries for electric vehicles and energy storage workshop.” California Public Utilities Commission. Retrieved December 11, 2021, from http://www.adminmonitor.com/ca/cpuc/workshop/20190403/.
- Crownhart, C. (2021). “Solar panels are a pain to recycle. These companies are trying to fix that.” Retrieved January 13, 2022, from https://www.technologyreview.com/2021/08/19/1032215/solar-panels-recycling/.
- CSSA. (2020). “New regulations for end-of-life PV modules webinar.” California Solar + Storage Association. Retrieved February 10, 2022, from https://register.gotowebinar.com/recording/3084273463311327760 .
- Cucchiella, F., I. D׳Adamo, and P. Rosa. 2015. End-of-Life of used photovoltaic modules: A financial analysis. Renewable Sustainable Energy Rev. 47:552–61. doi:https://doi.org/10.1016/j.rser.2015.03.076.
- Cucurachi, S., E. Borgonovo, and R. Heijungs. 2016. A protocol for the global sensitivity analysis of impact assessment models in life cycle assessment. Risk Anal. 36 (2):357–77. doi:https://doi.org/10.1111/risa.12443.
- Cui, Z., Q. Xie, and A. Manthiram. 2021. A cobalt‐and manganese‐free high‐nickel layered oxide cathode for long‐life, safer lithium‐ion batteries. Adv. Energy Mater. 11 (41):2102421. doi:https://doi.org/10.1002/aenm.202102421.
- Cui, H., G. Heath, T. Remo, D. Ravikumar, T. Silverman, M. Deceglie, M. Kempe, and J. Engel-Cox. 2022. Technoeconomic analysis of high-value, crystalline silicon photovoltaic module recycling processes. So. Energy. Mater. Sol. 238:111592. doi:https://doi.org/10.1016/j.solmat.2022.111592.
- Curtis, T. L., H. Buchanan, L. Smith, and G. Heath. 2021a. A circular economy for solar photovoltaic system materials: drivers, barriers, enablers, and U.S. Golden, CO: National Renewable Energy Laboratory. ( Policy Considerations.)
- Curtis, T. L., G. Heath, H. Buchanan, S. Shaw, and B. Kaldunski. 2021b. Solar photovoltaic recycling: A survey of U.S. Golden, CO: National Renewable Energy Laboratory. ( Policies and Initiatives)
- Curtis, T. L., L. Smith, H. Buchanan, and G. Heath. 2021c. A circular economy for lithium-ion batteries used in mobile and stationary energy storage: Drivers. Golden, CO: Barriers, Enablers, and U.S. Policy Considerations.
- Cusenza, M. A., F. Guarino, S. Longo, M. Ferraro, and M. Cellura. 2019. Energy and environmental benefits of circular economy strategies: The case study of reusing used batteries from electric vehicles. J. Energy Storage 25:100845. doi:https://doi.org/10.1016/j.est.2019.100845.
- Cusenza, M. A., F. Guarino, S. Longo, M. Mistretta, and M. Cellura. 2019a. Reuse of electric vehicle batteries in buildings: An integrated load match analysis and life cycle assessment approach. Energy Build. 186:339–54. doi:https://doi.org/10.1016/j.enbuild.2019.01.032.
- D’Adamo, I., M. Miliacca, and P. Rosa. 2017. Economic feasibility for recycling of waste crystalline silicon photovoltaic modules. Int. J. Photoenergy 2017:1–6. doi:https://doi.org/10.1155/2017/4184676.
- Dai, Q., J. Spangenberger, S. Ahmed, L. Gaines, J. C. Kelly, and M. Wang. 2019. EverBatt: A closed-loop battery recycling cost and environmental impacts model. Lemont, IL: Argonne National Lab.
- Dang, H., B. Wang, Z. Chang, X. Wu, J. Feng, H. Zhou, W. Li, and C. Sun. 2018. Recycled lithium from simulated pyrometallurgical slag by chlorination roasting. ACS Sustain. Chem. Eng. 6 (10):13160–67. doi:https://doi.org/10.1021/acssuschemeng.8b02713.
- Daniela-Abigail, H.-L., R. Tariq, A. E. Mekaoui, A. Bassam, M. Vega De Lille, L. J. Ricalde, and I. Riech. 2022. Does recycling solar panels make this renewable resource sustainable? Evidence supported by environmental, economic, and social dimensions. Sustain. Cities. Sustain. Cities. Socn 77:103539. doi:https://doi.org/10.1016/j.scs.2021.103539.
- Dassisti, M., G. Florio, and F. Maddalena (2017). Cryogenic delamination and sustainability: Analysis of an innovative recycling process for photovoltaic crystalline modules. In International conference on sustainable design and manufacturing. Bologna, Italy: Springer.
- Davis, J. R., A. Rohatgi, R. H. Hopkins, P. D. Blais, P. Rai-Choudhury, J. R. Mccormick, and H. C. Mollenkopf. 1980. Impurities in silicon solar cells. IEEE Trans. Electron Devices 27 (4):677–87. doi:https://doi.org/10.1109/T-ED.1980.19922.
- De Rose, A., D. Erath, T. Geipel, A. Kraft, and U. Eitner, (2017). Low-temperature soldering for the interconnection of silicon heterojunction solar cells. 33rd European Photovoltaic Solar Energy Conference and Exhibition, Amsterdam, Netherlands.
- Deng, R., N. L. Chang, Z. Ouyang, and C. M. Chong. 2019. A techno-economic review of silicon photovoltaic module recycling. Renewable Sustainable Energy Rev. 109:532–50. doi:https://doi.org/10.1016/j.rser.2019.04.020.
- Deng, R., N. Chang, M. M. Lunardi, P. Dias, J. Bilbao, J. Ji, and C. M. Chong. 2020. Remanufacturing end‐of‐life silicon photovoltaics: Feasibility and viability analysis. Prog. Photovolt: Res. Appl. 29: 760–764.
- Deng, R., N. Chang, and M. Green. 2021. Peer behaviour boosts recycling. Nat. Energy 6 (9):862–63. doi:https://doi.org/10.1038/s41560-021-00905-7.
- Department of the Interior: Geological Survey (2022). Federal register: 2022 final list of critical minerals. G. survey. 87.
- Deringer, V. L. 2020. Modelling and understanding battery materials with machine-learning-driven atomistic simulations. J. Phys. Energy 2 (4): 041003.
- deX. (2020). “New marketplaces for energy services.” Retrieved January 1, 2020, from https://dex.energy/about-dex/.
- Dias, P., L. Schmidt, M. Monteiro Lunardi, N. L. Chang, G. Spier, R. Corkish, and H. Veit. 2021. Comprehensive recycling of silicon photovoltaic modules incorporating organic solvent delamination – Technical, environmental and economic analyses. Resour. Conserv. Recycl. 165:105241. doi:https://doi.org/10.1016/j.resconrec.2020.105241.
- Diekmann, J., C. Hanisch, L. Froböse, G. Schälicke, T. Loellhoeffel, A.-S. Fölster, and A. Kwade. 2016. Ecological recycling of lithium-ion batteries from electric vehicles with focus on mechanical processes. J. Electrochem. Soc. 164 (1):A6184–A6191. doi:https://doi.org/10.1149/2.0271701jes.
- Djordjevic, S., D. Parlevliet, and P. Jennings. 2014. Detectable faults on recently installed solar modules in Western Australia. Renew. Energ. 67:215–21. doi:https://doi.org/10.1016/j.renene.2013.11.036.
- Dodbiba, G., Y. Yamaji, K. Murata, K. Okaya, A. Shibayama, and T. Fujita. 2013. A novel process for recovering valuable materials from spent lithium-ion batteries. New York, NY: REWAS, Springer.
- DOE. 2021. The Solar Futures Study. Washington, DC: Department of Energy, National Renewable Energy Laboratory United States Department of Energy Solar Energy Technologies Office.
- Doi, T., I. Tsuda, K. Sakuta, and G. Matsui (2003). Development of a recyclable PV-module: Trial manufacturing and evaluation. In 3rd world conference on photovoltaic energy conversion, vol. 2, 1952–55. Osaka, Japan: IEEE.
- Doi, T., I. Tsuda, H. Unagida, A. Murata, K. Sakuta, and K. Kurokawa. 2001. Experimental study on PV module recycling with organic solvent method. So. Energy. Mater. Sol. 67 (1–4):397–403. doi:https://doi.org/10.1016/S0927-0248(00)00308-1.
- Doose, S., J. K. Mayer, P. Michalowski, and A. Kwade. 2021. Challenges in ecofriendly battery recycling and closed material cycles: A perspective on future lithium battery generations. Metals 11 (2):291. doi:https://doi.org/10.3390/met11020291.
- Drabik, E., and V. Rizos, (2018). Prospects for electric vehicle batteries in a circular economy. CEPS Research Report No 2018/05.
- Drouiche, N., P. Cuellar, F. Kerkar, S. Medjahed, N. Boutouchent-Guerfi, and M. Ould Hamou. 2014. Recovery of solar grade silicon from kerf loss slurry waste. Renewable Sustainable Energy Rev. 32:936–43. doi:https://doi.org/10.1016/j.rser.2014.01.059.
- Drury, E., M. Miller, C. M. Macal, D. J. Graziano, D. Heimiller, J. Ozik, and T. D. Perry. 2012. The transformation of southern California’s residential photovoltaics market through third-party ownership. Energy Policy 42:681–90. doi:https://doi.org/10.1016/j.enpol.2011.12.047.
- DSM. (2021). “The recyclable backsheet.” Retrieved December 22, 2021, from https://www.dsm.com/dsm-in-solar/en_US/technologies/pv-backsheets/the-recyclable-backsheet.html.
- Duesenfeld. (2021). “Ecofriendly recycling of lithium-ion batteries.” Retrieved April 5, 2022, from https://www.duesenfeld.com/recycling_en.html.
- Dunn, J., M. Slattery, A. Kendall, H. Ambrose, and S. Shen. 2021. Circularity of lithium-ion battery materials in electric vehicles. Environ. Sci. Technol. 55 (8):5189–98. doi:https://doi.org/10.1021/acs.est.0c07030.
- DuPont (2020). “Dupont global field reliability report.”
- DuPont Teijin Films. (2020). “Mylar UVPHET - sustainability without compromise.” Retrieved April 5, 2022, from https://16iwyl195vvfgoqu3136p2ly-wpengine.netdna-ssl.com/wp-content/uploads/2021/03/Webinar-Sustainability-without-compromise.pdf.
- Ehrlich, P., and J. Holdren. 1971. Impact of population growth. Science 171 (3977):1212–17. doi:https://doi.org/10.1126/science.171.3977.1212.
- EIA. 2022. Table 4.3: existing capacity by energy source. Washington, DC: Electric Power Annual 2020 United States Energy Information Adminsitration.
- electrive.com. (2020). “Li-cycle to build battery recycling ‘Hub’ in the USA.” Retrieved February 3, 2022, from https://www.electrive.com/2020/09/19/li-cycle-to-build-battery-recycling-hub-in-the-usa/.
- Elkind, E. 2014. Reuse and repower: How to save money and clean the grid with second-life electric vehicle batteries.
- Energy Storage News. (2022). “Texas community virtual power plant to use solaredge’s energy bank battery storage.” Retrieved February 11, 2022, from https://www.energy-storage.news/texas-community-virtual-power-plant-to-use-solaredges-energy-bank-battery-storage/.
- Engel, H., P. Hertzke, and G. Siccardo. 2019. Second-life EV batteries: The newest value pool in energy storage.
- EPA. 1985. Standards for the management of specific hazardous wastes and specific types of hazardous waste management facilities. 40 CFR 666.266, Environmental Protection Agency, Washington, DC.
- EPRI. 2018. Solar PV module end-of-life: Options and knowledge gaps for utility-scale plants. Washington, DC: Electric Power Research Institute.
- EPA. (2020). “What is a circular economy?” Environmental Protection Agency. Retrieved February 18, 2022, from https://www.epa.gov/recyclingstrategy/what-circular-economy.
- EPA. 2021. Inventory of U.S. greenhouse gas emissions and sinks (1990-2019). Washington, DC: Environmental Protection Agency.
- Eshraghi, N., L. Berardo, A. Schrijnemakers, V. Delaval, M. Shaibani, M. Majumder, R. Cloots, B. Vertruyen, F. Boschini, and A. Mahmoud. 2020. Recovery of nano-structured silicon from end-of-life photovoltaic wafers with value-added applications in lithium-ion battery. ACS Sustain. Chem. Eng. 8 (15):5868–79. doi:https://doi.org/10.1021/acssuschemeng.9b07434.
- European Commission (2015). Communication from the commission to the European parliament, the council, the European economic and social committee and the committee of the regions: Closing the loop - An EU action plan for the circular economy. Secretariat-General.
- European Commission (2020). Communication from the commission to the European parliament, the council, the European economic and social committee and the committee of the regions: Critical raw materials resilience: charting a path towards greater security and sustainability.
- European Commission. 2021. Communication from the commission – Ecodesign Working Plan 2016–2019.
- European Parliament. (2021). “Circular economy: Definition, importance and benefits.” Retrieved February 27, 2022, from https://www.europarl.europa.eu/news/en/headlines/economy/20151201STO05603/circular-economy-definition-importance-and-benefits.
- Everledger. (2020). “Circular thinking: The race to trace battery lifecycles.” Retrieved January 10, 2022, from https://everledger.io/circular-thinking-the-race-to-trace-battery-lifecycles/.
- Faessler, B. 2021. Stationary, second use battery energy storage systems and their applications: A research review. Energies 14 (8):2335. doi:https://doi.org/10.3390/en14082335.
- Fernández, L. J., R. Ferrer, D. F. Aponte, and P. Fernández. 2011. Recycling silicon solar cell waste in cement-based systems. So. Energy. Mater. Sol. 95 (7):1701–06. doi:https://doi.org/10.1016/j.solmat.2011.01.033.
- Ferrara, C., R. Ruffo, E. Quartarone, and P. Mustarelli. 2021. Circular economy and the fate of lithium batteries: Second life and recycling. Adv. Energy Sustainability Res. 2 (10):2100047. doi:https://doi.org/10.1002/aesr.202100047.
- First Solar. (2021). First Solar recycling recovers up to 90% of materials. Accessed February 24, 2022. https://www. firstsolar.com/modules/recycling
- Fluence. (2022). “Fluence Gridstack.” Retrieved January 31, 2022, from https://fluenceenergy.com/energy-storage-technology/gridstack-grid-energy-storage/.
- Forte, F., M. Pietrantonio, S. Pucciarmati, M. Puzone, and D. Fontana. 2020. Lithium iron phosphate batteries recycling: An assessment of current status. Crit Rev Environ Sci Technol 51 (19):2232–59.
- Foster, M., P. Isely, C. R. Standridge, and M. M. Hasan. 2014. Feasibility assessment of remanufacturing, repurposing, and recycling of end of vehicle application lithium-ion batteries. J. Ind. Eng. 7 (3). doi:https://doi.org/10.3926/jiem.939.
- Franco, M. A. 2019. A system dynamics approach to product design and business model strategies for the circular economy. J. Clean. Prod. 241:118327. doi:https://doi.org/10.1016/j.jclepro.2019.118327.
- Frisson, L., K. Kieten, T. Bruton, J. Declercq, H. Szuljfcik, M. de Moor, A. Benali, and O. Aceves (2000). Recent improvements in industrial PV module recycling. Sixteenth European Photovoltaic Solar Energy Conference, Glasgow, UK.
- Fthenakis, V., P. Duby, W. Wang, C. Graves, and A. Belova. 2006. Recycling of CdTe photovoltaic modules recovery of cadmium and tellurium. In 21st European photovoltaic solar energy conference, 4–8. Dresden, Germany.
- Fu, Y., Y. He, J. Li, L. Qu, Y. Yang, X. Guo, and W. Xie. 2020. Improved hydrometallurgical extraction of valuable metals from spent lithium-ion batteries via a closed-loop process. J Alloys Compd 847:156489. doi:https://doi.org/10.1016/j.jallcom.2020.156489.
- Gaines, L., K. Richa, and J. Spangenberger. 2018. Key issues for Li-ion battery recycling. MRS Energy & Sustainability 5 (1). doi:https://doi.org/10.1557/mre.2018.13.
- Gaines, L. 2018. Lithium-ion battery recycling processes: Research towards a sustainable course. Sustainable Mater.Technol. 17: e00068.
- Gaines, L. 2019. Profitable recycling of low-cobalt lithium-ion batteries will depend on new process developments. One Earth 1 (4):413–15. doi:https://doi.org/10.1016/j.oneear.2019.12.001.
- Galen Barbose, G., N. Darghouth, E. O’Shaughnessy, and S. Forrester. 2020. Distributed solar 2020 data update. Berkeley, CA: Lawrence Berkeley National Laboratory.
- Gangaja, B., S. Nair, and D. Santhanagopalan. 2021. Reuse, recycle, and regeneration of lifePO4 cathode from spent lithium-ion batteries for rechargeable lithium- and sodium-ion batteries. ACS Sustain. Chem. Eng. 9 (13):4711–21. doi:https://doi.org/10.1021/acssuschemeng.0c08487.
- Gao, W., X. Zhang, X. Zheng, X. Lin, H. Cao, Y. Zhang, and Z. Sun. 2017. Lithium carbonate recovery from cathode scrap of spent lithium-ion battery: A closed-loop process. Environ. Sci. Technol. 51 (3):1662–69. doi:https://doi.org/10.1021/acs.est.6b03320.
- Geissdoerfer, M., P. Savaget, N. M. P. Bocken, and E. J. Hultink. 2017. The circular economy – A new sustainability paradigm? J. Clean. Prod. 143:757–68. doi:https://doi.org/10.1016/j.jclepro.2016.12.048.
- Geng, Y., S. Joseph, and R. Bleischwitz. 2019. How to globalize the circular economy. Nature 565 (7738):153–55. doi:https://doi.org/10.1038/d41586-019-00017-z.
- Goe, M., G. Gaustad, and B. Tomaszewski. 2015. System tradeoffs in siting a solar photovoltaic material recovery infrastructure. J. Environ. Manage. 160:154–66. doi:https://doi.org/10.1016/j.jenvman.2015.05.038.
- Gong, S.-D., Y. Huang, H.-J. Cao, Y.-H. Lin, Y. Li, S.-H. Tang, M.-S. Wang, and X. Li. 2016. A green and environment-friendly gel polymer electrolyte with higher performances based on the natural matrix of lignin. J. Power. Sources. 307:624–33. doi:https://doi.org/10.1016/j.jpowsour.2016.01.030.
- Goris, M. J. A. A. 2014. Recycling friendly design, the Cu-PV project for sustainable photovoltaics. Amsterdam, Netherlands: European Photovoltaic Solar Energy Conference and Exhibition.
- Gourley, S. W. D., T. Or, and Z. Chen. 2020. Breaking free from cobalt reliance in lithium-ion batteries. iScience 23 (9):101505. doi:https://doi.org/10.1016/j.isci.2020.101505.
- Granata, G., F. Pagnanelli, E. Moscardini, T. Havlik, and L. Toro. 2014. Recycling of photovoltaic panels by physical operations. So. Energy. Mater. Sol. 123:239–48. doi:https://doi.org/10.1016/j.solmat.2014.01.012.
- Gratz, E., Q. Sa, D. Apelian, and Y. Wang. 2014. A closed loop process for recycling spent lithium ion batteries. J. Power. Sources. 262:255–62. doi:https://doi.org/10.1016/j.jpowsour.2014.03.126.
- Green Car Reports. (2018). “Nissan begins offering rebuilt leaf battery packs.” Retrieved April 5, 2022, from https://www.greencarreports.com/news/1116722_nissan-begins-offering-rebuilt-leaf-battery-packs.
- Groene Brein, H. (2022). “What is the definition of a circular economy?” Retrieved March 15, 2022, from https://kenniskaarten.hetgroenebrein.nl/en/knowledge-map-circular-economy/what-is-the-definition-a-circular-economy/.
- Groenewald, J., T. Grandjean, J. Marco, and W. Widanage. 2017. Testing of commercial electric vehicle battery modules for circular economy applications. SAE Int. J. Mater. Manuf 10 (2):206–17. doi:https://doi.org/10.4271/2017-01-1277.
- Group, M.-B. (2022). “Batteries are a key focus of the circular economy.” Retrieved April 5, 2022, from https://group.mercedes-benz.com/sustainability/resources/battery.html.
- Guo, Q., and H. Guo. 2019. A framework for end-of-life photovoltaics distribution routing optimization. Sustain. Environ. Res. 29 (1). doi:https://doi.org/10.1186/s42834-019-0005-8.
- Guojian, C., S.-J. Chao, A. Cheng, H.-M. Hsu, J.-R. Chang, L.-W. Teng, S.-C. Chen, and Y. Muhammad. 2015. Durability quality research of concrete containing solar PV cells. MATEC Web Conf. 27: 01004.
- Guyot Phung, C. 2019. Implications of the circular economy and digital transition on skills and green jobs in the plastics industry. Field Actions Sci. Rep. 12 (19):100–07.
- Guzzo, D., D. C. A. Pigosso, N. Videira, and J. Mascarenhas. 2022. A system dynamics-based framework for examining circular economy transitions. J. Clean. Prod. 333:129933. doi:https://doi.org/10.1016/j.jclepro.2021.129933.
- Halleux, V. 2021. New EU regulatory framework for batteries - setting sustainability requirements. Brussels, Belgium: European Parliamentary Research Service.
- Hamann, L., M. Haas, W. Wille, J. Mattheis, and R. Zapf-Gottwick. 2013. 30% silver reduction in rear bus bar metal paste. Energy Procedia 43:72–79. doi:https://doi.org/10.1016/j.egypro.2013.11.090.
- Hanisch, C. 2019. Recycling method for treating used batteries, in particular rechargeable batteries, and battery processing installation. Alexandria, VA: United States Patent and Trademark Office.
- Hansmann, R., P. Bernasconi, T. Smieszek, P. Loukopoulos, and R. W. Scholz. 2006. Justifications and self-organization as determinants of recycling behavior: The case of used batteries. Resour. Conserv. Recycl. 47 (2):133–59. doi:https://doi.org/10.1016/j.resconrec.2005.10.006.
- Hao, H., K. L. Lin, D. Wang, S. J. Chao, H. S. Shiu, T. W. Cheng, and C. L. Hwang. 2015. Elucidating characteristics of geopolymer with solar panel waste glass. Environ. Eng. Manag. J 14 (1):79–87. doi:https://doi.org/10.30638/eemj.2015.010.
- Hao, H., Y. Sun, X. Mei, Y. Zhou, and L. Pekař. 2021. Reverse logistics network design of electric vehicle batteries considering recall risk. Math. Probl. Eng. 2021:1–16.
- Haque, A., K. V. S. Bharath, M. A. Khan, I. Khan, and Z. A. Jaffery. 2019. Fault diagnosis of photovoltaic modules. Energy Science & Engineering 7 (3):622–44. doi:https://doi.org/10.1002/ese3.255.
- Harper, G., R. Sommerville, E. Kendrick, L. Driscoll, P. Slater, R. Stolkin, A. Walton, P. Christensen, O. Heidrich, S. Lambert, et al. 2019. Recycling lithium-ion batteries from electric vehicles. Nature 575 (7781):75–86. doi:https://doi.org/10.1038/s41586-019-1682-5.
- Hasegawa, T. (2021). “Blockchain to power Marubeni’s market for used solar panels in Japan.” Retrieved April 5, 2022, from https://asia.nikkei.com/Business/Technology/Blockchain-to-power-Marubeni-s-market-for-used-solar-panels-in-Japan.
- Heath, G. A., T. J. Silverman, M. Kempe, M. Deceglie, D. Ravikumar, T. Remo, H. Cui, P. Sinha, C. Libby, S. Shaw, et al. 2020. Research and development priorities for silicon photovoltaic module recycling to support a circular economy. Nat. Energy 5 (7):502–10. doi:https://doi.org/10.1038/s41560-020-0645-2.
- Heath, G., D. Ravikumar, S. Ovaitt, T. Curtis, J. McCall, H. Mirletz, H. Hartmann, L. Walston, and D. Millstein. 2022. Environmental and circular economy implications of solar energy in a decarbonized U.S. grid. Golden, CO: National Renewable Energy Laboratory.
- Heide, A., L. Tous, K. Wambach, J. Poortmans, J. Clyncke, and E. Voroshazi. 2021. Towards a successful re‐use of decommissioned photovoltaic modules. Prog. Photovolt: Res. Appl. doi:https://doi.org/10.1002/pip.3490.
- Hendrickson, T. P., O. Kavvada, N. Shah, R. Sathre, and C. D. Scown. 2015. Life-cycle implications and supply chain logistics of electric vehicle battery recycling in California. Environ. Res. Lett. 10 (1):014011. doi:https://doi.org/10.1088/1748-9326/10/1/014011.
- Henley, F., S. Kang, A. Brailove, and A. Fujisaka (2011). “Kerf-free wafering for high-volume, high-efficiency c-si cell.” In Proceedings of the 26th European photovoltaic solar energy conference, 971–78. Hamburg, Germany.
- Hesse, H., M. Schimpe, D. Kucevic, and A. Jossen. 2017. Lithium-ion battery storage for the grid—a review of stationary battery storage system design tailored for applications in modern power grids. Energies 10 (12):2107. doi:https://doi.org/10.3390/en10122107.
- Hirshman, W. (2016) “From eBay to pvBay getting used to used PV.”
- Huang, W.-H., W. J. Shin, L. Wang, W.-C. Sun, and M. Tao. 2017. Strategy and technology to recycle wafer-silicon solar modules. Solar Energy 144:22–31. doi:https://doi.org/10.1016/j.solener.2017.01.001.
- Huang, W. H., W. J. Shin, L. Wang, and M. Tao (2016). Recovery of valuable and toxic metals from crystalline-si modules. IEEE 43rd Photovoltaic Specialty Conference, Portland, OR.
- Huang, W.-H., and M. Tao (2015). A simple green process to recycle si from crystalline-si solar cells. In 2015 IEEE 42nd Photovoltaic Specialist Conference (PVSC), 1–4. New Orleans, LA.
- Hultberg, E., and R. Pal. 2021. Lessons on business model scalability for circular economy in the fashion retail value chain: Towards a conceptual model. Sustainable Prod. Consumption 28:686–98. doi:https://doi.org/10.1016/j.spc.2021.06.033.
- IEA. 2021a. Renewables 2021: Analysis and forecast to 2026. Paris, France: International Energy Agency.
- IEA. 2021b. Policies to promote electric vehicle deployment. Paris, France: International Energy Agency. Accessed April 5, 2022. https://www.iea.org/reports/global-ev-outlook-2021/policies-to-promote-electric-vehicle-deployment .
- IEA. 2021c. The role of critical minerals in clean energy transitions. Paris: International Energy Agency.
- IEA PVPS/IRENA. 2016. End-of-life management: solar photovoltaic panels, ed. S. Weckend, A. Wade, and G. Heath. Abu Dhabi, United Arab Emirates: International Energy Agency and International Renewable Energy Agency.
- IFC. 2015. Utility-scale solar photovoltaic power plants - A project developer’s guide. Washington, DC: International Finance Corporation.
- Jean, J., M. Woodhouse, and V. Bulović. 2019. Accelerating photovoltaic market entry with module replacement. Joule 3 (11):2824–41. doi:https://doi.org/10.1016/j.joule.2019.08.012.
- Ji, Y., E. E. Kpodzro, C. T. Jafvert, and F. Zhao. 2021. Direct recycling technologies of cathode in spent lithium-ion batteries. Clean Technologies and Recycling 1 (2):124–51. doi:https://doi.org/10.3934/ctr.2021007.
- Jiao, N., and S. Evans. 2016. Business models for sustainability: The case of second-life electric vehicle batteries. Procedia CIRP 40:250–55. doi:https://doi.org/10.1016/j.procir.2016.01.114.
- Jin, C., Z. Yang, J. Li, Y. Zheng, W. Pfleging, and T. Tang. 2020. Bio-inspired interfaces for easy-to-recycle lithium-ion batteries. Extreme Mech. Lett. 34:100594. doi:https://doi.org/10.1016/j.eml.2019.100594.
- Jung, B., J. Park, D. Seo, and N. Park. 2016. Sustainable system for raw-metal recovery from crystalline silicon solar panels: From noble-metal extraction to lead removal. ACS Sustain. Chem. Eng. 4 (8):4079–83. doi:https://doi.org/10.1021/acssuschemeng.6b00894.
- Kao, T.-L., W.-H. Huang, and H.-Y. Tuan. 2016. Kerf loss silicon as a cost-effective, high-efficiency, and convenient energy carrier: Additive-mediated rapid hydrogen production and integrated systems for electricity generation and hydrogen storage. J. Mater. Chem. A 4 (33):12921–28. doi:https://doi.org/10.1039/C6TA03657K.
- Karas, J., L. Michaelson, K. Munoz, M. Jobayer Hossain, E. Schneller, K. O. Davis, S. Bowden, and A. Augusto. 2020. Degradation of copper‐plated silicon solar cells with damp heat stress. Prog. Photovolt: Res. Appl. 28 (11):1175–86. doi:https://doi.org/10.1002/pip.3331.
- Kenney, B., K. Darcovich, D. D. MacNeil, and I. J. Davidson. 2012. Modelling the impact of variations in electrode manufacturing on lithium-ion battery modules. J. Power. Sources. 213:391–401. doi:https://doi.org/10.1016/j.jpowsour.2012.03.065.
- Kiker, G. A., T. S. Bridges, A. Varghese, T. P. Seager, and I. Linkov. 2005. Application of multicriteria decision analysis in environmental decision making. Integr. Environ. Assess. Manag. 1 (2):95–108. doi:https://doi.org/10.1897/IEAM_2004a-015.1.
- Kim, J., S. Y. Kim, C.-M. Yang, and G. W. Lee. 2019. Possibility of recycling siox particles collected at silicon ingot production process as an anode material for lithium ion batteries. Sci. Rep 9: 1–7.
- King, A. M., S. C. Burgess, W. Ijomah, and C. A. McMahon. 2006. Reducing waste: Repair, recondition, remanufacture or recycle? Sustain. Dev. 14 (4):257–67. doi:https://doi.org/10.1002/sd.271.
- Kirchherr, J., D. Reike, and M. Hekkert. 2017. Conceptualizing the circular economy: An analysis of 114 definitions. Resour. Conserv. Recycl. 127:221–32. doi:https://doi.org/10.1016/j.resconrec.2017.09.005.
- Kramar, D. E., A. Anderson, H. Hilfer, K. Branden, and J. J. Gutrich. 2018. A spatially informed analysis of environmental justice: Analyzing the effects of gerrymandering and the proximity of minority populations to U.S. superfund sites. Environ. Justice. 11 (1):29–39. doi:https://doi.org/10.1089/env.2017.0031.
- Krishnakumar, V., A. Barati, H. J. Schimper, A. Klein, and W. Jaegermann. 2013. A possible way to reduce absorber layer thickness in thin film CdTe solar cells. Thin Solid Films 535:233–36. doi:https://doi.org/10.1016/j.tsf.2012.11.085.
- Kumar, A., and S. N. Melkote. 2018. Diamond wire sawing of solar silicon wafers: A sustainable manufacturing alternative to loose abrasive slurry sawing. Procedia Manufacturing 21:549–66. doi:https://doi.org/10.1016/j.promfg.2018.02.156.
- Kvande, H. 2014. The aluminum smelting process. J. Occup. Environ. 56: S2.
- Kwade, A., W. Haselrieder, R. Leithoff, A. Modlinger, F. Dietrich, and K. Droeder. 2018. Current status and challenges for automotive battery production technologies. Nat. Energy 3 (4):290–300. doi:https://doi.org/10.1038/s41560-018-0130-3.
- Lai, X., D. Qiao, Y. Zheng, M. Ouyang, X. Han, and L. Zhou. 2019. A rapid screening and regrouping approach based on neural networks for large-scale retired lithium-ion cells in second-use applications. J. Clean. Prod. 213:776–91. doi:https://doi.org/10.1016/j.jclepro.2018.12.210.
- Lander, L., T. Cleaver, M. A. Rajaeifar, V. Nguyen-Tien, R. J. R. Elliott, O. Heidrich, E. Kendrick, J. S. Edge, and G. Offer. 2021. Financial viability of electric vehicle lithium-ion battery recycling. iScience 24 (7):102787. doi:https://doi.org/10.1016/j.isci.2021.102787.
- Larouche, F., F. Tedjar, K. Amouzegar, G. Houlachi, P. Bouchard, G. P. Demopoulos, and K. Zaghib. 2020. Progress and status of hydrometallurgical and direct recycling of li-ion batteries and beyond. Materials (Basel) 13 (3):801. doi:https://doi.org/10.3390/ma13030801.
- Larsson, F., P. Andersson, P. Blomqvist, and B. E. Mellander. 2017. Toxic fluoride gas emissions from lithium-ion battery fires. Sci. Rep 7 (1):10018. doi:https://doi.org/10.1038/s41598-017-09784-z.
- Latunussa, C. E. L., F. Ardente, G. A. Blengini, and L. Mancini. 2016. Life cycle assessment of an innovative recycling process for crystalline silicon photovoltaic panels. So. Energy. Mater. Sol. 156:101–11. doi:https://doi.org/10.1016/j.solmat.2016.03.020.
- Lee, C. H., C. E. Hung, S. L. Tsai, S. R. Popuri, and C. H. Liao. 2013. Resource recovery of scrap silicon solar battery cell. Waste Manag Res 31 (5):518–24. doi:https://doi.org/10.1177/0734242X13479433.
- Lee, J.-K., J.-S. Lee, Y.-S. Ahn, G.-H. Kang, H.-E. Song, J.-I. Lee, M.-G. Kang, and C.-H. Cho. 2017. Photovoltaic performance of c-si wafer reclaimed from end-of-life solar cell using various mixing ratios of HF and HNO3. So. Energy. Mater. Sol. 160:301–06. doi:https://doi.org/10.1016/j.solmat.2016.10.034.
- Lee, J.-K., J.-S. Lee, Y.-S. Ahn, G.-H. Kang, H.-E. Song, M.-G. Kang, Y.-H. Kim, and C.-H. Cho. 2018a. Simple pretreatment processes for successful reclamation and remanufacturing of crystalline silicon solar cells. Prog. Photovolt: Res. Appl. 26 (3):179–87. doi:https://doi.org/10.1002/pip.2963.
- Lee, W. J., H. V. Kim, J. H. Choi, G. Panomsuwan, Y. C. Lee, B. S. Rho, and J. Kang. 2018b. Recycling waste soot from merchant ships to produce anode materials for rechargeable lithium-ion batteries. Sci. Rep 8 (1):5601. doi:https://doi.org/10.1038/s41598-018-23945-8.
- Li, Z., and M. Ouyang. 2011. A win–win marginal rent analysis for operator and consumer under battery leasing mode in China electric vehicle market. Energy Policy 39 (6):3222–37. doi:https://doi.org/10.1016/j.enpol.2011.03.014.
- Li, G., and L. An. 2019. Impacts of recycling of spent lithium-ion batteries on environmental burdens.
- Li, L., P. Zheng, T. Yang, R. Sturges, M. W. Ellis, and Z. Li. 2019. Disassembly automation for recycling end-of-life lithium-ion pouch cells. Jom 71 (12):4457–64. doi:https://doi.org/10.1007/s11837-019-03778-0.
- Li, J., Y. Lu, T. Yang, D. Ge, D. L. Wood 3rd, and Z. Li. 2020. Water-based electrode manufacturing and direct recycling of lithium-ion battery electrodes-a green and sustainable manufacturing system. iScience 23 (5):101081. doi:https://doi.org/10.1016/j.isci.2020.101081.
- Li, W., S. Lee, and A. Manthiram. 2020. High-nickel NMA: A cobalt-free alternative to NMC and NCA cathodes for lithium-ion batteries. Adv. Mater. Weinheim 32 (33):e2002718. doi:https://doi.org/10.1002/adma.202002718.
- Li, J., Y. Lin, F. Wang, J. Shi, J. Sun, B. Ban, G. Liu, and J. Chen. 2021a. Progress in recovery and recycling of kerf loss silicon waste in photovoltaic industry. Sep. Purif. Technol. 254:117581. doi:https://doi.org/10.1016/j.seppur.2020.117581.
- Li, Y., W. Lv, H. Huang, W. Yan, X. Li, P. Ning, H. Cao, and Z. Sun. 2021b. Recycling of spent lithium-ion batteries in view of green chemistry. Green. Chem. 23 (17):6139–71. doi:https://doi.org/10.1039/D1GC01639C.
- Liao, Q., M. Mu, S. Zhao, L. Zhang, T. Jiang, J. Ye, X. Shen, and G. Zhou. 2017. Performance assessment and classification of retired lithium ion battery from electric vehicles for energy storage. Int. J. Hydrogen Energy 42 (30):18817–23. doi:https://doi.org/10.1016/j.ijhydene.2017.06.043.
- Lin, K.-L., T.-C. Chu, C.-J. Cheng, C.-H. Lee, T.-C. Chang, and K.-S. Wang. 2012. Recycling solar panel waste glass sintered as glass-ceramics. Environ. Prog. Sustain. 31 (4):612–18. doi:https://doi.org/10.1002/ep.10587.
- Lin, K. L., L. S. Huang, J. L. Shie, C. J. Cheng, C. H. Lee, and T. C. Chang. 2013. Elucidating the effects of solar panel waste glass substitution on the physical and mechanical characteristics of clay bricks. Environ Technol 34 (1):15–24. doi:https://doi.org/10.1080/09593330.2012.679693.
- Lin, K.-L., T.-C. Lee, and C.-L. Hwang. 2014. Effects of sintering temperature on the characteristics of solar panel waste glass in the production of ceramic tiles. J. Mater. Cycles Waste Manag. 17:194–200. doi:https://doi.org/10.1007/s10163-014-0240-3.
- Liu, S., and D. Gong. 2014. Modelling and simulation on recycling of electric vehicle batteries - using agent approach. Int. J. Simul. Model. 13 (1):79–92. doi:https://doi.org/10.2507/IJSIMM13(1)CO1.
- Liu, K., Z. Wei, Z. Yang, and K. Li. 2021. Mass load prediction for lithium-ion battery electrode clean production: A machine learning approach. J. Clean. Prod. 289:125159. doi:https://doi.org/10.1016/j.jclepro.2020.125159.
- Longi Solar. 2018. Making every photon count. Power PV Tech. 15:112.
- Longi Solar. 2022a. Green energy. Accessed March 11, 2022. https://www.longi.com/en/sustainable-development/environment/ .
- Loritz, M. (2018). “Dutch solar rental startup Solease raises €3 million from New York investment fund.” Retrieved April 5, 2022, from https://www.eu-startups.com/2018/12/solease-raises-funding/.
- Lunardi, M., J. Alvarez-Gaitan, J. Bilbao, and R. Corkish. 2018. Comparative life cycle assessment of end-of-life silicon solar photovoltaic modules. Applied Sciences 8 (8):1396. doi:https://doi.org/10.3390/app8081396.
- Lv, W., Z. Wang, H. Cao, Y. Sun, Y. Zhang, and Z. Sun. 2018. A critical review and analysis on the recycling of spent lithium-ion batteries. ACS Sustain. Chem. Eng. 6 (2):1504–21. doi:https://doi.org/10.1021/acssuschemeng.7b03811.
- MacArthur Foundation, E. (2022a). “Circular economy introduction.” Retrieved February 15, 2022, from https://ellenmacarthurfoundation.org/topics/circular-economy-introduction/overview.
- MacArthur Foundation, E. (2022b). “What is a circular economy?” Retrieved February 17, 2022, from https://ellenmacarthurfoundation.org/topics/circular-economy-introduction/overview.
- MacArthur Foundation, E. (2022c). “Recycling and the circular economy: What’s the difference?” Retrieved February 17, 2022, from https://ellenmacarthurfoundation.org/articles/recycling-and-the-circular-economy-whats-the-difference.
- Mackenzie, W. (2020). “Annual solar repairs and maintenance spend to grow to $9 billion by 2025.” Retrieved April 5, 2022, from https://www.woodmac.com/press-releases/annual-solar-repairs-and-maintenance-spend-to-grow-to-$9-billion-by-2025/.
- Mahmoudi, S., N. Huda, and M. Behnia. 2020. Environmental impacts and economic feasibility of end of life photovoltaic panels in Australia: A comprehensive assessment. J. Clean. Prod. 260:120996. doi:https://doi.org/10.1016/j.jclepro.2020.120996.
- Mai, T., P. Jadun, J. Logan, C. McMillan, M. Muratori, D. Steinberg, and L. Vimmerstedt. 2018. Electrification futures study: Scenarios of electric technology adoption and power consumption for the United States. Golden, CO: National Renewable Energy Laboratory.
- Makuza, B., Q. Tian, X. Guo, K. Chattopadhyay, and D. Yu. 2021. Pyrometallurgical options for recycling spent lithium-ion batteries: A comprehensive review. J. Power. Sources. 491:229622. doi:https://doi.org/10.1016/j.jpowsour.2021.229622.
- Mallett, R., J. Hagen-Zanker, R. Slater, and M. Duvendack. 2012. The benefits and challenges of using systematic reviews in international development research. J. Dev. Effect 4 (3):445–55. doi:https://doi.org/10.1080/19439342.2012.711342.
- Mann, S. A., V. W. Fthenakis, and M. de Wild-scholten. 2013. The energy payback time of advanced crystalline silicon PV modules in 2020: A prospective study. Prog. Photovolt: Res. Appl. 22(11): 1180–1194.
- Mao, J., J. Miao, Y. Lu, and Z. Tong. 2021. Machine learning of materials design and state prediction for lithium ion batteries. Chin. J. Chem. Eng. 37:1–11. doi:https://doi.org/10.1016/j.cjche.2021.04.009.
- Maranville, A. R., T. F. Ting, and Y. Zhang. 2009. An environmental justice analysis: Superfund sites and surrounding communities in illinois. Environ. Justice. 2 (2):49–58. doi:https://doi.org/10.1089/env.2008.0547.
- Marjamaa, M., H. Salminen, J. Kujala, R. Tapaninaho, and A. Heikkinen. 2021. A sustainable circular economy: Exploring stakeholder interests in finland. South Asian J. Bus. Manag. Cases 10 (1):50–62. doi:https://doi.org/10.1177/2277977921991914.
- Markert, E., I. Celik, and D. Apul. 2020. Private and externality costs and benefits of recycling crystalline silicon (c-si) photovoltaic panels. Energies 13 (14):3650. doi:https://doi.org/10.3390/en13143650.
- Martuzzi, M., F. Mitis, and F. Forastiere. 2010. Inequalities, inequities, environmental justice in waste management and health. Eur J Public Health 20 (1):21–26. doi:https://doi.org/10.1093/eurpub/ckp216.
- Mathur, N., S. Singh, and J. W. Sutherland. 2020. Promoting a circular economy in the solar photovoltaic industry using life cycle symbiosis. Resour. Conserv. Recycl. 155:104649. doi:https://doi.org/10.1016/j.resconrec.2019.104649.
- Mayyas, A., D. Steward, and M. Mann. 2019. The case for recycling: Overview and challenges in the material supply chain for automotive li-ion batteries. Sustainable Mater.Technol. 19:e00087. doi:https://doi.org/10.1016/j.susmat.2018.e00087.
- McKinsey & Company. 2017. Mapping the benefits of a circular economy. New York, NY: McKinsey Quarterly.
- Melin, H. E., M. A. Rajaeifar, A. Y. Ku, A. Kendall, G. Harper, and O. Heidrich. 2021. Global implications of the EU battery regulation. Science 373 (6553):384–87. doi:https://doi.org/10.1126/science.abh1416.
- Merli, R., M. Preziosi, and A. Acampora. 2018. How do scholars approach the circular economy? A systematic literature review. J. Clean. Prod. 178:703–22. doi:https://doi.org/10.1016/j.jclepro.2017.12.112.
- Meshram, P., B. D. Pandey, and T. R. Mankhand. 2014. Extraction of lithium from primary and secondary sources by pre-treatment, leaching and separation: A comprehensive review. Hydrometallurgy 150:192–208. doi:https://doi.org/10.1016/j.hydromet.2014.10.012.
- Mezei, A., M. Ashbury, M. Canizares, R. Molnar, H. Given, A. Meader, K. Squires, F. Ojebuoboh, T. Jones, and W. Wang. 2008. Hydrometallurgical recycling of the semiconductor material from photovoltaic materials—part II: Metal recovery. In Hydrometallurgy 2008: Proceedings of the 6th international symposium. Englewood, CO: Society for Mining Metallurgy & Exploration.
- Mies, A., and S. Gold. 2021. Mapping the social dimension of the circular economy. J. Clean. Prod. 321: 128960.
- Miller, C., I. Peters, and S. Zaveri. 2020. Thin film cdte photovoltaics and the U.S. Tempe, AZ: QESST Engineering Research Center. ( Energy Transition in 2020)
- Mints, P. 2018. Photovoltaic manufacturer capacity, shipments, price & revenues 2017/2018. San Francisco, CA: SPV Market Research.
- Mirzaei Omrani, M., and H. Jannesari. 2019. Economic and environmental assessment of reusing electric vehicle lithium-ion batteries for load leveling in the residential, industrial and photovoltaic power plants sectors. Renewable Sustainable Energy Rev. 116:109413. doi:https://doi.org/10.1016/j.rser.2019.109413.
- Mohai, P., and R. Saha. 2015. Which came first, people or pollution? Assessing the disparate siting and post-siting demographic change hypotheses of environmental injustice. Environ. Res. Lett. 10 (11):115008. doi:https://doi.org/10.1088/1748-9326/10/11/115008.
- Mohr, M., J. F. Peters, M. Baumann, and M. Weil. 2020. Toward a cell‐chemistry specific life cycle assessment of lithium‐ion battery recycling processes. J. Ind. Ecol. 24 (6):1310–22. doi:https://doi.org/10.1111/jiec.13021.
- Morita, Y., Y. Saito, T. Yoshioka, and T. Shiratori. 2021. Estimation of recoverable resources used in lithium-ion batteries from portable electronic devices in Japan. Resour. Conserv. Recycl. 175:105884. doi:https://doi.org/10.1016/j.resconrec.2021.105884.
- Morseletto, P. 2020. Targets for a circular economy. Resour. Conserv. Recycl. 153:104553. doi:https://doi.org/10.1016/j.resconrec.2019.104553.
- Nembhard, N. 2020. Safe, sustainable discharge of electric vehicle batteries as a pre-treatment step to crushing in the recycling process. Stockholm, Sweden: Master of Science, KTH Royal Institute of Technology.
- Neubauer, J. S., E. Wood, and A. Pesaran. 2015. A second life for electric vehicle batteries: Answering questions on battery degradation and value. SAE Int. J. Mater. Manuf 8 (2):544–53. doi:https://doi.org/10.4271/2015-01-1306.
- Nirmale, T. C., B. B. Kale, and A. J. Varma. 2017. A review on cellulose and lignin based binders and electrodes: Small steps towards a sustainable lithium ion battery. Int. J. Biol. Macromol. 103:1032–43. doi:https://doi.org/10.1016/j.ijbiomac.2017.05.155.
- Nissan Motor Corporation. (2021). “Nissan gives EV batteries a second life.” Retrieved April 5, 2022, from https://global.nissanstories.com/en/releases/4r.
- Norgren, A., A. Carpenter, and G. Heath. 2020. Design for recycling principles applicable to selected clean energy technologies- crystalline-silicon photovoltaic modules, electric vehicle batteries, and wind turbine blades. J. Sustain. Metall. 6:761–74. doi:https://doi.org/10.1007/s40831-020-00313-3.
- Novis Smith, W., and S. Swoffer. 2013. Recovery of lithium ion batteries, 2022. Alexandria, VA: Retriev Tech Inc.
- NREL. 2015. Battery ownership model medium duty HEV battery leasing & standardization. Golden, CO: National Renewable Energy Laboratory.
- NREL. 2021. H1 2021 - solar industry update. Golden, CO: National Renewable Energy Laboratory.
- NREL. (2022a). “Utility-scale PV.” National Renewable Energy Laboratory. Retrieved March 18, 2022, from https://atb.nrel.gov/electricity/2021/utility-scale_pv.
- NREL. (2022b). “Storage futures study.” National Renewable Energy Laboratory. Retrieved April 4, 2022, from https://www.nrel.gov/analysis/storage-futures.html.
- NREL. (2022c). “Best research-cell efficiency chart.” National Renewable Energy Laboratory. Retrieved April 1, 2022, from https://www.nrel.gov/pv/cell-efficiency.html.
- NSF International Standard/American National Standard. 2019. NSF/ANSI 457 - 2019 - sustainability leadership standard for photovoltaic modules and photovoltaic inverters. Ann Arbor, MI: NSF International.
- Oak Ridge National Laboratory. 2021. Automated disassembly line aims to make battery recycling safer, faster. Accessed February 1, 2022. https://www.ornl.gov/news/automated-disassembly-line-aims-make-battery-recycling-safer-faster .
- Oreski, G., J. Stein, G. Eder, K. Berger, L. S. Bruckman, J. Vedde, K. A. Weiss, T. Tanahashi, R. H. French, and S. Ranta. 2021. designing new materials for photovoltaics: Opportunities for lowering cost and increasing performance through advanced material innovations, international energy agency.
- ORNL/NREL. 2019. Medium- and heavy-duty vehicle electrification: An assessment of technology and knowledge gaps. Washington, DC: Oak Ridge National Laboratory and National Renewable Energy Laboratory.
- O’Shaughnessy, E., G. Barbose, R. Wiser, S. Forrester, and N. Darghouth. 2020. The impact of policies and business models on income equity in rooftop solar adoption. Nat. Energy 6 (1):84–91. doi:https://doi.org/10.1038/s41560-020-00724-2.
- Ovaitt, S., H. M. Mirletz, A. Hegedus, A. Gaulding, and T. Barnes (2021). PV evolution in the light of circular economy. In IEEE 48th Photovoltaic Specialists Conference (PVSC), Virtual. 1570–75.
- Ovaitt, S., H. Mirletz, S. Seetharaman, and T. Barnes. 2022. PV in the circular economy, a dynamic framework analyzing technology evolution and reliability impacts. iScience 25 (1):103488. doi:https://doi.org/10.1016/j.isci.2021.103488.
- PACE. (2022). “Platform for accelerating the circular economy.” Platform for Accelerating the Circular Economy. Retrieved February 15, 2022, from https://pacecircular.org.
- Pacific Northwest National Laboratory. 2021. Energy storage policy database. Accessed February 10, 2022. https://energystorage.pnnl.gov/regulatoryactivities.asp .
- Palitzsch, W., A. Killenberg, P. Schönherr, and U. Loser, (2018). Photovoltaic recycling with the help of water and light-it does not get greener. IEEE 7th World Conference on Photovoltaic Energy Conversion (WCPEC)(A Joint Conference of 45th IEEE PVSC, 28th PVSEC & 34th EU PVSEC), Waikoloa, HI.
- Palitzsch, W., and U. Loser (2011). A new and intelligent de-metalization step of broken silicon cells and silicon cell production waste in the recycling procedure of crystalline si modules. In 2011 37th IEEE Photovoltaic Specialists Conference, 003269–70. Seattle, WA.
- Parikh, V. P., A. Ahmadi, M. H. Parekh, F. Sadeghi, and V. G. Pol. 2019. Upcycling of spent lithium cobalt oxide cathodes from discarded lithium-ion batteries as solid lubricant additive. Environ. Sci. Technol. 53 (7):3757–63. doi:https://doi.org/10.1021/acs.est.8b07016.
- Pellow, M. A., H. Ambrose, D. Mulvaney, R. Betita, and S. Shaw. 2020. Research gaps in environmental life cycle assessments of lithium ion batteries for grid-scale stationary energy storage systems: End-of-life options and other issues. Sustainable Mater.Technol. 23:e00120. doi:https://doi.org/10.1016/j.susmat.2019.e00120.
- Peng, J., L. Lu, and H. Yang. 2013. Review on life cycle assessment of energy payback and greenhouse gas emission of solar photovoltaic systems. Renewable Sustainable Energy Rev. 19:255–74. doi:https://doi.org/10.1016/j.rser.2012.11.035.
- Peters, I. M., C. Breyer, S. A. Jaffer, S. Kurtz, T. Reindl, R. Sinton, and M. Vetter. 2021. The role of batteries in meeting the PV terawatt challenge. Joule 5 (6):1353–70. doi:https://doi.org/10.1016/j.joule.2021.03.023.
- Petri, I., M. Barati, Y. Rezgui, and O. F. Rana. 2020. Blockchain for energy sharing and trading in distributed prosumer communities. Comput. Ind. 123: 103282.
- Phoenix Renewable Services. (2022). “About Us - phoenix renewable services.” Retrieved April 5, 2022, from https://www.phoenixrs.com/about-us/.
- Phua, B., X. Shen, P.-C. Hsiao, C. Kong, A. Stokes, and A. Lennon. 2020. Degradation of plated silicon solar module due to copper diffusion: The role of capping layer formation and contact adhesion. So. Energy. Mater. Sol. 215:110638. doi:https://doi.org/10.1016/j.solmat.2020.110638.
- Potting, J., M. Hekkert, E. Worrell, and A. Hanemaaijer. 2017. Circular economy: Measuring innovation in the product Chain. Haag, Netherlands: PBL Netherlands Environmental Assessment Agency.
- Prado, V., K. Rogers, and T. P. Seager. 2012. Integration of MCDA tools in valuation of comparative life cycle assessment. life cycle assessment handbook In Life cycle assessment handbook: A guide for environmentally sustainable products, 413–32. Beverly, MA: Scrivener Publishing.
- Prado-Lopez, V., T. P. Seager, M. Chester, L. Laurin, M. Bernardo, and S. Tylock. 2013. Stochastic multi-attribute analysis (SMAA) as an interpretation method for comparative life-cycle assessment (LCA). Int. J. Life Cycle Assess. 19 (2):405–16. doi:https://doi.org/10.1007/s11367-013-0641-x.
- Prado-Lopez, V., B. A. Wender, T. P. Seager, L. Laurin, M. Chester, and E. Arslan. 2016. Tradeoff evaluation improves comparative life cycle assessment: A photovoltaic case study. J. Ind. Ecol. 20 (4):710–18. doi:https://doi.org/10.1111/jiec.12292.
- PRISMA. (2021a). “Welcome to the Preferred Reporting Items for Systematic Reviews and Meta-Analyses (PRISMA) website!” Retrieved April 4, 2022, from http://www.prisma-statement.org/.
- PRISMA. (2021b). “PRISMA endorsers.” Retrieved February 17, 2022, from http://www.prisma-statement.org/Endorsement/PRISMAEndorsers.
- Pudas, J., A. Erkkila, and J. Viljamaa. (2011). “Battery recycling method.” Retrieved April 5, 2022, from https://patents.google.com/patent/US8979006B2/en.
- Putri, N. J., and R. D. Kusumastuti. 2021. Reverse logistics analysis on household electronic waste management using system dynamics simulation approach. In IOP conference series: Earth and environmental science, vol. 940, no. 1, p. 012025. IOP Publishing.
- PVCycle. (2022). “PVCycle services.” Retrieved April 5, 2022, from https://pvcycle.org/about-pv-cycle/.
- Qin, B., M. Lin, X. Zhang, Z. Xu, and J. Ruan. 2020. Recovering polyethylene glycol terephthalate and ethylene-vinyl acetate copolymer in waste solar cells via a novel vacuum-gasification-condensation process. ACS ES&T Engineering 1 (3):357–62. doi:https://doi.org/10.1021/acsestengg.0c00091.
- Radziemska, E., P. Ostrowski, A. Cienian, and M. Sawczak. 2010. Chemical, thermal and laser processes in recycling of photovoltaic silicon solar cells and modules. Ecol. Chem. Eng. S 17 (3):385–91.
- Rai, V., and B. Sigrin. 2013. Diffusion of environmentally-friendly energy technologies: Buy versus lease differences in residential PV markets. Environ. Res. Lett. 8 (1):014022. doi:https://doi.org/10.1088/1748-9326/8/1/014022.
- Rai, V., D. C. Reeves, and R. Margolis. 2016. Overcoming barriers and uncertainties in the adoption of residential solar PV. Renew. Energ. 89:498–505. doi:https://doi.org/10.1016/j.renene.2015.11.080.
- Rajagopalan, N., A. Smeets, K. Peeters, S. De Regel, T. Rommens, K. Wang, P. Stolz, R. Frischknecht, G. Heath, and D. Ravikumar. 2021. Preliminary environmental and financial viability analysis of circular economy scenarios for satisfying PV system service lifetime. Report T12-21:2021, International Energy Agency (IEA) PVPS Task 12.
- Rajan, K., M. Rossi, A. McPherson, and C. Rajan. (2020). “Safely meeting demand for renewable energy with innovative material design for health and sustainability.” Retrieved April 5, 2022, from https://www.pv-magazine.com/2020/10/05/dont-publish-safely-meeting-demand-for-renewable-energy-with-innovative-material-design-for-health-and-sustainability/.
- Rallo, H., G. Benveniste, I. Gestoso, and B. Amante. 2020. Economic analysis of the disassembling activities to the reuse of electric vehicles li-ion batteries. Resour. Conserv. Recycl. 159: 104785.
- Randell Environmental Consulting. 2016. Waste lithium-ion battery projections - lithium-ion forums: Recycling, transport and warehousing. Melbourne, Australia: Randell Environmental Consulting.
- Rapaport, S., M. Green, C. Ulbrich, P. Graniero, and A. Louwen. 2021. The use of advanced algorithms in PV failure monitoring. Report T13-19:2021, International Energy Agency (IEA) PVPS Task 13.
- Rastegarpanah, A., J. Hathaway, M. Ahmeid, S. Lambert, A. Walton, and R. Stolkin. 2020. A rapid neural network–based state of health estimation scheme for screening of end of life electric vehicle batteries. Proc. Inst. Mech. Eng., I: J. Syst. 235 (3):330–46.
- Ravikumar, D., T. P. Seager, M. V. Chester, and M. P. Fraser. 2014. Intertemporal cumulative radiative forcing effects of photovoltaic deployments. Environ. Sci. Technol. 48 (17):10010–18. doi:https://doi.org/10.1021/es502542a.
- Ravikumar, D., P. Sinha, T. P. Seager, and M. P. Fraser. 2016. An anticipatory approach to quantify energetics of recycling CdTe photovoltaic systems. Prog. Photovolt: Res. Appl. 24 (5):735–46. doi:https://doi.org/10.1002/pip.2711.
- Ravikumar, D., B. Wender, T. P. Seager, M. P. Fraser, and M. Tao. 2017. A climate rationale for research and development on photovoltaics manufacture. Appl. Energy 189:245–56. doi:https://doi.org/10.1016/j.apenergy.2016.12.050.
- Ravikumar, D., T. P. Seager, S. Cucurachi, V. Prado, and C. Mutel. 2018. Novel method of sensitivity analysis improves the prioritization of research in anticipatory life cycle assessment of emerging technologies. Environ. Sci. Technol. 52 (11):6534–43. doi:https://doi.org/10.1021/acs.est.7b04517.
- Ravikumar, D., T. Seager, P. Sinha, M. P. Fraser, S. Reed, E. Harmon, and A. Power. 2020. Environmentally improved CdTe photovoltaic recycling through novel technologies and facility location strategies. Prog. Photovolt: Res. Appl. 28 (9):887–98. doi:https://doi.org/10.1002/pip.3279.
- ReCell. (2021). Advanced battery recycling. Accessed March 1, 2022. https://recellcenter.org/about/ .
- Recupyl. (2013). “Challenge for recycling advanced EV batteries.” Retrieved April 5, 2022, from https://iba2013.icmab.es//images/files/Friday/Morning/Farouk%20Tedjar.pdf.
- Reike, D., W. J. V. Vermeulen, and S. Witjes. 2018. The circular economy: New or refurbished as CE 3.0? — exploring controversies in the conceptualization of the circular economy through a focus on history and resource value retention options. Resour. Conserv. Recycl. 135:246–64. doi:https://doi.org/10.1016/j.resconrec.2017.08.027.
- REMADE. (2022). “Accelerating the Transition to a Circular Economy.” Retrieved February 15, 2022, from https://remadeinstitute.org.
- Renewable Energy World. (2020). “SMUD’s energy storage Shares program: The first virtual energy storage program in the US.” Retrieved April 5, 2022, from https://www.renewableenergyworld.com/storage/smuds-energy-storageshares-program-the-first-virtual-energy-storage-program-in-the-us/.
- Renewance. (2021). “End of life management - planning and executing a decommissioning project.” Retrieved 2022, from https://batterystewardship.com/renewance-connect-services/end-of-life-management/.
- Retriev Technologies. (2021). “Introducing the largest lithium-ion battery recycling network in North America: Retriev technologies announces its combination with heritage battery recycling.” Retrieved April 5, 2022, from https://www.retrievtech.com/lithiumion .
- Reuters. (2020). “China publishes new standards for copper and aluminum scrap.” Retrieved 2022, from https://www.reuters.com/article/us-china-metals-scrap/china-publishes-new-standards-for-copper-and-aluminum-scrap-idUSKBN1ZI0IA .
- Richa, K., C. W. Babbitt, N. G. Nenadic, and G. Gaustad. 2015. Environmental trade-offs across cascading lithium-ion battery life cycles. Int. J. Life Cycle Assess. 22 (1):66–81. doi:https://doi.org/10.1007/s11367-015-0942-3.
- Richa, K., C. W. Babbitt, and G. Gaustad. 2017. Eco‐efficiency analysis of a lithium‐ion battery waste hierarchy inspired by circular economy. J. Ind. Ecol. 21 (3):715–30. doi:https://doi.org/10.1111/jiec.12607.
- Richard, D. 2011. The right chemistry: Market survey on encapsulation materials sees a new trend, with companies moving toward alternatives to Tedlar, while EVA still holds its ground. Photon International 8:280–302.
- Rinovasol. (2022). “Professionally refurbished solar panels.” Retrieved April 5, 2022, from https://www.rinovasol.com/solar-panel-refurbishment.
- Rocchetti, L., and F. Beolchini. 2015. Recovery of valuable materials from end-of-life thin-film photovoltaic panels: Environmental impact assessment of different management options. J. Clean. Prod. 89:59–64. doi:https://doi.org/10.1016/j.jclepro.2014.11.009.
- ROSI Solar. 2022. Technical solutions for a circular economy in the photovoltaic industry. Return of Sili con. Accessed April 5, 2022. https://www.rosi-solar.com/our-solutions/
- Roy, J. J., S. Rarotra, V. Krikstolaityte, K. W. Zhuoran, Y. D. Cindy, X. Y. Tan, M. Carboni, D. Meyer, Q. Yan, and M. Srinivasan. 2021. Green recycling methods to treat lithium-ion batteries e-waste: A circular approach to sustainability. Advanced Materials Adv Mater: e2103346, 2103346. doi:https://doi.org/10.1002/adma.202103346.
- Rubino, A., G. Granata, E. Moscardini, L. Baldassari, P. Altimari, L. Toro, and F. Pagnanelli. 2020. Development and techno-economic analysis of an advanced recycling process for photovoltaic panels enabling polymer separation and recovery of ag and si. Energies 13 (24):6690. doi:https://doi.org/10.3390/en13246690.
- S & P Global Commodity Insights. (2021). “EU may restrict waste exports including metals scrap to non-OECD countries.” Retrieved 2022, from https://www.spglobal.com/commodity-insights/en/market-insights/latest-news/metals/111721-eu-may-restrict-waste-exports-including-metals-scrap-to-non-oecd-countries.
- Saavedra, Y. M. B., D. R. Iritani, A. L. R. Pavan, and A. R. Ometto. 2018. Theoretical contribution of industrial ecology to circular economy. J. Clean. Prod. 170:1514–22. doi:https://doi.org/10.1016/j.jclepro.2017.09.260.
- SAE. 2016. SAE J 3071-2016 (SAE J3071-2016) - automotive battery recycling identification and cross contamination prevention. New York, NY: Society of Automotive Engineers.
- SAE. (2019). “SAE J 2974-2019 - technical information report on automotive battery recycling.” Society of Automotive Engineers. Retrieved April 5, 2022, from https://webstore.ansi.org/Standards/SAE/SAE29742019?source=blog .
- Saint-Sernin, E., R. Einhaus, K. Bamberg, and P. Panno. 2008. Industrialisation of Apollon solar’s NICE module technology. 23rd EU PVSEC, Valencia, Spain.
- Salim, H. K., R. A. Stewart, O. Sahin, and M. Dudley. 2019. End-of-life management of solar photovoltaic and battery energy storage systems: A stakeholder survey in Australia. Resour. Conserv. Recycl. 150:104444. doi:https://doi.org/10.1016/j.resconrec.2019.104444.
- Samarukha, I. 2020. Recycling strategies for end-of-life li-ion batteries from heavy electric vehicles. Maters thesis, KTH Royal Institute of Technology.
- Santos, R. E. S., and F. Q. B. D. Silva (2013). Motivation to perform systematic reviews and their impact on software engineering practice. 2013 ACM/IEEE International Symposium on Empirical Software Engineering and Measurement, Baltimore, MD.
- Schnell, J., C. Nentwich, F. Endres, A. Kollenda, F. Distel, T. Knoche, and G. Reinhart. 2019. Data mining in lithium-ion battery cell production. J. Power. Sources. 413:360–66. doi:https://doi.org/10.1016/j.jpowsour.2018.12.062.
- Schulz-Mönninghoff, M., N. Bey, P. U. Nørregaard, and M. Niero. 2021. Integration of energy flow modelling in life cycle assessment of electric vehicle battery repurposing: Evaluation of multi-use cases and comparison of circular business models. Resour. Conserv. Recycl. 174:105773. doi:https://doi.org/10.1016/j.resconrec.2021.105773.
- Schwinde, S., M. Berg, and M. Kunert. 2015. New potential for reduction of kerf loss and wire consumption in multi-wire sawing. So. Energy. Mater. Sol. 136:44–47. doi:https://doi.org/10.1016/j.solmat.2014.12.020.
- Scott, N., and A. Heath Garvin. 2021. Life cycle greenhouse gas emissions from electricity generation: Update. NREL/FS-6A50–80580, National Renewable Energy Laboratory, Golden, CO. https://www.nrel.gov/docs/fy21osti/80580.pdf .
- Secondsol. 2020. Secondsol. Accessed February 15, 2022. https://www.secondsol.com/en/company/portrait/ .
- SEIA. (2022). “SEIA national PV recycling program.” Solar Energy Industries Association. Retrieved April 5, 2022, from https://www.seia.org/initiatives/seia-national-pv-recycling-program.
- SEMI. (2012). “SEMI PV17 - specification for virgin silicon feedstock materials for photovoltaic applications.” Retrieved 2021, from https://store-us.semi.org/products/pv01700-semi-pv17-specification-for-virgin-silicon-feedstock-materials-for-photovoltaic-applications.
- Shen, B., P. Zhou, S. Chen, H. Yuan, N. Zhu, T. Sun, and Z. Lou. 2019. Manganese-based catalysts recovered from spent ternary lithium-ion batteries and its catalytic activity enhanced by a mechanical method. J. Clean. Prod. 213:1346–52. doi:https://doi.org/10.1016/j.jclepro.2018.12.248.
- Shin, J., J. Park, and N. Park. 2017. A method to recycle silicon wafer from end-of-life photovoltaic module and solar panels by using recycled silicon wafers. So. Energy. Mater. Sol. 162:1–6. doi:https://doi.org/10.1016/j.solmat.2016.12.038.
- Sica, D., O. Malandrino, S. Supino, M. Testa, and M. C. Lucchetti. 2018. Management of end-of-life photovoltaic panels as a step towards a circular economy. Renewable Sustainable Energy Rev. 82:2934–45. doi:https://doi.org/10.1016/j.rser.2017.10.039.
- Silicon Valley Toxics Coalition (SVTC). (2019). “Solar scorecard (2018-2019).” Retrieved 2019, from http://www.solarscorecard.com/2018-19/2018-19-SVTC-Solar-Scorecard.pdf.
- Sinha, P., M. Cossette, and J.-F. Ménard. 2012. End-of-life CdTe PV recycling with semiconductor refining. In 27th European photovoltaic solar energy conference and exhibition, 24–28. Frankfurt, Germany.
- Sinha, P., G. Heath, A. Wade, and K. Komoto. 2019. Human health risk assessment methods for PV Part 3 module disposal risks International Energy Agency (IEA) PVPS Task 12. Report T12-16:2020.
- Sinha, P., S. Raju, K. Drozdiak, and A. Wade. 2018. Life cycle management and recycling of PV systems. PVTech 13: 47–50.
- Skeldon, A. C., F. Schiller, A. Yang, T. Balke-Visser, A. Penn, and N. Gilbert. 2018. Agent-based modelling to predict policy outcomes: A food waste recycling example. Environ Sci Policy 87:85–91. doi:https://doi.org/10.1016/j.envsci.2018.05.011.
- Slattery, M., J. Dunn, and A. Kendall. 2021. Transportation of electric vehicle lithium-ion batteries at end-of-life: A literature review. Resour. Conserv. Recycl. 174: 105755.
- Sloop, S. E., L. Crandon, M. Allen, M. M. Lerner, H. Zhang, W. Sirisaksoontorn, L. Gaines, J. Kim, and M. Lee. 2019. Cathode healing methods for recycling of lithium-ion batteries. Sustainable Mater.Technol. 22:e00113. doi:https://doi.org/10.1016/j.susmat.2019.e00113.
- Sloop, S., L. Crandon, M. Allen, K. Koetje, L. Reed, L. Gaines, W. Sirisaksoontorn, and M. Lerner. 2020. A direct recycling case study from a lithium-ion battery recall. Sustainable Mater.Technol. 25:e00152. doi:https://doi.org/10.1016/j.susmat.2020.e00152.
- SmithBucklin Statistics Group. 2019. National recycling rate study. Chicago, IL: SmithBucklin Statistics Group.
- SMUD. (2021). “Energy StorageShares.” Sacramento Municipal Utility District. Retrieved April 5, 2022, from https://www.smud.org/-/media/Documents/Corporate/About-Us/Energy-Research-and-Development/Innovations/Energy-SolarShares.ashx .
- Solar Power World. (2021). “Think before trashing: The second-hand solar market is booming.” Retrieved April 5, 2022, from https://www.solarpowerworldonline.com/2021/01/think-before-trashing-the-second-hand-solar-market-is-booming/.
- SolarRecyclingExperts. (2021). “SolarRecyclingExperts - Services.” Retrieved April 5, 2022, from https://www.solarrecyclingexperts.com/service#solar.
- Sommerville, R., J. Shaw-Stewart, V. Goodship, N. Rowson, and E. Kendrick. 2020. A review of physical processes used in the safe recycling of lithium ion batteries. Sustainable Mater.Technol. 25:e00197. doi:https://doi.org/10.1016/j.susmat.2020.e00197.
- Song, X., S. Hu, D. Chen, and B. Zhu. 2017a. Estimation of waste battery generation and analysis of the waste battery recycling system in China. J. Ind. Ecol. 21 (1):57–69. doi:https://doi.org/10.1111/jiec.12407.
- Song, X., T. Hu, C. Liang, H. L. Long, L. Zhou, W. Song, L. You, Z. S. Wu, and J. W. Liu. 2017b. Direct regeneration of cathode materials from spent lithium iron phosphate batteries using a solid phase sintering method. RSC Adv 7 (8):4783–90. doi:https://doi.org/10.1039/C6RA27210J.
- Spiers New Technologies. 2021. “The ‘Go To’ partner of vehicle OEM’s for life cycle management of advanced batteries.” Retrieved April 5, 2022, from http://www.spiersnewtechnologies.com/#snt.
- Spinella, L., and N. Bosco. 2021. Thermomechanical fatigue resistance of low temperature solder for multiwire interconnects in photovoltaic modules. So. Energy. Mater. Sol. 225:111054. doi:https://doi.org/10.1016/j.solmat.2021.111054.
- Standing Committee of the National People’s Congress. 2008. Circular economy promotion law of the people’s Republic of China. Beijing, China: Standing Committee of the National People’s Congress.
- Stehlík, M., J. Knapová, and V. Kostka. 2019. Possibilities of use of glass recyclate from photovoltaic panels for concrete masonry units. IOP Conf. Ser.: Mater. Sci. Eng. 549 (1):012006. doi:https://doi.org/10.1088/1757-899X/549/1/012006.
- Stevens, M., and S. Supekar. 2021. Characterizing electric vehicle battery end-of-life fates for agent-based model of battery repurposing and recycling systems. American Center for Life Cycle Assessment Conference, Virtual.
- Svatikova, K., I. Artola, S. Slingerland, and S. Fischer. 2015. Selling solar services as a contribution to a circular economy. Wuppertal, Germany: Wuppertal Institute.
- Tadaros, M., A. Migdalas, B. Samuelsson, and A. Segerstedt. 2020. Location of facilities and network design for reverse logistics of lithium-ion batteries in Sweden. Oper. Res. 22 (2):895–915. doi:https://doi.org/10.1007/s12351-020-00586-2.
- TamizhMani, G., S. Shaw, C. Libby, A. Patankar, and B. Bicer, 2019. Assessing variability in toxicity testing of PV modules. In IEEE 46th Photovoltaic Specialists Conference (PVSC), 2475–81. Chicago, IL.
- Tammaro, M., J. Rimauro, V. Fiandra, and A. Salluzzo. 2015. Thermal treatment of waste photovoltaic module for recovery and recycling: Experimental assessment of the presence of metals in the gas emissions and in the ashes. Renew. Energ. 81:103–12. doi:https://doi.org/10.1016/j.renene.2015.03.014.
- Tang, Y., Q. Zhang, Y. Li, H. Li, X. Pan, and B. McLellan. 2019. The social-economic-environmental impacts of recycling retired EV batteries under reward-penalty mechanism. Appl. Energy 251: 113313.
- Tang, X., K. Liu, K. Li, W. D. Widanage, E. Kendrick, and F. Gao. 2021. Recovering large-scale battery aging dataset with machine learning. Patterns (N Y) 2 (8):100302. doi:https://doi.org/10.1016/j.patter.2021.100302.
- Tao, M., V. Fthenakis, B. Ebin, B.-M. Steenari, E. Butler, P. Sinha, R. Corkish, K. Wambach, and E. S. Simon. 2020. Major challenges and opportunities in silicon solar module recycling. Prog. Photovolt: Res. Appl. 28 (10):1077–88. doi:https://doi.org/10.1002/pip.3316.
- Tao, Y., C. D. Rahn, L. A. Archer, and F. You. 2021. Second life and recycling: Energy and environmental sustainability perspectives for high-performance lithium-ion batteries. Sci. Adv. 7 (45). doi:https://doi.org/10.1126/sciadv.abi7633.
- Tesla. 2022. “Powerwall.” Retrieved January 31, 2022, from https://www.tesla.com/powerwall .
- The Cochrane Collaboration. 2022. Cochrane handbook for systematic reviews of interventions, ed. J. P. T. Higgins, J. Thomas et al. London, UK: The Cochrane Collaboration.
- Thomitzek, M., O. Schmidt, F. Röder, U. Krewer, C. Herrmann, and S. Thiede. 2018. Simulating process-product interdependencies in battery production systems. Procedia CIRP 72: 346–351.
- Thompson, D. L., J. M. Hartley, S. M. Lambert, M. Shiref, G. D. J. Harper, E. Kendrick, P. Anderson, K. S. Ryder, L. Gaines, and A. P. Abbott. 2020. The importance of design in lithium ion battery recycling – A critical review. Green. Chem. 22 (22):7585–603. doi:https://doi.org/10.1039/D0GC02745F.
- Thompson, D., C. Hyde, J. M. Hartley, A. P. Abbott, P. A. Anderson, and G. D. J. Harper. 2021. To shred or not to shred: A comparative techno-economic assessment of lithium ion battery hydrometallurgical recycling retaining value and improving circularity in LIB supply chains. Resour. Conserv. Recycl. 175:105741. doi:https://doi.org/10.1016/j.resconrec.2021.105741.
- Tong, X., I. Nikolic, B. Dijkhuizen, M. van den Hoven, M. Minderhoud, N. Wäckerlin, T. Wang, and D. Tao. 2018. Behaviour change in post-consumer recycling: Applying agent-based modelling in social experiment. J. Clean. Prod. 187:1006–13. doi:https://doi.org/10.1016/j.jclepro.2018.03.261.
- Tsanakas, J. A., G. Vannier, A. Plissonnier, D. L. Ha, and F. Barruel. 2015. Fault diagnosis and classification of large-scale photovoltaic plants through aerial orthophoto thermal mapping. 31st European Photovoltaic Solar Energy Conference and Exhibition, Hamburg, Germany.
- Tsanakas, J. A., L. Ha, and C. Buerhop. 2016. Faults and infrared thermographic diagnosis in operating c-Si photovoltaic modules: A review of research and future challenges. Renewable Sustainable Energy Rev. 62:695–709. doi:https://doi.org/10.1016/j.rser.2016.04.079.
- Tsanakas, J. A., A. V. D. Heide, T. Radavičius, J. Denafas, E. Lemaire, K. Wang, J. Poortmans, and E. Voroshazi. 2020. Towards a circular supply chain for PV modules: Review of today’s challenges in PV recycling, refurbishment and re-certification. Prog. Photovolt: Res. Appl. 28 (6):454–64. doi:https://doi.org/10.1002/pip.3193.
- UL Standards. 2018. ANSI/CAN/UL standard for evaluation for repurposing batteries. Northbrook, IL: Comm 2000.
- Ultra Low Carbon Solar Alliance. 2020. The ultra low-carbon solar era is here. Accessed March 1, 2022. https://ultralowcarbonsolar.org/ultra-low-carbon-solar/ .
- UMSICHT, F. 2017. “End-of-life pathways for photovoltaic backsheets.” Retrieved April 5, 2022, from https://www.umsicht.fraunhofer.de/en/projects/photovoltaic-waste.html.
- U.S. Department of Energy. 2022. Solar energy technologies office photovoltaics end-of-life action plan. Washington, DC: Department of Energy.
- Vanhuyse, F., E. Fejzić, D. Ddiba, and M. Henrysson. 2021. The lack of social impact considerations in transitioning towards urban circular economies: A scoping review. Sustain. Cities. Sustain. Cities. Socn 75: 103394.
- VDMA. 2019. International technology roadmap for photovoltaics, 10th ed. Frankfurt, Germany: VDMA.
- VDMA. 2020. International technology roadmap for photovoltaics, 11th ed. Frankfurt, Germany: VDMA.
- VDMA. 2021. International technology roadmap for photovoltaics., 12th ed. Frankfurt, Germany: VDMA.
- Velázquez, M., A. S. Valio, Reuter, and G. Serna. 2019. A critical review of lithium-ion battery recycling processes from a circular economy perspective. Batteries 5 (4): 68.
- Veolia. 2021a. “Recycling photovoltaic panels, a technology unique in France.” Retrieved April 5th, 2022, from https://www.veolia.com/en/solution/recycling-photovoltaic-panels-technology-unique-France.
- Veolia. 2021b. “Veolia opens the first European plant entirely dedicated to recycling photovoltaic panels.” Retrieved April 5th, 2022, from https://www.veolia.com/en/newsroom/news/recycling-photovoltaic-panels-circular-economy-france.
- Voronko, Y. E., G. C. Eder, C. Breitwieser, W. Mühleisen, L. Neumaier, S. Feldbacher, G. Oreski, and N. Lenck. 2021. Repair options for PV modules with cracked backsheets. Energy Sci. Eng 9 (9):1583–95. doi:https://doi.org/10.1002/ese3.936.
- Wade, A., P. Sinha, K. Drozdiak, D. Mulvaney, and J. Slomka. 2018. “Ecodesign ecolabeling and green procurement policies - enabling more sustainable photovoltaics?” In IEEE 7th World Conference on Photovoltaic Energy Conversion (WCPEC) (A Joint Conference of 45th IEEE PVSC, 28th PVSEC & 34th EU PVSEC), 2600–05. Waikoloa, HI.
- Wagner, N. P., A. Tron, J. R. Tolchard, G. Noia, and M. P. Bellmann. 2019. Silicon anodes for lithium-ion batteries produced from recovered kerf powders. J. Power. Sources. 414:486–94. doi:https://doi.org/10.1016/j.jpowsour.2019.01.035.
- Walker, H., E. Lockhart, J. Desai, K. Ardani, G. Klise, O. Lavrova, T. Tansy, J. Deot, B. Fox, and A. Pochiraju. 2020. “Model of operation and maintenance costs for photovoltaic systems (No NREL/TP-5C00-74840). Golden, CO: National Renewable Energy Lab.(NREL) .
- Walzberg, J., G. Lonca, R. J. Hanes, A. L. Eberle, A. Carpenter, and G. A. Heath. 2021. Do we need a new sustainability assessment method for the circular economy? A critical literature review. Frontiers in Sustainability 1: doi: https://doi.org/10.3389/frsus.2020.620047.
- Walzberg, J., A. Carpenter, and G. A. Heath. 2021. Role of the social factors in success of solar photovoltaic reuse and recycle programmes. Nat. Energy 6 (9):913–24. doi:https://doi.org/10.1038/s41560-021-00888-5.
- Walzberg, J., R. Burton, F. Zhao, K. Frost, S. Muller, A. Carpenter, and G. Heath. 2022. An investigation of hard-disk drive circularity accounting for socio-technical dynamics and data uncertainty. Resour. Conserv. Recycl. 178:106102. doi:https://doi.org/10.1016/j.resconrec.2021.106102.
- Wambach, K. 2012. PV module take back and recycling systems in Europe – new challenges under WEEE. In 27th European photovoltaic solar energy conference and exhibition, 4757–60. Frankfurt, Germany.
- Wang, Z., G. Feng, D. Zhen, F. Gu, and A. Ball. 2021. A review on online state of charge and state of health estimation for lithium-ion batteries in electric vehicles. Energy Reports 7:5141–61. doi:https://doi.org/10.1016/j.egyr.2021.08.113.
- Wang, X., G. Gaustad, and C. W. Babbitt. 2016. Targeting high value metals in lithium-ion battery recycling via shredding and size-based separation. Waste Manag 51:204–13. doi:https://doi.org/10.1016/j.wasman.2015.10.026.
- Wang, X., G. Gaustad, C. W. Babbitt, and K. Richa. 2014. Economies of scale for future lithium-ion battery recycling infrastructure. Resour. Conserv. Recycl. 83:53–62. doi:https://doi.org/10.1016/j.resconrec.2013.11.009.
- Wang, T., J. Hsiao, and C. Du 2012. Recycling of materials from silicon base solar cell module. In 38th IEEE photovoltaic specialist conference, 2355–58. Austin, TX.
- Wang, T. Y., Y. C. Lin, C. Y. Tai, R. Sivakumar, D. K. Rai, and C. W. Lan. 2008. A novel approach for recycling of kerf loss silicon from cutting slurry waste for solar cell applications. J. Cryst. Growth 310 (15):3403–06. doi:https://doi.org/10.1016/j.jcrysgro.2008.04.031.
- Wang, L., X. Wang, and W. Yang. 2020. Optimal design of electric vehicle battery recycling network – From the perspective of electric vehicle manufacturers. Appl. Energy 275: 115328.
- Washington State Legislature. 2017. “Wash. rev. code § 70A.510.010 - photovoltaic module stewardship and takeback program.” Retrieved April 5, 2022, from https://app.leg.wa.gov/RCW/default.aspx?cite=70A.510.
- We Recycle Solar. 2022. “Solar panel recycling specialists.” Retrieved April 5, 2022, from https://werecyclesolar.com/recycle/.
- WEF. 2014. Towards the circular economy: accelerating the scale-up across global supply chains. Geneva, Switzerland: World Economic Forum.
- WEF. 2018. The lithium-ion battery end-of-life market – A baseline study, 1–11. Cologny, Switzerland: World Economic Forum.
- Wegener, K., S. Andrew, A. Raatz, K. Dröder, and C. Herrmann. 2014. Disassembly of electric vehicle batteries using the example of the audi Q5 hybrid system. Procedia CIRP 23:155–60. doi:https://doi.org/10.1016/j.procir.2014.10.098.
- Wegener, K., W. H. Chen, F. Dietrich, K. Dröder, and S. Kara. 2015. Robot assisted disassembly for the recycling of electric vehicle batteries. Procedia CIRP 29:716–21. doi:https://doi.org/10.1016/j.procir.2015.02.051.
- Wei, J., G. Dong, and Z. Chen. 2018. Remaining useful life prediction and state of health diagnosis for lithium-ion batteries using particle filter and support vector regression. IEEE Trans. Ind. Electron. 65 (7):5634–43. doi:https://doi.org/10.1109/TIE.2017.2782224.
- Wender, B. A., R. W. Foley, V. Prado-Lopez, D. Ravikumar, D. A. Eisenberg, T. A. Hottle, J. Sadowski, W. P. Flanagan, A. Fisher, L. Laurin, et al. 2014. Illustrating anticipatory life cycle assessment for emerging photovoltaic technologies. Environ. Sci. Technol. 48 (18):10531–38. doi:https://doi.org/10.1021/es5016923.
- Wender, B. A., V. Prado, P. Fantke, D. Ravikumar, and T. P. Seager. 2017. Sensitivity-based research prioritization through stochastic characterization modeling. Int. J. Life Cycle Assess. 23 (2):324–32. doi:https://doi.org/10.1007/s11367-017-1322-y.
- White, C., B. Thompson, and L. G. Swan. 2020. Repurposed electric vehicle battery performance in second-life electricity grid frequency regulation service. J. Energy Storage 28:101278. doi:https://doi.org/10.1016/j.est.2020.101278.
- Wills, B. A., and T. Napier-Munn. 2006. Mineral processing technology: An introduction to the practical aspects of ore treatment and mineral recovery. Amsterdam, Netherlands: Elsevier Science & Technology Books.
- Wong, J. H. R., M. Royapoor, and C. W. Chan. 2016. Review of life cycle analyses and embodied energy requirements of single-crystalline and multi-crystalline silicon photovoltaic systems. Renewable Sustainable Energy Rev. 58:608–18. doi:https://doi.org/10.1016/j.rser.2015.12.241.
- Wood Mackenzie. 2021. Battery raw materials service 2021 update to 2040 demand H1 2021. Edinburgh, Scotland: Wood Mackenzie.
- Woody, M., M. Arbabzadeh, G. M. Lewis, G. A. Keoleian, and A. Stefanopoulou. 2020. Strategies to limit degradation and maximize Li-ion battery service lifetime - Critical review and guidance for stakeholders. J. Energy Storage 28:101231. doi:https://doi.org/10.1016/j.est.2020.101231.
- Wrålsen, B., V. Prieto-Sandoval, A. Mejia-Villa, R. O’Born, M. Hellström, and B. Faessler. 2021. Circular business models for lithium-ion batteries - Stakeholders, barriers, and drivers. J. Clean. Prod. 317:128393. doi:https://doi.org/10.1016/j.jclepro.2021.128393.
- WSKG. 2021. “SungEel won’t pursue battery recycling facility in endicott.” Retrieved April 5, 2022, from https://wskg.org/news/sungeel-wont-pursue-battery-recycling-facility-in-endicott/.
- Wu, B., S. Han, K. G. Shin, and W. Lu. 2018. Application of artificial neural networks in design of lithium-ion batteries. J. Power. Sources. 395:128–36. doi:https://doi.org/10.1016/j.jpowsour.2018.05.040.
- Xu, P., Q. Dai, H. Gao, H. Liu, M. Zhang, M. Li, Y. Chen, K. An, Y. S. Meng, P. Liu, et al. 2020. Efficient direct recycling of lithium-ion battery cathodes by targeted healing. Joule 4 (12):2609–26. doi:https://doi.org/10.1016/j.joule.2020.10.008.
- Xu, P., Z. Yang, X. Yu, J. Holoubek, H. Gao, M. Li, G. Cai, I. Bloom, H. Liu, Y. Chen, et al. 2021. Design and optimization of the direct recycling of spent li-ion battery cathode materials. ACS Sustain. Chem. Eng. 9 (12):4543–53. doi:https://doi.org/10.1021/acssuschemeng.0c09017.
- Yang, H. L., I. T. Liu, C. E. Liu, H. P. Hsu, and C. W. Lan. 2019. Recycling and reuse of kerf-loss silicon from diamond wire sawing for photovoltaic industry. Waste Manag 84:204–10. doi:https://doi.org/10.1016/j.wasman.2018.11.045.
- Yang, Y., E. G. Okonkwo, G. Huang, S. Xu, W. Sun, and Y. He. 2021. On the sustainability of lithium ion battery industry – A review and perspective. Energy Storage Mater. 36:186–212. doi:https://doi.org/10.1016/j.ensm.2020.12.019.
- Yu, D., Z. Huang, B. Makuza, X. Guo, and Q. Tian. 2021. Pretreatment options for the recycling of spent lithium-ion batteries: A comprehensive review. Minerals Engineering 173:107218. doi:https://doi.org/10.1016/j.mineng.2021.107218.
- Zhang, X., and R. Rao. 2016. A benefit analysis of electric vehicle battery swapping and leasing modes in China. Emerg. Mark. Finance Trade. 52 (6):1414–26. doi:https://doi.org/10.1080/1540496X.2016.1152798.
- Zhang, Y., X. He, Z. Chen, Q. Bai, A. M. Nolan, C. A. Roberts, D. Banerjee, T. Matsunaga, Y. Mo, and C. Ling. 2019. Unsupervised discovery of solid-state lithium ion conductors. Nat. Commun. 10 (1):5260. doi:https://doi.org/10.1038/s41467-019-13214-1.
- Zhang, Y., M. Kim, L. Wang, P. Verlinden, and B. Hallam. 2021. Design considerations for multi-terawatt scale manufacturing of existing and future photovoltaic technologies: Challenges and opportunities related to silver, indium and bismuth consumption. Energy Environ Sci 14 (11):5587–610. doi:https://doi.org/10.1039/D1EE01814K.
- Zhao, L., X. Liu, C. Wan, X. Ye, and F. Wu. 2018. Soluble graphene nanosheets from recycled graphite of spent lithium ion batteries. J Mater Eng Perform 27 (2):875–80. doi:https://doi.org/10.1007/s11665-018-3156-6.
- Zhao, T., Y. Meng, H. Yin, K. Guo, R. Ji, G. Zhang, and Y. Zhang. 2020. Beneficial effect of green water-soluble binders on SiOx/graphite anode for lithium-ion batteries. Chem Phys Lett 742:137145. doi:https://doi.org/10.1016/j.cplett.2020.137145.
- Zheng, R., W. Wang, Y. Dai, Q. Ma, Y. Liu, D. Mu, R. Li, J. Ren, and C. Dai. 2017. A closed-loop process for recycling LiNi x Co y Mn (1−x−y) O 2 from mixed cathode materials of lithium-ion batteries. Green Energy Environ. 2 (1):42–50. doi:https://doi.org/10.1016/j.gee.2016.11.010.
- Zheng, M., H. Salim, T. Liu, R. A. Stewart, J. Lu, and S. Zhang. 2021. Intelligence-assisted predesign for the sustainable recycling of lithium-ion batteries and beyond. Energy Environ Sci 14 (11):5801–15. doi:https://doi.org/10.1039/D1EE01812D.
- Zhou, Z., A. Ran, S. Chen, X. Zhang, G. Wei, B. Li, F. Kang, X. Zhou, and H. Sun. 2020. A fast screening framework for second-life batteries based on an improved bisecting K-means algorithm combined with fast pulse test. J. Energy Storage 31:101739. doi:https://doi.org/10.1016/j.est.2020.101739.
- Zhu, X., F. Meng, Q. Zhang, L. Xue, H. Zhu, S. Lan, Q. Liu, J. Zhao, Y. Zhuang, Q. Guo, et al. 2020. LiMnO2 cathode stabilized by interfacial orbital ordering for sustainable lithium-ion batteries. Nat. Sustainability 4 (5):392–401. doi:https://doi.org/10.1038/s41893-020-00660-9.
- Zhu, J., I. Mathews, D. Ren, W. Li, D. Cogswell, B. Xing, T. Sedlatschek, S. N. R. Kantareddy, M. Yi, T. Gao, et al. 2021. End-of-life or second-life options for retired electric vehicle batteries. Cell Rep. Phys. Sci. 2 (8):100537. doi:https://doi.org/10.1016/j.xcrp.2021.100537.
- Zoco, E. 2018. “Revamping and repowering: The size of the opportunity.” Retrieved April 5, 2022, from https://www.pv-magazine.com/2018/12/17/revamping-and-repowering-the-size-of-the-opportunity/.