
 ?Mathematical formulae have been encoded as MathML and are displayed in this HTML version using MathJax in order to improve their display. Uncheck the box to turn MathJax off. This feature requires Javascript. Click on a formula to zoom.
ABSTRACT
Human activities have increased atmospheric emissions and deposition of oxidized and reduced forms of nitrogen, but emission control programs have largely focused on oxidized nitrogen. As a result, in many regions of the world emissions of oxidized nitrogen are decreasing while emissions of reduced nitrogen are increasing. Emissions of reduced nitrogen largely originate from livestock waste and fertilizer application, with contributions from transportation sources in urban areas. Observations suggest a discrepancy between trends in emissions and deposition of reduced nitrogen in the U.S., likely due to an underestimate in emissions. In the atmosphere, ammonia reacts with oxides of sulfur and nitrogen to form fine particulate matter that impairs health and visibility and affects climate forcings. Recent reductions in emissions of sulfur and nitrogen oxides have limited partitioning with ammonia, decreasing long-range transport. Continuing research is needed to improve understanding of how shifting emissions alter formation of secondary particulates and patterns of transport and deposition of reactive nitrogen. Satellite remote sensing has potential for monitoring atmospheric concentrations and emissions of ammonia, but there remains a need to maintain and strengthen ground-based measurements and continue development of chemical transport models. Elevated nitrogen deposition has decreased plant and soil microbial biodiversity and altered the biogeochemical function of terrestrial, freshwater, and coastal ecosystems. Further study is needed on differential effects of oxidized versus reduced nitrogen and pathways and timescales of ecosystem recovery from elevated nitrogen deposition. Decreases in deposition of reduced nitrogen could alleviate exceedances of critical loads for terrestrial and freshwater indicators in many U.S. areas. The U.S. Environmental Protection Agency should consider using critical loads as a basis for setting standards to protect public welfare and ecosystems. The U.S. and other countries might look to European experience for approaches to control emissions of reduced nitrogen from agricultural and transportation sectors.
Implications: In this Critical Review we synthesize research on effects, air emissions, environmental transformations, and management of reduced forms of nitrogen. Emissions of reduced nitrogen affect human health, the structure and function of ecosystems, and climatic forcings. While emissions of oxidized forms of nitrogen are regulated in the U.S., controls on reduced forms are largely absent. Decreases in emissions of sulfur and nitrogen oxides coupled with increases in ammonia are shifting the gas-particle partitioning of ammonia and decreasing long-range atmospheric transport of reduced nitrogen. Effort is needed to understand, monitor, and manage emissions of reduced nitrogen in a changing environment.
Introduction
Nitrogen (N) is an essential macronutrient in organisms and biotic processes as a critical component in biomolecules such as amino acids, proteins, and deoxyribose nucleic acid. As a growth limiting nutrient, N availability controls primary production in many terrestrial and marine ecosystems (LeBauer and Treseder Citation2008; Vitousek and Howarth Citation1991), a condition that facilitates diversity among N acquisition strategies and plant and microbial communities (Bobbink et al. Citation2010; Carter et al. Citation2017). In the Earth system N largely occurs in forms unavailable (unreactive) to biota, including as molecular N (N2) in the atmosphere and in rock and sediments (Galloway et al. Citation2003; Houlton et al. Citation2019). Nevertheless, a variety of natural processes can convert unreactive N to reactive forms, including biological N fixation (by legumes, free living bacteria, cyanolichens), lightning, rock weathering, and biomass burning. Reactive N (Nr) includes reduced forms (ammonia (NH3) and ammonium (NH4+) (NHx= NH3+ NH4+)) and various oxidized species of N. Over the past century human activities have altered land use which has decreased natural N fixation globally by about 15% (Galloway et al. Citation2004). Coincidently, humans have accelerated the conversion of N from unreactive N to Nr by reduction of atmospheric N2 to NH3 using the Haber-Bosch process, the widespread distribution of leguminous crops, and emissions of N oxides from fossil fuel combustion (NOx= nitric oxide (NO)+ nitrogen dioxide (NO2)) (Galloway et al. Citation2003; Smil Citation2001). During the last century human-generated N fixation has increased by about a factor of 10 such that anthropogenic-sources exceed the natural rate of Nr production by about a factor of 2.6 (Schlesinger and Bernhardt Citation2020). While this anthropogenic supply of Nr has allowed for increased production of food and energy to support human populations and activities, it has also resulted in profound human health and environmental consequences (Galloway et al. Citation2008; U.S. EPA-SAB Citation2011).
Once produced, Nr can participate in a sequence of processes, cycling among forms before conversion back to unreactive N. This sequence is referred to as the “N Cascade” (Galloway Citation1998; Galloway et al. Citation2004) and includes a suite of adverse air quality, climatic and ecosystem effects. Among these are a deterioration of air quality associated with NOx emissions, which contribute to fine particulate matter (PM2.5) and ozone, and NH3 emissions, which contribute to PM2.5. Nitrogen dioxide, ozone, and PM2.5 are criteria air pollutants in the U.S., while NHx is not. In the atmosphere and at the Earth surface other forms of oxidized N can be produced; the sum of oxidized N is termed NOy. NOy consists of all oxides of N with an oxidation state of the N atom of +2 or greater, including NOx (NO + NO2) plus other N oxides, such as nitric acid (HNO3), and nitrous acid (HONO), organic nitrates [peroxyl acetyl nitrate (PAN), methyl peroxyl acetyl nitrate (MPAN), and peroxyl propionyl nitrate, (PPN)], and particulate NO3−.
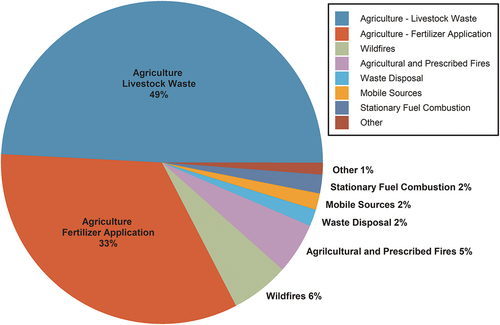
Reduced N species in the atmosphere include NH3, NH4+, and organic N compounds such as amines and organic nitriles (Aneja, Schlesinger, and Erisman Citation2009; Ge, Wexler, and Clegg Citation2011; Seinfeld and Pandis Citation2016). Reduced N emissions are dominated by NH3, with synthetic fertilizer application and livestock wastes as predominant anthropogenic NH3 sources in the U.S. and across the globe (; Aneja, Schlesinger, and Erisman Citation2009; McDuffie et al. Citation2020). Ammonia is also emitted from gasoline and diesel-fueled motor vehicles, stationary fuel combustion sources, synthetic fertilizer plants, and biomass burning (Behera et al. Citation2013). Natural sources of NH3 emissions include volatilization from soils, vegetation and the sea surface and account for 10–20% of U.S. emissions (Behera et al. Citation2013; Bouwman et al. Citation1997; Paulot et al. Citation2014).
Figure 1. Anthropogenic sources of ammonia in the U.S. in 2020 from the U.S. EPA. Anthropogenic emissions total 4.97 million tonnes (Citation2023a; https://www.epa.gov/air-emissions-inventories/2020-nei-supporting-data-and-summaries, accessed June 5, 2023).
In the U.S., emissions of NOx have been controlled through federal legislative and administrative actions (Coughlin et al. Citation2023; LaCount et al. Citation2021) Concerns about perturbation of the N cycle and environmental consequences of NH3 emissions have long been recognized (Aneja, Schlesinger, and Erisman Citation2009; Delwiche Citation1970), but emissions of NH3 have been increasing in the U.S. and globally (Lamarque et al. Citation2013; U.S. EPA Citation2023b; ) and are projected to continue to increase in the coming decades. In the U.S., NHx now exceeds NOy as the major component of total N deposition (). This ongoing pattern is in part because NH3 emissions are largely unregulated in the U.S. and elsewhere, with European countries being a notable exception (see Section 4 Ammonia Management).
Figure 2. Time series of annual total anthropogenic emissions of reduced nitrogen (NH3) (a) and oxidized nitrogen (NOx) (b) for the U.S. (from U.S. EPA Citation2023b).
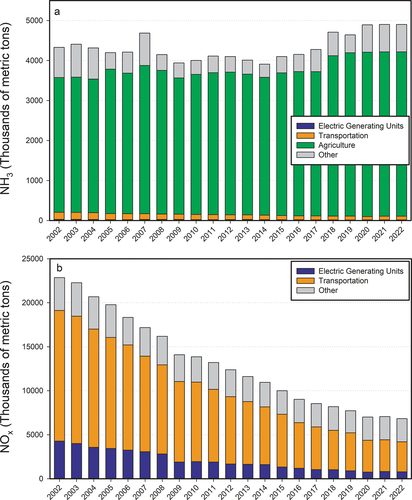
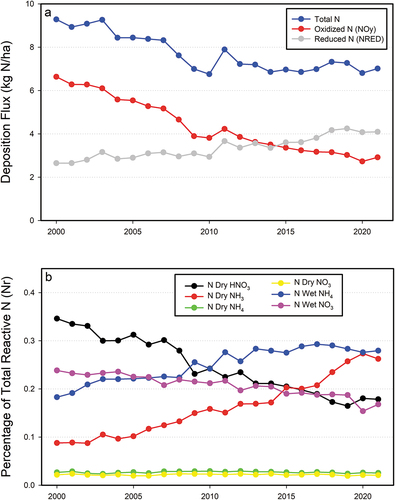
Figure 3. Time series of area weighted mean annual total nitrogen and oxidized (NOy) and reduced nitrogen (NHx) deposition (a) and the fractional contributions of components of wet and dry N deposition to total N deposition (b) for the conterminous U.S. Data are from the National Atmospheric Deposition Program Total Deposition (TDep) committee.
International and U.S. federal land managers use the concept of critical loads (CLs) to assess and manage effects of atmospheric deposition on ecosystems (Porter et al. Citation2005). A CL is a level of atmospheric deposition below which adverse effects to ecosystems are not expected to occur given current understanding (Blett et al. Citation2014; Nilsson and Grennfelt Citation1988). Critical loads for total N deposition have been determined and are being utilized to identify areas where decreases in atmospheric deposition or other management actions are needed to maintain healthy ecosystems (Section 2.4.3; Pardo et al. Citation2011). While most studies and determinations of CLs of N assume effects of oxidized and reduced N deposition are equivalent, a few studies have examined their differential effects (e.g., Stevens et al. Citation2011).
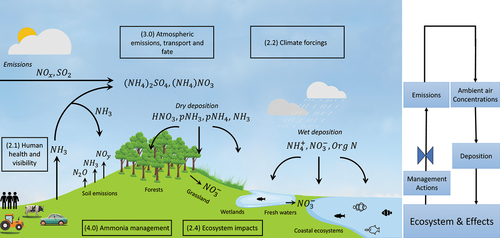
The scope and organization of this review is illustrated in , which focuses on the U.S. with comparative insights from Europe and China. We examine current science on effects of NHx, including human health and visibility (Section 2.1), climate forcings (Section 2.2), and ecosystems and associated CLs (Section 2.3 and 2.4). Recent developments in estimating emissions and modeling the contribution of NH3 to PM2.5 and N deposition, including incorporation of satellite observations, are covered in Section 3.0. The history and status of NH3 emissions management efforts in the U.S. and Europe are described in Section 4.0. The critical review concludes with recommendations for how EPA, other federal agencies, states, and tribes in the U.S. could enhance` efforts to address NH3 emissions and effects, and research needs to help in the design, implementation and tracking of new emissions mitigation efforts (Section 5.0).
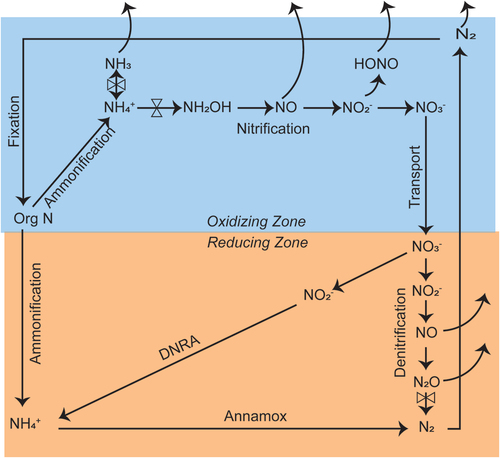
Figure 4. Conceptual diagram of the nitrogen cycle, with a focus on transformations, fate, and effects of ammonia (NH3) and ammonium (NH4+). The conceptual model depicts the Sections of the manuscript: human health and visibility (2.1), climate forcings (2.2), ecosystem impacts (2.4); atmospheric emissions, transport, and fate (3.0); and ammonia management (4.0).
Why should we care about ammonia emissions?
Human health and visibility impacts
Ammonia is a colorless gas with a pungent odor that people can detect at concentrations above 5 ppm (NRC Citation2008). It is highly alkaline and corrosive and can cause severe tissue damage at very high acute exposure levels. Deaths have been reported after NH3 release accidents that led to very high acute exposures. More commonly, eye and/or respiratory tract irritation have been reported in epidemiological studies of occupationally exposed workers, including poultry barn workers, and confirmed in controlled exposure studies (Naseem and King Citation2018; National Research Council NRC Citation2008; Wyer et al. Citation2022). The National Research Council has established Acute Exposure Guidelines (AEGL) for NH3, with the AEGL-1 level corresponding to non-disabling mild irritation set at 30 ppm for 10 min to 8 h exposures; the AEGL-2 level corresponding to disabling irritation ranging from 220 ppm for 10 min to 110 ppm for 8 h; and the AEGL-3 level for lethality ranging from 2700 ppm for 10 min to 390 ppm for 8 h (NRC Citation2008). The American Conference of Governmental and Industrial Hygienists (ACGIH) threshold limit values for workplace exposure are 35 ppm for 15 min and 25 ppm for 8 h (ACGIH Citation2001a, Citation2001b). The Agency for Toxic Substances and Disease Registry’s minimal risk levels (MRLs) for public exposures are 1.7 ppm for acute-duration exposure (14 days or less) and 0.1 ppm for chronic exposure (365 days or more) (ATSDR Citation2004). For comparison, average NH3 concentrations in ambient air at different monitoring locations typically range from 0.2–10 ppb (Li Citation2015). However, average concentrations in the range of 100–1000 ppb have been observed in poultry houses and at the fence line of large cattle feedlots (Almuhanna, Ahmed, and Al-Yousif Citation2011; Naseem and King Citation2018; Shonkwiler and Ham Citation2018).
Malodor associated with NH3 and other emissions from confined animal feeding operations (CAFOs) is concomitant with psychological and physiological effects on human health and well-being that can disrupt daily activities (Wing et al. Citation2008). A high density of CAFOs in areas with high proportions of people of color and/or low incomes is a long-standing environmental justice concern, with hog CAFOs in North Carolina representing an especially well-studied example (e.g., Lewis Brandon et al. Citation2023; Nicole Citation2013; Wing and Johnston Citation2014).
Much more widespread than direct exposure to elevated levels of NH3 gas are effects of NHx on human health through the formation of PM2.5. PM2.5 can occur as primary particulate matter, emitted directly from a source, or as secondary particulate matter formed in the atmosphere from gas-phase precursors, including SO2, NOx, NH3 and volatile organic compounds (VOCs). Secondary PM is the largest fraction of PM2.5 in most locations (McDuffie et al. Citation2020; U.S. EPA Citation2019b).
Fine particulate matter has significant and well-established human health consequences (Pope Iii and Dockery Citation2006; U.S. EPA Citation2019b). EPA has determined that exposure to PM2.5 has a causal or likely causal relationship to respiratory, cardiovascular, nervous system, cancer, and mortality effects (U.S. EPA Citation2022b). Accordingly, in February 2024 EPA lowered the primary National Ambient Air Quality Standard for PM2.5 from an annual average of 12.0 μg m−3 to 9.0 μg m−3, retaining the 24-hour average standard of 35 μg m−3 (U.S. EPA Citation2024). The World Health Organization has set air quality guidelines of 5 and 15 μg m−3 for annual and 24-hour averages, respectively (World Health Organization Citation2021). The European Parliament has proposed these same levels as limit values to be met by 2035 (European Parliament Citation2023a, Citation2023b). The form of these standards assumes all PM2.5 is equally toxic by mass, regardless of composition. People who are most vulnerable and at-risk from the effects of PM2.5 exposure include children, people suffering from other respiratory or cardiovascular diseases, and highly exposed individuals living in areas with poor ambient air quality.
The Global Burden of Disease project has estimated that long-term (chronic) exposure to ambient PM2.5 and ozone air pollution accounted for 4.5 million premature deaths a year in 2019, with PM2.5 contributing the largest share (Murray et al. Citation2020). In an updated analysis with high-resolution satellite data used to estimate PM2.5 levels, Li et al. (Citation2023) estimated that exposure to PM2.5 accounted for 5.7 million premature deaths globally in 2019. Premature deaths attributed to PM2.5 have declined in the U.S. and Europe over the past two decades and have started to decline in China. For the global population overall, deaths attributable to PM2.5 increased from 1999 to 2011 and have stabilized since then. Additional studies have used chemistry and transport models to estimate the contribution of specific sources to PM2.5 health effects. McDuffie et al. (Citation2020) estimated that non-combustion emissions from agriculture (including NH3 emissions) account for about 400,000 premature deaths per year globally from ambient PM2.5 exposure. Nawaz et al. (Citation2023) estimated that emissions from the agricultural sector contribute about 630,000 premature deaths per year from PM2.5 exposure in G20 countries. Agriculture was the largest contributing sector in several countries, including Brazil and China. Kelly et al. (Citation2023) estimated agriculture accounts for 25–39% of urban PM2.5 in the United Kingdom.
Despite improvements in U.S. air quality over the past few decades, PM2.5 levels continue to pose considerable health risks. Goodkind et al. (Citation2019) estimated that chronic exposure to ambient anthropogenic PM2.5 was responsible for 107,000 premature deaths in the U.S. in 2011, 15% of which were attributable to NH3 emissions. Thakrar et al. (Citation2020) estimated that human-caused emissions accounted for about 100,000 deaths in the U.S. in 2015 (modeled range 88,000–107,000) from chronic PM2.5 exposure. About 19,000 of these premature deaths were attributed to the food and agriculture sector, including 8400 from livestock production and 3700 from fertilizer application. A total of 17,400 premature deaths were attributed to NH3 emissions from agriculture, motor vehicles, and industrial sources. Nawaz et al. (Citation2023) similarly estimated that U.S. anthropogenic NH3 emissions from agriculture lead to 16,000 premature deaths a year from chronic PM2.5 exposure. Dedoussi et al. (Citation2020) attributed 18,000 PM2.5-linked deaths in the contiguous U.S. in 2018 to NH3 emissions from non-agricultural combustion sources. As discussed below, the magnitude of NH3 emissions from combustion sources such as motor vehicles is likely underestimated (e.g., Fenn et al. Citation2018).
Impairment of visual air quality is another significant impact of particulate matter (Malm Citation2016; U.S. EPA Citation2019a). Ammonium sulfate and ammonium nitrate are major contributors to visibility impairing PM2.5 in most regions of the U.S. The Regional Haze Rule (RHR) was promulgated in 1999 with the goal of returning visibility in protected “Class I” national parks and wilderness areas to natural levels by 2064 (US EPA Citation2019a; Watson Citation2002). Progress is tracked in the U.S. through the Interagency Monitoring of Protected Visual Environments (IMPROVE) network, which collects and analyzes 24-h filter samples of PM2.5 and PM10 at approximately 160 sites across the U.S (Hand et al. Citation2020; Solomon et al. Citation2014). Estimated light extinction coefficients (bext, Mm−1) are reconstructed from the speciated PM measurements. For IMPROVE sites across the country, the average light extinction on the 20% of monitored days in 2021 that were most impaired by anthropogenic pollution is shown in . For those days, ammonium sulfate and ammonium nitrate contributed half or more of the light extinction at most locations. Note that while extinction coefficients are comparatively small in the Intermountain West and Southwest, scenic vistas in these regions can extend over very long distances, making visual air quality especially sensitive to light extinction.
Figure 5. Light extinction composition at Class I areas for the upper 20th percentile of most impaired days. The size of each pie chart represents the light extinction coefficient in Mm−1 scaled to the largest value, which is 62 Mm−1 at Mammoth Cave, KY (Source: TSS Light Extinction Composition Pie Map – Product #XATP_ECPM_PCBP, WRAP Technical Support System (TSS); CSU and the Cooperative Institute for Research in the Atmosphere (CIRA), available at https://views.cira.colostate.edu/tssv2/Express/AmbientDataAnalysisTools.aspx, accessed 14 Aug 2023).
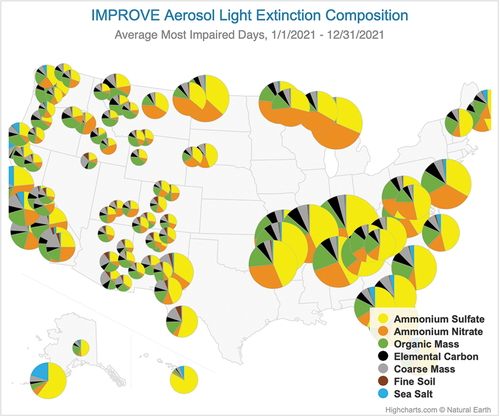
Hand et al. (Citation2020) analyzed trends in IMPROVE data up to 2018 and reported significant decreases in annual mean bext at most locations, corresponding to decreases in emissions of SO2 and NOx. Considering all sites in the conterminous U.S., they estimated annual mean bext had declined by 2.8% per year from 2002 to 2018. Over this period, the locations of largest light extinction coefficients have shifted from the eastern to the central U.S. where ammonium nitrate contributions are comparatively high.
Climate forcing
Climate impacts are linked to global N transformations. Some of these effects are manifested through increases in net carbon dioxide retention associated with increases in plant biomass (Clark et al. Citation2023; Horn et al. Citation2018) and decreases in the decomposition of detrital soil C (Janssens et al. Citation2010) driven by increases in N deposition (see Section 2.4.2). Nitrogen deposition may also alter the carbon cycle by decreasing biogenic CO2 emissions (Pinder et al. Citation2012, Citation2013). One of the main direct impacts of NH3 on climate is through negative radiative forcing associated with the formation of light-scattering particulate matter. The change in radiation at the top of the atmosphere from preindustrial to present (i.e., direct radiative forcing) from changes in ammonium nitrate and ammonium sulfate aerosols has been estimated to range from −0.10 ± 0.04 W m−2 (Myhre et al. Citation2013), −0.19 ± 0.18 W m−2 (Shindell et al. Citation2013), and −0.07 ± 0.01 W m−2 (Thornhill et al. Citation2021). The presence of NH3 can also impact the physical state of secondary inorganic aerosols (e.g., aqueous vs crystalline), which can modulate aerosol direct radiative forcing (Martin et al. Citation2004; Wang, Jacob, and Martin Citation2008) as well as indirect forcing through clouds (e.g., Abbatt et al. Citation2006; Sorooshian et al. Citation2008). Preindustrial to present aerosol radiative forcing estimates considering the impact on cloud droplet effective radius (the “first aerosol indirect effect”) of NO3− aerosol (which is governed by availability of excess NH3) range from − 0.05 W m−2 (Bellouin et al. Citation2011) to − 0.09 W m−2 (Xu and Penner Citation2012). Lu et al. (Citation2021) estimate an indirect effect of −0.219 W m−2 when also considering enhanced cloud liquid water. Conversely, ammonia has been shown to promote the formation of absorbing organic aerosol compounds that exert a positive radiative forcing (e.g., Bones et al. Citation2010; Updyke, Nguyen, and Nizkorodov Citation2012). Deposition of Nr (including NH3) contributes to nitrous oxide (N2O) emissions from soil (Luo et al. Citation2022), an important greenhouse gas whose concentrations in the atmosphere are increasing and is the dominant contributor to depletion of stratospheric ozone (UNEP Citation2013). In the U.S., agricultural soil management practices including NHx-based fertilizer application are the largest sources of anthropogenic N2O emissions (Luo et al. Citation2022).
Agricultural impacts
Fossil fuels are used to generate the molecular hydrogen necessary to produce synthetic NH3 in the Haber-Bosch process. As a result, the production of N fertilizers is a highly energy-intensive process responsible for about two percent of global energy consumption and emissions of 310 megatons of carbon dioxide pollution annually (Rosa and Gabrielli Citation2023). Moreover, there are benefits and disbenefits of elevated atmospheric N deposition associated with human activities. Benefits include supplementing fertilization of crops for food production (Galloway et al. Citation2003), increased productivity of trees and herbaceous vegetation, and the potential for enhanced sequestration of C in soils and plant biomass (Clark et al. Citation2023; Janssens et al. Citation2010). Atmospheric N deposition is generally considered a net benefit to croplands, although N saturation of agricultural soils from excess fertilizer application is widespread (Luo et al. Citation2022). About 75% of the Nr that is produced globally is applied to agroecosystems to support food production, most of this in the form of synthetic fertilizer application and biological N fixation associated with leguminous crops (Byrnes, Van Meter, and Basu Citation2020; Galloway et al. Citation2003). In contrast, disbenefits likely outweigh benefits associated with atmospheric N in large areas of extensively managed lands (forests, grasslands), and freshwaters and coastal waters (see Section 2.4). In the U.S., forests represent about 24% of the land cover, while grasslands encompass about 35% of the land cover (Karra et al. Citation2021; Figure S1). Moreover, vast expanses of coastal waters have been impacted by elevated N inputs (Bricker et al. Citation2008; Galloway et al. Citation2003).
Changes in N deposition and ecosystem impacts
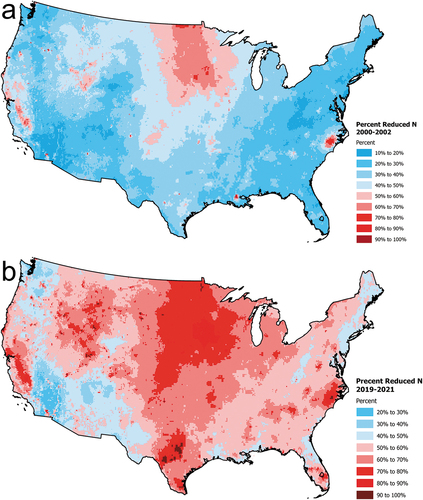
Atmospheric N deposition in the U.S. has changed markedly over the past 20 + years (2000–2021, Figure S2). Anthropogenic NOx emissions have decreased ~ 70% while estimates of NH3 emissions have increased ~ 16% (; U.S. EPA Citation2023b). In response, overall total N deposition has decreased about 25% to a U.S. average value of 7.0 kg N ha−1 yr−1 (). Consistent with emissions, NOy deposition has decreased by about 55% since 2000 (). In contrast, NHx deposition has increased by about 52% such that NHx deposition now exceeds NOy as the major component of total N deposition (). This deposition trend diverges from that for estimated NH3 emissions, which have not increased as sharply (). Due to the location of shifting emission sources these changes have altered the spatial pattern and form of N deposition across the U.S. In recent years NHx deposition has increased in the Great Plains, the Midwest, North Carolina, the Mountain West, and the Central Valley of California (). There also have been substantial spatial shifts in the relative distribution of oxidized versus reduced N deposition (; Li et al. Citation2016). In the early 2000s NOy dominated total N deposition over much of the U.S., with scattered exceptions (). Today the pattern has shifted substantially, with most of the U.S. receiving NHx deposition that exceeds NOy deposition (, 6b,7b).
Figure 6. Maps of total oxidized nitrogen deposition (NOy)(a) and total reduced nitrogen (NHx) deposition (b) (as kg N ha−1 yr−1) for the conterminous U.S. for 2000–2002 and 2019–2021. Data are from the National Atmospheric Deposition Program Total Deposition (TDep) committee.
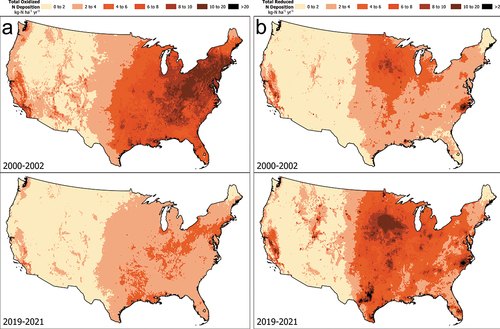
Figure 7. Maps comparing the percent of total nitrogen deposition occurring as total reduced nitrogen (NHx) for the conterminous U.S. for 2000–2002 (a) with 2019–2021 (b). Data are from the National Atmospheric Deposition Program Total Deposition (TDep) committee.
Ecosystem effects of NHx deposition are largely the result of the biogeochemical processing of N. In this section of the critical review, we describe the biogeochemical processing of N that leads to eutrophication and acidification effects of terrestrial (forest, grassland vegetation, microbial communities) and interconnected aquatic ecosystems (freshwater, coastal). We also discuss critical loads (CLs) of N and exceedances of CLs of N for the conterminous U.S. There is considerable variability across landscapes where benefits and disbenefits of atmospheric N deposition are realized. Potential disbenefits of N inputs in ecosystems are broad-based and comprehensive. They are complex, affecting the fundamental structure and function of terrestrial, freshwater, and marine ecosystems with strong linkages to a host of important ecosystem services. Measured ecosystem responses to N deposition harm species, ecosystem health, and biodiversity, but also cascade to greater function and outputs including harvestable timber, pollinator habitat, and resource dependent businesses (Clark et al. Citation2017; Rhodes et al. Citation2017). The sheer extent and magnitude of ecosystem effects of elevated human-generated N inputs is indicative of the breadth and importance of this environmental problem, for which the contribution of NHx is increasing.
Biogeochemical processing of nitrogen
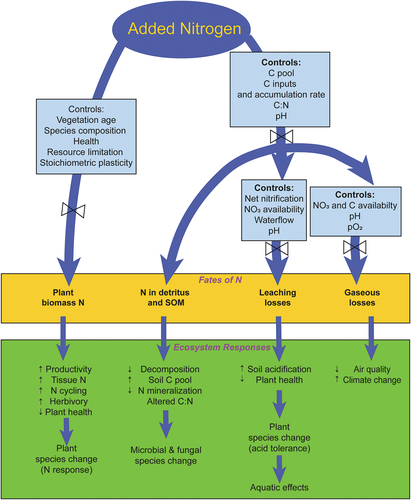
Following input of atmospheric N deposition there are four potential pathways for the fate of N within terrestrial ecosystems: two internal N sinks, plant biomass and soil organic matter (SOM), and two loss pathways, leaching and gaseous emissions (; Lovett and Goodale Citation2011). These pathways dictate not only the fate of N inputs to terrestrial ecosystems but also broadly contribute to the nature of its effects. Drainage losses of watershed N are linked to effects in freshwater (Section 2.4.2.2) and coastal (Section 2.4.2.3) ecosystems, while emissions of N trace gasses from soil are sources of air quality, visibility and climate effects discussed above (Sections 2.1, 2.2). The fate of N inputs varies greatly across terrestrial ecosystems and is regulated by a suite of controls for each pathway. However, a controlling driver of the fate of N inputs is uptake by plant biomass. Plants assimilate largely inorganic forms (NH4+, NO3−) mostly through roots but also through foliage for production and use of amino acids and nucleic acids (Stevens et al. Citation2011). Plant N uptake is influenced by a suite of factors including stand age, disturbance history, species composition, plant health, resource limitation (light, moisture, availability of nutrients) and variable nutrient stoichiometry. Plant response to increases in N inputs involves increases in productivity, tissue N, and ecosystem N cycling, but also enhanced herbivory and susceptibility to fire. Different plant species exhibit different responses to N inputs. Plants can respond positively to N inputs but can also exhibit no response or negative effects, particularly at high loadings (Simkin et al. Citation2016; Thomas et al. Citation2010). Long-term N inputs facilitate shifts in plant species abundance and decreases in biodiversity. Importantly, the degree of vegetation N uptake influences the extent of the other three pathways of N fate ().
Figure 8. Conceptual diagram showing the pathways of nitrogen fate and transport in terrestrial ecosystems (modified after Lovett and Goodale Citation2011).
Nitrogen also cycles through soil detritus and organic matter. Indeed, SOM is generally the largest N sink in terrestrial ecosystems. Under elevated available N inputs, plants shift their allocation of photosynthate toward wood growth and away from the rhizosphere due to decreases in the necessity for an elaborate N acquisition system belowground (Janssens et al. Citation2010). This shift decreases the supply of labile carbon (C) for microbial priming and changes the structure and function of the rhizosphere, particularly mycorrhizal symbionts (Treseder Citation2004). Elevated N deposition also facilitates shifts in the rhizosphere favoring arbuscular mycorrhizal fungi, which scavenge nutrients released to soil, at the expense of ectomycorrhizal species, which mineralize nutrients directly from soil organic matter (Averill, Dietze, and Bhatnagar Citation2018; Jo et al. Citation2019). Inputs of N drive fundamental changes in the decomposition of detrital organic matter, including shifts in enzyme synthesis toward greater decomposition of labile energy rich organic C compounds and away from decomposition recalcitrant materials. This change increases the chemical stabilization of detritus that is resistant to microbial decomposition and as a result sequestration of soil organic carbon.
The two N loss pathways become increasingly prominent as N inputs approach and exceed internal terrestrial N sinks (plant N uptake, accumulation of SOM) resulting in increased accumulation of inorganic N in soil and a condition of N saturation (Aber et al. Citation1998; Stoddard Citation2004). Nitrification, in which NHx is oxidized to nitrite (NO2−) and NO3−, is a keystone process in the N cycle mediated by NHx oxidizing bacteria and archaea as it controls the production and loss of mobile gaseous and aquatic N forms (). Note that NO3− is largely the mobile form of solution N due to the retention of NH4+ associated with soil cation exchange sites. Other forms of N in intermediate oxidation states can be produced through dissimilatory pathways of the N cycle (). Trace gasses of oxidized N can be lost to the atmosphere through “leaky pipe” processes in these redox sequences (Inatomi et al. Citation2019; Mushinski et al. Citation2019). Nitrite can be volatilized as nitrous acid (HONO) which together with NOx and other N oxide gasses comprise NOy.
Figure 9. Conceptual diagram showing the microbial dissimilatory processing of nitrogen in the environment. DNRA is dissimilatory reduction to ammonium. Annamox is ammonium reduction to molecular nitrogen. Shading indicates are processes occurring in oxidizing and reducing environments. Note: pH sensitive N processes are indicated by control valves.
The structure and function of ecosystems can change in response to elevated inputs of Nr. Moreover, the sensitivity of ecosystems to atmospheric N deposition is highly variable spatially due to variation in climatic and soil characteristics, such as inherent N availability, soil pH and buffering capacity, status of phosphorus, calcium, magnesium and potassium availability, the water cycle and plant occurrence (Carter et al. Citation2017). There are two broad mechanisms by which the structure and function of ecosystems change following inputs of Nr: eutrophication and acidification (Carter et al. Citation2017; Stevens et al. Citation2011). Eutrophication occurs due to increases in the supply of a growth limiting nutrient; for many ecosystems the limiting nutrient is N (Vitousek and Howarth Citation1991). The main driver of eutrophication effects involves changes in plant species due to competitive interactions or changes in plant-microbial interactions associated with increases in N availability. Other eutrophication effects include direct toxicity of N gasses or aerosols or NHx in soils, and increased susceptibility to secondary stressors, such as herbivory or fire (Bobbink et al. Citation2010). Eutrophication effects are widespread and can occur across diverse ecosystems. In contrast, acidification effects are more limited. They occur in energy limited environments (Jones et al. Citation2012; Figure S3) when acid deposition or acid producing processes (e.g., nitrification) exceed alkalinity generating processes (weathering of basic cations) within an ecosystem (see supporting information). Acidification is generally driven by a combination of sulfate and N inputs and is prominent in acid-sensitive base-poor ecosystems (Driscoll et al. Citation2001; Greaver et al. Citation2012). Note that NH4+ inputs followed by either assimilation or nitrification is an acidifying process, while processing or removal of NO3− deposition consumes protons (see Supporting Information, Mechanisms of acidification). Acidification effects are manifested through nutrient cation loss in soil and the mobilization of toxic forms of aluminum and manganese (Carter et al. Citation2017; Driscoll et al. Citation2001). In acid-impacted regions of North America, Europe and China, elevated atmospheric N deposition has been coincident with elevated sulfur deposition (Lamarque et al. Citation2013), so N and sulfur in combination are generally important drivers of acidification effects (see Section 2.4.2.2).
Several ecosystem N processes are highly sensitive to pH (Mushinski et al. Citation2019; Ontman et al. Citation2023, ; Stevens et al. Citation2011). The mass law governing the protonation of NH3 has a pKa of 9.2. As a result, neutral to high soil pH values favor formation and volatilization of NH3 (Luo et al. Citation2022). Nitrification is also sensitive to pH. In acidic soils (pH < 4.5) nitrification rates are frequently low and increase with increases in pH (Stevens et al. Citation2011). Ammonia oxidizing bacteria, which are important in trace N gas production, are sensitive to pH. Therefore, NOy production is favored at moderate soil pH (Mushinski et al. Citation2019). Finally, the last step in the denitrification redox sequence from N2O to N2 involving nitrous oxide reductase is also sensitive to pH (Henault et al. Citation2019). As a result, lower soil pH favors formation of N2O and loss to the atmosphere compared to neutral values. While these N processes are particularly sensitive to pH there is considerable variability in the pH range and environmental conditions over which these effects are realized (Ontman et al. Citation2023; Stevens et al. Citation2011).
Stevens et al. (Citation2011) provide a compelling framework to understand and evaluate the differential response of terrestrial ecosystems to effects of atmospheric deposition of oxidized versus reduced N. For most terrestrial ecosystems there is a decrease in the ratio of fluxes of reduced to oxidized N as atmospheric N deposition is processed through the canopy and soil solutions to drainage waters. The rate and form of inorganic N uptake by plants varies by the plant species and soil characteristics, particularly pH. The distribution of forms of available inorganic N in soil is driven in part by relative rates of nitrification, which generally increase with increases in soil pH. In the presence of available soil pools of both NO3− and NH4+, greater quantities of NH4+ are assimilated by plants due its lower energetic cost (Bloom, Sukrapanna, and Warner Citation1992). However, elevated NH4+ uptake can be toxic to plants (Bobbink Citation2010; Van Den Berg et al. Citation2005;). In low pH soils with low rates of nitrification, plants primarily rely on NH4+ as the dominant inorganic N source despite the potential for NH4+ toxicity (Stevens et al. Citation2011). Plant preference for NO3− increases with relative increases in NO3− availability associated with increases in pH. Finally, there are three pH-dependent conditions regulating plant species composition changes associated with N enrichment. At low pH, plant species composition is driven by preference for NH4+ as a N source and potential NH4+ toxicity. At moderate pH (4.5–6) acidification effects control species composition. Finally at neutral pH (pH > 6) competition associated with N availability and other environmental factors is thought to control species distribution. A key uncertainty in ecosystem effects of NHx deposition is the differential response to inputs of reduced versus oxidized N. Few investigations have addressed differences in effects of reduced and oxidized N deposition.
Nitrogen effects in ecosystems
Terrestrial effects include decreases in plant and microbial species diversity (Bobbink et al. Citation2010; Simkin et al. Citation2016), decreases in growth and survival of some tree species (Coughlin et al. Citation2023; Thomas et al. Citation2010); loss and shifts in mycorrhizal associations (Averill, Dietze, and Bhatnagar Citation2018; Jo et al. Citation2019); alterations in terrestrial ecosystem function, such as enhanced mineralization of N, nitrification, and NO3− leaching (Aber et al. Citation1998; Gilliam et al. Citation2019, Citation2023; Lovett and Goodale Citation2011), and increases in emissions of NH3, NOy, and N2O from soils (Luo et al. Citation2022). Aquatic effects include chronic and episodic acidification of acid-sensitive freshwaters with effects on aquatic biota (Driscoll et al. Citation2001; Stoddard et al. Citation2004); eutrophication of N-limited freshwaters (Fenn et al. Citation2003), including increased plant growth and harmful algal blooms (HABs) and associated toxin production (Bogard et al. Citation2020; Hoffman et al. Citation2022); eutrophication of coastal waters involving loss of submerged aquatic vegetation, and development of hypoxic conditions that severely degrade coastal habitats (Driscoll et al. Citation2003; Galloway et al. Citation2003).
Terrestrial ecosystem effects
Increases in N deposition have important implications for C sequestration by terrestrial ecosystems. Magnani et al. (Citation2007) reported large rates of C sequestration in forests in response to N deposition. While this analysis generated considerable initial discussion (de Vries et al. Citation2008; Janssens and Luyssaert Citation2009; Sutton et al. Citation2008), research that has followed has shown that while individual plant species may respond either positively, negatively, or not at all to increases in N inputs overall there is a net increase in net C accumulation in above-ground biomass per unit N deposition (Clark, Thomas, and Horn Citation2022; Coughlin et al. Citation2023; Horn et al. Citation2018; Thomas et al. Citation2010) albeit at rates considerably lower than those reported by Magnani et al. (Citation2007). Clark, Thomas, and Horn (Citation2022) estimate that +9 kg C is fixed in aboveground tree biomass per kg N deposition for the overall forested areas of the conterminous U.S. Moreover, when comparing these recent rates with a 1980s-1990s study for the northeastern U.S (Thomas et al. Citation2010). it appears that the rate of tree above-ground C sequestration per unit N deposition may be weakening, likely due to species level responses to N deposition. In addition, N inputs also enhance belowground C sequestration due to decreases in saprotrophic activity (Gilliam et al. Citation2023; Janssens et al. Citation2010).
Elevated atmospheric N deposition has been shown to influence a host of terrestrial ecosystem characteristics, including understory vegetation (Clark et al. Citation2019; Gilliam et al. Citation2016; McDonnell et al. Citation2020; Simkin et al. Citation2016), overstory tree growth and survival (Coughlin et al. Citation2023; Horn et al. Citation2018; Thomas et al. Citation2010), microbial communities and their function in soils (Gilliam et al. Citation2019; Janssens et al. Citation2010) such as mycorrhizal associations (Averill, Dietze, and Bhatnagar Citation2018; Jo et al. Citation2019) and lichens (Geiser et al. Citation2019, Citation2021), and surface water leaching (Aber et al. Citation2003; Baron et al. Citation2011).
Studies of terrestrial ecosystem effects have focused on changes in diversity of plant and microbial species that are largely mediated through soil processes. In general, increases in N supply result in shifts in species distributions by changing environmental conditions that are less favorable for organisms with efficient N acquisition and recycling strategies that are adapted to low N conditions, and more favorable for species that grow rapidly in response to increases in reactive N. This results in a decrease in species diversity and trend toward more nitrophilic and uniform plant and microbial communities. For example, in grasslands, elevated N results in competitive loss of species due to light limitations (Hautier, Niklaus, and Hector Citation2009). Due to the long-life history of trees, highly variable climatic and soil conditions, and the interplay between eutrophication and acidification effects, the responses of forest ecosystems to N deposition are complex, variable, and likely will play out over long time scales (Carter et al. Citation2017). One thought is that trees with low N use efficiency (i.e., low carbon accumulation per unit N uptake) may be better suited to take advantage of high N conditions compared with trees that are adapted to low N environments over the long-term (Chapin, Vitousek, and Van Cleve Citation1986).
Ecosystem impacts of atmospheric N deposition have been evaluated by examining health metrics, such as growth and survival of trees. Early studies were limited to examination of relatively few species over relatively small areas. These constraints have been eliminated by development and application of the U.S. Forest Service Forest Inventory Analysis (FIA) database. The FIA measurement dataset is compiled from a nationally standardized plot system which includes data on tree height, basal area, and above-ground biomass among other characteristics for forest sites across the conterminous U.S., with plots every 24.3 km2. Investigators have used the FIA database to examine changes in the growth and mortality of large numbers of tree species in forested regions of the U.S, in response to changes in atmospheric N deposition. They find overall increases in N have resulted in increased tree growth but decreases in the probability of survival with considerable variation among species (Horn et al. Citation2018).
Changes in growth and survival of 94 tree species from the FIA database have been evaluated following changes in atmospheric N deposition over the period 2000–2019, depicting 96.4 billion trees over the conterminous U.S (Coughlin et al. Citation2023). Basal area of trees is increasing in 85.2% of the forested area of the U.S., likely due to fertilization effects of N. The probability of survival is also improving in many species. However, the rate of growth increase is slowing consistent with decreases in N deposition. Moreover, these increases in tree growth may result in decreases in biodiversity. While the overall growth response is positive, this analysis suggests that sensitive trees continue to be harmed by atmospheric N deposition. The level of N deposition necessary to protect 95% of the trees within individual states was evaluated (Coughlin et al. Citation2023). For most states and regions, current levels of N deposition are not expected to lead to decreases in tree growth. The exception to this pattern is the Northern Forest region (ME, NH, VT, NY, MI, WI, MN) which is projected to require additional decreases in N deposition to protect growth for 95% of the species in the forests. In contrast to overall growth, most states and regions will need additional decreases in N deposition to adequately protect against increased mortality of sensitive tree species. In some regions, notably near agricultural regions in the Midwest and North Carolina, decreases in reduced N deposition will be needed to protect 95% of the species in the forests of those areas (see Section 2.4.3).
Freshwaters
As in terrestrial ecosystems, N deposition can contribute to the eutrophication and acidification of freshwater ecosystems. Watersheds that are sensitive to and impacted by acidification occur in high elevation regions with acidic soils and bedrock that is resistant to weathering (Greaver et al. Citation2012). Watershed leaching losses of sulfate and NO3− contribute to freshwater acidification. Concentrations of sulfate typically exceed NO3− so sulfate is the more important driver of acidification effects. While concentrations of sulfate are relatively consistent throughout the annual cycle, NO3− concentrations are typically greater in the non-growing season and particularly during the spring high-flow period (Stoddard et al. Citation2004). As a result, the most severe freshwater acidification effects typically occur during this period (Baldigo et al. Citation2019; Driscoll et al. Citation2001). In watersheds in the U.S. where atmospheric deposition was the dominant source of N input, Lassiter et al. (Citation2023) found a much stronger correlation between atmospheric NOy deposition and stream NO3− concentrations than between atmospheric NHx deposition and stream NO3− concentrations, suggesting that NOx emissions and NOy deposition have a greater influence on stream NO3− loss than NH3 emissions and NHx deposition. Due to decreases in atmospheric SO2 and NOx emissions and deposition, NO3− (and sulfate) concentrations have decreased in recent decades and recovery from surface water acidification is occurring in acid-impacted freshwaters (Driscoll et al. Citation2016).
The role of N in eutrophication in freshwaters is more subtle than for coastal waters (Section 2.4.2.3). In contrast to coastal marine ecosystems where N limitation is widespread, phosphorus limits primary production in many freshwater lakes (Elser et al. Citation2007; Howarth and Marino Citation2006; Schindler et al. Citation2008). However, for many eutrophic lakes, N may be limiting or co-limiting with phosphorus, in part due to accumulation of legacy phosphorus in watersheds and sediments (Paerl et al. Citation2016). High elevation lakes in the western U.S. are particularly sensitive because atmospheric N deposition is a large fraction of the total N input (Baron et al. Citation2011; Nanus et al. Citation2012, Citation2017). Atmospheric N deposition has been shown to contribute to the eutrophication of some lakes (Bergstrom and Jansson Citation2006; Fenn et al. Citation2003). Williams et al. (Citation2017) found that elevated atmospheric N deposition in western lakes can result in a shift from N-limited to phosphorus-limited growth conditions. As a result, management recommendations often advocate for control of both phosphorus and N inputs to lakes (Conley et al. Citation2009; Howarth and Paerl Citation2008; Lewis, Wurtsbaugh, and Paerl Citation2011; Paerl Citation2009; Paerl et al. Citation2016; Wurtsbaugh, Paerl, and Dodds Citation2019).
In addition to promoting eutrophication, N also can contribute to the toxicity of cyanobacterial blooms in lakes (Davis et al. Citation2015; Gobler et al. Citation2016). This condition generally occurs in eutrophic and hypereutrophic lakes (Bogard et al. Citation2020; Hoffman et al. Citation2022) but is increasingly observed in oligotrophic lakes that are strongly phosphorus limited with relatively high N concentrations (Howarth Citation2022; Townhill et al. Citation2018; Trainer et al. Citation2020). Microcystin and other toxins produced by cyanobacteria are highly enriched in N. Elevated concentrations of N lakes promotes the production of toxins (Baker, Wilson, and Scott Citation2018; Bogard et al. Citation2020; Chaffin et al. Citation2018; Dolman et al. Citation2012; Hoffman et al. Citation2022; Monchamp et al. Citation2014). The production of toxins by cyanobacteria in lakes is a major public health concern not only to those who are exposed by drinking water but also from contact recreational activities. Exposure can also occur by atmospheric transmission associated with the release of volatile toxins in areas near lakes and coastal waters experiencing harmful algal blooms (U.S. EPA Citation2023a).
Coastal waters
Elevated N inputs are one of the greatest threats to the ecological integrity of coastal ecosystems, often causing eutrophication (the excessive production of algae and cyanobacteria), which can lead to hypoxic and anoxic waters (“dead zones”), degradation of habitat quality including loss of seagrasses and submerged macrophytes, fish and shellfish kills, decreased biodiversity, and increased harmful algal blooms (Bricker et al. Citation2008; National Research Council NRC Citation2000; Paerl and Barnard Citation2020; Vitousek et al. Citation1997). The role of atmospherically derived N as a driver of eutrophication in aquatic ecosystems has long been recognized (Howarth et al. Citation1996; Paerl Citation1995, Citation2002). A significant fraction of the N entering aquatic ecosystems often is associated with atmospheric deposition, including both direct deposition to the surfaces of the water bodies and deposition onto their watersheds with subsequent transport to the downstream wetlands, rivers lakes and estuaries. Estimates of the relative contribution of atmospheric N deposition to the total N load to estuaries range from a few percent to greater than 60% with values typically from ~ 20 to over 40% depending on the surface area of the estuary relative to the surface area of the watershed and watershed development (Alexander et al. Citation2001; Boyer et al. Citation2002; Burns et al. Citation2021; Castro and Driscoll Citation2002; Castro et al. Citation2003; Jaworski, Howarth, and Hetling Citation1997; Paerl Citation2002; Whitall, Hendrickson, and Paerl Citation2003).
In most of the estuaries and coastal marine waters of the U.S., N is the primary element limiting rates of primary production, and increased N loading is the major cause of eutrophication (Howarth Citation1988; Howarth and Marino Citation2006; Howarth et al. Citation2021; Nixon Citation1995; NRC Citation2000; Paerl and Piehler Citation2008; Vitousek and Howarth Citation1991). Two-thirds of the estuaries in the U.S. are moderately to severely degraded, and N is the single largest driver of degradation (Bricker et al. Citation2008; NRC Citation2000). Although CLs of N are not typically developed for estuaries, Total Maximum Daily Loads (TMDL) are developed under the Clean Water Act for impaired waters (see Section 4.4). Notable examples of estuaries and coastal marine ecosystems degraded from excessive N inputs where the EPA is currently working with state and local stakeholders to reduce N inputs include Chesapeake Bay (DE, MD, PA, NY, VA, WV), Long Island Sound (NY, CT), Tampa Bay (FL), Barnegat Bay (NJ), Great Bay (NH, ME), Waquoit Bay (MA), and the “dead zone” in the Northern Gulf of Mexico near the plume of the Mississippi River (Bricker et al. Citation2008; NRC Citation2000; Rabalais et al. Citation2002).
Nitrogen critical loads
The level of deposition at which the above ecosystem components begin to change is designated as the critical load (CL). Over the past decade there have been important initiatives to quantify CLs for components of terrestrial and freshwater ecosystems in the U.S. to help guide management, limit impacts of new emission sources, and inform secondary NAAQS for NO2 and SO2 (Blett et al. Citation2014; US EPA Citation2020). CLs have been established for, but not limited to, herbaceous and shrub species (Clark et al. Citation2019; Simkin et al. Citation2016; Wilkins, Clark, and Aherne Citation2022), lichen species and functional groups (Geiser et al. Citation2019, Citation2021), tree species (Coughlin et al. Citation2023; Horn et al. Citation2018; Pavlovic et al. Citation2023), freshwaters (McDonnell et al. Citation2021; Shao et al. Citation2020) and regional resources (Pardo et al. Citation2011).
Typically, CLs are reported as a single value, with uncertainty, for a response indicator across its range (Pardo et al. Citation2011). However, in addition to atmospheric deposition, mediating factors such as climate and soil conditions can influence species response and sensitivity to N deposition, and are increasingly being quantified in dose-response relationships (Clark et al. Citation2019; Geiser et al. Citation2021; Simkin et al. Citation2016). These locality-based CLs have the potential to provide effective tools for land managers to refine ecosystem protection measures. Coughlin et al. (Citation2024) quantified the spatial variability and estimation error in CLs of N for the growth and survival of ten different tree species, while considering key environmental factors that mediate species sensitivity to N (e.g., ozone, drought severity, soil characteristics). They found minimal differences (<5 kg N ha−1 yr−1) when comparing the CLs of a single species across climatic regimes, but considerable variability in local CLs of N (>8.5 kg N ha−1 yr−1) of different species within these regimes. They also found climate, species competition, and air pollution (e.g., N and sulfur deposition, ozone) to be the most important mediating factors for predicting tree growth and survival.
For this critical review, we evaluate four categories of the form and quantity of atmospheric N deposition that result in CL exceedances for natural resources. In the discussion below, “No exceedance” indicates that total N deposition does not exceed the CL at a given location. “Exceeded by oxidized N” (NOy) indicates locations where total oxidized N deposition independently results in an exceedance. “Exceeded by reduced N” (NHx) represents sites where total reduced N deposition independently causes an exceedance. Lastly, “Exceeded by Total N” are sites where the sum of reduced and oxidized N is needed to result in a CL exceedance.
Critical load exceedances
The CLs used in this analysis are intended to show ecosystems with varying sensitivity to N respond to current deposition metrics. CL exceedances are calculated using total N deposition, reduced N, and oxidized N deposition as calculated by the NADP Total Deposition model (version 2022.02; National Atmospheric Deposition Program (NADP) Citation2023) and are reported as total land area in the conterminous U.S. above the CL. Exceedances are calculated for a decline in N-sensitive lichen species richness (3.1 kg N ha−1 yr−1); a decline in herbaceous species richness (open canopy, 6.2–13.3 kg N ha−1 yr−1; closed canopy 6.1–23.7 kg N ha−1 yr−1); a 5% decline in growth of the most sensitive tree species at a site (2.5–47.9 kg N ha−1 yr−1); a 5% decline in survival of the most sensitive tree species at a site (7.4–48.6 kg N ha−1 yr−1); and an increase in risk of eutrophication for lakes (western lakes, 4.1 kg N ha−1 yr−1; eastern lakes 6.0 kg N ha−1 yr−1) and are summarized in . The reduced- and oxidized-N rows of indicate the land area where CL exceedance could be eliminated solely by decreases in the relevant N type. Methods for application of CLs of N to U.S. datasets are described in Supporting Information (Critical Load data sets).
Exceedances for lichens are widespread due to their high sensitivity to atmospheric deposition (; Geiser et al. Citation2019). Given their sensitivity, exceedances of CLs for lichens could be alleviated considerably by decreases in NHx deposition, especially in the Midwest and higher elevation western mountains. Even in areas with higher NOy deposition where decreases in NHx would not alleviate an exceedance due to the dose/response relationship with N, there would be improvement in the health of lichen communities following decreases in NHx deposition. Due to higher CLs, there is less spatial area at risk of a decline in herbaceous species richness, but with exceedances occurring mostly near agricultural areas of the Midwest and southern US, decreases in harm would be expected with decreases in NHx deposition ().
Figure 10. Maps of nitrogen critical load exceedances for the conterminous U.S. for species richness of lichens (a); species richness of herbaceous plants (b); a 5% decrease in tree growth (c); and tree survival (d). Shown are in blue- no exceedance; yellow- exceedance that could be eliminated by oxidized nitrogen; brown- exceedance that could be eliminated by reduced nitrogen; and red- a combination of oxidized and reduced nitrogen is necessary to eliminate the exceedance. A description of the datasets and methods used to determine exceedances of nitrogen critical loads are provided in the Supporting Information.
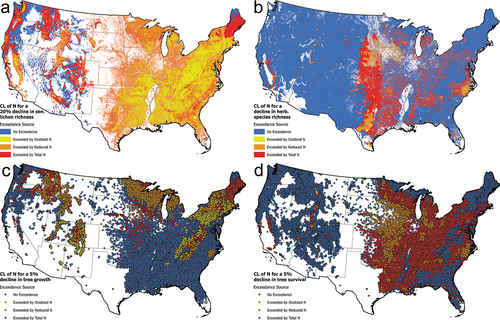
Exceedances of CLs of N for tree growth are generally widespread in northern and mountain areas, including the Mountain West, Appalachian Mountains, the upper Midwest, eastern North Carolina, Pennsylvania, New York, and New England (). Exceedances of CLs for tree growth could be eliminated by only decreases in reduced N deposition in large areas of the Mountain West, the upper Midwest, eastern North Carolina, the southern and central Appalachian Mountains, and New York. The spatial extent of exceedances of CLs of N for tree survival is considerably greater than for tree growth (). Exceedances for CLs of N for tree survival are particularly prominent in the eastern U.S., through the Midwest and in many southeastern states. Controls solely on NH3 emissions and NHx deposition would not alleviate N CL exceedances for tree survival to the degree observed for tree growth. Nevertheless, decreases in NHx deposition could eliminate N CL exceedances for tree survival in eastern North Carolina and in the Midwest in Wisconsin, Minnesota, Iowa, and Missouri.
Table 1. Summary of total land area in the conterminous U.S. of vegetation resources and estimates of the land areas of exceedances of critical loads of total nitrogen, including areas where exceedances can be avoided by decreases solely of either reduced (NHx) or oxidized (NOy) N deposition.
Exceedances of critical loads of N for Aquatic Eutrophication
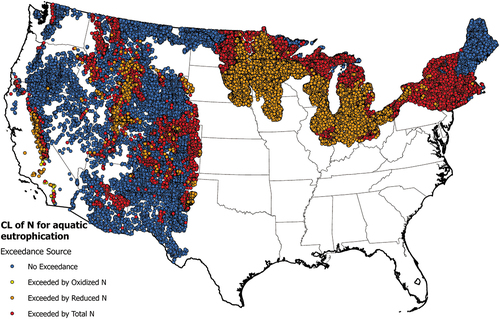
A CL of 4.1 kg N ha−1 yr−1 is used for lakes in the western US which aligns with the value expected to lead to a shift from N-limited to phosphorus-limited growth conditions (Williams et al. Citation2017). Eastern lakes are evaluated at a CL of 6.0 kg N ha−1 yr−1 which is the upper range reported by Baron et al. (Citation2011) to reduce risk of eutrophication. Deposition of NHx alone leads to exceedances of CLs of N for lake eutrophication in 29% of evaluated lakes (47,816). An additional 14,187 lakes (9%) exceed lake CLs when total N deposition is considered. NHx deposition is thus the main driver of atmospheric impacts on lake health (). Oxidized N alone only leads to CL exceedances in 84 lakes. In the western U.S., NHx influenced exceedances occur in the Central Valley of California, the Salt Lake City air basin, and in the highest elevations of the Rocky Mountains. Most NHx caused exceedances in the eastern and mid-western U.S. occur in northern midwestern states. Total N deposition leads to exceedance of CLs for aquatic eutrophication in most high elevation areas of the West, and the rest of the Midwest and eastern U.S. except for Maine and New Hampshire.
Figure 11. Map of nitrogen critical load exceedances for lakes in the conterminous U.S. Shown are in blue- no exceedance; yellow- exceedance that could be eliminated by oxidized nitrogen; brown- exceedance that could be eliminated by reduced nitrogen; and red- a combination of oxidized and reduced nitrogen is necessary to eliminate the exceedance. A description of the datasets and methods used to determine exceedances of nitrogen critical loads are provided in the Supporting Information.
Ecosystem recovery from N deposition
As atmospheric N deposition, particularly NO3−, is decreasing in some regions, investigators have transitioned conceptual models to address pathways and rates of terrestrial and aquatic ecosystem recovery. An important consideration of ecosystem recovery from elevated N deposition is legacy effects associated with past deposition. Terrestrial ecosystems accumulate N which is enhanced under elevated atmospheric N deposition (Byrnes, Van Meter, and Basu Citation2020; Yanai et al. Citation2013). Inputs of N reside in different terrestrial pools with slow or fast turnover rates (Lovett and Goodale Citation2011; ). Gilliam et al (Citation2019, Citation2023). developed a conceptual framework describing the hysteresis response of terrestrial ecosystems to first increases followed by decreases in atmospheric N deposition. Hysteresis is a property of an ecosystem wherein the output is not a strict function of corresponding input, due to a lag, delay, or history dependence. As a result, ecosystem response to decreasing input follows a different trajectory than the response to increasing input. Wood and SOM have slow N turnover rates, while microbial biomass and available mineral soil exhibit rapid N turnover rates. Ecosystem responses that are governed by N pools with slow turnover rates will show a greater pattern of hysteresis following decreases in atmospheric N deposition. In contrast, ecosystem responses controlled by N pools with rapid turnover rates will exhibit more rapid response to decreases in N inputs and less hysteresis. For example, NO3− leaching is governed by fast turnover N pools and will generally respond rapidly to decreasing N deposition. Due to these legacy effects, some of the impacts of atmospheric N deposition appear to be realized rapidly while others manifest over multiple decades. Likewise following management actions some effects are mitigated relatively rapidly while others linger for extended periods.
Beyond changes in atmospheric N deposition, a variety of factors influence the rate of ecosystem progression toward a condition of N saturation or N recovery (Aber et al. Citation1998; Gilliam et al. Citation2019, Citation2023). For example, ecosystem demand for N decreases with forest succession which facilitates the transition toward a condition of N saturation (Goodale, Aber, and McDowell Citation2000). In contrast, factors that retard the progression toward N saturation and accelerate terrestrial ecosystems toward N recovery include historical land use/disturbance which result in N losses, such as fire, tree harvesting and agriculture (Aber et al. Citation1998). Stevens (Citation2016) observed that grasslands are slow to recover because of lack of seed bank or source or having reached an alternate stable state. Some insight is obtained from experimental field studies. Bowman et al. (Citation2018) found delayed recovery of alpine meadows following the termination of N fertilization. While Patel et al. (Citation2020) found rapid recovery (~2 years) of stream NO3− leaching following the cessation of experimental ammonium sulfate treatments to a watershed in Maine, USA. Högberg et al. (Citation2024) examined the response of pine trees and soils to 50 years of experimental ammonium nitrate additions finding the treatments acidified soil and affected tree nutrient composition but did not decrease tree growth. As experimental N treatments are typically applied at elevated levels and as pulse inputs is unclear how well experiments depict conditions experienced by ecosystems from ambient deposition. Moreover, as few ecosystem studies are long-term, comprehensive investigations of response from decreases in elevated N deposition are lacking, particularly recovery from NHx deposition.
While the N cycle has been highly studied and abundant ongoing research continues to inform and refine our understanding of this critical biogeochemical cycle, many uncertainties and complexities remain. In particular, the N cycle of Earth systems is responding to shifts in N emission sources characterized by marked changes in the relative composition of oxidized and reduced N forms over space and time, and the interplay between changes in the N cycle and changing climate. Climate change and increases in atmospheric CO2 are emerging as important drivers altering the N status of ecosystems, as embodied by the “N oligotrophication” hypothesis (Groffman et al. Citation2018; Mason et al. Citation2022). Several processes are thought to drive this change. Fertilization of forests by atmospheric CO2 increases net production of biomass, increasing plant N uptake and sequestration. Increases in air temperature increase the length of the growing season resulting in greater annual net ecosystem production and N retention. Finally, increases in fire frequency and severity associated with increasing warming and drying conditions and a lengthening of the growing season decreases N loss. These climate and CO2 driven pathways retard the progression toward N saturation and accelerate ecosystem recovery from a condition of N saturation.
The occurrence of wildfires has increased over recent decades, and with these events there has been a deterioration in air quality, largely due to increases in fine particulate matter (Ford et al. Citation2018; Requia, Coull, and Koutrakis Citation2019). Many factors influence susceptibility to wildfire, including increases in local human population and associated development adjacent to natural lands, fire suppression, and warming and drought. Increasing fire frequency and severity are linked to climate change (Jolly et al. Citation2015). In addition to these factors, there is a linkage between air pollution and forest predisposition to wildfires, which has been particularly manifested in southern California (Grulke et al. Citation2010). Increases in atmospheric N deposition and ozone shift the processing of water, C and N in forest ecosystems, resulting in a cascade of synergetic effects, which make trees more prone to disease, pest invasion, drought and ultimately wildfire. As discussed, N deposition increases leaf turnover and litter mass, and decreases the decomposition of litter and increases litter mass. Under high ozone and N deposition, trees also shift their allocation of biomass away from foliage and roots. Elevated ozone decreases plant control of water loss increasing transpiration, which when coupled with loss of root mass, increases the susceptibility of trees to drought stress. Ozone and drought stress and enrichment of N makes trees particularly vulnerable to attack by bark beetles (Eatough Jones et al. Citation2004). The enhanced fuel load from tree decline and litter accumulation driven by N and ozone pollution coupled with development pressures and climate have contributed to catastrophic fires in southern California, exacerbating already severe air quality and health impacts. The additional biomass generated by N deposition in California deserts has also increased the size and intensity of fire in areas where it was once rare (Rao, Allen, and Meixner Citation2010). Additionally, in southern California grasslands, once a fire removes the standing vegetation in high deposition areas, it is more likely to undergo a type-conversion from shrubland to exotic grassland (Cox et al. Citation2014; Talluto and Suding Citation2008). Such feedbacks will continue to influence wildfires and thereby accelerate air pollution and the associated impacts in the future.
Atmospheric emissions, transport and fate
Ammonia emissions and trends
Emissions of NH3 have increased globally by a factor of two to five since preindustrial times (Fowler et al. Citation2013; Lamarque et al. Citation2010) owing to organic and synthetic fertilizer application and livestock husbandry. At present, agricultural sources of NH3 are estimated to contribute to 80–90% of global NH3 emissions, with the remainder from industry, biomass burning, transportation, and natural emissions (Bouwman et al. Citation1997; Crippa et al. Citation2018; McDuffie et al. Citation2020). The distribution of NH3 across nations tends to follow population, e.g., NH3 emissions per capita are similar in China, the EU, and the U.S (Paulot et al. Citation2014).
Wyer et al. (Citation2022) review the details of agricultural processes that govern NH3 emissions, including animal housing, manure storage, and application of manure-based and synthetic fertilizer. Within the U.S., agriculture emissions contributions are led by confined animal feeding operations (CAFOs), followed by fertilizer application (EPA 2010; https://www.epa.gov/air-emissions-inventories/air-pollutant-emissions-trends-data; ). More than half of U.S. livestock NH3 emissions are from cattle operations, with the next largest contributors being pigs and poultry (Behera et al. Citation2013). Emissions from manure and fertilizer are impacted by temperature and wind speed. Additional sources of NH3 including stationary fuel combustion, industry, wildfires, and transportation each contribute a few percent to the EPA inventory, depending on the year ().
Since 1990, EPA estimates of total annual U.S. NH3 emissions have hovered around 4,300 thousand tons per year up until 2014, followed by a modest increase (). Meanwhile, trends in concentrations of NH3 have increased in ambient monitoring networks (AMoN, SEARCH) (Beachley et al. Citation2019; Butler et al. Citation2016; Saylor et al. Citation2015; Wang et al. Citation2023) and remote sensing data (Burns et al. Citation2023; Weber et al. Citation2016) over large parts of the U.S. From 2000–2016 total NHx deposition is estimated to have increased about 50% (Beachley et al. Citation2019; ).
Closing the U.S. NHx budget is complicated by the role of NH3 dry deposition fluxes, estimates of which are largely model-based and poorly constrained by available measurements (Walker et al. Citation2019). The magnitude of NH3 emissions from individual regions, sectors, and industrial facilities are also uncertain, with top-down estimates (see Section 3.6.3) often differing from emissions inventories by 10–50% nationally on an annual basis, although uncertainties can be larger at smaller spatial or temporal scales. For specific agricultural sources, it is challenging to capture the spatio-temporal variability of NH3 emissions due to the diversity of agricultural practices, meteorological conditions, and climate (Balasubramanian et al. Citation2020; Sutton et al. Citation2013,; Wyer et al. Citation2022; Zhu et al. Citation2015). NH3 emissions from transportation have been reported by several studies (Cao et al. Citation2022; Fenn et al. Citation2018; Sun et al. Citation2017) to be substantially underestimated in state and federal U.S. inventories. “Ammonia slip” is a term for NH3 that is released from selective catalytic reduction control devices. This occurs when NH3 is injected in excess, temperatures are too low for NH3 to be processed, or the catalyst has been fouled. Measurements using N isotopes have found combustion-related sources of NH3 to be nearly equal in magnitude as non-combustion sources in several urban and urban/coastal environments (Berner and David Felix Citation2020; Chen et al. Citation2022). The potential for NH3 emissions from transportation to contribute substantially more on a per ton basis to PM2.5 exposure and associated health burdens heightens concerns about the magnitude of this source of emissions (Dedoussi and Barrett Citation2014; Hopke and Querol Citation2022). Such studies have prompted U.S. EPA on-road emissions estimates to be increased by roughly a factor of two (U.S. EPA Citation2023e). In the U.S., NH3 emissions from natural sources, including soils, vegetation, wildlife and the ocean, are estimated to be 10–20% as large as anthropogenic emissions (Bouwman et al. Citation1997; Paulot et al. Citation2014)
Future emissions scenarios used by the climate modeling community project increases of NH3 emissions in the U.S. over the next several decades (Thomson et al. Citation2011). The largest driver of this is increasing demand for food production given increasing population (Erisman et al. Citation2008; Xu et al. Citation2019). For example, Ellis et al. (Citation2013) estimated U.S. NH3 emissions would increase by 19–50% from 2006 to 2050 following representative concentration pathway (RCP) projections (van Vuuren et al. Citation2011). Additionally, policies aimed at increased biofuel usage would likely contribute to increased NH3 emissions (Masera et al. Citation2015; Skorupka and Nosalewicz Citation2021).
Chemistry of NH3 in the atmosphere
Ammonia is the most abundant alkaline gas in the atmosphere (Aneja, Schlesinger, and Erisman Citation2009). It plays a prominent role in the formation of fine particulate matter primarily through its reactions with sulfuric and nitric acids. These reactions also influence patterns of N deposition by modulating the partitioning of NO3− and NH3 between gas and condensed phases.
In the gas-phase, NH3 reacts slowly with the hydroxyl radical, with a lifetime of one to two months (U.S. EPA Citation2008, Citation2020)
Current estimates are that this oxidation only serves to decrease global NH3 concentrations by 3%, yet hydroxyl radical oxidation may become more important under future emissions scenarios (Pai, Heald, and Murphy Citation2021).
In contrast, NH3 reacts relatively rapidly with gaseous atmospheric acids to form particulate matter. These reactions and deposition from the atmosphere are more important than the hydroxyl radical reaction in determining its fate. Ammonia reacts with sulfuric acid to form ammonium bisulfate, or ammonium sulfate,
:
The degree of sulfate neutralization is commonly expressed by the molar ratio of NH4+ to sulfate, , with a value of
= 2 representing full neutralization. If excess NH3 is present in the gas phase, it reversibly reacts with nitric acid vapor to form condensed-phase ammonium nitrate:
If present in excess, NH3 can also react in the gas phase with hydrochloric acid to produce , which is also a semi-volatile salt (Behera et al. Citation2013; see Table 9 therein for an exhaustive list of reactions leading to formation of NH4+).
NH3 also plays a role in secondary organic aerosol (SOA) formation from biogenic (e.g., Na et al. Citation2007) and anthropogenic (e.g., Chen et al. Citation2023) volatile organic compounds (VOCs). The presence of NH3 can increase or decrease the yield of SOA from the oxidation of different VOCs. Decreased yields can be caused by decomposition or lower yields of less-volatile compounds in the presence of NH3 (e.g., Ma et al. Citation2018; Na, Song, and Cocker Citation2006). More commonly, NH3 can increase SOA growth through mechanisms such as uptake by carbonyl groups (Liu et al. Citation2015) and formation of condensable salts with organic acids (Na et al. Citation2007; Paciga, Riipinen, and Pandis Citation2014). Ammonia-promoted formation of N-containing organic compounds (NOCs) contributes to enhanced particulate matter absorption of visible light, i.e., brown carbon (Laskin, Laskin, and Nizkorodov Citation2015; Updyke, Nguyen, and Nizkorodov Citation2012). Ammonia uptake also impacts the viscosity and diffusivity of organic aerosol (Bell et al. Citation2017; Li et al. Citation2015; Liu et al. Citation2018). It is estimated that up to 15% of particulate N could be due to NOCs (rather than inorganic salts) (Liu et al. Citation2015). Model simulations that include uptake of NH3 by SOA over the conterminous U.S. have shown a 5–10% reduction in bias for PM2.5 and carbonaceous aerosol concentrations (Zhu et al. Citation2022). However, most current air quality models do not account for this source of particulate matter. They may thus overestimate the role of ammonium sulfate and ammonium nitrate and underestimate the sensitivity of PM2.5 to changes in VOC emissions near NH3 sources (Horne et al. Citation2018).
In addition to its impacts on particle growth, NH3 plays an important role in new particle formation through binary and ternary nucleation with water and sulfuric acid (e.g., Kirkby et al. Citation2011; Kulmala, Pirjola, and Makela Citation2000; Nair, Yu, and Luo Citation2023). Binary homogeneous nucleation has been shown to be a reasonable representation of free tropospheric nucleation (Spracklen et al. Citation2005), while at low altitudes in polluted regions, nucleation involving amines or NH3 can also be important (Gordon et al. Citation2016). NH3 also affects the aerosol hygroscopicity, which in turn affects climate forcing and visibility (Malm Citation2016; Martin et al. Citation2004).
Ammonium sulfates in atmospheric aerosols are nonvolatile. In contrast, NH4NO3 can be lost from the condensed phase in response to increases in temperature or reductions in relative humidity. Partitioning to the condensed phase is generally expected to be higher in winter than summer, at night versus in the daytime, and at higher altitudes. In addition to influencing PM2.5 concentrations, partitioning of NHx and NO3− between gas and particle phases impacts patterns of N deposition, as dry deposition of the gases is much more rapid than dry deposition of fine particles.
Atmospheric transport
The effects of NH3 emissions on the atmosphere and ecosystems range from the relatively localized impacts of gas-phase NH3 to the more regionally distributed effects of particulate NH4+. As a gas, the atmospheric lifetime of NH3 has been estimated to range between a few hours to a day (Van Damme et al. Citation2018), depending on the physical and chemical environment. The lifetime is most often on the order of a few hours, constraining transport to tens of km or less prior to removal via deposition or conversion to particulate NH4+. NH3 lifetimes with respect to chemical conversion and deposition are of similar order of magnitude as these processes compete for its fate. For example, in biomass burning plumes, 30% of NH3 is converted to NH4+ within 1.4 hours of emissions (Paulot et al. Citation2017; Yokelson et al. Citation2009). NH3 concentrations often decrease by ~ 50% within a few km of sources (Asman et al. Citation1989; Erisman et al. Citation1987).
In contrast, particulate NH4+ has an atmospheric lifetime of several days to a week, leading to transport distances of 100–1000s of km from the point of formation. Emissions of NH3 can thus impact transport of PM2.5 at regional to intercontinental scales. However, Park et al. (Citation2004) found the contributions of NH3 emissions in Asia to PM2.5 concentrations and regional haze in the continental U.S. to be relatively small. Overall, intercontinental transport of PM2.5 from NH3 emissions to the U.S. is not expected to substantially contribute to PM2.5 exposure. Nawaz et al. (Citation2023) estimated that of approximately 100,000 premature deaths per year in the U.S. owing to long-term exposure to PM2.5 from anthropogenic sources, only ~ 2,000 were attributed to foreign emissions from agriculture, and of those the largest contributors were emissions in Canada and Mexico. Model estimates of sources of N deposition in North America, especially for NHx deposition, also indicate a relatively minor role of intercontinental sources relative to North American anthropogenic and natural sources (U.S. EPA Citation2020). One study reported ~ 25% of NHx deposition in North America emanating from outside North America, while only identifying ~ 1% of this as coming from other continents (Roy et al. Citation2012). A caveat is that multi-model studies have also highlighted large model diversities in estimating NHx deposition (Bian et al. Citation2017; Lamarque et al. Citation2013; Tan et al. Citation2018).
However, regional transport of NHx within the U.S. has been identified as a significant issue. Dedoussi et al. (Citation2020) showed that out-of-state emissions accounted for 28% of the contribution of non-agricultural anthropogenic NH3 emissions to premature deaths associated with long-term exposure to PM2.5. Studies such as Paulot, Jacob, and Henze (Citation2013) and Lee et al. (Citation2016) have highlighted the role of long-range sources for deposition of Nr to biodiversity hotspots and Federal Class I areas in the U.S., identifying 90% emissions footprints (the region from which 90% of the deposition emanates) that extend from 400 to 1600 km in radius (Lee et al. Citation2016). Several studies have estimated the contribution of long-range transport to deposition of Nr to Rocky Mountain National Park (Benedict et al. Citation2013; Lee et al. Citation2016; Malm et al. Citation2013; Thompson et al. Citation2015), where as much as 40% of the NHx deposition is estimated to originate from outside Colorado (Thompson et al. Citation2015).
Deposition/Removal from the atmosphere, and re-emissions
Ammonia is removed from the atmosphere via dry deposition, or by conversion of NH3 to NH4+ followed by wet or dry deposition of NH4+. Despite uncertainties in measurements of NH3 dry deposition and organic NO3− deposition (e.g., Phillips, Arya, and Aneja Citation2004; Sun, Fu, and Huang Citation2016), NHx currently makes up approximately half if not more of total deposited Nr in the U.S (e.g., Li et al. Citation2016; ). Over the continental U.S., about one third of emitted NH3 is deposited prior to conversion to NH4+ (Zhang et al. Citation2012). Total NHx deposition in the conterminous U.S. increased ~ 15% from 2002 to 2014 (), although estimated NH3 emissions were relatively constant over the same area and period (). The reason for this discrepancy has not been fully explained (Yao and Zhang Citation2019) and both NH3 emissions and NHx deposition increase similarly in years since ~ 2014. Decreased partitioning of NHx to particulate form resulting from declining domestic emissions of SO2 and NOx has left a larger fraction of NHx in the gas phase. As gas-phase NH3 has a shorter atmospheric lifetime, less NHx would be exported from the conterminous U.S. in the form of aerosol NH4+ (Pan et al. Citation2024; Saylor et al. Citation2015; Yao and Zhang Citation2019). Also, during the 2002 – 2014 timeframe the NH3 and NH4+ fractions of N deposition in the U.S. increased similarly, while after that period the NH4+ deposition fraction stabilized while the NH3 deposition fraction increased (). These trends are consistent with declining emissions of SO2 and NOx having impacted NH3 partitioning. Other factors may include increased emissions of NH3 owing to warmer and drier climate (Yao and Zhang Citation2019), spatial sampling biases in the spatial distribution of deposition networks (Wang et al. Citation2023), or underestimates of NH3 emissions trends (Yao and Zhang Citation2019)
Wet deposition
On global scales, the largest sinks of atmospheric NH3 and NH4+ are via wet deposition (Dentener et al. Citation2006; Tan et al. Citation2018), although there is considerable variability in model estimates that can be improved through data fusion or assimilation (Paulot, Jacob, and Henze Citation2013; Rubin et al. Citation2023). Both NH3 and NH4+ are hydrophilic and are readily scavenged by aqueous particles and deposited to surfaces. The process of wet deposition collectively refers to the absorption of NHx in cloud droplets which subsequently rain out, as well as below-cloud scavenging of NHx by falling rain. Over the U.S. it is estimated that a little more than half of NHx deposition occurs via wet deposition (Zhang et al. Citation2012). Recent results reported by the National Atmospheric Deposition Program (NADP) Total Deposition Science Committee (TDep) indicate the wet and dry deposition contributions are approximately equal ().
Dry deposition
Dry deposition of NHx is dominated by gas-phase NH3, which has an order of magnitude higher dry deposition velocity than that of NH4+ (e.g., Duyzer Citation1994)). Over the U.S. in the past two decades, dry deposition of NH3 is estimated to have exceeded that of NH4+ by factors of three to ten (Zhang et al. Citation2012; ). TDep estimates of dry deposition are based on calculated dry deposition velocities applied to NH3 concentrations simulated by the Community Multiscale Air Quality (CMAQ) model, and thus are inherently more uncertain that NHx wet deposition estimates that are constrained by National Trends Network (NTN)/NADP wet deposition measurements.
Bidirectional exchange
While many air pollution models treat dry deposition of NH3 as a unidirectional process, it is well established that the exchange of NH3 between the biosphere and the atmosphere is bidirectional (Sutton et al. Citation1998). The biosphere can either be a sink or source of NH3, as the tradeoff between evasion and emission is impacted by factors such as soil temperature, moisture, pH, the available NH3 soil pool, and vegetation type (Bash et al. Citation2015).
As the importance of bidirectional exchange has become increasingly recognized, the inclusion of this process in air quality models has become more widespread (Bash et al. Citation2013; Zhu et al. Citation2015). Process-based models of NH3 bidirectional exchange calculate the flux between the atmospheric and soil pools based on the gradient between ambient surface-layer NH3 concentrations and the canopy compensation point (e.g., Cooter et al. Citation2010, Citation2012; Pleim et al. Citation2013; Walker et al. Citation2023; Zhu et al. Citation2015). Simplified models may use empirical relationships or lookup tables to parameterize the NH3 flux for different land-use types (Dennis et al. Citation2010; Kruit et al. Citation2012).
Explicit representation of bidirectional exchange has helped decrease biases in air quality model simulations of ambient NH3 and net NHx deposition. The bidirectional exchange of NH3 from fertilized soils and crops has been found to lead to decreases in net fluxes of NH3 from the atmosphere to the surface, relative to unidirectional models, by 10–20% annually in the U.S. and Europe (Cao et al. Citation2020, Citation2022b). However, in regions of intense fertilizer application, such as the San Joaquin Valley, the impact can be greater, with surface concentrations impacted by more than 50% in both positive and negative directions on an hourly basis (Zhu et al. Citation2015b). The spatial extent to which an NH3 source can impact NHx concentrations downwind can be extended through this “leap-frog” process of emission, uptake, and re-emissions (Zhu et al. Citation2015).
There are several challenges with modeling and accounting for the impacts of bi-directional exchange (Walker et al. Citation2019). The deposition and re-evaporation of NH3 from wet surfaces (i.e., dew) is known to contribute to morning peaks in ambient NH3 concentrations (Wentworth et al. Citation2016). While the underlying mechanism for this process is well known, parameterizing the moisture layer and compensation points for different surfaces remains a challenge for developing cuticular resistance schemes. There is further need for development of methods for determining compensation points for natural and agricultural soils, and for databases of species-level stomatal emissions potentials for natural vegetation, soil, and leaf-litter for ecosystems. Lastly, collection of NH3 flux measurements and compilation of flux databases across a wider variety of ecosystems than currently available is necessary for further development, evaluation, and refinement of bidirectional exchange schemes for air quality models (Walker et al. Citation2020).
Chemical interactions of NHx with other atmospheric constituents
The distribution and fate of atmospheric NH3 is impacted by chemical interactions with other species in the atmosphere. In turn, concentrations of other gas and aerosol species, and deposition of oxidized N, can also be affected by the sources and distributions of NH3. These interactions result in nonlinear responses of PM2.5 mass concentrations, pH, and N or S deposition to changes in NH3, SO2, NOx, and VOC emissions. Consequently, the question of whether NH3, NOx, or SO2 emissions limit formation of secondary inorganic aerosols and N or S deposition under different atmospheric conditions has long been of interest to air quality managers (U.S. EPA Citation2008). Numerous studies using aerosol thermodynamics and chemistry and transport modeling have examined consequences of changes to anthropogenic emissions of these species (e.g., Ge et al. Citation2023; Liu et al. Citation2019; Thunis et al. Citation2021; Wang et al. Citation2011). Pan et al. (Citation2024) review 17 studies evaluating the effectiveness of SO2, NOx, and NH3 controls on PM2.5 in the U.S. Several factors are important to consider in comparing results across studies, including when the study was conducted and the corresponding emissions levels, whether incremental or more substantial changes in emissions were examined, and the mathematical approach used to attribute changes in secondary inorganic aerosol (SIA) concentrations to specific emissions (Clappier et al. Citation2017). Results are expected to differ across locations and seasons, due to the dependence of phase partitioning on temperature and relative humidity as well as relative levels of precursor emissions.
One of the most fundamental ways in which NH3 nonlinearly impacts PM2.5 is by promoting partitioning of nitric acid from the gas phase to the aerosol phase to form ammonium nitrate (Vayenas et al. Citation2005). The sensitivity of total PM2.5 mass to NH3 can be quantified via the reduced gas ratio, GR, defined as GR = ([NHx] − 2[SO42-])/([HNO3 + NO3−]). This ratio assumes that (a) available NH3 preferentially forms ammonium sulfate through reaction with sulfate, (b) sulfate remains in the particle phase regardless of the concentrations of NHx and total NO3 (HNO3 + NO3−), and (c) NO3− only partitions to the aerosol phase in the presence of NH3 that remains following formation of ammonium sulfate.
While a simplification of SIA formation (e.g., sulfate is not necessarily completely neutralized by NH3, NO3− is favored by colder and wetter conditions, other components such as Na+, Cl− and dust are ignored, pH and relative humidity are neglected), this ratio remains useful for diagnosing the likely large-scale response of PM2.5 via altered partitioning to changes in NH3, NOx, or SO2 emissions (e.g., Chen, Shen, and Russell Citation2019; Lawal et al. Citation2018; Park et al. Citation2004; Vasilakos et al. Citation2018; Weber et al. Citation2016). Values of GR > 1 indicate that the formation of ammonium nitrate is limited by the availability of total NO3−, and thus PM2.5 is largely unresponsive to changes in NH3 emissions. This condition occurs in strong NH3 source regions in the U.S. such as the San Joaquin Valley, as well as throughout much of India and China. In contrast, values of GR < 1 correspond to conditions where ammonium nitrate will be most sensitive to changes in emissions of NH3, which is the case throughout much of the eastern U.S. as well as large urban areas in the West such as Los Angeles (Laughner et al. Citation2021). The GR suggests that decreases in SO2 emissions could potentially contribute to increased PM2.5 concentrations through replacement of ammonium sulfate with two molar equivalents of ammonium nitrate (Henze, Seinfeld, and Shindell Citation2009; Napelenok et al. Citation2006; West, Ansari, and Pandis Citation1999). For example, Wang et al. (Citation2013) used response surface modeling to show that in China, SIA reductions associated with 16% decreases in SO2 emissions could be entirely offset by increased ammonium nitrate concentrations following 16% increases in NH3 emissions. Variability in GR helps explain differences in the response of PM2.5 concentrations in different regions to decreases in NOx emissions during COVID-19 lockdowns (e.g. Laughner et al. Citation2021; Xu et al. Citation2022).
While a useful metric for considering first-order sensitivities, the SIA system can elicit non-linear responses not captured by the GR (Bauer, Tsigaridis, and Miller Citation2016; Bessagnet et al. Citation2014; Guo et al. Citation2018; Heald et al. Citation2012; Henze, Seinfeld, and Shindell Citation2009; Megaritis et al. Citation2013; Nenes et al. Citation2020, Citation2021; Pozzer et al. Citation2017; Silvern et al. Citation2017; Tsimpidi, Karydis, and Pandis Citation2007). For example, interactions with organic aerosol components can lead to chemical nonlinearities as the uptake of NH3 by SOA can deplete ambient NH3 concentrations, causing indirect decreases in the amount of inorganic ammonium salts in particulate matter (Horne et al. Citation2018). Many recent studies have focused on the role of aerosol pH and liquid water content in modifying partitioning. The GR suggests that with relatively rapid reductions in SO2 emissions, aerosol acidity would decline, SO42- would be fully neutralized by NH4+, and ammonium nitrate concentrations would increase in locations where NH3 availability had been limiting its formation (e.g., Heald et al. Citation2012; Pinder, Adams, and Pandis Citation2007). However, Weber et al. (Citation2016) challenged these expectations, finding little change in pH or particulate NO3− in summer in the southeastern U.S. over a 15-year period. Measurements at a rural site at Centreville, AL showed that while summertime SO42- concentrations had declined as SO2 emissions decreased, aerosol pH was buffered by the ammonium ion shifting to gas phase ammonia, releasing H+ in the aerosol. Declines in NH4+ concentrations closely matched those of SO42-, with little change in particulate NO3− levels.
These findings stimulated more attention to aerosol acidity and its implications for NH3 and NO3− partitioning (Chen, Shen, and Russell Citation2019; Guo et al. Citation2018; Lawal et al. Citation2018; Nenes et al. Citation2020; Pan et al. Citation2024; Pozzer et al. Citation2017; Silvern et al. Citation2017; Vasilakos et al. Citation2018). For example, Silvern et al. (Citation2017) identified a low ratio of NH4+ to sulfate despite excess NH3 during summer in the eastern U.S., and an insensitivity of this ratio to excess NH3 (inconsistent with the simple description of partitioning captured by the GR). They found that aerosol acidity has increased despite decreases to SO2 emissions and relatively constant NH3 emissions in the southeastern U.S. They posited that an organic coating, leading to kinetic mass transfer limitations for NH3 uptake, may help explain observed NH4+ to sulfate ratios. Chen, Shen, and Russell (Citation2019) found that projected emissions changes between 2011 and 2050 (NH3 emissions were increased by 12%, NOx emissions were decreased by 70%, and SO2 emissions were decreased by 52%) increased pH across all seasons and locations. However, aerosol pH over most of the U.S. increased by less than 0.4 pH units from 2011 to 2050, and there was a limited shift of NO3− to the aerosol phase implying there would not be “major changes” in aerosol chemical processes. In contrast, climate-driven changes in meteorology decreased aerosol pH during winter in the eastern U.S., due to warmer and drier conditions that shift NH3 to the gas phase.
As noted by Pye et al. (Citation2020), most prior chemical transport modeling (CTM) studies have not explicitly considered aerosol pH (due to inability to measure it directly). It was commonly assumed that evaluating CTM performance based on NH3 or NO3− partitioning implicitly evaluated how well aerosol acidity was modeled. Similarly, molar ratios of more commonly measured cations and anions had served as rough proxies for pH in interpreting aerosol sensitivity to NH3 versus NOx emissions. Vasilakos et al. (Citation2018) highlighted the need to accurately represent emissions and size distribution of nonvolatile cations in CTMs to accurately model aerosol acidity and corresponding NH3 and NO3− partitioning.
Several studies have used measurements along with thermodynamic calculations to examine the regimes in which particulate concentrations are most sensitive to NH3. Guo et al. (Citation2018) used ISORROPIA II along with measurements of HNO3, NH3 and inorganic aerosol ions and found that decreases in total NH3 would be effective at decreasing aerosol mass for aerosols observed aloft in the northeastern U.S. in winter (mean pH = 0.8, ε(NO3−) = 37%) and for aerosol in Pasadena, CA in summer (mean pH = 1.9; ε(NO3−) = 39%). Decreasing NH3 was not effective in decreasing PM2.5 at Centreville, AL in summer (pH = 0.9; ε(NO3−) = 22%) because NO3− only contributed 4% to the inorganic aerosol. Extending this work by considering the role of liquid water content (LWC), Nenes et al. (Citation2020) found that the Centreville data set, with low pH and moderate LWC, fell into the NH3-sensitive domain. With low pH and a wide range of LWC, the data for the northeastern U.S. winter aircraft campaign fell into either the NH3-sensitive or the domain sensitive to both HNO3 and NH3, whereas the Pasadena data, with a wide range of LWC and somewhat higher pH, were scattered across the sensitivity domains. Using measurements of aerosol composition and gas-phase precursors from networks across the U.S., Pan et al. (Citation2024) found that PM2.5 has become less sensitive to NH3 in rural areas in the 2011 – 2020 timeframe, though decreases in NH3 are still effective (even in rural areas) in the Northeast (generally) and in the Northeast, Midwest, and Southeast in winter.
The nonlinear response of N and S deposition to changes in NH3, NOx, SO2 emissions is also important for understanding ecosystem impacts of emissions control policies. Tan, Fu, and Seinfeld (Citation2020) found a sub-linear response of NHx deposition to decreases in NH3 emissions in the U.S., in the context of decreasing SO2 and NOx emissions (i.e., 60–80% responses per unit reduction of NH3 emissions), in contrast to the linear response of oxidized N deposition to decreases in NOx emissions. Pan et al. (Citation2024) posited that decreases in SO2 and NOx emissions in the U.S. from 2011–2020 have increased the fraction of NHx remaining in the gas-phase, thus shifting deposition patterns closer to sources. Bidirectional exchange may buffer the response of NH3 dry deposition to NH3 emissions for small decreases (<30%). Paulot, Jacob, and Henze (Citation2013) found negative sensitivities of N deposition in Rocky Mountain National Park to emissions of NOx and isoprene in the summertime, opposite in sign to sensitivities with respect to NH3 and SO2 emissions, albeit considerably smaller. In other cases, chemical interactions across species may lead to undesirable consequences; one study suggested that while decreases in NH3 emissions in China would be an effective means of reducing PM2.5 exposure, a consequence would be increased acid rain (Liu et al. Citation2019).
Monitoring, mapping, and inventorying ammonia & ammonium
Surface concentration and deposition networks
In situ measurements of NH3 and NHx in the U.S. consist of several key networks that measure gas-phase NH3, particulate NHx, and NHx wet deposition. There are additional NH3 measurements available from smaller regional networks over limited periods, as well as those collected by individual research groups or field campaigns, including mobile and aircraft-based measurements.
Ambient surface-level NH3 concentrations in the U.S. are routinely measured by the Ammonia Monitoring Network (AMoN) of the National Atmospheric Deposition Program (NADP), which was initiated in 2007. Currently consisting of more than 100 sites, AMoN reports two-week integrated measurements based on phosphoric acid passive samplers (Puchalski et al. Citation2011). Wang et al. (Citation2023) describe limitations of the coverage of the network: multiple states have no monitors, only a dozen sites are close to elevated NH3 emission sources, and only a subset of these sites is available for deriving long-term trends, which thus may not be representative of broader domestic trends (Butler et al. Citation2016; Yao and Zhang Citation2019). Remote sensing may provide a means of gap-filling these data (Wang et al. Citation2023) as well as providing guidance on siting of additional monitors in regions of high emissions where there are monitoring gaps (Puchalski et al. Citation2019). Local passive measurement programs such as those in Colorado (Li et al. Citation2017) or Carolina (Pinder et al. Citation2011) provide valuable characterization of concentration gradients and patterns across different regions and land-types (Puchalski et al. Citation2019).
The Clean Air Status and Trends Network (CASTNET) and Chemical Speciation Network (CSN) both include measurements of particulate NH4+. The Interagency Monitoring of Protected Visual Environments (IMPROVE) reports NH4+ based on assumed neutralization of measured sulfate and NO3−. CASTNET and CSN measurements are biased low due to dissociation of NH4+ from the filters (Yu et al. Citation2006). Puchalski et al. (Citation2019) discuss the value of acid-impregnated filters for particulate NH4+ measurement (Chen et al. Citation2014), the benefits of their deployment in rural and urban areas, and how increased co-deployment of NH4+ alongside NH3 measurements could provide more comprehensive understanding of NHx budgets. Increased urban monitoring of NH3 and NH4+ is particularly valuable for understanding impacts of atmospheric N deposition on urban water quality and the importance of transportation emissions (Walker et al. Citation2019).
High time resolution measurements of NH3 have also been conducted from multiple platforms. The Southeastern Aerosol Research and Characterization (SEARCH) network collected hourly measurements of NH3 at eight sites throughout the southeast U.S. These measurements have been used to improve model representation of diurnal patterns in NH3 emissions from livestock and understand the representativeness of remote sensing observations that occur once or twice daily (Zhu et al. Citation2015b). Continuous observations of NH3 are possible using measurement techniques such as cavity ring down, ion mobility, and quantum cascade laser spectroscopy, and chemical-ionization and proton-transfer-reaction-time-of-flight mass spectrometry (von Brobrutzki et al. Citation2010). Measurements of NH3 using mobile open-path sensors (Tao et al. Citation2015) have been instrumental in identifying low-biases in estimates of NH3 emissions from transportation sources (Sun et al. Citation2017), while aircraft-based measurements have been used to constrain transportation, biomass burning, and agricultural emissions (Nowak et al. Citation2012; Tomsche et al. Citation2023).
Lastly, a critical part of understanding budgets of reduced N is measurements of NHx deposition. In the U.S., weekly wet deposition measurements have been made since 1978 by the NADP National Trends Network (NTN). Despite their importance in evaluating large-scale trends in wet deposition and acid rain, Benish et al. (Citation2022) highlight some limitations of NTN measurements, including lack of sites in complex terrain, urban centers, high elevations, and forest ecosystems. An additional drawback of NTN measurements is lack of detection of organic N species, which may contribute 15–25% of total Nr budget (Jickells et al. Citation2013; Sun, Fu, and Huang Citation2016). Overall, more widespread measurements of NH3 fluxes from a variety of natural and managed ecosystems are needed for developing empirical budgets and evaluating air quality modeling (Walker et al. Citation2019).
Satellite remote sensing
Over the past 16 years, satellite remote sensing observations have provided measurements of NH3 multiple times per day throughout much of the globe (see Supporting Information, Satellite remote sensing of ammonia). A benefit of satellite data is broad spatiotemporal coverage for helping to determine how levels are driven by emissions, climate, and evolving concentrations of interacting species (i.e., NOx and NH3). For example, a comparison between North American NH3 emissions inventories, simulated surface NH3 concentrations from a global model (GEM-MACH), and surface NH3 concentrations retrieved from the Cross-track Infrared Sounder (CrIS, described below) is shown in . This comparison highlights the spatial coverage of the satellite measurements and correlation with known emission hotspots, as well as discrepancies between measured and simulated NH3 distributions. On a more local scale, average summer surface NH3 concentrations from CrIS retrievals overlaid with in situ measurements (circles) collected by the USDA-ARS Northwest Irrigation and Soils Research Laboratory (left) is compared to the number of dairies per square km (right) in the Magic Valley, Idaho in .
Figure 12. Mean North American agriculture ammonia (a) emissions used by GEM-MACH, (b) mean surface NH3 concentrations for July and August 2016, modeled by GEM-MACH, and (c) corresponding CrIS NH3 surface concentrations. From Shephard et al. (Citation2020).
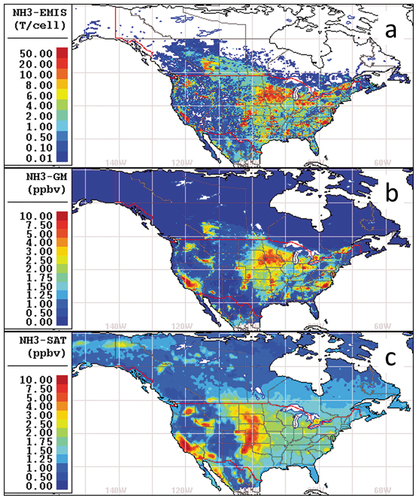
Figure 13. CrIS surface NH3 data from the May–October period oversampled onto a 0.002° grid for 2019 (a) and number of dairies per square kilometer (b). Surface NH3 concentrations from measurements at several locations throughout the valley are overlaid in (a). From Cady-Pereira et al. (Citation2024).
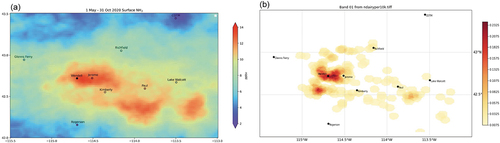
Ammonia absorbs radiation that can be detected in the 600–1200 cm−1 (thermal IR) wave number range, peaking at 960–970 cm−1, and thus multiple space-born spectrometers (sounders) have retrieved NH3 data. An overview of past and current remote sensing capabilities for NH3 is provided in the Supporting Information. Since the first detection of NH3 from space by Beer et al. (Citation2008), remote sensing data has been evaluated using in situ measurements, aircraft data, and ground-based spectrometers. Several polar-orbiting satellite-based instruments provide measurements twice per day throughout the globe (CrIS, AIRS, IASI, GOSAT). The GIIRS instrument aboard the FY-4A and FY-4B geostationary satellites (Clarisse et al. Citation2021; Zeng et al. Citation2023) has provided the first hourly observations of NH3 from space, over East Asia, and future NOAA satellite missions may include geostationary observations of NH3 over North America.
An important consideration when using NH3 remote sensing measurements is that retrieved NH3 concentrations are not direct observations of emissions nor even surface NH3 concentrations. While the detection limit of sounders such as CrIS can be as low as ~ 1 ppb near the surface, satellites are most sensitive to NH3 concentrations at 700–900 hPa. Their NH3 retrieved products can reflect variations in surface NH3 concentrations under certain atmospheric conditions (high thermal contrast, large concentrations), however the extent to which surface concentrations govern the total air column NH3 retrieval is variable. Assumptions about the shape of the NH3 vertical profile can strongly impact retrieved NH3 concentrations. This constraint limits direct comparison of retrieved NH3 concentrations to model values as only qualitative, which was recognized in modeling studies examining NH3 concentrations using retrievals from IASI (e.g., Heald et al. Citation2012; Schiferl et al. Citation2016). Further, while distributions of NH3 columns can be used to identify NH3 hotspots and even source types, they cannot be directly, accurately, and quantitatively linked to magnitudes of NH3 emissions without making some approximations regarding the role of prior information in the retrieval, or the role of non-local emissions impacting column NH3 concentrations, which have been shown to be considerable (Turner et al. Citation2012). Thus, the most advanced and accurate approaches for constraining NH3 emissions from satellite observations employ CTMs and assimilation schemes that account for transport (such as 4D-Var).
To address this challenge, retrievals for many of the remote sensing instruments (CrIS, AIRS, GIIRS) are performed using an optimal estimation technique (Rodgers Citation2000) wherein the influence of the assumed vertical air profile and the retrieval errors are quantified as part of the retrieval algorithm and supplied along with the data. This approach allows one to formally make quantitative comparisons between NH3 remote sensing observations and modeled NH3 concentrations, which is a critical aspect of developing top-down constraints on NH3 emissions. Specifically, comparison of model estimated concentrations of NH3 to satellite retrievals is done via application of the following formula for the observational operator, H,
where c is the model estimated NH3 profile or a measured profile from a different platform (e.g., aircraft), M is a matrix that maps these values to the retrieval units and vertical levels, ca is the a priori NH3 profile used for the retrieval, and A is the averaging kernel matrix that quantifies the sensitivity of the retrieved concentration to the true state. By comparing NH3 profiles to mapped model estimates, H(c), rather than the native model NH3 profile, c, the contribution of error in ca to the model error covariance matrix, B, cancels (Rodgers Citation2000). Further, the role of the assumed vertical profile (ca) is minimized. This consideration is particularly important, as NH3 retrievals typically have less than one degree of freedom (DOF), meaning the shape of the vertical profile is largely governed by ca. A comparison of NH3 profile retrievals with aircraft NH3 measurements with and without properly accounting for the satellite observation operator is shown in , underscoring the importance of the satellite observation operator for quantitative use of NH3 remote sensing data. Without it, one might erroneously conclude from comparison to aircraft data that the satellite retrievals have a low bias at the surface of ~ 40 ppb, while application of the observation operator shows the retrievals to be unbiased at the surface.
Figure 14. Air column ammonia profiles compared to aircraft data obtained during DISCOVER-AQ California campaign in the winter of 2013. Left (blue): direct comparison. Right (red): comparison with satellite observation operator (H) applied to aircraft data. Adapted from Cady-Pereira et al. (Citation2024).
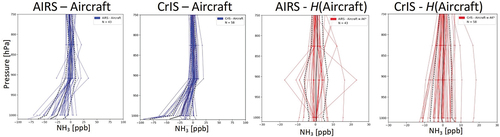
While NH3 retrievals are widely available from multiple instruments, their lack of harmonization has hindered application, especially related to long-term trends. While there are chemical data assimilation systems in the U.S. and abroad operationally run by government agencies to generate constraints on trace-gas composition, none of the operational versions of these systems currently use satellite NH3 observations, nor do they include the representation of NH3 bidirectional exchange necessary for such efforts to improve NH3 source estimates. Further development of satellite-based NH3 measurements would be valuable for extrapolating limited surface measurements and use in measurement-model fusion methods for mapping deposition and CLs assessments (Walker et al. Citation2019). Lastly, for comparison to oxidized N, NO2 remote sensing products are more mature, provide more direct constraints on surface-level NO2 and hence NOx emissions, and NOy deposition has been derived from space (Geddes and Martin Citation2017). However, there has been little effort spent on combining observations of both reduced and oxidized Nr, or for using these measurements to assess total Nr deposition, despite community requests for such data (Walker et al. Citation2019).
Inverse modeling and top-down estimates
As described previously, NH3 emissions estimates are uncertain at a variety of spatial and temporal scales, often by more than 100% for regional emissions at monthly time scales. This stems from the difficulty of building bottom-up inventories, coupled with a sparsity of in situ measurements, especially outside of the U.S., Europe, and China. This limitation has left considerable room for improvements in NH3 inventories using inverse modeling (i.e., top-down) constraints. Historically, the seasonality of NH3 emissions in the U.S. National Emissions Inventory has been constrained through inverse modeling using wet deposition measurements of NH4+ and results of CMAQ simulations (Gilliland et al. Citation2003, Citation2006). By comparing simulated with observed deposition values, monthly scaling factors for emissions of NH3 in the eastern and western US were incorporated into the EPA NEI. Zhang et al. (Citation2012) developed monthly correction factors for NH3 emissions throughout the U.S. domain through fits to the seasonality of surface NHx aerosol measurements in the Midwest (RPO) and Southeast (SEARCH).
These studies assumed spatially uniform biases in the prior emissions, to simplify the computational expense of solving the inverse problem to adjust emissions. The computational crux of source inversions is relating changes in modeled concentrations (c) to changes in emissions, (E)(i.e., calculating the model Jacobian, ∂c/∂E). Variations in top-down methods stem from different ways of calculating, or approximating, this Jacobian. One method is to use simulations based on perturbations of the forward model’s emissions, one at a time. When n different emissions are considered, n + 1 forward model simulations need to be conducted. Given the computational expense of any single simulation, the number of emissions considered is typically small (100 or less).
Another inverse modeling approach uses the CTM adjoint to calculate sensitivities with respect to each individual emissions time, location, and sector with the model. Results from inverse models using this approach, called four dimension variational (4D-Var), adjust emissions independently in each model grid cell, and in time. For example, Henze, Seinfeld, and Shindell (Citation2009) performed the first NH3 inverse modeling study to correct for grid-scale biases in emissions using speciated PM2.5 measurements and the GEOS-Chem adjoint model. The same 4D-Var inverse modeling framework has been used to constrain NH3 emissions using measurements of wet deposition in several regions of the globe (Paulot et al. Citation2014), with PM2.5 measurements in China (Zhang et al. Citation2016), and with aerosol optical depth (AOD) measurements in East Asia (Xu et al. Citation2013). The information embedded within a Jacobian can also be estimated using ensemble techniques. An ensemble Kalman filter was used to constrain NH3 emissions in China through assimilation of surface NH3 monitoring data (Kong et al. Citation2019). Nevertheless, the ability to constrain NH3 emissions using these techniques has been limited by the scarcity of surface NH3 measurements, uncertainties in model treatment of wet deposition (which can bias the inversion), and consistent and correct treatment of aerosol microphysics in both the model and retrieval algorithm for AOD constraints (itself an ongoing research challenge). Paulot et al. (Citation2014) shows ( therein) how top-down and bottom-up estimates from a variety of studies still range considerably (more than a factor of two) even when estimating total U.S. NH3 emissions, or the month in which emissions peak.
The availability of NH3 remote sensing measurements has greatly improved the ability to develop top-down constraints on emissions. Zhu et al. (Citation2013) performed the first 4D-Var constraints on U.S. NH3 emissions using satellite NH3 measurements (from TES). Cao et al. (Citation2020) followed on this work by using the more accurate, and much denser observations of NH3 from CrIS. They found that annual national NH3 emissions were broadly underestimated in the NEI by 33%, The largest underestimations were for agricultural emissions, particularly springtime fertilizer and livestock sources over the central U.S. However, there were considerable spatial variabilities in the emissions biases, with overestimates identified in warm months in the Central Valley, southern Minnesota, northern Iowa, and southeastern North Carolina. In subsequent work, Cao et al. (Citation2022) used the 4D-Var method to constrain NH3 emissions in Europe, therein for the first time explicitly accounting for bidirectional NH3 exchange within the inversion. Sitwell et al. (Citation2022) have implemented an ensemble-variational inversion system for estimating NH3 emissions from CrIS with GEM-MACH, a global CTM. Over North America they found the prior emissions were biased low by 11–41%.
Another approach to estimating the Jacobian for an inverse model is to restrict the computed relationship between emissions and concentrations to that within a single model column. This simplification is the basis of so-called “mass-balance” methods, which were first developed for top-down constraints on NOx emissions using satellite NO2 data (Lamsal et al. Citation2011). For NH3, Li et al. (Citation2019) applied the iterative mass balance (IMB) approach to NH3 pseudo inversions using pseudo IASI data, and quantified the errors in this approach as well as those for 4D-Var inversion. While the IMB approach was considerably more computationally efficient, the 4D-Var approach was better able to capture the impact of transport and chemistry on NH3 lifetime. The merits of each approach (speed versus accuracy) have led to formulation of hybrid inversions, with IMB used to readily generate reasonable initial guesses, followed by refinement with 4D-Var. Applied to NH3 from IASI, Chen et al. (Citation2021) also found that U.S. NH3 emissions were broadly underestimated (35% in April, 18% in July, and 10% in October), with the most significant spatial variability in over- and underestimates in springtime. Hybrid methods combining mass balance and local ensemble transform Kalman filter (LETKF) have also been used to refine NH3 emissions in Europe using CrIS NH3 (van der Graaf et al. Citation2022). Mass balance methods have also been used to estimate hourly NH3 emissions in China with the geostationary NH3 observations from FY-4A (Liu et al. Citation2022).
Ignoring any explicit modeling of transport between emissions and concentrations, one can directly estimate NH3 from isolated sources (such as point sources from industrial facilities, or the emissions from an entire urban area) by assuming a value for the atmospheric lifetime of NH3 from the literature. Van Damme et al. (Citation2018) used measurements from IASI to quantify NH3 emissions hotspots world-wide. Whitburn et al. (Citation2015) used this approach with IASI observations to estimate large-scale biomass burning NH3 emissions; Adams et al. (Citation2019) did so for a single biomass burning event. Dammers et al. (Citation2019) estimated NH3 emissions from 249-point sources around the globe using observations from CrIS, finding top-down values that were 2–3 times larger than the prior emissions inventory (HTAPv2). The NH3 lifetime can also be derived from model simulations (Cao et al. Citation2022; Evangeliou et al. Citation2021). Evangeliou et al. (Citation2021) also found bottom-up emissions (McDuffie et al. Citation2020) to be underestimated globally by a factor of three. However, Luo et al. (Citation2022) showed how the role of transport can be approximately considered resulting in satellite-based emissions that are only 30% higher than bottom-up inventories globally. Cao et al. (Citation2022) used simultaneous observations of NO2 from the TROPospheric Monitoring Instrument (TROPOMI) and NH3 from CrIS during the COVID-19 lockdown over Los Angeles to identify, for the first time from space, emissions of NH3 from vehicles. Directionally consistent with in situ studies (Berner and David Felix Citation2020; Fenn et al. Citation2018; Sun et al. Citation2017), they found inventories of vehicle NH3 emissions to be underestimated by a factor of 2–5 compared to state and national inventories. They were also able to show that vehicles are the dominant source of NH3 in the Los Angeles urban area. Recent updates to U. S. EPA vehicle NH3 emissions based on roadside measurements (U.S. EPA 2023f) are broadly consistent with these assessments, finding an increase in onroad NH3 by roughly a factor of two (Toro et al. Citation2024).
Ammonia management
Overview
The U.S. lacks an integrated management approach to the multimedia environmental problems that are the result of N pollution. Managing air emissions and water discharges is complicated by the number, dispersed nature, and heterogeneity of sources, particularly those in the agricultural sector. The atmospheric and ecological impacts of NHx also differ with resource, timing, and location, complicating policy design and implementation. Further, in the U.S., agricultural sources of air and water pollution are treated differently from sources in other sectors. Although the Clean Air Act does not expressly exempt agricultural sources, policy decisions made by the U.S. EPA in its implementation have left NH3 emissions largely unregulated (Copeland Citation2014; U.S. EPA-SAB Citation2011). In the U.S., federal efforts to conserve natural resources and abate a range of environmental externalities from agriculture have largely focused on research, education, training, and cost-sharing programs administered by the U.S. Department of Agriculture (USDA). In contrast to the U.S., the European Union has comprehensive regulations to control NH3 emissions from the agricultural sector, motor vehicles, and industrial facilities. Regulations applied to agricultural emissions of NH3 have been politically controversial in some European countries. Nevertheless, many European countries have achieved significant decreases in NH3 emissions over the past two decades.
U.S. incentive programs to decrease ammonia emissions from agriculture
The USDA currently administers about two dozen incentive programs covering a broad range of environmental concerns, supporting cropland retirement as well as changes in operating practices on working lands. The Environmental Quality Incentives Program (EQIP) (7 CFR Part 1466) administered by the Natural Resource Conservation Service (NRCS) is the main working lands program with potential to address NH3 emissions. EQIP provides cost-share grants to eligible farmers and ranchers for investment in equipment and management practices to mitigate air and water pollution and/or improve soil, water, and wildlife conservation. A total of $1.2 billion was obligated for EQIP projects in 2022 (USDA Citation2023). The 2022 Inflation Reduction Act increased funding for USDA conservation programs, with $8.45 billion authorized for EQIP from FY 2023 through FY 2026 (USDA Citation2023).
Congress and the USDA establish national priorities for the EQIP program, with additional priorities established by local conservation districts. Air quality is among the national priorities (7 CFR §1466.4) with “Emissions of Airborne Reactive Nitrogen” specifically listed as a resource concern (NRCS Citation2023a). NRCS Conservation Practice Standard (CPS) 590 covers nutrient management for croplands, including decreasing fertilizer application rates, use of nitrification inhibitors and slow-release fertilizers, and replacing synthetic fertilizer with livestock manure (NRCS Citation2023b). NRCS also has conservation practice standards for livestock operations that include air filtration and scrubbing (CPS 371), anaerobic digestion (CPS 366), feed management (CPS 592), waste storage facilities (CPS 313) and waste treatment (CPS 629). To qualify for financial assistance, confined livestock feeding operations are required to assess NH3 and other emissions using the National Air Quality Site Assessment Tool as part of a conservation plan (NRCS Citation2023c).
Collaborative efforts to decrease nitrogen deposition to protected ecosystems
Federal, state, and private entities across the U.S. have long engaged in collaborative partnerships to conserve and protect valued areas. The Rocky Mountain National Park (RMNP) Air Quality Initiative provides an example of one such program that is specifically targeted at mitigating N pollution. The RMNP Initiative started in 2005 with a memorandum of understanding (MOU) between the Colorado Department of Public Health and Environment, the U.S. EPA, and the NPS in response to scientific evidence that CLs of N were exceeded at the park (Colorado Department of Public Health and Environment CDPHE and U.S. EPA Citation2005). In 2007 the agencies established a target load for wet N deposition on the east side of RMNP of 1.5 kg N ha−1 yr−1 based on N CLs for a variety of ecological endpoints, with the target to be achieved by 2032 (Colorado Department of Public Health and Environment and U.S. EPA [CDPHE] Citation2007). The 2007 plan identified several regulatory options for decreasing NOx emissions and focused on voluntary agricultural BMPs for decreasing NH3 emissions.
Field studies and associated modeling efforts conducted in 2006 and subsequent years informed understanding of N partitioning, source sectors and regions, and atmospheric transport patterns (Beem et al. Citation2010; Gebhart et al. Citation2011; Thompson et al. Citation2015). A key insight from these studies was the significance of synoptic scale upslope precipitation events in delivering N to RMNP from northeastern Colorado. The RMNP Initiative’s agriculture subcommittee used that finding in developing an early warning system to alert agricultural producers of impending upslope events, so they could temporarily mitigate NH3 emissions (Pina et al. Citation2019). Colorado State University and Texas A&M University researchers and other collaborators have provided guidance on both temporary and longer-term practices tailored to local agricultural operations (Brandani et al. Citation2023; Lupis, Embertson, and Davis Citation2010).
Annual inorganic wet N deposition on the east side of RMNP has remained approximately stable since the MOU was signed in 2005 (). Data and analysis by the RMNP MOU partners indicate that NO3− concentrations in wet deposition have modestly declined, while NH4+ concentrations have increased (McCarthy and Cheatham Citation2022). In the future, further decreases in NOx emissions are expected due to ongoing regulations, while the prospects for mitigating NH3 emissions remain uncertain (Pina et al. Citation2019).
Figure 15. Wet deposition of nitrogen and precipitation quantity at the Loch Vale monitoring site in Rocky Mountain National Park, Colorado compared to the 2032 resource management target of 1.5 kg N ha−1 yr−1. Source: (Morris Citation2024).
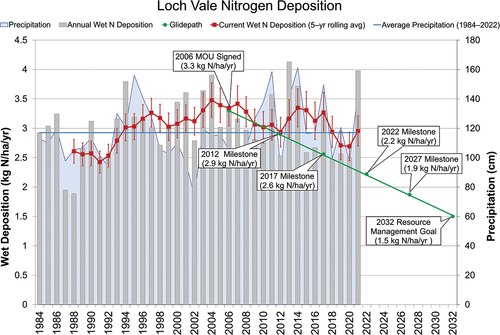
Addressing reduced nitrogen under the U.S. Clean Water Act
The Clean Water Act (CWA, 33 U.S.C. §1251 et seq.) provides a multi-part framework for water quality management including a permit and technology-based effluent limit system for discharges from point sources; funding and regulations for municipal sewer systems and wastewater treatment plants; water quality standards for surface waters; and the TMDL system for addressing impairment that remains after effluent limits have been imposed.
The National Pollutant Discharge Elimination System (NPDES) (33 U.S.C. §1342) requires point sources, including industrial facilities, wastewater treatment plants, and municipal and industrial stormwater systems to hold permits to discharge pollution to surface water. Concentrated animal feeding operations (CAFOs) are deemed to be point sources, while agricultural stormwater discharges and return flows from irrigated agriculture are excluded (33 U.S.C. §1362(14)). Federal regulations require permitted CAFO operators to develop and implement nutrient management plans, including manure, litter, and wastewater management practices as applicable (40 CFR Part 412). The federal regulations do not directly address air emissions of NH3 nor other pollutants that affect water quality through atmospheric deposition, but some states have done so (e.g., Minn. R.7020.0505 Subpart 4). Limited information on CAFO operations and limited enforcement resources pose challenges to ensuring the NPDES program is effective in decreasing N pollution (Tomich et al. Citation2016). The U.S. EPA has set discharge standards for municipal wastewater treatment facilities that require secondary treatment, limiting biochemical oxygen demand, total suspended solids, and pH (40 CFR Part 133) but has not set standards for nutrient discharges. Only a small fraction of sewage treatment facilities include numeric effluent limits for N in their NPDES permits (U.S. EPA Citation2023d).
TMDLs are essentially mass loadings allocating the maximum amount of a pollutant a waterbody can receive without violating water quality standards, together with a plan for implementing necessary controls. To the extent that atmospheric deposition contributes to water quality impairment, states should account for these inputs in the TMDLs they develop. Chesapeake Bay, Long Island Sound, Tampa Bay, FL, Waquoit Bay, MA and the Neuse River, NC are some of the surface water bodies impaired by excess N where atmospheric deposition is recognized as a substantial contributor to N loads. The TMDLs for these water bodies differ in whether atmospheric deposition is targeted for controls or is passively tracked (Lebo, Paerl, and Peierls Citation2012; Poor, Cross, and Dennis Citation2013; U.S. EPA Citation2010; Valiela et al. Citation2016).
Addressing ammonia emissions under the U.S. Clean Air Act
The Clean Air Act (CAA, 42 U.S.C. §§7401–7671q) provides several avenues for the U.S. EPA to address NH3 emissions, but to date these authorities have only been applied to a limited extent. First, the U.S. EPA sets National Ambient Air Quality Standards (NAAQS) for criteria pollutants and promulgates requirements for states and participating tribes to develop implementation plans to come into compliance with the standards. The U.S. EPA has not listed NH3 as a criteria pollutant, although it has been petitioned to do so (Environmental Integrity Project [EIP] Citation2011). U.S. EPA regulations address NH3 as a precursor to PM2.5 in some circumstances. The U.S. EPA has not issued performance standards for stationary sources of NH3 such as fertilizer plants or feedlots, but some states have done so. Stationary source permits commonly include requirements to limit NH3 slip from selective catalytic reduction equipment installed to decrease NOx emissions. The U.S. EPA has also elected not to regulate NH3 emissions from motor vehicles and engines. The Agency has recognized the contribution of NH3 emissions to regional haze but recommends that states focus on decreasing SO2 and NOx emissions to address haze in national parks and wilderness areas. In September 2023, the Clean Air Scientific Advisory Committee (CASAC), the expert panel chartered to review the science and policy assessments that inform NAAQS decisions, recommended the Agency further consider the role of NH3 in contributing to welfare and ecological effects of PM and N deposition, and consider setting deposition-based secondary standards (Sheppard Citation2023).
New source performance standards
CAA Section 111 requires the U.S. EPA to identify categories of stationary sources that “cause[] or contribute[] significantly to, air pollution which may reasonably be anticipated to endanger public health or welfare” (42 U.S.C. §7411(b)(1)(A)) and then set performance standards to limit their emissions. To date, the U.S. EPA has not issued performance standards targeting NH3, either for industrial sources such as fertilizer plants or agricultural sources such as confined animal feedlots (U.S. EPA Citation2023c). In December 2017, the U.S. EPA denied a petition to list CAFOs as a source category under Section 111 and set corresponding performance standards for NH3 and other air pollutants (82 Fed. Reg. 60940, Dec. 26, 2017). In contrast, some states or local air districts have air pollution regulations that address NH3 and other emissions from animal feeding operations (e.g., South Coast Air Quality Management District Rule 1127; San Joaquin Valley Air Quality Management District Rule 4570; and Idaho Administrative Procedures Act 58.01.01 §§ 760–764).
Ammonia as a PM precursor for New Source Review
The Clean Air Act generally requires that major stationary sources of regulated pollutants hold construction and operating permits that include enforceable emissions limits. New Source Review (NSR) construction permit requirements generally apply to prospective new or modified sources of criteria pollutants and their precursors, among other pollutants. U.S. EPA regulations exclude NH3 from NSR requirements in Prevention of Significant Deterioration (PSD) areas where the NAAQS are met (40 C.F.R. § 51.166(b)(49)(i)). For PM2.5 nonattainment areas, NH3, volatile organic compounds, SO2, and NOx are listed as precursors to PM2.5 and hence subject to NSR unless the state has demonstrated that new or modified major stationary sources of these precursors would not significantly contribute to PM2.5 levels that exceed the standard (40 C.F.R. § 51.165(a)(13); 40 C.F.R. § 51.1006). The South Coast Air Quality Management District (SCAQMD Rule 1325), West Pinal County in Arizona (Ariz. Admin. Code §18-2-101), and Allegheny County in Pennsylvania (25 Pa Code § 121.1) are among the PM nonattainment areas where NSR rules currently cover NH3 as a PM2.5 precursor.
Ammonia as a PM precursor in state implementation plans
The status of NH3 as a precursor to PM also brings it into the ambit of requirements for states to adopt state implementation plans (SIPs) to meet and maintain compliance with the PM NAAQS (42 U.S.C. §7410). Areas failing to meet the PM NAAQS are required to address NH3 along with other precursors unless they can demonstrate it would not be effective to do so (40 C.F.R. §51.1006)). California’s South Coast Air Quality Management District is unusual in comprehensively addressing NH3 as a PM2.5 precursor in its SIP (South Coast Air Quality Management District SCAQMD Citation2020).
Considering ammonia under the regional haze program
In 1977, Congress set as a national goal the “prevention of any future, and the remedying of any existing, impairment of visibility in Class I areas which impairment results from manmade air pollution” (42 U.S.C. §7491(a)(1)). With guidance from the U.S. EPA, states are required to adopt implementation plans with emissions limits and other measures as needed to make “reasonable progress” toward meeting that goal by 2064. Progress is tracked for the 20% of days that are most impaired by anthropogenic emissions (). Visibility on the 20% of days that are least impaired is also tracked to ensure there is no degradation (40 CFR §51.308). States were required to submit their initial implementation plans under the regional haze program in December 2007. A second round of regional haze SIPs to address the ten-year period ending in 2028 were due in July 2021. Guidance from the U.S. EPA for the regional haze SIPs due in 2021 recognized that ammonium sulfate and ammonium nitrate contribute a substantial share of anthropogenically caused light extinction at many Class I areas on the most impaired days. However, in the guidance the U.S. EPA suggested that states focus on decreasing emissions of NOx and/or SO2 rather than NH3 (U.S. EPA Citation2019a).
The Animal Feeding Operations Consent Agreement
Most farming and ranching operations fall below the emissions thresholds that would subject them to Clean Air Act permit requirements (Copeland Citation2014). However, some large animal feeding operations (AFOs) may produce emissions of PM, VOCs, and NH3 above regulatory thresholds. Despite this potential, many large operations have been exempted from regulations by the 2005 Animal Feeding Operations Consent Agreement (70 Fed. Reg. 4958, Jan. 31, 2005). The agreement applies to egg, broiler chicken, turkey, dairy, and swine AFOs, but excludes open-air facilities such as cattle feedlots. AFOs that chose to participate would pay a civil penalty ranging from $200 to $1000 and contribute $2500 per facility to support the National Air Emissions Monitoring Study (NAEMS) that was intended to help decrease uncertainties in AFO emissions. In 2006, EPA approved 2568 of these agreements covering nearly 14,000 AFOs in 42 states (Office of Inspector General [OIG] Citation2017).
EPA expected to start finalizing emissions estimation methods in 2009, and that AFOs with sufficiently high emissions would apply for permits and install emissions controls by 2010 (OIG Citation2017). However, the effort to develop emissions estimation methods has been delayed more than a decade. EPA eventually published draft emissions estimation methods for NH3, hydrogen sulfide and PM emissions from swine barns and lagoons in 2020; poultry houses and manure sheds in 2021, and dairy barns and lagoons in 2022 (US EPA Citation2022a) but as of this writing has not finalized the drafts. In October 2021, two dozen groups petitioned EPA to rescind the AFO consent agreement and stop extending the enforcement immunity (Animal Legal Defense Fund & groups ALDF Citation2021).
Addressing ammonia from engines and mobile sources
Light duty gasoline vehicles emit NH3 due to reduction of NO to NH3 in three-way catalytic converters operating under fuel-rich conditions, with higher emissions in older (catalyst-equipped) vehicles (Bishop and Stedman Citation2015; Kean et al. Citation2009). For heavy duty diesel vehicles, NH3 emissions increased sharply after the 2010 model year, with the introduction of selective catalytic reduction (SCR) devices that are effective in decreasing NOx emissions but can be susceptible to NH3 “slip” from overdosing urea in the SCR system (Preble, Harley, and Kirchstetter Citation2019). Neither the U.S. EPA nor California has established standards for motor vehicle emissions of NH3, although the U.S. EPA’s Office of Transportation and Air Quality includes NH3 emissions in its mobile source emissions models (U.S. EPA Citation2023b).
Ammonia emissions regulation in the Europe Union
The European Union announced the European Green Deal in November 2019 (European Commission Citation2019) establishing the vision of a “toxic-free” environment by 2050 with interim targets to be met by 2030. The interim targets include decreasing the number of premature deaths caused by air pollution by 55% and decreasing the area of ecosystems where air pollution threatens biodiversity by 25%, both relative to 2005 levels (European Commission Citation2021). The framework for achieving the European Green Deal includes revised ambient air quality standards; regulations limiting emissions from specific categories of sources (e.g., motor vehicles and industrial facilities); and national emission reduction commitments for transboundary air pollutants. Implementation of the corresponding directives is the responsibility of the EU member states.
The EU currently has ambient air quality standards for twelve pollutants, not including NH3 (European Commission Citation2023). The current standard (i.e., limit value) for PM2.5 is 20 μg m−3 on an annual basis. On September 13, 2023, the European Parliament adopted amendments to a European Commission proposal to revise the annual PM2.5 limit value to 10 μg m−3 and add a daily limit value of 25 μg m−3 (allowing 18 exceedances per year), to be met by 2030. The 24-hour and annual limit values would subsequently be lowered to 15 μg m−3 and 5 μg m−3, respectively, to be met by 2035 (European Parliament Citation2023b). The proposal is currently under consideration by the European Council. The proposal adds new requirements for monitoring NH3 at rural and urban background “supersites” but does not propose any ambient standards for NH3.
The EU’s National Emission Reduction Commitments trace back to the 1999 Gothenburg Protocol of the 1979 Convention on Long-Range Transboundary Air Pollution (LRTAP) (Aneja, Schlesinger, and Erisman Citation2008; Moldanova et al. Citation2011; UNECE Citation1999). This international agreement set emissions ceilings for European countries on SO2, NOx, VOCs and NH3 to decrease acidification and eutrophication effects of atmospheric deposition and effects of ozone on vegetation and human health (UNECE Citation1999). The emission ceilings were derived from CLs for acidification and eutrophication (N) and for critical concentration levels for ozone. The Protocol was amended in 2012, updating emission ceilings and decreasing targets and adding PM2.5 to the list of covered pollutants (United Nations Economic Commission for Europe [UNECE] Citation2012). Critical Loads of N for Europe are periodically updated under the LRTAP Convention, most recently in 2022 (Bobbink, Loran, and Tomassen Citation2022).
For EU countries, the most recent version of the National Emission Reduction Commitments Directive was adopted by the European Parliament in December 2016 (European Parliament Citation2016). In this directive requirements for percentage decreases in emissions are tailored for each member state for PM2.5, NOx, NMVOC, SO2, and NH3. Overall, for the EU countries, 6% decreases in NH3 emissions from 2005 levels are projected for the 2020–2029 period with 19% decreases for 2030 and beyond (European Parliament Citation2016). The status report released in August 2023 indicates that across the EU, NH3 emissions declined by 13% between 2005 and 2021 (European Environment Agency [EEA] Citation2023). In 2021, sixteen of 26 member states met their 2020–2029 commitments for NH3 (EEA Citation2023).
The Industrial Emissions Directive (IED) (European Parliament Citation2010) is the main EU instrument regulating emissions from industrial facilities to air, water, and soil. The Directive covers more than 52,000 installations, including about 20,000 intensive livestock feeding operations. The list of covered categories of activities includes production of NH3 and N-based fertilizers and intensive rearing of poultry and pigs (European Parliament Citation2010 Annex I). Covered substances include NOx and other N compounds emitted to air and substances that contribute to eutrophication discharged to water (European Parliament Citation2010 Annex II). The IED requires covered facilities to obtain and operate in compliance with an environmental permit, with emissions and discharge limits based on “Best Available Techniques.” The Directive requires member states to conduct inspections and requires emissions reporting through the European Pollutant Release and Transfer Register. In April 2022, the EC proposed to revise the IED, including by lowering size thresholds for poultry and pig farms and adding large cattle feedlots, to help decrease NH3 and methane emissions (European Commission Citation2022b). The proposal is currently under negotiation between the European Commission, Council, and Parliament, after the latter two entities voted to decrease the number of new livestock feeding operations that would be added (Store Citation2023; Zimmermann Citation2023).
The EU also restricts NH3 emissions from motor vehicles. The Euro VI standards that went into effect for model year 2013 for heavy duty gasoline and diesel vehicles limit the test cycle-average concentration of NH3 in vehicle exhaust to 10 ppm (European Commission Citation2011; Mendoza-Villafuerte et al. Citation2017). Although the Euro 6 standards for light duty vehicles do not restrict NH3 emissions, proposed Euro 7 standards would do so. The new standards would limit NH3 emissions from passenger cars and light trucks to 20 mg km−1, based on actual-driving emissions testing. The proposed Euro 7 standard for trucks and buses would change from a concentration limit to an emissions limit of 65 mg NH3 kWh−1 for both cold and hot conditions (European Commission Citation2022c). The technical study supporting the proposal states that system-wide optimization will be needed for internal combustion engine vehicles to meet the suite of new standards, likely including very tight control of oxygen and fuel/air mixtures for vehicles equipped with three-way catalysts, and NH3 slip catalysts for vehicles with selective catalytic reduction for NOx control (European Commission Citation2022a).
Conclusion and recommendations
In this summary of the critical review, we highlight research and management recommendations in italics.
Over the past century, humans have greatly altered the global N cycle through production and application of synthetic fertilizer, widespread cultivation of leguminous crops, dramatically increased livestock production, and emissions of NOx associated with fossil fuel combustion. Concerns about perturbation of the N cycle and environmental effects of NH3 emissions have been recognized for decades. Emissions of NOx in the U.S. and globally are now trending downward, due to government regulations, shifts in fuel use and technological advances. In contrast, emissions of NH3 have been and are projected to continue increasing in the U.S. and on the global scale. Livestock waste and synthetic fertilizer application dominate NH3 emissions, with motor vehicles contributing a significant share in many urban areas. These emissions are largely unregulated in the U.S. Voluntary programs and U.S. Department of Agriculture incentives have had limited impact in mitigating emissions.
Ammonia emissions have serious impacts on human health, visibility, climate, and ecosystems. Emissions of NH3 are estimated to contribute to hundreds of thousands of PM2.5-linked deaths per year globally, and more than ten thousand premature deaths per year in the U.S. Ammonium sulfate and nitrate comprise more than half of visibility-reducing haze on the most impaired days at most national parks and wilderness areas across the U.S. Ammonia emissions affect the climate system in complex ways. Nitrogen deposition generally increases plant biomass and soil carbon storage, but also increases susceptibility to wildfire. Excess N deposition increases soil emissions of N2O, a potent greenhouse gas. Atmospheric reactions with NH3 have decreased radiative forcing through production of reflecting inorganic aerosols and clouds but may increase formation of absorbing organic aerosols, while NH3 also contributes to new particle formation and thus climate impacts of aerosols through cloud interactions.
Nitrogen deposition has benefits for croplands and overall plant productivity but causes widespread harm to ecosystems. It reduces biodiversity and contributes to eutrophication of soil and fresh and coastal water bodies that can lead to toxin production, harmful algal blooms, and hypoxia. N deposition in the U.S. has shifted over the past two decades from mainly NOy to mainly NHx, with locations of highest deposition now found in agricultural regions of the Midwest rather than the more industrialized eastern part of the country.
Analysis conducted as part of this critical review shows that CLs for lichens are exceeded across much of their U.S. habitat. Critical loads for survival of sensitive tree species are exceeded across much of the eastern U.S. and in high elevation western forests; those for growth of sensitive tree species are exceeded in forests across the northern U.S. and in the Appalachian and Rocky Mountains. Critical loads for eutrophication risk are exceeded in a significant fraction of evaluated lakes in the northern and western U.S. Deposition of NHx rather than NOy accounts for most of this freshwater eutrophication risk. Excessive N inputs contribute to the impairment of coastal ecosystems across the U.S., causing eutrophication, toxic algal blooms, hypoxia, and loss of important habitat in severe cases. To mitigate these effects, it is essential to consider and control atmospheric deposition to the watershed as well as direct deposition to the waterbody, as atmospheric deposition is a significant source of N to major U.S. bays and estuaries.
Recent research has improved understanding of biogeochemical processing of N, including biomass and soil uptake and loss through leaching and atmospheric emissions. Investigations of ecosystem recovery as N deposition is declining in some areas show significant hysteresis between damage- and recovery paths, possibly associated with N accumulation in woody biomass and soil organic matter. Further research is needed to improve quantitative understanding of ecosystem response under decreases in N deposition, under increases in NHx deposition while NOy deposition is decreasing and of interactions between N deposition impacts and climate change. Studies conducted over the past decade have elucidated factors that control spatial variation of ecosystem sensitivity to N deposition, highlighting the role of soil pH as a critical variable. Future CL assessments can be refined by accounting for mediating factors, such as changing climate and air pollution, and soil conditions and developing locality-based CLs.
Ammonia plays a well-known role in forming secondary inorganic aerosols. However, the long-standing question of whether NH3, NOx or SO2 emissions limit SIA formation for specific locations remains of interest. Recent research has demonstrated the importance of aerosol pH and liquid water content in governing partitioning of NO3− and NHx between gas and particle phases. Chemistry and transport models are starting to explicitly simulate and evaluate performance for these aerosol properties. More research is needed on the site-specific role of NH3 in secondary inorganic aerosol concentrations and N deposition magnitude and trends in the context of changing SO2, NOx, and NH3 emissions. Key factors include the role of particle pH, liquid water, size, surface coatings and associated kinetic limitations to constituent uptake.
In addition to its contribution to secondary inorganic aerosol, studies have established the contribution of NH3 to particle nucleation and provided evidence of its role in promoting (or occasionally suppressing) secondary organic aerosol formation and growth. Overall, NH3 has been found to enhance SOA production over the conterminous U.S., but further studies are needed of the influence of NH3 on organic aerosol, both in terms of its mass concentrations and optical properties.
Gas-phase NH3 has a short atmospheric lifetime due to the parallel sinks of conversion to condensed NH4+ or direct deposition of NH3. In contrast, condensed phase NH4+ has a longer lifetime and potential for long-range transport. Modeling studies indicate that deposition of NHx in the U.S. is dominated by U.S. emissions, but interstate transport within the U.S. is significant. As SO2 and NOx emissions are decreasing, the fraction of NHx in the gas phase is increasing, causing a shift toward more local deposition and less long-range transport. Continued investigation of the spatial footprint of sources contributing to deposition at sensitive locations is needed as the chemical and climatic environment shifts. Dry deposition of NH3 gas is rarely measured but is estimated from air quality models for purposes of national assessments, so is relatively uncertain. Further efforts are needed to evaluate NH3 dry deposition estimates from air quality models used for research and regulatory applications.
Inverse modeling studies continue to show limitations in bottom up NH3 inventories, with a general bias toward underestimation. Further research is needed to reconcile bottom-up and top-down estimates and to improve mechanistic understanding of NH3 emissions (e.g., from bidirectional exchange) as well as estimates of the magnitude of emissions from specific sectors such as livestock production and motor vehicles. The increasing availability of satellite observations holds promise for greatly expanding atmospheric NH3 measurements, helping track trends, improve emissions estimates, and characterizing deposition. However, satellites do not directly observe surface concentrations, emissions or deposition, so chemistry and transport models, data assimilation and inverse modeling are critical tools for deriving relevant products. Harmonization of NH3 remote sensing records is needed to better understand long-term trends in ambient concentrations and, hopefully, sources and sinks. Continued research is needed to advance top-down emissions estimation approaches using inverse modeling as more satellite data become available, including instruments on new and potentially upcoming polar and geostationary satellite platforms.
While expanding satellite observations and products are promising, it is vitally important to maintain surface monitoring networks that support research and policy assessments. Surface monitoring networks provide critical data for ground-truthing and constraining remote sensing analyzes, evaluating chemistry and transport models, assessing human and ecosystem exposure, and tracking long-term trends. Maintaining support for established U.S. monitoring networks has been a perennial challenge, and multiple sites have been suspended or terminated in recent years. As the U.S. EPA CASAC panel has recently urged, maintaining robust monitoring networks is critical for protecting human health, welfare, and ecosystems (Sheppard Citation2023).
To date, the U.S. EPA has declined to list NH3 as a criteria pollutant or to set emissions limits for industrial, agricultural, or mobile sources. EPA has delayed regulating NH3 emissions from animal feeding operations for almost 20 years after signing consent agreements with operators in the mid-2000s. Emissions uncertainties, heterogeneous impacts, administrative complications, and a preference for voluntary approaches for the agricultural sector have been cited as reasons not to regulate NH3 emissions. The U.S. EPA should revisit these decisions, considering improved scientific understanding and the ongoing and multi-pronged harms caused by reduced N.
The U.S. EPA has traditionally set secondary standards for protection of welfare and ecosystems based on ambient concentrations. As recently recommended by the U.S. EPA Clean Air Scientific Advisory Committee, the Agency should reconsider this approach and set deposition-based standards for ecosystem effects (Sheppard Citation2023). Critical loads for lichens, sensitive tree species, and freshwater eutrophication risks provide a sound basis for establishing such standards. Total maximum daily loads for contribution of atmospheric deposition to estuarine watersheds and coastal waters should also be considered.
Confined animal feeding operations contribute disproportionately to NH3 emissions in the U.S., with broad regional impacts as well as heightened health and welfare harms for nearby communities. In 2017, when it denied a petition to set performance standards for confined animal feeding operations, the U.S. EPA asserted the need to “first evaluat[e] CAFO emissions and then determin[e] further regulatory actions to reduce emissions,” and cited its limited resources and competing priorities (Pruitt Citation2017). As many health and environmental protection organizations have urged (ALDF et al. Citation2021), the U.S. EPA should reconsider this decision and move forward to set standards. Recommended best management practices, state and local regulations that address NH3 and other emissions from animal feeding operations, and updated European rules for this source sector provide models for feasible work practices that can be used to decrease feedlot emissions.
The European Union has relatively comprehensive regulations to address NH3 emissions through country-wide emissions caps that are guided by CLs and ambient air quality standards, as well as source-specific emissions limits and work practice requirements. In contrast to the U.S., where NH3 emissions are increasing, emissions across EU countries declined by 13% from 2005 to 2021. The U.S. and other impacted countries should follow the lead of European nations in developing an integrated response to the suite of health and environmental harms caused by reduced N. As prior assessments have also noted (e.g., U.S. EPA-SAB Citation2011) the sources and natural resources affected by NH3 emissions cross over traditional bureaucratic lines of research and management responsibility in the U.S., including air and water divisions at U.S. EPA, U.S.D.A., federal land and coastal resource managers, and state and tribal agencies. Europe’s ongoing N assessments and the U.S. National Acid Deposition Assessment Program provide successful examples of the cross-cutting, integrated approach that is needed to fill information gaps and design, implement, and assess mitigation strategies for reduced N.
Supplemental Material
Download PDF (240.9 KB)Acknowledgment
This paper was commissioned by the Critical Review Committee of the Air & Waste Management Association. The authors appreciate the guidance, comments, and support of the oversight committee, particularly Susan Wierman, Bret Schichtel, and Lisa Bucher and other members. The authors also appreciate the work of Heather Flaherty, Fatemeh Rezaei, Kimberley Driscoll, McKenzie Brannon, and Connor Olson in the development of visuals for the manuscript and the presentation. The authors appreciate the thoughtful discussions with Chris Clark, Christy Goodale, Bob Howarth, Hans Paerl, and Justin Coughlin. This paper is a contribution of the Hubbard Brook Ecosystem Study.
Supplementary material
Supplemental data for this article can be accessed online at https://doi.org/10.1080/10962247.2024.2342765
Disclosure statement
No potential conflict of interest was reported by the author(s).
Additional information
Notes on contributors

Charles Driscoll
Charles T. Driscoll is Distinguished and University Professor of Civil and Environmental Engineering at Syracuse University, Syracuse, NY. Driscoll’s scholarly work addresses the effects of disturbance on forest, freshwater and marine ecosystems, including air pollution (mercury, sulfur, and nitrogen deposition), land-use, and climate change.

Jana B. Milford
Jana B. Milford is Emerita Professor in the Department of Mechanical Engineering and the Environmental Engineering Program at the University of Colorado Boulder. Her research and teaching interests focus on air quality modeling and data analysis, thermal sciences, environmental impacts of energy systems, and environmental law and policy.

Daven K. Henze
Daven K. Henze is Professor and the S.P. Chip and Lori Johnson Faculty Fellow in the Department of Mechanical Engineering at the University of Colorado Boulder. His research interests include aerosols, air quality, climatology, and atmospheric chemistry.

Michael D. Bell
Michael D. Bell is an ecologist with the National Park Service - Air Resources Division who studies how air pollution harms ecosystems. He develops management tools, such as Critical Loads, to guide the protection and recovery of ecosystems from air pollution.
References
- Abbatt, J. P. D., S. Benz, D. J. Cziczo, Z. Kanji, U. Lohmann, and O. Mahler. 2006. Solid ammonium sulfate aerosols as ice nuclei: A pathway for cirrus cloud formation. Science 313 (5794):1770–73. doi:10.1126/science.1129726.
- Aber, J. D., C. L. Goodale, S. V. Ollinger, M.-L. Smith, A. H. Magill, M. E. Martin, R. A. Hallett, and J. L. Stoddard. 2003. Is nitrogen deposition altering the nitrogen status of northeastern forests? Bioscience 53 (4):375–89. doi:10.1641/0006-3568(2003)053[0375:INDATN]2.0.CO;2.
- Aber, J., W. McDowell, K. Nadelhoffer, A. Magill, G. Berntson, M. Kamakea, S. McNulty, W. Currie, L. Rustad, and I. Fernandez. 1998. Nitrogen saturation in temperate forest ecosystems - Hypotheses revisited. Bioscience 48 (11):921–34. doi:10.2307/1313296.
- Adams, C., C. A. McLinden, M. W. Shephard, N. Dickson, E. Dammers, J. Chen, P. Makar, K. E. Cady-Pereira, N. Tam, S. K. Kharol, et al. 2019. Satellite-derived emissions of carbon monoxide, ammonia, and nitrogen dioxide from the 2016 horse River wildfire in the Fort McMurray area. Atmos. Chem. Phys. 19 (4):2577–99. doi:10.5194/acp-19-2577-2019.
- Agency for Toxic Substances and Disease Registry and U.S. Department of Health and Human Services. 2004. Toxicological profile for ammonia. https://www.atsdr.cdc.gov/hs/hsees/annual2004.html.
- Alexander, R. B., R. A. Smith, G. E. Schwarz, S. D. Preston, J. W. Brakebill, R. Srinivasan, and P. A. Pacheco. 2001. Atmospheric nitrogen flux from the watersheds of major estuaries of the United States: An application of the SPARROW watershed model. Nitrogen loading in coastal water bodies: An atmospheric perspective. Coastal Estuarine Stud. 57:119–70.
- Almuhanna, E. A., A. S. Ahmed, and Y. M. Al-Yousif. 2011. Effect of air contaminants on Poultry immunological and production performance. Int. J. Poult. Sci. 10 (6):461–70. doi:10.3923/ijps.2011.461.470.
- American Conference of Governmental Industrial Hygienists. 2001a. Documentation of the TLVs and BEIs with other worldwide occupational exposure values. 7th ed. Ohio: American Conference of Governmental Industrial Hygienists Cincinnati.
- American Conference of Governmental Industrial Hygienists. 2001b. Threshold limit values for chemical substances and physical agents and biological exposure indices. Cincinnati, OH.
- Aneja, V. P., W. H. Schlesinger, and J. W. Erisman. 2008. Farming pollution. Nat. Geosci. 1 (7):409–11. doi:10.1038/ngeo236.
- Aneja, V. P., W. H. Schlesinger, and J. W. Erisman. 2009. Effects of agriculture upon the air quality and climate: Research, policy, and regulations. Environ. Sci. Technol. 43 (12):4234–40. doi:10.1021/es8024403.
- Animal Legal Defense Fund & groups (ALDF). 2021. Petition to rescind the air consent agreement and enforce clean air laws against animal feeding operations. https://aldf.org/case/urging-the-environmental-protection-agency-to-stop-giving-factory-farms-a-free-pass-on-air-pollution/.
- Asman, W. A. H., E. F. Pinksterboer, H. F. M. Maas, J.-W. Erisman, A. Waijers-Ypelaan, J. Slanina, and T. W. Horst. 1989. Gradients of the ammonia concentration in a nature reserve: Model results and measurements. Atmos. Environ. 23 (10):2259–65. doi:10.1016/0004-6981(89)90188-1.
- Averill, C., M. C. Dietze, and J. M. Bhatnagar. 2018. Continental-scale nitrogen pollution is shifting forest mycorrhizal associations and soil carbon stocks. Global Change Biol. 24 (10):4544–53. doi:10.1111/gcb.14368.
- Baker, B. C., A. E. Wilson, and J. T. Scott. 2018. Phytoplankton N2-fixation efficiency and its effect on harmful algal blooms. Freshw. Sci. 37 (2):264–75. doi:10.1086/697530.
- Balasubramanian, S., D. M. McFarland, S. Koloutsou-Vakakis, K. Fu, R. Menon, C. Lehmann, and M. J. Rood. 2020. Effect of grid resolution and spatial representation of NH3 emissions from fertilizer application on predictions of NH3 and PM2.5 concentrations in the United States Corn Belt. Environ. Res. Commun. 2:025001. doi:10.1088/2515-7620/ab6c01.
- Baldigo, B. P., S. D. George, T. J. Sullivan, C. T. Driscoll, D. A. Burns, S. Shao, and G. B. Lawrence. 2019. Probabilistic relations between acid–base chemistry and fish assemblages in streams of the western Adirondack Mountains, New York, USA. Can. J. Fish. Aquat. Sci. 76 (11):2013–26. doi:10.1139/cjfas-2018-0260.
- Baron, J. S., C. T. Driscoll, J. L. Stoddard, and E. E. Richer. 2011. Empirical critical loads of atmospheric nitrogen deposition for nutrient enrichment and acidification of sensitive US lakes. Bioscience. 61 (8):602–13. doi:10.1525/bio.2011.61.8.6.
- Bash, J. O., E. J. Cooter, R. L. Dennis, J. T. Walker, and J. E. Pleim. 2013. Evaluation of a regional air-quality model with bidirectional NH3 exchange coupled to an agroecosystem model. Biogeosciences. 10 (3):1635–45. doi:10.5194/bg-10-1635-2013.
- Bash, J. O., C. Flechard, M. Adon, P. Cellier, J. L. Drouet, S. Genermont, B. Grosz, L. Horvath, R.-S. Massad, M. A. Sutton, et al. 2015. Modelling the air–surface exchange of ammonia from the field to global scale. In Review and integration of biosphere-atmosphere modelling of reactive trace gases and volatile aerosols, ed. R.-S. Massad and B. Loubet, 153–61. Dordrecht: Springer.
- Bauer, S. E., K. Tsigaridis, and R. Miller. 2016. Significant atmospheric aerosol pollution caused by world food cultivation. Geophys. Res. Lett. 43 (10):5394–400. doi:10.1002/2016GL068354.
- Beachley, G. M., C. M. Rogers, T. F. Lavery, J. T. Walker, and M. A. Puchalski. 2019. Long-term trends in reactive nitrogen deposition in the United States. EM Magazine. 1:1–13.
- Beem, K. B., S. Raja, F. M. Schwandner, C. Taylor, T. Lee, A. P. Sullivan, C. M. Carrico, G. R. McMeeking, D. Day, E. Levin, et al. 2010. Deposition of reactive nitrogen during the rocky mountain airborne nitrogen and sulfur (RoMANS) study. Environ. Pollut. 158 (3):862–72. doi:10.1016/j.envpol.2009.09.023.
- Beer, R., M. W. Shephard, S. S. Kulawik, S. A. Clough, A. Eldering, K. W. Bowman, S.P. Sander, B. M. Fisher, V. H. Payne, M. Luo, et al. 2008. First satellite observations of lower tropospheric ammonia and methanol. Geophys. Res. Lett. 35 (9). doi: 10.1029/2008GL033642.
- Behera, S. N., M. Sharma, V. P. Aneja, and R. Balasubramanian. 2013. Ammonia in the atmosphere: A review on emission sources, atmospheric chemistry and deposition on terrestrial bodies. Environ. Sci. Pollut. Res. 20 (11):8092–131. doi:10.1007/s11356-013-2051-9.
- Bell, D. M., D. Imre, S. T. Martin, and A. Zelenyuk. 2017. The properties and behavior of α-pinene secondary organic aerosol particles exposed to ammonia under dry conditions. Phys. Chem. Chem. Phys. 19 (9):6497–507. doi:10.1039/C6CP08839B.
- Bellouin, N., J. Rae, A. Jones, C. Johnson, J. Haywood, and O. Boucher. 2011. Aerosol forcing in the Climate Model Intercomparison Project (CMIP5) simulations by HadGEM2-ES and the role of ammonium nitrate. J. Geophys. Res. 116 (D20). doi:10.1029/2011JD016074.
- Benedict, K. B., D. Day, F. M. Schwandner, S. M. Kreidenweis, B. Schichtel, W. C. Malm, and J. L. Collett. 2013. Observations of atmospheric reactive nitrogen species in Rocky Mountain National Park and across northern Colorado. Atmos. Environ. 64:66–76. doi:10.1016/j.atmosenv.2012.08.066.
- Benish, S. E., J. O. Bash, K. M. Foley, K. W. Appel, C. Hogrefe, R. Gilliam, and G. Pouliot. 2022. Long-term regional trends of nitrogen and sulfur deposition in the United States from 2002 to 2017. Atmos. Chem. Phys. 22 (19):12749–67. doi:10.5194/acp-22-12749-2022.
- Bergstrom, A. K., and M. Jansson. 2006. Atmospheric nitrogen deposition has caused nitrogen enrichment and eutrophication of lakes in the northern hemisphere. Global Change Biol. 12 (4):635–43. doi:10.1111/j.1365-2486.2006.01129.x.
- Berner, A. H., and J. David Felix. 2020. Investigating ammonia emissions in a coastal urban airshed using stable isotope techniques. Sci. Total Environ 707:134952. doi:10.1016/j.scitotenv.2019.134952.
- Bessagnet, B., M. Beauchamp, C. Guerreiro, F. de Leeuw, S. Tsyro, A. Colette, F. D. R. Meleux, L. Rou├»l, P. Ruyssenaars, F. Sauter, et al. 2014. Can further mitigation of ammonia emissions reduce exceedances of particulate matter air quality standards? Environ. Sci. Policy 44:149–63. doi:10.1016/j.envsci.2014.07.011.
- Bian, H., M. Chin, D. A. Hauglustaine, M. Schulz, G. Myhre, S. E. Bauer, M. T. Lund, V. A. Karydis, T.L. Kucsera, X. Pan, et al. 2017. Investigation of global particulate nitrate from the AeroCom phase III experiment. Atmos. Chem. Phys. 17 (21):12911–40. doi:10.5194/acp-17-12911-2017.
- Bishop, G. A., and D. H. Stedman. 2015. Reactive nitrogen species emission trends in three light-/medium-duty United States fleets. Environ. Sci. Technol. 49 (18):11234–40. doi:10.1021/acs.est.5b02392.
- Blett, T. F., J. A. Lynch, L. H. Pardo, C. Huber, R. Haeuber, and R. Pouyat. 2014. FOCUS: A pilot study for national-scale critical loads development in the United States. Environ. Sci. Policy 38:225–36. doi:10.1016/j.envsci.2013.12.005.
- Bloom, A. J., S. S. Sukrapanna, and R. L. Warner. 1992. Root respiration associated with ammonium and nitrate absorption and assimilation by barley. Plant Physiol. 99 (4):1294–301. doi:10.1104/pp.99.4.1294.
- Bobbink, R., K. Hicks, J. Galloway, T. Spranger, R. Alkemade, M. Ashmore, M. Bustamante, S. Cinderby, E. Davidson, F. Dentener, et al. 2010. Global assessment of nitrogen deposition effects on terrestrial plant diversity: A synthesis. Ecol. Appl. 20 (1):30–59. doi:10.1890/08-1140.1.
- Bobbink, R., C. Loran, and H. Tomassen. 2022. Explanations for nitrogen decline. Science (New York, N.Y.) 376 (6598):1169–70. https://www.umweltbundesamt.de/en/publikationen/review-revision-of-empirical-critical-loads-of.
- Bogard, M., R. J. Vogt, N. M. Hayes, and P. Leavitt. 2020. Unabated nitrogen pollution favours growth of toxic cyanobacteria over chlorophytes in most hypereutrophic lakes. Environ. Sci. Technol. 54 (6):3219–27. doi:10.1021/acs.est.9b06299.
- Bones, D. L., D. K. Henricksen, S. A. Mang, M. Gonsior, A. P. Bateman, T. B. Nguyen, W. J. Cooper, and S. A. Nizkorodov. 2010. Appearance of strong absorbers and fluorophores in limonene-O3 secondary organic aerosol due to NH4±mediated chemical aging over long time scales. J. Geophys. Res. 115 (D5). doi:10.1029/2009JD012864.
- Bouwman, A. F., D. S. Lee, W. A. H. Asman, F. J. Dentener, K. W. Van Der Hoek, and J. G. J. Olivier. 1997. A global high-resolution emission inventory for ammonia. Global Biogeochem. Cycles 11 (4):561–87. doi:10.1029/97GB02266.
- Bowman, W. D., A. Ayyad, C. P. Bueno de Mesquita, N. Fierer, T. S. Potter, and S. Sternagel. 2018. Limited ecosystem recovery from simulated chronic nitrogen deposition. Ecol. Appl. 28 (7):1762–72. doi:10.1002/eap.1783.
- Boyer, E. W., C. L. Goodale, N. A. Jaworski, and R. W. Howarth. 2002. Anthropogenic nitrogen sources and relationships to riverine nitrogen export in the northeastern USA. Biogeochemistry 57 (1):137–69. doi:10.1023/A:1015709302073.
- Brandani, C. B., M. Lee, B. W. Auvermann, D. B. Parker, K. D. Casey, E. T. Crosman, V. N. Gouva, M. R. Beck, K. J. Bush, J. A. Koziel, et al. 2023. Mitigating ammonia deposition derived from open-lot livestock facilities into Colorado’s Rocky Mountain National Park: State of the science. Atmosphere 14 (10):1469. doi:10.3390/atmos14101469.
- Bricker, S. B., B. Longstaff, W. Dennison, A. Jones, K. Boicourt, C. Wicks, and J. Woerner. 2008. Effects of nutrient enrichment in the nation’s estuaries: A decade of change. Harmful. Algae. 8 (1):21–32. doi:10.1016/j.hal.2008.08.028.
- Burns, D. A., G. Bhatt, L. C. Linker, J. O. Bash, P. B. Capel, and G. W. Shenk. 2021. Atmospheric nitrogen deposition in the Chesapeake Bay watershed: A history of change. Atmos. Environ. 251:118277. doi:10.1016/j.atmosenv.2021.118277.
- Burns, A. M., G. Chandler, K. J. Dunham, and A. G. Carlton. 2023. Data gap: Air quality networks Miss air pollution from concentrated animal feeding operations. Environ. Sci. Technol. 57 (49):20718–25. doi:10.1021/acs.est.3c06947.
- Butler, T., F. Vermeylen, C. M. Lehmann, G. E. Likens, and M. Puchalski. 2016. Increasing ammonia concentration trends in large regions of the USA derived from the NADP/AMoN network. Atmos. Environ. 146:132–40. doi:10.1016/j.atmosenv.2016.06.033.
- Byrnes, D. K., K. J. Van Meter, and N. B. Basu. 2020. Long‐term shifts in U.S. nitrogen sources and sinks revealed by the new TREND‐nitrogen data set (1930–2017). Global Biogeochem. Cycles. 34 (9). doi: 10.1029/2020gb006626.
- Cady-Pereira, K. E., X. Guo, R. Wang, A. B. Leytem, C. Calkins, E. Berry, K. Sun, M. Müller, A. Wisthaler, V. H. Payne, et al. 2024. Validation of MUSES NH3 observations from AIRS and CrIS against aircraft measurements from DISCOVER-AQ and a surface network in the Magic Valley. Atmos. Meas. Tech. 17 (1):15–36. doi:10.5194/amt-17-15-2024.
- Cao, H., D. K. Henze, K. Cady-Pereira, B. C. McDonald, C. Harkins, K. Sun, K. W. Bowman, T.-M. Fu, and M. O. Nawaz. 2022. COVID-19 lockdowns afford the first satellite-based confirmation that vehicles are an under-recognized source of urban NH3 pollution in Los Angeles. Environ. Sci. Technol. Lett. 9 (1):3–9. doi:10.1021/acs.estlett.1c00730.
- Cao, H., D. K. Henze, M. W. Shephard, E. Dammers, K. Cady-Pereira, M. Alvarado, C. Lonsdale, G. Luo, F. Yu, L. Zhu, et al. 2020. Inverse modeling of NH3 sources using CrIS remote sensing measurements. Environ. Res. Lett. 15 (10):104082. doi:10.1088/1748-9326/abb5cc.
- Cao, H., D. K. Henze, L. Zhu, M. W. Shephard, K. Cady-Pereira, E. Dammers, M. Sitwell, N. Heath, C. Lonsdale, J. O. Bash, et al. 2022. 4D-Var inversion of European NH3 emissions using CrIS NH3 measurements and GEOS-chem adjoint with bi-directional and uni-directional flux schemes. J. Geophys. Res. 127 (9):e2021JD035687. doi:10.1029/2021JD035687.
- Carter, T. S., C. M. Clark, M. E. Fenn, S. Jovan, S. S. Perakis, J. Riddell, P. G. Schaberg, T. L. Greaver, and M. G. Hastings. 2017. Mechanisms of nitrogen deposition effects on temperate forest lichens and trees. Ecosphere. 8 (3):e01717. doi:10.1002/ecs2.1717.
- Castro, M. S., and C. T. Driscoll. 2002. Atmospheric nitrogen deposition to estuaries in the mid-Atlantic and Northeastern United States. Environ. Sci. Technol. 36 (8):3242–49. doi:10.1021/es010664o.
- Castro, M. S., C. T. Driscoll, T. E. Jordan, W. G. Reay, and W. R. Boynton. 2003. Sources of nitrogen to estuaries in the United States. Estuaries. 26 (3):803–14. doi:10.1007/BF02711991.
- Chaffin, J. D., T. W. Davis, D. J. Smith, M. M. Baer, and G. J. Dick. 2018. Interactions between nitrogen form, loading rate, and light intensity on microcystis and planktothrix growth and microcystin production. Harmful. Algae. 73:84–97. doi:10.1016/j.hal.2018.02.001.
- Chapin, F. S., P. M. Vitousek, and K. Van Cleve. 1986. The nature of nutrient limitation in plant communities. Am. Nat. 127 (1):48–58. doi:10.1086/284466.
- Chen, X., D. Day, B. Schichtel, W. Malm, A. K. Matzoll, J. Mojica, C. E. McDade, E. D. Hardison, D. L. Hardison, S. Walters, et al. 2014. Seasonal ambient ammonia and ammonium concentrations in a pilot IMPROVE NHx monitoring network in the western United States. Atmos. Environ. 91:118–26. doi:10.1016/j.atmosenv.2014.03.058.
- Chen, Y., H. Shen, J. Kaiser, Y. Hu, S. L. Capps, S. Zhao, A. Hakami, J. S. Shih, G. K. Pavur, M. D. Turner, et al. 2021. High-resolution hybrid inversion of IASI ammonia columns to constrain US ammonia emissions using the CMAQ adjoint model. Atmos. Chem. Phys. 21 (3):2067–82. doi:10.5194/acp-21-2067-2021.
- Chen, Y., H. Shen, and A. G. Russell. 2019. Current and future responses of aerosol pH and composition in the U.S. to declining SO2 emissions and increasing NH3 emissions. Environ. Sci. Technol. 53 (16):9646–55. doi:10.1021/acs.est.9b02005.
- Chen, Z.-L., W. Song, C.-C. Hu, X.-J. Liu, G.-Y. Chen, W. W. Walters, G. Michalski, C.-Q. Liu, D. Fowler, and X.-Y. Liu. 2022. Significant contributions of combustion-related sources to ammonia emissions. Nat. Commun. 13 (1):7710. doi:10.1038/s41467-022-35381-4.
- Chen, T., P. Zhang, B. Chu, Q. Ma, Y. Ge, and H. He. 2023. Synergistic effects of so 2 and NH 3 coexistence on SOA formation from gasoline evaporative emissions. Environ. Sci. Technol. 57 (16):6616–25. doi:10.1021/acs.est.3c01921.
- Clappier, A., C. A. Belis, D. Pernigotti, and P. Thunis. 2017. Source apportionment and sensitivity analysis: Two methodologies with two different purposes. Geosci. Model Dev. 10 (11):4245–56. doi:10.5194/gmd-10-4245-2017.
- Clarisse, L., M. Van Damme, D. Hurtmans, B. Franco, C. Clerbaux, and P.-F. O. Coheur. 2021. The diel cycle of NH3 observed from the FY-4A Geostationary Interferometric Infrared Sounder (GIIRS). Geophys. Res. Lett. 48 (14):e2021GL093010. doi:10.1029/2021GL093010.
- Clark, C. M., M. D. Bell, J. W. Boyd, J. E. Compton, E. A. Davidson, C. Davis, M. E. Fenn, L. Geiser, L. Jones, and T. F. Blett. 2017. Nitrogen-induced terrestrial eutrophication: Cascading effects and impacts on ecosystem services. Ecosphere. 8 (7):e01877. doi:10.1002/ecs2.1877.
- Clark, C. M., J. Phelan, J. Ash, J. Buckley, J. Cajka, K. Horn, R. Q. Thomas, and R. D. Sabo. 2023. Future climate change effects on US forest composition may offset benefits of reduced atmospheric deposition of N and S. Global Change Biol. 29 (17):4793–810. doi:10.1111/gcb.16817.
- Clark, C. M., S. M. Simkin, E. B. Allen, W. D. Bowman, J. Belnap, M. L. Brooks, S. L. Collins, L. H. Geiser, F. S. Gilliam, S. E. Jovan, et al. 2019. Potential vulnerability of 348 herbaceous species to atmospheric deposition of nitrogen and sulfur in the United States. Nat. Plants. 5 (7):697–705. doi:10.1038/s41477-019-0442-8.
- Clark, C. M., R. Q. Thomas, and K. J. Horn. 2022. Above-ground tree carbon storage in response to nitrogen deposition in the U.S. is heterogeneous and may have weakened. Commun. Earth Environ. 4 (1):35. doi:10.1038/s43247-023-00677-w.
- Colorado Department of Public Health and Environment and U.S. EPA (CDPHE). 2007. Rocky Mountain National Park nitrogen deposition reduction plan. https://cdphe.colorado.gov/public-information/planning-and-outreach/rocky-mountain-national-park-initiative;.
- Colorado Department of Public Health and Environment (CDPHE) and U.S. EPA. 2005. Memorandum of understanding for interagency collaboration to address air quality issues affecting Rocky Mountain National Park. https://cdphe.colorado.gov/public-information/planning-and-outreach/rocky-mountain-national-park-initiative.
- Conley, D. J., H. W. Paerl, R. W. Howarth, D. F. Boesch, S. P. Seitzinger, K. E. Havens, C. Lancelot, and G. E. Likens. 2009. Controlling eutrophication: Nitrogen and phosphorus. Science 323 (5917):1014–15. doi:10.1126/science.1167755.
- Cooter, E. J., J. O. Bash, V. Benson, and L. Ran. 2012. Linking agricultural crop management and air quality models for regional to national-scale nitrogen assessments. Biogeosciences. 9 (10):4023–35. doi:10.5194/bg-9-4023-2012.
- Cooter, E. J., J. O. Bash, J. T. Walker, M. R. Jones, and W. Robarge. 2010. Estimation of NH3 bi-directional flux from managed agricultural soils. Atmos. Environ. 44 (17):2107–15. doi:10.1016/j.atmosenv.2010.02.044.
- Copeland, C. 2014. Air quality issues and animal agriculture: A primer (RL32948). C. R. Service. EveryCRSReport.com.
- Coughlin, J. G., S. Y. Chang, J. Huang, K. Craig, C. T. Driscoll, C. Scarborough, C. M. Clark, and N. R. Pavlovic. 2024. Spatially varying nitrogen critical loads for tree species driven by mediating factor influences. Ecosphere. (In press).
- Coughlin, J. G., C. M. Clark, L. H. Pardo, R. D. Sabo, and J. D. Ash. 2023. Sensitive tree species remain at risk despite improved air quality benefits to US forests. Nat. Sustain. 6 (12):1607–19. doi:10.1038/s41893-023-01203-8.
- Cox, R. D., K. L. Preston, R. F. Johnson, R. A. Minnich, and E. B. Allen. 2014. Influence of landscape-scale variables on vegetation conversion to exotic annual grassland in southern California, USA. Global Ecol. Conserv. 2:190–203. doi:10.1016/j.gecco.2014.09.008.
- Crippa, M., D. Guizzardi, M. Muntean, E. Schaaf, F. Dentener, J. A. van Aardenne, S. Monni, U. Doering, J.G.J. Olivier, V. Pagliari, et al. 2018. Gridded emissions of air pollutants for the period 1970ΓÇô2012 within EDGAR v4.3.2. Earth Syst. Sci. Data 10 (4):1987–2013. doi:10.5194/essd-10-1987-2018.
- Dammers, E., C. A. McLinden, D. Griffin, M. W. Shephard, S. Van Der Graaf, E. Lutsch, M. Schaap, Y. Gainairu-Matz, V. Fioletov, M. Van Damme, et al. 2019. NH3 emissions from large point sources derived from CrIS and IASI satellite observations. Atmos. Chem. Phys. 19 (19):12261–93. doi:10.5194/acp-19-12261-2019.
- Davis, T. W., G. S. Bullerjahn, T. Tuttle, R. M. McKay, and S. B. Watson. 2015. Effects of increasing nitrogen and phosphorus concentrations on phytoplankton community growth and toxicity during Planktothrix blooms in Sandusky Bay, Lake Erie. Environ. Sci. Technol. 49 (12):7197–207. doi:10.1021/acs.est.5b00799.
- Dedoussi, I. C., and S. H. Barrett. 2014. Air pollution and early deaths in the United States. Part II: Attribution of PM2.5 exposure to emissions species, time, location and sector. Atmos. Environ. 99:610–17. doi:10.1016/j.atmosenv.2014.10.033.
- Dedoussi, I. C., S. D. Eastham, E. Monier, and S. R. H. Barrett. 2020. Premature mortality related to United States cross-state air pollution. Nature. 578 (7794):261–65. doi:10.1038/s41586-020-1983-8.
- Delwiche, C. C. 1970. The nitrogen cycle. Biosphere Sci. Am. 223 (3):136. doi:10.1038/scientificamerican0970-136.
- Dennis, R. L., R. Mathur, J. E. Pleim, and J. T. Walker. 2010. Fate of ammonia emissions at the local to regional scale as simulated by the community multiscale air quality model. Atmos. Pollut. Res. 1 (4):207–14. doi:10.5094/APR.2010.027.
- Dentener, F., J. Drevet, I. Bey, B. Eickhout, A.M. Fiore, D. Hauglustaine, L.W. Horowitz, M. Krol, U.C. Kulshrestha, M. Lawrence, et al. 2006. Nitrogen and sulfur deposition on regional and global scales: A multimodel evaluation. Global Biogeochem Cycles 20 (4).
- de Vries, W., S. Solberg, M. Dobbertin, H. Sterba, D. Laubhahn, G. J. Reinds, G.-J. Nabuurs, P. Gundersen, and M. A. Sutton. 2008. Ecologically implausible carbon response? Nature 451 (7180):E1–3. doi:10.1038/nature06579.
- Dolman, A. M., J. Rücker, F. R. Pick, J. Fastner, T. Rohrlack, U. Mischke, C. Wiedner, and S. Bertilsson. 2012. Cyanobacteria and cyanotoxins: The influence of nitrogen versus phosphorus. PLOS One. 7 (6):38757. doi:10.1371/journal.pone.0038757.
- Driscoll, C. T., K.M. Driscoll, H. Fakhraei, and K. Civerolo. 2016. Long-term temporal trends and spatial patterns in the acid-base chemistry of lakes in the Adirondack region of New York in response to decreases in acidic deposition. Atmos. Environ. 146:5–14. doi:10.1016/j.atmosenv.2016.08.034.
- Driscoll, C. T., G. B. Lawrence, A. J. Bulger, T. J. Butler, C. S. Cronan, C. Eagar, K. F. Lambert, G. Likens, J. L. Stoddard, and K. C. Weathers. 2001. Acidic deposition in the northeastern United States: Sources and inputs, ecosystem effects and management strategies. BioScience 51: 180–198.
- Driscoll, C. T., D. Whitall, J. Aber, E. Boyer, M. Castro, C. Cronan, C. L. Goodale, P. Groffman, C. Hopkinson, K. Lambert, et al. 2003. Nitrogen pollution in the northeastern United States: Sources, effects, and management options. Bioscience. 53 (4):357–74. doi:10.1641/0006-3568(2003)053[0357:NPITNU]2.0.CO;2.
- Duyzer, J. 1994. Dry deposition of ammonia and ammonium aerosols over heathland. J. Geophys. Res. 99 (D9):18757–63. doi:10.1029/94JD01210.
- Eatough Jones, M., T. Paine, M. Fenn, and M. Poth. 2004. Influence of ozone and nitrogen deposition on bark beetle activity under drought conditions. For. Ecol. Manag. 200 (1–3):67–76. doi:10.1016/j.foreco.2004.06.003.
- Ellis, R. A., D. J. Jacob, M.P. Sulprizio, L. Zhang, C. D. Holmes, B. A. Schichtel, T. Blett, E. Porter, L. H. Pardo, and J. A. Lynch. 2013. Present and future nitrogen deposition to national parks in the United States: Critical load exceedances. Atmos. Chem. Phys. 13 (17):9083–95. doi:10.5194/acp-13-9083-2013.
- Elser, J. J., M. E. S. Bracken, E. E. Cleland, D. S. Gruner, W. S. Harpole, H. Hillebrand, J. T. Bgai, E. W. Seabloom, J. B. Shurin, and J. E. Smith. 2007. Global analysis of nitrogen and phosphorus limitation of primary producers in freshwater, marine and terrestrial ecosystems. Ecol. Lett. 10 (12):1135–42. doi:10.1111/j.1461-0248.2007.01113.x.
- Environmental Integrity Project (EIP). 2011. Petition for the regulation of ammonia as a criteria pollutant under clean air act sections 108 and 109. https://www.centerforfoodsafety.org/files/petitionammonia-as-criteria-pollutant04062011_59802.pdf.
- EPA, U. S. 2024. Final reconsideration of the National Ambient Air Quality Standards for Particulate Matter (PM). Accessed February 2024. https://www.epa.gov/pm-pollution/final-reconsideration-national-ambient-air-quality-standards-particulate-matter-pm.
- Erisman, J. W., M. A. Sutton, J. Galloway, Z. Klimont, and W. Winiwarter. 2008. How a century of ammonia synthesis changed the world. Nat Geosci 1 (10):636–39. doi:10.1038/ngeo325.
- Erisman, J. W., A. W. M. Vermetten, E. F. Pinksterboer, W. A. H. Asman, A. Waijers-Ypelaan, and J. Slanina. 1987. Atmospheric ammonia: Distribution, equilibrium with aerosols and conversion rate to ammonium. In: Ammonia and Acidification, in: WAH, A. HSMA, D. (Eds.), Proceedings of the symposium of the European Association for the Science of Air Pollution Ammonia and Acidification. Symp. EURASAP, Bilthoven, The Netherlands, pp. 59–72.
- European Commission. 2011. Commission regulation implementing and amending regulation (EC) No. 595/2009 of the European Parliament and of the Council with respect to emissions from heavy duty vehicles (Euro VI) and amending Annexes I and III to Directive 2007/46/EC of the European Parliament and of the Council. Commission Regulation (EU) No. 582/2011. https://eur-lex.europa.eu/legal-content/EN/TXT/PDF/?uri=CELEX:32011R0582.
- European Commission. 2019. The European Green Deal. (COM(2019) 640 final). https://eur-lex.europa.eu/resource.html?uri=cellar:b828d165-1c22-11ea-8c1f-01aa75ed71a1.0002.02/DOC_1&format=PDF.
- European Commission. 2021. EU action plan: Towards zero pollution for air, water, and soil. (COM(2021) 400). https://environment.ec.europa.eu/strategy/zero-pollution-action-plan_en#documents.
- European Commission. 2022a. Euro 7 vehicle emission standards. A European green deal proposal: Technical studies for the development of Euro 7: Testing, pollutants and emission limits. https://ec.europa.eu/commission/presscorner/detail/en/ip_22_6495.
- European Commission. 2022b. Proposal for a directive of the European Parliament and of the council amending directive 2010/75/EU of the European Parliament and off the council of 24 November 2010 on industrial emissions (integrated pollution prevention and control) and Council directive 1993/31/EC of 26 April 1999 on the landfill of waste. (COM(2022) 156 final/3).
- European Commission. 2022c. Proposal for a Regulation of the European Parliament and of the Council on type-approval of motor vehicles and. engines and of. systems, components and separate technical units intended for such vehicles, with respect to their emissions and battery durability (Euro 7) and repealing Regulations (EC) No 715/2007 and (EC) No 595/2009. (COM(2022) 586 final), Brussels, Belgium.
- European Commission. 2023. EU air quality standards https://environment.ec.europa.eu/topics/air/air-quality/eu-air-quality-standards_en.
- European Environment Agency (EEA). 2023. Air pollution in Europe: 2023 reporting status under the national emission reduction commitments directive https://www.eea.europa.eu/publications/national-emission-reduction-commitments-directive-2023.
- European Parliament. 2010. Directive on industrial emissions (integrated pollution prevention and control (Directive 2010/75EU). Brussels, Belgium. https://environment.ec.europa.eu/topics/industrial-emissions-and-safety/industrial-emissions-directive_en.
- European Parliament. 2016. Directive on the reduction of national emissions of certain atmospheric pollutants, amending Directive 2003/35/EC and repealing Directive 2001/81/EC. (Directive (EU) 2016/2284). Brussels, Belgium. https://eur-lex.europa.eu/legal-content/EN/TXT/PDF/?uri=CELEX:32016L2284.
- European Parliament. 2023a. Air pollution: MEPs want stricter limits to achieve zero pollution by 2050. https://www.europarl.europa.eu/news/en/press-room/20230911IPR04915/air-pollution-meps-want-stricter-limits-to-achieve-zero-pollution-by-2050.
- European Parliament. 2023b. Amendments adopted by the European Parliament on 13 September 2023 on the proposal for a directive of the European Parliament and of the Council on ambient air quality and cleaner air for Europe (recast) (COM(2022)0542 - C9-0364/2022-2022/0347(COD)). Brussels, Belgium. https://www.europarl.europa.eu/doceo/document/TA-9-2023-0318_EN.html.
- Evangeliou, N., Y. Balkanski, S. Eckhardt, A. Cozic, M. Van Damme, P. F. Coheur, L. Clarisse, M. W. Shephard, K. E. Cady-Pereira, and D. Hauglustaine. 2021. 10-year satellite-constrained fluxes of ammonia improve performance of chemistry transport models. Atmos. Chem. Phys. 21 (6):4431–51. doi:10.5194/acp-21-4431-2021.
- Fenn, M. E., J. S. Baron, E. B. Allen, H. M. Rueth, K. R. Nydick, L. Geiser, W. D. Bowman, J. O. Sickman, T. Meixner, D. W. Johnson, et al. 2003. Ecological effects of nitrogen deposition in the western United States. Bioscience. 53 (4):404–20. doi:10.1641/0006-3568(2003)053[0404:EEONDI]2.0.CO;2.
- Fenn, M. E., A. Bytnerowicz, S. L. Schilling, D. M. Vallano, E. S. Zavaleta, S. B. Weiss, C. Morozumi, L. H. Geiser, and K. Hanks. 2018. On-road emissions of ammonia: An underappreciated source of atmospheric nitrogen deposition. Sci. Total Environ 625:909–19. doi:10.1016/j.scitotenv.2017.12.313.
- Ford, B., M. Val Martin, S. E. Zelasky, E. V. Fischer, S. C. Anenberg, C.L. Heald, and J.R. Pierce. 2018. Future fire impacts on smoke concentrations, visibility, and health in the contiguous United States. GeoHealth. 2 (8):229–47. doi:10.1029/2018GH000144.
- Fowler, D., M. Coyle, U. Skiba, M. A. Sutton, J. N. Cape, S. Reis, L. J. Sheppard, A. Jenkins, B. Grizzetti, J.N. Galloway, et al. 2013. The global nitrogen cycle in the twenty-first century. Philos. Trans. R. Soc. Lond. B. Biol. Sci. 368 (1621):20130164. doi:10.1098/rstb.2013.0164.
- Galloway, J. N. 1998. The global nitrogen cycle: Changes and consequences. Environ. Pollut. 102 (1, Supplement 1):15–24. doi:10.1016/S0269-7491(98)80010-9.
- Galloway, J. N., J. D. Aber, J. W. Erisman, S. P. Seitzinger, R. W. Howarth, E. B. Cowling, and B. J. Cosby. 2003. The nitrogen cascade. Bioscience. 53 (4):341–56. doi:10.1641/0006-3568(2003)053[0341:TNC]2.0.CO;2.
- Galloway, J. N., F. J. Dentener, D. G. Capone, E. W. Boyer, R. W. Howarth, S. P. Seitzinger, G. P. Asner, C. C. Cleveland, P. A. Green, E. A. Holland, et al. 2004. Nitrogen cycles: Past, present, and future. Biogeochemistry. 70 (2):153–226. doi:10.1007/s10533-004-0370-0.
- Galloway, J. N., A. R. Townsend, J. W. Erisman, M. Bekunda, Z. Cai, J. R. Freney, L. A. Martinelli, S. P. Seitzinger, and M.A. Sutton. 2008. Transformation of the nitrogen cycle: Recent trends, questions, and potential solutions. Science. 320 (5878):889–92. doi:10.1126/science.1136674.
- Gebhart, K. A., B. A. Schichtel, W. C. Malm, M. G. Barna, M. A. Rodriguez, and J. L. Collett. 2011. Back-trajectory-based source apportionment of airborne sulfur and nitrogen concentrations at Rocky Mountain National Park, Colorado, USA. Atmos. Environ. 45 (3):621–33. doi:10.1016/j.atmosenv.2010.10.035.
- Geddes, J. A., and R. V. Martin. 2017. Global deposition of total reactive nitrogen oxides from 1996 to 2014 constrained with satellite observations of NO2 columns. Atmos. Chem. Phys. 17 (16):10071–91. doi:10.5194/acp-17-10071-2017.
- Geiser, L. H., P. R. Nelson, S.E. Jovan, H. T. Root, and C. M. Clark. 2019. Assessing ecological risks from atmospheric deposition of nitrogen and sulfur to US Forests using epiphytic macrolichens diversity. Diversity. 11 (6):87. doi:10.3390/d11060087.
- Geiser, L. H., H. Root, R. J. Smith, S. E. Jovan, L. St Clair, and K. L. Dillman. 2021. Lichen-based critical loads for deposition of nitrogen and sulfur in US forests. Environ. Pollut. 291:118187. doi:10.1016/j.envpol.2021.118187.
- Ge, Y., M. Vieno, D. S. Stevenson, P. Wind, and M. R. Heal. 2023. Global sensitivities of reactive N and S gas and particle concentrations and deposition to precursor emissions reductions. Atmos. Chem. Phys. 23 (11):6083–112. doi:10.5194/acp-23-6083-2023.
- Ge, X., A. S. Wexler, and S. L. Clegg. 2011. Atmospheric amines – part I. A review. Atmos. Environ. 45 (3):524–46. doi:10.1016/j.atmosenv.2010.10.012.
- Gilliam, F. S., D. A. Burns, C.T. Driscoll, S. D. Frey, G. M. Lovett, and S. A. Watmough. 2019. Decreased atmospheric nitrogen deposition in eastern North America: Predicted responses of forest ecosystems. Environ. Pollut. 244:560–74. doi:10.1016/j.envpol.2018.09.135.
- Gilliam, F. S., D. A. Burns, C. T. Driscoll, S. D. Frey, G. M. Lovett, and S. A. Watmough. 2023. Responses of forest ecosystems to decreasing nitrogen deposition in eastern North America. In Atmospheric nitrogen deposition to global forests, ed. E. Du and W.D. Vries, 205–25. London, UK: Academic Press.
- Gilliam, F. S., N. T. Welch, A. H. Phillips, J. H. Billmyer, W. T. Peterjohn, Z. K. Fowler, C. A. Walter, M. B. Burnham, J. D. May, M. B. Adams, et al. 2016. Twenty-five-year response of the herbaceous layer of a temperate hardwood forest to elevated nitrogen deposition. Ecosphere 7 (4):e01250. doi:10.1002/ecs2.1250.
- Gilliland, A. B., K. W. Appela, R. W. Pinder, and R. L. Dennis. 2006. Seasonal NH3 emissions for the continental United States: Inverse model estimation and evaluation. Atmos. Environ. 40 (26):4986–98. doi:10.1016/j.atmosenv.2005.12.066.
- Gilliland, A. B., R. L. Dennis, S. J. Roselle, and T. E. Pierce. 2003. Seasonal NH3 emission estimates for the eastern United States based on ammonium wet concentrations and an inverse modeling method. J. Geophys. Res. 108 (D15). doi:10.1029/2002JD003063.
- Gobler, C. J., J. A. M. Burkholder, T. W. Davis, M. J. Harke, T. Johengen, C. A. Stow, and D.B. deWaal. 2016. The dual role of nitrogen supply in controlling the growth and toxicity of cyanobacterial blooms. Harmful. Algae. 54:87–97. doi:10.1016/j.hal.2016.01.010.
- Goodale, C. L., J. D. Aber, and W. H. McDowell. 2000. The long-term effects of disturbance on organic and inorganic nitrogen export in the White Mountains, New Hampshire. Ecosystems (N. Y. Print). 3 (5):433–50. doi:10.1007/s100210000039.
- Goodkind, A., C. W. Tessum, J. S. Coggins, J. D. Hill, and J. D. Marshall. 2019. Fine-scale damage estimates of particulate matter air pollution reveal opportunities for location-specific mitigation of emissions. Proc. Natl. Acad. Sci. USA. 116 (18):8775–80. doi:10.1073/pnas.1816102116.
- Gordon, H., K. Sengupta, A. Rap, J. Duplissy, C. Frege, C. Williamson, M. Heinritzi, M. Simon, C. Yan, J. Almeida, et al. 2016. Reduced anthropogenic aerosol radiative forcing caused by biogenic new particle formation. Proc. Natl. Acad. Sci. USA. 113 (43):12053–58. doi:10.1073/pnas.1602360113.
- Greaver, T. L., T. J. Sullivan, J. D. Herrick, M. C. Barber, J. S. Baron, B. J. Cosby, M. E. Deerhake, R. L. Dennis, J. J. Dubois, C. L. Goodale, et al. 2012. Ecological effects of nitrogen and sulfur air pollution in the US: What do we know? Front Ecol. Environ. 10 (7):365–72. doi:10.1890/110049.
- Groffman, P. M., C. T. Driscoll, J. Duran, J. L. Campbell, L. M. Christenson, T.J. Fahey, M. C. Fisk, C. Fuss, G. E. Likens, G. Lovett, et al. 2018. Nitrogen oligiotrophication in northern hardwood forests. Biogeochemistry 141 (3):523–39. doi:10.1007/s10533-018-0445-y.
- Grulke, N. E., R. A. Minnich, T. D. Paine, S. J. Seybold, D. J. Chave, M. E. Fenn, P.J. Riggan, and A. Dunn. 2010. Plasticity in physiological traits in conifers: Implications for response to climate change in the western U.S. Environ. Pollut. 158 (6):2032–42. doi:10.1016/j.envpol.2009.12.010.
- Guo, H., R. Otjes, P. Schlag, A. Kiendler-Scharr, A. Nenes, and R. J. Weber. 2018. Effectiveness of ammonia reduction on control of fine particle nitrate. Atmos. Chem. Phys. 18 (16):12241–56. doi:10.5194/acp-18-12241-2018.
- Hand, J. L., A. J. Prenni, S. Copeland, B. A. Schichtel, and W.C. Malm. 2020. Thirty years of the Clean Air Act Amendments: Impacts on haze in remote regions of the United States (1990 - 2018). Atmos. Environ. 243:117865. doi:10.1016/j.atmosenv.2020.117865.
- Hautier, Y., P. A. Niklaus, and A. Hector. 2009. Competition for light causes plant biodiversity loss after eutrophication. Science 324 (5927):636–38. doi:10.1126/science.1169640.
- Heald, C. L., J. L. Collett Jr, T. Lee, K. B. Benedict, F. M. Schwandner, Y. Li, L. Clarisse, D. R. Hurtmans, M. Van Damme, C. Clerbaux, et al. 2012. Atmospheric ammonia and particulate inorganic nitrogen over the United States. Atmos. Chem. Phys. 12 (21):10295–312. doi:10.5194/acp-12-10295-2012.
- Henault, C., H. Bourennane, A. Ayzac, C. Ratie, N. P. A. Saby, J.-P. Cohan, T. Eglin, and C. Le Gall. 2019. Management of soil pH promotes nitrous oxide reduction and thus mitigates soil emissions of this greenhouse gas. Sci. Rep. 9 (1):20182. doi:10.1038/s41598-019-56694-3.
- Henze, D. K., J. H. Seinfeld, and D. T. Shindell. 2009. Inverse modeling and mapping US air quality influences of inorganic PM2.5 precursor emissions using the adjoint of GEOS-Chem. Atmos. Chem. Phys. 9 (16):5877–903. doi:10.5194/acp-9-5877-2009.
- Hoffman, D. K., M. J. McCarthy, A. R. Boedecker, J. A. Myers, and S. A. Newell. 2022. The role of internal nitrogen loading in supporting non-N-fixing harmful cyanobacterial blooms in the water column of a large eutrophic lake. Limnol. Oceanogr. 67 (9):2028–41. doi:10.1002/lno.12185.
- Högberg, P., R. W. Lucas, M. N. Högberg, U. Skyllberg, G. Egnell, J. Larson, and D. Binkley. 2024. What happens to trees and soils during five decades of experimental nitrogen loading? For. Ecol. Manage. 553:121644. doi:10.1016/j.foreco.2023.121644.
- Hopke, P. K., and X. Querol. 2022. Is improved vehicular NOx control leading to increased urban NH3 emissions? Environ. Sci. Technol. 56 (17):11926–27. doi:10.1021/acs.est.2c04996.
- Horne, J. R., S. Zhu, J. Montoya-Aguilera, M. L. Hinks, L.M. Wingen, S. A. Nizkorodov, and D. Dabdub. 2018. Reactive uptake of ammonia by secondary organic aerosols: Implications for air quality. Atmos. Environ. 189:1–8. doi:10.1016/j.atmosenv.2018.06.021.
- Horn, K. J., R. Q. Thomas, C. M. Clark, L. H. Pardo, M. E. Fenn, G. B. Lawrence, S. S. Perakis, E. A. H. Smithwick, D. Baldwin, S. Braun, et al. 2018. Growth and survival relationships of 71 tree species with nitrogen and sulfur deposition across the conterminous U.S. PloS One. 13 (10):e0205296. doi:10.1371/journal.pone.0205296.
- Houlton, B. Z., M. Almaraz, V. Aneja, A. T. Austin, E. Bai, K. G. Cassman, J. E. Compton, E. A. Davidson, J. W. Erisman, J. N. Galloway, et al. 2019. A world of cobenefits: Solving the global nitrogen challenge. Earth’s. Future. 7 (8):865–72. doi:10.1029/2019EF001222.
- Howarth, R. W. 1988. Nutrient limitation of net primary production in marine ecosystems. Annu. Rev. Ecol. Syst. 19 (1):89–110. doi:10.1146/annurev.es.19.110188.000513.
- Howarth, R. W. 2022. Nitrogen. In Encyclopedia of inland waters, ed. T. Mehner and K. Trockner, 2nd ed. p. 155–162. Amsterdam, Netherlands: Elsevier.
- Howarth, R. W., G. Billen, D. Swaney, A. Townsend, N. Jarworski, K. Lajtha, J. A. Downing, R. Elmgren, N. Caraco, T. Jordan, et al. 1996. Riverine inputs of nitrogen to the North Atlantic Ocean: Fluxes and human influences. Biogeochemistry 35 (1):75–139. doi:10.1007/BF02179825.
- Howarth, R. W., F. Chan, D. P. Swaney, R. M. Marino, and M. Hayn. 2021. Role of external inputs of nutrients to aquatic ecosystems in determining prevalence of nitrogen vs. phosphorus limitation of net primary productivity. Biogeochemistry. 154 (2):293–306. doi:10.1007/s10533-021-00765-z.
- Howarth, R. W., and R. Marino. 2006. Nitrogen as the limiting nutrient for eutrophication in coastal marine ecosystems: Evolving views over 3 decades. Limnol. Oceanogr. 51 (1part2):364–76. doi:10.4319/lo.2006.51.1_part_2.0364.
- Howarth, R., and H. W. Paerl. 2008. Coastal marine eutrophication: Control of both nitrogen and phosphorus is necessary. Proc. Natl. Acad. Sci 105 (49):E103. doi:10.1073/pnas.0807266106.
- Inatomi, M., T. Hajima, A. Ito, and J. Shen. 2019. Fraction of nitrous oxide production in nitrification and its effect on total soil emission: A meta-analysis and global-scale sensitivity analysis using a process-based model. PLOS One. 14 (7):e0219159. doi:10.1371/journal.pone.0219159.
- Janssens, I. A., W. Dieleman, S. Luyssaert, J. A. Subke, M. Reichstein, R. Ceulemans, P. Ciais, A. J. Dolman, J. Grace, G. Matteucci, et al. 2010. Reduction of forest soil respiration in response to nitrogen deposition. Nat. Geosci. 3 (5):315–22. doi:10.1038/ngeo844.
- Janssens, I. A., and S. Luyssaert. 2009. Nitrogen’s carbon bonus. Nat. Geosci. 2 (5):318–19. doi:10.1038/ngeo505.
- Jaworski, N. A., R. W. Howarth, and L. J. Hetling. 1997. Atmospheric deposition of nitrogen oxides onto the landscape contributes to coastal eutrophication in the northeast United States. Environ. Sci. Technol. 31 (7):1995–2004. doi:10.1021/es960803f.
- Jickells, T., A. R. Baker, J. N. Cape, S. E. Cornell, and E. Nemitz. 2013. The cycling of organic nitrogen through the atmosphere. Philos. Trans. R. Soc. Lond. B. Biol. Sci. 368 (1621):20130115. doi:10.1098/rstb.2013.0115.
- Jo, I., S. Fei, C. M. Oswalt, G. M. Domke, and R. P. Phillips. 2019. Shifts in dominant tree mycorrhizal associations in response to anthropogenic impacts. Sci. Adv. 5 (4):eaav6358. doi:10.1126/sciadv.aav6358.
- Jolly, W. M., M. A. Cochrane, P. H. Freeborn, Z. A. Holden, T.J. Brown, G. J. Williamson, and D. M. J. S. Bowman. 2015. Climate-induced variations in global wildfire danger from 1979 to 2013. Nat. Commun. 6 (1):7537. doi:10.1038/ncomms8537.
- Jones, J. A., I. F. Creed, K. L. Hatcher, R. J. Warren, M. B. Adams, M. H. Benson, E. Boose, W. A. Brown, J. L. Campbell, A. Covich, et al. 2012. Ecosystem processes and human influences regulate streamflow response to climate change at long-term ecological research sites. Bioscience. 62 (4):390–404. doi:10.1525/bio.2012.62.4.10.
- Karra, K., C. Kontgis, Z. Statman-Weil, J. C. Mazzariello, M. Mathis, and S.P. Brumby. 2021. Global land use/land cover with Sentinel 2 and deep learning, 2021 IEEE International Geoscience and Remote Sensing Symposium IGARSS, pp. 4704–707.
- Kean, A. J., D. Littlejohn, G. A. Ban-Weiss, R.A. Harley, T. W. Kirchstetter, and M. M. Lunden. 2009. Trends in on-road vehicle emissions of ammonia. Atmos. Environ. 43 (8):1565–70. doi:10.1016/j.atmosenv.2008.09.085.
- Kelly, J. M., E. A. Marais, G. Lu, J. Obszynska, M. Mace, J. White, and R. J. Leigh. 2023. Diagnosing domestic and transboundary sources of fine particulate matter (PM2.5) in UK cities using GEOS-Chem. City. Environ. Interact. 18:100100. doi:10.1016/j.cacint.2023.100100.
- Kirkby, J., J. Curtius, J. Almeida, E. Dunne, J. Duplissy, S. Ehrhart, A. Franchin, S. Gagné, L. Ickes, A. Kürten, et al. 2011. Role of sulphuric acid, ammonia and galactic cosmic rays in atmospheric aerosol nucleation. Nature 476 (7361):429–33. doi:10.1038/nature10343.
- Kong, L., X. Tang, J. Zhu, Z. Wang, Y. Pan, H. Wu, L. Wu, Q. Wu, Y. He, S. Tian, et al. 2019. Improved inversion of monthly ammonia emissions in China based on the Chinese ammonia monitoring network and ensemble kalman filter. Environ. Sci. Technol. 53 (21):12529–38. doi:10.1021/acs.est.9b02701.
- Kruit, R. J., M. Schaap, F.J. Sauter, M. C. van Zanten, and W. A. J. van Pul. 2012. Modeling the distribution of ammonia across Europe including bi-directional surface–atmosphere exchange. Biogeosciences. 9 (12):5261–77. doi:10.5194/bg-9-5261-2012.
- Kulmala, M., L. Pirjola, and J. M. Makela. 2000. Stable sulphate clusters as a source of new atmospheric particles. Nature 404 (6773):66–69. doi:10.1038/35003550.
- LaCount, M. D., R.A. Haeuber, T.R. Macy, and B.A. Murray. 2021. Reducing power sector emissions under the 1990 clean air act amendments: A retrospective on 30 years of program development and implementation. Atmos. Environ. 245:118012. doi:10.1016/j.atmosenv.2020.118012.
- Lamarque, J.F., T.C. Bond, V. Eyring, C. Granier, A. Heil, Z. Klimont, D. Lee, C. Liousse, A. Mieville, B. Owen, et al. 2010. Historical (1850-2000) gridded anthropogenic and biomass burning emissions of reactive gases and aerosols: Methodology and application. Atmos. Chem. Phys. 10 (15):7017–39. doi:10.5194/acp-10-7017-2010.
- Lamarque, J. F., F. Dentener, J. McConnell, C. U. Ro, M. Shaw, R. Vet, D. Bergmann, P. Cameron-Smith, S. Dalsoren, R. Doherty, et al. 2013. Multi-model mean nitrogen and sulfur deposition from the Atmospheric Chemistry and Climate Model Intercomparison Project (ACCMIP): Evaluation of historical and projected future changes. Atmos. Chem. Phys. 13 (16):7997–8018. doi:10.5194/acp-13-7997-2013.
- Lamsal, L. N., R. V. Martin, A. Padmanabhan, A. van Donkelaar, Q. Zhang, C.E. Sioris, K. Chance, T. P. Kurosu, and M. J. Newchurch. 2011. Application of satellite observations for timely updates to global anthropogenic NOx emission inventories. Geophys. Res. Lett. 38 (5). doi:10.1029/2010GL046476.
- Laskin, A., J. Laskin, and S. A. Nizkorodov. 2015. Chemistry of atmospheric brown carbon. Chem. Rev. 115 (10):4335–82. doi:10.1021/cr5006167.
- Lassiter, M. G., J. Lin, J. E. Compton, J. Phelan, R. D. Sabo, J. L. Stoddard, S. R. McDow, and T. L. Greaver. 2023. Shifts in the composition of nitrogen deposition in the conterminous United States are discernable in stream chemistry. Sci. Total Environ 881:163409. doi:10.1016/j.scitotenv.2023.163409.
- Laughner, J. L., J. L. Neu, D. Schimel, P. O. Wennberg, K. Barsanti, K. W. Bowman, A. Chatterjee, B. E. Croes, H. L. Fitzmaurice, D. K. Henze, et al. 2021. Societal shifts due to COVID-19 reveal large-scale complexities and feedbacks between atmospheric chemistry and climate change. Proc. Natl. Acad. Sci. USA. 118 (46):e2109481118. doi:10.1073/pnas.2109481118.
- Lawal, A. S., X. Guan, C. Liu, L. R. F. Henneman, P. Vasilakos, V. Bhogineni, R.J. Weber, A. Nenes, and A.G. Russell. 2018. Linked response of aerosol acidity and ammonia to SO2 and NOx emissions reductions in the United States. Environ. Sci. Technol. 52 (17):9861–73. doi:10.1021/acs.est.8b00711.
- LeBauer, D. S., and K. K. Treseder. 2008. Nitrogen limitation of net primary productivity in terrestrial ecosystems is globally distributed. Ecology 89 (2):371–79. doi:10.1890/06-2057.1.
- Lebo, M. E., H. W. Paerl, and B. L. Peierls. 2012. Evaluation of progress in achieving TMDL mandated nitrogen reductions in the Neuse River Basin, North Carolina. Environ. Manage. 49 (1):253–66. doi:10.1007/s00267-011-9774-5.
- Lee, H. M., F. Paulot, D. K. Henze, K. Travis, D. J. Jacob, L. H. Pardo, and B.A. Schichtel. 2016. Sources of nitrogen deposition in federal class I areas in the US. Atmos. Chem. Phys. 16 (2):525–40. doi:10.5194/acp-16-525-2016.
- Lewis Brandon, M., H. Battye William, P. Aneja Viney, H. Kim, and L. Bell Michelle. 2023. Modeling and analysis of air pollution and environmental justice: The case for North Carolina’s hog concentrated animal feeding operations. Environ. Health Perspect. 131 (8):087018. doi:10.1289/EHP11344.
- Lewis, W. M., W. A. Wurtsbaugh, and H. W. Paerl. 2011. Rationale for control of anthropogenic nitrogen and phosphorus in inland waters. Environ. Sci. Technol. 45 (24):10300–05. doi:10.1021/es202401p.
- Li, Y. 2015. Characterizing ammonia concentrations and deposition in the United States, Department of Atmospheric Sciences. Colorado State University.
- Li, Y. J., P. Liu, Z. Gong, Y. Wang, A. P. Bateman, C. Bergoend, A. K. Bertram, and S.T. Martin. 2015. Chemical reactivity and liquid/nonliquid states of secondary organic material. Environ. Sci. Technol. 49 (22):13264–74. doi:10.1021/acs.est.5b03392.
- Li, C., R. V. Martin, M. W. Shephard, K. Cady-Pereira, M. J. Cooper, J. Kaiser, C.J. Lee, L. Zhang, and D. K. Henze. 2019. Assessing the iterative finite difference mass balance and 4D-var methods to derive ammonia emissions over North America using synthetic observations. J. Geophys. Res. 124 (7):4222–36. doi:10.1029/2018JD030183.
- Li, Y., B. A. Schichtel, J. T. Walker, D. B. Schwede, X. Chen, C. M. Lehmann, M. A. Puchalski, D. A. Gay, and J. L. Collett Jr. 2016. Increasing importance of deposition of reduced nitrogen in the United States. Proc. Natl. Acad. Sci. USA. 113 (21):5874–79. doi:10.1073/pnas.1525736113.
- Li, Y., T.M. Thompson, M. Van Damme, X. Chen, K.B. Benedict, Y. Shao, D. Day, A. Boris, A. P. Sullivan, J. Ham, et al. 2017. Temporal and spatial variability of ammonia in urban and agricultural regions of northern Colorado, United States. Atmos. Chem. Phys. 17 (10):6197–213. doi:10.5194/acp-17-6197-2017.
- Liu, P., J. Ding, L. Liu, W. Xu, and X. Liu. 2022. Estimation of surface ammonia concentrations and emissions in China from the polar-orbiting infrared atmospheric sounding interferometer and the FY-4A geostationary interferometric infrared Sounder. Atmos. Chem. Phys. 22 (13):9099–110. doi:10.5194/acp-22-9099-2022.
- Liu, M., X. Huang, Y. Song, J. Tang, J. Cao, X. Zhang, Q. Zhang, S. Wang, T. Xu, L. Kang, et al. 2019. Ammonia emission control in China would mitigate haze pollution and nitrogen deposition, but worsen acid rain. Proc. Natl. Acad. Sci. USA. 116 (16):7760–65. doi:10.1073/pnas.1814880116.
- Liu, Y., J. Liggio, R. Staebler, and S. M. Li. 2015. Reactive uptake of ammonia to secondary organic aerosols: Kinetics of organonitrogen formation. Atmos. Chem. Phys. 15 (23):13569–84. doi:10.5194/acp-15-13569-2015.
- Liu, P., Y. J. Li, Y. Wang, A. P. Bateman, Y. Zhang, Z. Gong, A. K. Bertram, and S.T. Martin. 2018. Highly viscous states affect the browning of atmospheric organic particulate matter. ACS. Cent. Sci. 4 (2):207–15. doi:10.1021/acscentsci.7b00452.
- Li, C., A. van Donkelaar, M. S. Hammer, E. E. McDuffie, R. T. Burnett, J. V. Spadaro, D. Chatterjee, A. J. Cohen, J. S. Apte, V. A. Southerland, et al. 2023. Reversal of trends in global fine particulate matter air pollution. Nat. Commun. 14:5349. doi:10.1038/s41467-023-41086-z.
- Lovett, G. M., and C. L. Goodale. 2011. A new conceptual model of nitrogen saturation based on experimental nitrogen addition to an oak forest. Ecosystems (N. Y. Print) 14 (4):615–31. doi:10.1007/s10021-011-9432-z.
- Lu, Z., X. Liu, R. A. Zaveri, R. C. Easter, S. Tilmes, L. K. Emmons, F. Vitt, B. Singh, H. Wang, R. Zhang, et al. 2021. Radiative forcing of nitrate aerosols from 1975 to 2010 as simulated by MOSAIC module in CESM2-MAM4. J. Geophys. Res. 126 (17):e2021JD034809. doi:10.1029/2021JD034809.
- Luo, L., L. Ran, Q. Z. Rasool, and D. S. Cohan. 2022. Integrated modeling of U.S. agricultural soil emissions of reactive nitrogen and associated impacts on air pollution, health, and climate. Environ. Sci. Technol. 56 (13):9265–76. doi:10.1021/acs.est.1c08660.
- Lupis, S., N. Embertson, and J. Davis. 2010. Best management practices for reducing ammonia emissions - 1.631. https://extension.colostate.edu/topic-areas/agriculture/best-management-practices-for-reducing-ammonia-emissions-1-631/.
- Magnani, F., M. Mencuccini, M. Borghetti, P. Berbigier, F. Berninger, S. Delzon, A. Grelle, P. Hari, G. Jarvis, and P. Kolari, et al. 2007. The human footprint in the carbon cycle of temperate and boreal forests. Nature 447 (7146):849–51. doi:10.1038/nature05847.
- Ma, Q., X. Lin, C. Yang, B. Long, Y. Gai, and W. Zhang. 2018. The influences of ammonia on aerosol formation in the ozonolysis of styrene: Roles of criegee intermediate reactions. R. Soc. Open Sci. 5 (5):172171. doi:10.1098/rsos.172171.
- Malm, W. C. 2016. Visibility: The seeing of near and distant landscape features. 1st ed. Amsterdam, the Netherlands: Elsevier.
- Malm, W. C., B. A. Schichtel, M. G. Barna, K. A. Gebhart, M. A. Rodriguez, J. L. Collett Jr, C. M. Carrico, K. B. Benedict, A. J. Prenni, and S. M. Kreidenweis. 2013. Aerosol species concentrations and source apportionment of ammonia at Rocky Mountain National Park. J. Air Waste Manag. Assoc. 63 (11):1245–63. doi:10.1080/10962247.2013.804466.
- Martin, S. T., H. M. Hung, R. J. Park, D. J. Jacob, R. J. D. Spurr, K. V. Chance, and M. Chin. 2004. Effects of the physical state of tropospheric ammonium-sulfate-nitrate particles on global aerosol direct radiative forcing. Atmos. Chem. Phys. 4 (1):183–214. doi:10.5194/acp-4-183-2004.
- Masera, O. R., R. Bailis, R. Drigo, A. Ghilardi, and I. Ruiz-Mercado. 2015. Environmental burden of traditional bioenergy use. Annu. Rev. Environ. Resour. 40 (1):121–50. doi:10.1146/annurev-environ-102014-021318.
- Mason, R. E., J. M. Craine, N. K. Lany, M. Jonard, S. V. Ollinger, P. M. Groffman, R. W. Fulweiler, J. Angerer, Q. D. Read, P. B. Reich, et al. 2022. Evidence, causes, and consequences of declining nitrogen availability in terrestrial ecosystems. Science. 376 (6590):eabh3767. doi:10.1126/science.abh3767.
- McCarthy, M., and J. Cheatham. 2022. Rocky mountain national park air quality initiative: Air quality control commission annual briefing. Colorado Department of Public Health and Environment, U.S. National Park Service and U.S. Environmental Protection Agency, Denver, CO.
- McDonnell, T. C., C. T. Driscoll, T. J. Sullivan, D. A. Burns, B. P. Baldigo, and S. Shao. 2021. Regional target loads of atmospheric nitrogen and sulfur deposition for the protection of stream and watershed soil resources of the Adirondack Mountains, USA. Environ. Pollut. 281:117110. doi:10.1016/j.envpol.2021.117110.
- McDonnell, T. C., G. J. Reinds, G. W. W. Wamelink, P. W. Goedhart, M. Posch, T. J. Sullivan, and C. M. Clark. 2020. Threshold effects of air pollution and climate change on understory plant communities at forested sites in the eastern United States. Environ. Pollut. 262:114351. doi:10.1016/j.envpol.2020.114351.
- McDuffie, E., R. Martin, H. Yin, and M. Brauer. 2020. Global burden of disease from major air pollution sources (GBD MAPS): A global approach. Boston, MA: Health Effects Institute.
- Megaritis, A. G., C. Fountoukis, P. E. Charalampidis, C. Pilinis, and S. N. Pandis. 2013. Response of fine particulate matter concentrations to changes of emissions and temperature in Europe. Atmos. Chem. Phys. 13 (6):3423–43. doi:10.5194/acp-13-3423-2013.
- Mendoza-Villafuerte, P., R. Suarez-Bertoa, B. Giechaskiel, F. Riccobono, C. Bulgheroni, C. Astorga, and A. Perujo. 2017. NOx, NH3, N2O and PN real driving emissions from a Euro VI heavy-duty vehicle. Impact of regulatory on-road test conditions on emissions. Sci. Total Environ 609:546–55. doi:10.1016/j.scitotenv.2017.07.168.
- Moldanova, J., P. Grennfelt, A. Jonsson, W. Aas, J. Munthe, A. Rabl, D. Simpson, and T. Spranger. 2011. Nitrogen as a threat to European air quality. In The European nitrogen assessment: Sources, effects and policy perspectives, ed. G. Billen, A. Bleeker, J. W. Erisman, P. Grennfelt, B. Grizzetti, C. M. Howard, M. A. Sutton, and H. van Grinsven, 405–33. Cambridge: Cambridge University Press.
- Monchamp, M., F. R. Pick, B. E. Beisner, and R. Maranger. 2014. Nitrogen forms influence microcystin concentratoni and composition via changes in cyanobacterial community structure. PLOS ONE. 9 (1):85573. doi:10.1371/journal.pone.0085573.
- Morris, K. 2024. 2020 data summary of wet nitrogen deposition at Rocky Mountain National Park. Science Report NPS/SR—2024/109, National Park Service, Fort Collins, Colorado. doi:10.36967/2303290.
- Murray, C., A. Aravkin, P. Zheng, C. Abbafati, K. Abbas, M. Abbasi-Kangevari, F. Abd-Allah, A. Abdelalim, M. Abdollahi, I. Abdollahpour, et al. 2020. Global burden of 87 risk factors in 204 countries and territories, 1990–2019: A systematic analysis for the Global Burden of Disease Study 2019. Lancet 396 (10258):1223–49. doi:10.1016/S0140-6736(20)30752-2.
- Mushinski, R. M., R. P. Phillips, Z. C. Payne, R. B. Abney, I. Jo, S. Fei, S. E. Pusede, J.R. White, D. B. Rusch, and J. D. Raff. 2019. Microbial mechanisms and ecosystem flux estimation for aerobic NOy emissions from deciduous forest soils. Proc. Natl. Acad. Sci. USA. 116 (6):2138–45. doi:10.1073/pnas.1814632116.
- Myhre, G., D. Shindell, F. M. Bréon, W. Collins, J. Fuglestvedt, J. Huang, D. Koch, J. F. Lamarque, D. Lee, B. Mendoza, et al., Eds. 2013. Anthropogenic and natural radiative forcing. Cambridge, UK: Cambridge University Press.
- Nair, A. A., F. Yu, and G. Luo. 2023. The importance of ammonia for springtime atmospheric new particle formation and aerosol number abundance over the United States. Sci. Total Environ 863:160756. doi:10.1016/j.scitotenv.2022.160756.
- Nanus, L., D. W. Clow, J. E. Saros, V. C. Stephens, and D. H. Campbell. 2012. Mapping critical loads of nitrogen deposition for aquatic ecosystems in the Rocky Mountains, USA. Environ. Pollut. 166:125–35. doi:10.1016/j.envpol.2012.03.019.
- Nanus, L., J. A. McMurray, D. W. Clow, J.E. Saros, T. Blett, and J. J. Gurdak. 2017. Spatial variation of atmospheric nitrogen deposition and critical loads for aquatic ecosystems in the Greater Yellowstone Area. Environ. Pollut. 223:644–56. doi:10.1016/j.envpol.2017.01.077.
- Napelenok, S., D. Cohan, Y. Hu, and A. Russell. 2006. Decoupled direct 3D sensitivity analysis for particulate matter (DDM-3D/PM). Atmos. Environ. 40 (32):6112–21. doi:10.1016/j.atmosenv.2006.05.039.
- Naseem, S., and A.J. King. 2018. Ammonia production in poultry houses can affect health of humans, birds, and the environment -techniques for its reduction during poultry production. Environ. Sci. Pollut. Res. 25 (16):15269–93. doi:10.1007/s11356-018-2018-y.
- Na, K., C. Song, and D.R. Cocker. 2006. Formation of secondary organic aerosol from the reaction of styrene with ozone in the presence and absence of ammonia and water. Atmos. Environ. 40 (10):1889–900. doi:10.1016/j.atmosenv.2005.10.063.
- Na, K., C. Song, C. Switzer, and D. R. Cocker. 2007. Effect of ammonia on secondary organic aerosol formation from α-pinene ozonolysis in dry and humid conditions. Environ. Sci. Technol. 41 (17):6096–102. doi:10.1021/es061956y.
- National Atmospheric Deposition Program (NADP). 2023. Total deposition maps. https://nadp.slh.wisc.edu/committees/tdep/.
- National Research Council (NRC). 2000. Clean coastal waters: Understanding and reducing the effects of nutrient pollution. Washington, DC: National Academies Press.
- National Research Council (NRC). 2008. Ammonia acute exposure guideline levels, acute exposure guideline levels for selected airborne chemicals. Committee on Acute Exposure Guideline Levels, National Academies Press, Washington, DC.
- Natural Resource Conservation Service and U.S. Department of Agriculture. 2023b. Conservation practice standards. https://www.nrcs.usda.gov/resources/guides-and-instructions/conservation-practice-standards.
- Natural Resource Conservation Service and U.S. Department of Agriculture. 2023c. National Air Quality Site Assessment Tool. https://naqsat.tamu.edu.
- Natural Resource Conservation Service (NRCS) and U.S. Department of Agriculture. 2023a. National resource concern list and planning criteria. https://directives.sc.egov.usda.gov/OpenNonWebContent.aspx?content=49285.wba.
- Nawaz, M. O., D. K. Henze, S. C. Anenberg, C. Braun, J. Miller, and E. Pronk. 2023. A source apportionment and emission scenario assessment of PM2.5- and O3-related health impacts in G20 countries. GeoHealth 7 (e2022GH000713). doi:10.1029/2022GH000713.
- Nenes, A., S. N. Pandis, M. Kanakidou, A. G. Russell, S. Song, P. Vasilakos, and R.J. Weber. 2021. Aerosol acidity and liquid water content regulate the dry deposition of inorganic reactive nitrogen. Atmos. Chem. Phys. 21 (8):6023–33. doi:10.5194/acp-21-6023-2021.
- Nenes, A., S. N. Pandis, R. J. Weber, and A. Russell. 2020. Aerosol pH and liquid water content determine when particulate matter is sensitive to ammonia and nitrate availability. Atmos. Chem. Phys. 20 (5):3249–58. doi:10.5194/acp-20-3249-2020.
- Nicole, W. 2013. Cafos and environmental justice: The case of North Carolina. Environ. Health Perspect. 121 (6):a182–89. doi:10.1289/ehp.121-a182.
- Nilsson, J., and P. Grennfelt. 1988. Critical loads for sulphur and nitrogen. Unece/nordic council workshop report, Skokloster, Sweden. Copenhagen, p. 418.
- Nixon, S. W. 1995. Coastal marine eutrophication: A definition, social causes, and future concerns. Ophelia. 41 (1):199–219. doi:10.1080/00785236.1995.10422044.
- Nowak, J. B., J. A. Neuman, R. Bahreini, A. M. Middlebrook, J.S. Holloway, S. A. McKeen, D. D. Parrish, T. B. Ryerson, and M. Trainer. 2012. Ammonia sources in the California South Coast Air Basin and their impact on ammonium nitrate formation. Geophys. Res. Lett. 39 (7). doi: 10.1029/2012GL051197.
- Office of Inspector General (OIG). 2017. Eleven years after agreement EPA has not developed reliable emission estimation methods to determine whether animal feeding operations comply with Clean Air Act and Other statutes (17-P-0396). https://www.epaoig.gov/reports/audit/eleven-years-after-agreement-epa-has-not-developed-reliable-emission-estimation.
- Ontman, R., P.M. Groffman, C.T. Driscoll, and Z. Cheng. 2023. Surprising relationships between soil pH and microbial biomass and activity in a northern hardwood forest. Biogeochemistry 163 (3):265–77. doi:10.1007/s10533-023-01031-0.
- Paciga, A. L., I. Riipinen, and S. N. Pandis. 2014. Effect of ammonia on the volatility of organic diacids. Environ. Sci. Technol. 48 (23):13769–75. doi:10.1021/es5037805.
- Paerl, H. W. 1995. Enhancement of marine primary production by nitrogen-enriched acid rain. Nature 315 (6022):747–49. doi:10.1038/315747a0.
- Paerl, H. W. 2002. Connecting atmospheric deposition to coastal eutrophication. Environ. Sci. Technol. 36 (15):323A–6A. doi:10.1021/es022392a.
- Paerl, H. W. 2009. Controlling eutrophication along the freshwater–marine continuum: Dual nutrient (N and P) reductions are essential. Estuar. Coast. 32 (4):593–601. doi:10.1007/s12237-009-9158-8.
- Paerl, H. W., and M. A. Barnard. 2020. Mitigating the global expansion of harmful cyanobacterial blooms: Moving targets in a human- and climatically-altered world. Harmful. Algae. 96:101845. doi:10.1016/j.hal.2020.101845.
- Paerl, H.W., W. S. Gardner, K. E. Havens, A.R. Joyner, M. J. McCarthy, S. E. Newell, B. Qin, and J.T. Scott. 2016. Mitigating cyanobacterial harmful algal blooms in aquatic ecosystems impacted by climate change and anthropogenic nutrients. Harmful. Algae. 54:213–22. doi:10.1016/j.hal.2015.09.009.
- Paerl, H. W., and M. F. Piehler, Eds. 2008. Nitrogen and marine eutrophication. 2nd ed. San Diego, CA: Academic Press.
- Pai, S. J., C. L. Heald, and J. G. Murphy. 2021. Exploring the global importance of atmospheric ammonia oxidation. ACS. Earth. Space. Chem. 5 (7):1674–85. doi:10.1021/acsearthspacechem.1c00021.
- Pan, D., D. L. Mauzerall, R. Wang, X. Guo, M. Puchalski, Y. Guo, S. Song, D. Tong, A. P. Sullivan, B. A. Schichtel, et al. 2024. Regime shift in atmospheric secondary inorganic aerosol formation in the rural United States. Accepted for publication in Nature Geoscience, manuscript #NGS-2023-10- 02034-T.
- Pardo, L.H., M. Fenn, C.L. Goodale, L.H. Geiser, C.T. Driscoll, E. Allen, J. Baron, R. Bobbink, W.D. Bowman, C. Clark, et al. 2011. Effects of nitrogen deposition and empirical nitrogen critical loads for ecoregions of the United States. Ecol. Appl. 21 (8):3049–82. doi:10.1890/10-2341.1.
- Park, R. J., D. J. Jacob, B. D. Field, R. M. Yantosca, and M. Chin. 2004. Natural and transboundary pollution influences on sulfate-nitrate-ammonium aerosols in the United States: Implications for policy. J. Geophys. Res. 109 (D15). doi:10.1029/2003JD004473.
- Patel, K. F., I. J. Fernandez, S. J. Nelson, J. Malcomb, and S. A. Norton. 2020. Contrasting stream nitrate and sulfate response to recovery from experimental watershed acidification. Biogeochemistry. 151 (2):127–38. doi:10.1007/s10533-020-00711-5.
- Paulot, F., D. J. Jacob, and D. K. Henze. 2013. Sources and processes contributing to nitrogen deposition: An adjoint model analysis applied to biodiversity hotspots worldwide. Environ. Sci. Technol. 47 (7):3226–33. doi:10.1021/es3027727.
- Paulot, F., D. J. Jacob, R. W. Pinder, J. O. Bash, K. Travis, and D. K. Henze. 2014. Ammonia emissions in the United States, European Union, and China derived by high-resolution inversion of ammonium wet deposition data: Interpretation with a new agricultural emissions inventory (MASAGE_NH3). J. Geophys. Res. 119 (7):4343–64. doi:10.1002/2013JD021130.
- Paulot, F., D. Paynter, P. Ginoux, V. Naik, S. Whitburn, M. Van Damme, L. Clarisse, P. F. Coheur, and L. W. Horowitz. 2017. Gas-aerosol partitioning of ammonia in biomass burning plumes: Implications for the interpretation of spaceborne observations of ammonia and the radiative forcing of ammonium nitrate. Geophys. Res. Lett. 44 (15):8084–93. doi:10.1002/2017GL074215.
- Pavlovic, N. R., S. Y. Chang, J. Huang, K. Craig, C. Clark, K. Horn, and C. T. Driscoll. 2023. Empirical nitrogen and sulfur critical loads of U.S. tree species and their uncertainties with machine learning. Sci. Total Environ 857:159252. doi:10.1016/j.scitotenv.2022.159252.
- Phillips, S. B., S. Arya, and V. P. Aneja. 2004. Ammonia flux and dry deposition velocity from near-surface concentration gradient measurements over a grass surface in North Carolina. Atmos. Environ. 38 (21):3469–80. doi:10.1016/j.atmosenv.2004.02.054.
- Pina, A. J., R. S. Schumacher, A. S. Denning, W. B. Faulkner, J. S. Baron, J. Ham, D. S. Ojima, and J. L. Collett. 2019. Reducing wet ammonium deposition in Rocky Mountain National Park: The development and evaluation of a pilot early warning system for agricultural operations in eastern Colorado. Environ. Manag. 64 (5):626–39. doi:10.1007/s00267-019-01209-z.
- Pinder, R. W., P. J. Adams, and S. N. Pandis. 2007. Ammonia emission controls as a cost-effective strategy for reducing atmospheric particulate matter in the Eastern United States. Environ. Sci. Technol. 41 (2):380–86. doi:10.1021/es060379a.
- Pinder, R. W., N. D. Bettez, G. B. Bonan, T. L. Greaver, W. R. Wieder, W. H. Schlesinger, and E. A. Davidson. 2013. Impacts of human alteration of the nitrogen cycle in the US on radiative forcing. Biogeochemistry. 114 (1):25–40. doi:10.1007/s10533-012-9787-z.
- Pinder, R. W., E. A. Davidson, C. L. Goodale, T. L. Greaver, J. D. Herrick, and L. Liu. 2012. Climate change impacts of US reactive nitrogen. Proc. Natl. Acad. Sci. USA. 109 (20):7671–75. doi:10.1073/pnas.1114243109.
- Pinder, R. W., J. T. Walker, J. O. Bash, K. E. Cady-Pereira, D. K. Henze, M. Luo, G. B. Osterman, and M. W. Shephard. 2011. Quantifying spatial and temporal variability in atmospheric ammonia with in situ and space-based observations. Geophys. Res. Lett. 38:L04802.
- Pleim, J. E., J. O. Bash, J. T. Walker, and E. J. Cooter. 2013. Development and evaluation of an ammonia bidirectional flux parameterization for air quality models. J. Geophys. Res. 118 (9):3794–806. doi:10.1002/jgrd.50262.
- Poor, N. D., L. M. Cross, and R. L. Dennis. 2013. Lessons learned from the Bay Region Atmospheric Chemistry Experiment (BRACE) and implications for nitrogen management of Tampa Bay. Atmos. Environ. 70:75–83. doi:10.1016/j.atmosenv.2012.12.030.
- Pope Iii, C. A., and D. W. Dockery. 2006. Health effects of fine particulate air pollution: Lines that connect. J. Air Waste Manag. Assoc. 56 (6):709–42. doi:10.1080/10473289.2006.10464485.
- Porter, E., T.F. Blett, D. Potter, and C. Huber. 2005. Protecting resources on federal lands: Implications of critical loads for atmospheric deposition of nitrogen and sulfur. Bioscience 55 (7):603–12. doi:10.1641/0006-3568(2005)055[0603:PROFLI]2.0.CO;2.
- Pozzer, A., A. P. Tsimpidi, V. A. Karydis, A. de Meij, and J. Lelieveld. 2017. Impact of agricultural emission reductions on fine-particulate matter and public health. Atmos. Chem. Phys. 17 (20):12813–26. doi:10.5194/acp-17-12813-2017.
- Preble, C. V., R. A. Harley, and T. W. Kirchstetter. 2019. Control technology-driven changes to in-use heavy-duty diesel truck emissions of nitrogenous species and related environmental impacts. Environ. Sci. Technol. 53 (24):14568–76. doi:10.1021/acs.est.9b04763.
- Pruitt, E. S. 2017. Letter to Mr. Tom Frantz, president, association of irritated residents. Washington, DC: U.S. Environmental Protection Agency.
- Puchalski, M. A., M. E. Sather, J. T. Walker, C. M. B. Lehmann, D. A. Gay, J. Mathew, and W. P. Robarge. 2011. Passive ammonia monitoring in the United States: Comparing three different sampling devices. J. Environ. Monit. 13 (11):3156–67. doi:10.1039/C1EM10553A.
- Puchalski, M.A., J.T. Walker, G.M. Beachley, M.A. Zondlo, K.B. Benedict, R.H. Grant, B.A. Schichtel, C.M. Rogers, A.B. Leytem, J. Rice, et al. 2019. Need for improved monitoring of spatial and temporal trends of reduced nitrogen. EM Magazine.
- Pye, H. O. T., A. Nenes, B. Alexander, A. P. Ault, M. C. Barth, S. L. Clegg, J. L. Collett Jr, K. M. Fahey, C. J. Hennigan, H. Herrmann, et al. 2020. The acidity of atmospheric particles and clouds. Atmos. Chem. Phys. 20 (8):4809–88. doi:10.5194/acp-20-4809-2020.
- Rabalais, N. N., R. E. Turner, Q. Dortch, D. Justic, V. J. Bierman, and W. J. Wiseman. 2002. Nutrient-enhanced productivity in the northern Gulf of Mexico: Past, present and future. Hydrobiologia. 475 (1):39–63. doi:10.1023/A:1020388503274.
- Rao, L. E., E. B. Allen, and T. Meixner. 2010. Risk-based determination of critical nitrogen deposition loads for fire spread in southern California deserts. Ecol. Appl. 20 (5):1320–35. doi:10.1890/09-0398.1.
- Requia, W. J., B. A. Coull, and P. Koutrakis. 2019. The impact of wildfires on particulate carbon in the western USA. Atmos. Environ. 213:1–10. doi:10.1016/j.atmosenv.2019.05.054.
- Rhodes, C., A. Bingham, A. M. Heard, J. Hewitt, J. Lynch, R. Waite, and M. D. Bell. 2017. Diatoms to human uses: Linking nitrogen deposition, aquatic eutrophication, and ecosystem services. Ecosphere. 8 (7):e01858. doi:10.1002/ecs2.1858.
- Rodgers, C. D. 2000. Inverse methods for atmospheric sounding. Singapore: World Scientific.
- Rosa, L., and P. Gabrielli. 2023. Energy and food security implications of transitioning synthetic nitrogen fertilizers to net-zero emissions. Environ. Res. Lett. 18 (1):014008. doi:10.1088/1748-9326/aca815.
- Roy, P.-O., M. Huijbregts, L. Deschnes, and M. Margni. 2012. Spatially-differentiated atmospheric source-receptor relationships for nitrogen oxides, sulfur oxides and ammonia emissions at the global scale for life cycle impact assessment. Atmos. Environ. 62:74–81. doi:10.1016/j.atmosenv.2012.07.069.
- Rubin, H. J., J. S. Fu, F. Dentener, R. Li, K. Huang, and H. Fu. 2023. Global nitrogen and sulfur deposition mapping using a measurement-model fusion approach. Atmos. Chem. Phys. 23 (12):7091–102. doi:10.5194/acp-23-7091-2023.
- Saylor, R., L. Myles, D. Sibble, J. Caldwell, and J. Xing. 2015. Recent trends in gas-phase ammonia and PM2.5 ammonium in the Southeast United States. J. Air Waste Manag. Assoc. 65 (3):347–57. doi:10.1080/10962247.2014.992554.
- Schiferl, L. D., C. L. Heald, M. Van Damme, L. Clarisse, C. Clerbaux, P. F. Coheur, J. B. Nowak, J. A. Neuman, S. C. Herndon, J. R. Roscioli, et al. 2016. Interannual variability of ammonia concentrations over the United States: Sources and implications. Atmos. Chem. Phys. 16 (18):12305–28. doi:10.5194/acp-16-12305-2016.
- Schindler, D. W., R. E. Hecky, D. L. Findlay, M. P. Stainton, B. R. Parker, M. Paterson, K. G. Beaty, M. Lyng, and S. E. M. Kasian. 2008. Eutrophication of lakes cannot be controlled by reducing nitrogen input: Results of a 37 year whole ecosystem experiment. Proc. Natl. Acad. Sci. USA. 105 (32):11254–58. doi:10.1073/pnas.0805108105.
- Schlesinger, W. H., and E. S. Bernhardt. 2020. Biogeochemistry: An analysis of global change. Oxford: Academic Press.
- Seinfeld, J. H., and S. N. Pandis. 2016. Atmospheric chemistry and physics: From air pollution to climate change. Hoboken: Wiley.
- Shao, S., C. T. Driscoll, T. J. Sullivan, D. A. Burns, B. Baldigo, G. B. Lawrence, and T. C. McDonnell. 2020. The response of stream ecosystems in the Adirondack region of New York to historical and future changes in atmospheric deposition of sulfur and nitrogen. Sci. Total Environ. 716:137113. doi:10.1016/j.scitotenv.2020.137113.
- Shephard, M. W., E. Dammers, K. E. Cady-Pereira, S. K. Kharol, J. Thompson, Y. Gainariu-Matz, J. Zhang, C.A. McLinden, A. Kovachik, M. Moran, et al. 2020. Ammonia measurements from space with the Cross-track Infrared Sounder: Characteristics and applications. Atmos. Chem. Phys. 20 (4):2277–302. doi:10.5194/acp-20-2277-2020.
- Sheppard, E. A. 2023. CASAC Review of the EPA’s policy assessment for the review of the secondary National Ambient Air Quality Standards for oxides of nitrogen, oxides of sulfur and particulate matter (External Review Draft - May 2023). https://casac.epa.gov/ords/sab/r/sab_apex/casac/home.
- Shindell, D. T., J. F. Lamarque, M. Schulz, M. Flanner, C. Jiao, M. Chin, P. J. Young, Y. H. Lee, L. Rotstayn, N. Mahowald, et al. 2013. Radiative forcing in the ACCMIP historical and future climate simulations. Atmos. Chem. Phys. 13 (6):2939–74. doi:10.5194/acp-13-2939-2013.
- Shonkwiler, S., and J. Ham. 2018. Ammonia emissions from a beef feedlot: Comparison of inverse modeling techniques using long-path and point measurements of fenceline NH3. Agric. For. Meteorol. 258:29–42. doi:10.1016/j.agrformet.2017.10.031.
- Silvern, R. F., D. J. Jacob, P. S. Kim, E. A. Marais, J. R. Turner, P. Campuzano-Jost, and J. L. Jimenez. 2017. Inconsistency of ammonium - sulfate aerosol ratios with thermodynamic models in the eastern US: A possible role of organic aerosol. Atmos. Chem. Phys. 17 (8):5107–18. doi:10.5194/acp-17-5107-2017.
- Simkin, S. M., E. B. Allen, W. D. Bowman, C. M. Clark, J. Belnap, M. L. Brooks, B. S. Cade, S. L. Collins, L. H. Geiser, F. S. Gilliam, et al. 2016. Conditional vulnerability of plant diversity to atmospheric nitrogen deposition across the United States. Proc. Natl. Acad. Sci. USA. 113 (15):4086–91. doi:10.1073/pnas.1515241113.
- Sitwell, M., M. W. Shephard, Y. Rochon, K. Cady-Pereira, and E. Dammers. 2022. An ensemble-variational inversion system for the estimation of ammonia emissions using CrIS satellite ammonia retrievals. Atmos. Chem. Phys. 22 (10):6595–624. doi:10.5194/acp-22-6595-2022.
- Skorupka, M., and A. Nosalewicz. 2021. Ammonia Volatilization from Fertilizer Urea—A new challenge for agriculture and industry in view of growing global demand for food and energy crops. Agriculture 11 (9):822. doi:10.3390/agriculture11090822.
- Smil, V. 2001. Enriching the Earth: Fritz Haber, Carl Bosch, and the transformation of world food production. Cambridge, USA: The MIT Press.
- Solomon, P.A., D. Crumpler, J.B. Flanagan, R.K.M. Jayanty, E.E. Rickman, and C.E. McDade. 2014. U.S. national PM2.5 chemical speciation monitoring networks—CSN and IMPROVE: Description of networks. J. Air & Waste Manag. Assoc. 64 (12):1410–38. doi:10.1080/10962247.2014.956904.
- Sorooshian, A., S. M. Murphy, S. Hersey, H. Gates, L. T. Padro, A. Nenes, F.J. Brechtel, H. Jonsson, R. C. Flagan, and J. H. Seinfeld. 2008. Comprehensive airborne characterization of aerosol from a major bovine source. Atmos. Chem. Phys. 8 (17):5489–520. doi:10.5194/acp-8-5489-2008.
- South Coast Air Quality Management District (SCAQMD). 2020. Final south coast air basin attainment plan for 2006 24-Hour PM2.5 standard. https://www.federalregister.gov/documents/2023/10/12/2023-22518/air-plan-approval-california-south-coast-air-quality-management-district.
- Spracklen, D. V., K. J. Pringle, K. S. Carslaw, M. P. Chipperfield, and G. W. Mann. 2005. A global off-line model of size-resolved aerosol microphysics: II. Identification of key uncertainties. Atmos. Chem. Phys. 5 (12):3233–50. doi:10.5194/acp-5-3233-2005.
- Stevens, C. J. 2016. How long do ecosystems take to recover from atmospheric nitrogen deposition? Biol. Conserv. 200:160–67. doi:10.1016/j.biocon.2016.06.005.
- Stevens, C. J., P. Manning, L. J. L. van den Berg, M. C. C. de Graaf, G. W. W. Wamelink, A. W. Boxman, A. Bleeker, P. Vergeer, M. Arroniz-Crespo, J. Limpens, et al. 2011. Ecosystem responses to reduced and oxidized nitrogen inputs in European terrestrial habitats. Environ. Pollut. 159 (3):665–76. doi:10.1016/j.envpol.2010.12.008.
- Stoddard, J. L., J. S. Kahl, R. Haeuber, S. G. Paulsen, R. Birnbaum, F. A. Deviney, J.R. Webb, D. R. DeWalle, W. Sharpe, C. T. Driscoll, et al. 2004. Have U.S. surface waters responded to the 1990 clean air act amendments? Environ. Sci. Technol. 38 (24):484A–90A. doi:10.1021/es040686l.
- Store, J. 2023. Council reaches agreement on amendment to industrial emissions directive. https://www.consilium.europa.eu/en/press/press-releases/2023/03/16/council-reaches-agreement-on-amendments-to-industrial-emissions-directive/.
- Sun, J., J. S. Fu, and K. Huang. 2016. Organic nitrates and other oxidized nitrogen compounds contribute significantly to the total nitrogen depositions in the United States. Proc. Natl. Acad. Sci. USA. 113 (31):E4433–34. doi:10.1073/pnas.1608717113.
- Sun, K., L. Tao, D.J. Miller, D. Pan, L. M. Golston, M. A. Zondlo, R. J. Griffin, H. W. Wallace, Y. J. Leong, M. M. Yang, et al. 2017. Vehicle emissions as an important urban ammonia source in the United States and China. Environ. Sci. Technol. 51 (4):2472–81. doi:10.1021/acs.est.6b02805.
- Sutton, M. A., J. K. Burkhardt, D. Guerin, E. Nemitz, and D. Fowler. 1998. Development of resistance models to describe measurements of bi-directional ammonia surface -atmosphere exchange. Atmos. Environ. 32 (3):473–80. doi:10.1016/S1352-2310(97)00164-7.
- Sutton, M. A., S. Reis, S. N. Riddick, U. Dragosits, E. Nemitz, M. R. Theobald, Y.S. Tang, C.F. Braban, M. Vieno, A. J. Dore, et al. 2013. Towards a climate-dependent paradigm of ammonia emission and deposition. Philos. Trans. R. Soc. Lond. B. Biol. Sci. 368 (1621):20130166. doi:10.1098/rstb.2013.0166.
- Sutton, M. A., D. Simpson, P.E. Levy, R.I. Smith, S. Reis, M. Van Oijen, and W. I. M. De Vries. 2008. Uncertainties in the relationship between atmospheric nitrogen deposition and forest carbon sequestration. Global Change Biol. 14 (9):2057–63. doi:10.1111/j.1365-2486.2008.01636.x.
- Talluto, M. V., and K. N. Suding. 2008. Historical change in coastal sage scrub in southern California, USA in relation to fire frequency and air pollution. Landscape Ecol. 23 (7):803–15. doi:10.1007/s10980-008-9238-3.
- Tan, J., J.S. Fu, F. Dentener, J. Sun, L. Emmons, S. Tilmes, K. Sudo, J. Flemming, J. E. Jonson, S. Gravel, et al. 2018. Multi-model study of HTAP II on sulfur and nitrogen deposition. Atmos. Chem. Phys. 18 (9):6847–66. doi:10.5194/acp-18-6847-2018.
- Tan, J., J. S. Fu, and J. H. Seinfeld. 2020. Ammonia emission abatement does not fully control reduced forms of nitrogen deposition. Proc. Natl. Acad. Sci. 117 (18):9771–75. doi:10.1073/pnas.1920068117.
- Tao, L., K. Sun, D.J. Miller, D. Pan, L. M. Golston, and M. A. Zondlo. 2015. Low-power, open-path mobile sensing platform for high-resolution measurements of greenhouse gases and air pollutants. Appl. Phys. B. 119 (1):153–64. doi:10.1007/s00340-015-6069-1.
- Thakrar, S. K., S. Balasubramanian, P.J. Adams, I. S. M. L. Azevedo, N. Z. Muller, S. N. Pandis, S. Polasky, C. A. Pope III, A.L. Robinson, J. S. Apte, et al. 2020. Reducing Mortality from Air Pollution in the United States by targeting specific emission sources. Environ. Sci. Technol. Lett. 7 (9):639–45. doi:10.1021/acs.estlett.0c00424.
- Thomas, R., C. Canham, K. Weathers, and C. Goodale. 2010. Increased tree carbon storage in response to nitrogen deposition in the US. Nat. Geosci. 3 (1):13–17. doi:10.1038/ngeo721.
- Thompson, T. M., M. A. Rodriguez, M. G. Barna, K. A. Gebhart, J. L. Hand, D. E. Day, W. C. Malm, K. B. Benedict, J. L. Collett Jr, and B.A. Schichtel. 2015. Rocky Mountain National Park reduced nitrogen source apportionment. J. Geophys. Res. 120 (9):4370–84. doi:10.1002/2014JD022675.
- Thomson, A. M., K. V. Calvin, S. J. Smith, G. P. Kyle, A. Volke, P. Patel, S. Delgado-Arias, B. Bond-Lamberty, M. A. Wise, L. E. Clarke, et al. 2011. RCP4.5: A pathway for stabilization of radiative forcing by 2100. Clim. Change 109 (1–2):77. doi:10.1007/s10584-011-0151-4.
- Thornhill, G. D., W. J. Collins, R. J. Kramer, D. Olivié, R. B. Skeie, F. M. O’Connor, N. L. Abraham, R. Checa-Garcia, S. E. Bauer, M. Deushi, et al. 2021. Effective radiative forcing from emissions of reactive gases and aerosols – a multi-model comparison. Atmos. Chem. Phys. 21 (2):853–74. doi:10.5194/acp-21-853-2021.
- Thunis, P., A. Clappier, M. Beekmann, J.P. Putaud, C. Cuvelier, J. Madrazo, and A. de Meij. 2021. Non-linear response of PM2.5 to changes in NOx and NH3 emissions in the Po basin (Italy): Consequences for air quality plans. Atmos. Chem. Phys. 21 (12):9309–27. doi:10.5194/acp-21-9309-2021.
- Tomich, T. P., S. B. Brodt, R. A. Dahlgren, and K. M. Scow. 2016. The California nitrogen assessment: Challenges and solutions for people, agriculture, and the environment. Oakland, CA: University of California Press.
- Tomsche, L., F. Piel, T. Mikoviny, C. J. Nielsen, H. Guo, P. Campuzano-Jost, B.A. Nault, M. K. Schueneman, J. L. Jimenez, H. Halliday, et al. 2023. Measurement report: Emission factors of NH3 and NHx for wildfires and agricultural fires in the United States. Atmos. Chem. Phys. 23 (4):2331–43. doi:10.5194/acp-23-2331-2023.
- Toro, C., D. Sonntag, J. Bash, G. Burke, B. N. Murphy, K. M. Seltzer, H. Simon, M. W. Shephard and K. E. Cady-Pereira. 2024. Sensitivity of air quality to vehicle ammonia emissions in the United States. Atmos. Environ. 327:120484. doi:10.1016/j.atmosenv.2024.120484.
- Townhill, B. L., J. Tinker, M. Jones, S. Pitois, V. Creach, S. D. Simpson, S. Dye, E. Bear, and J. K. Pinnegar. 2018. Harmful algal blooms and climate change: Exploring future distribution changes. ICES J. Mar. Sci. 75 (6):1882–93. doi:10.1093/icesjms/fsy113.
- Trainer, V. L., S. K. Moore, G. Hallegraeff, R. M. Kudela, A. Clement, J.I. Mardones, and W. P. Cochlan. 2020. Pelagic harmful algal blooms and climate change: Lessons from nature’s experiments with extremes. Harmful. Algae. 91:101591. doi:10.1016/j.hal.2019.03.009.
- Treseder, K. K. 2004. A meta-analysis of mycorrhizal responses to nitrogen, phosphorus, and atmospheric CO2 in field studies. New Phytol. 164 (2):347–55. doi:10.1111/j.1469-8137.2004.01159.x.
- Tsimpidi, A. P., V. A. Karydis, and S. N. Pandis. 2007. Response of inorganic fine particulate matter to emission changes of sulfur dioxide and ammonia: The Eastern United States as a case study. J. Air Waste Manag. Assoc. 57 (12):1489–98. doi:10.3155/1047-3289.57.12.1489.
- Turner, A. J., D. K. Henze, R. V. Martin, and A. Hakami. 2012. The spatial extent of source influences on modeled column concentrations of short-lived species. Geophys. Res. Lett. 39 (12). doi: 10.1029/2012GL051832.
- UNECE. 1999. Protocol to the 1979 convention on long-range transboundary air pollution to abate acidification, eutrophication and ground-level ozone. https://unece.org/environment-policy/air/protocol-abate-acidification-eutrophication-and-ground-level-ozone.
- UNEP. 2013. Drawing down N2O to protect climate and the ozone layer: A UNEP synthesis report. https://www.unep.org/resources/report/drawing-down-n2o-protect-climate-and-ozone-layer-unep-synthesis-report.
- United Nations Economic Commission for Europe (UNECE). 2012. 1999 protocol to abate acidification, eutrophication and ground-level ozone to the convention on long-range transboundary air pollution, as amended on 4 May 2012. https://unece.org/environment-policy/air/protocol-abate-acidification-eutrophication-and-ground-level-ozone;.
- Updyke, K. M., T. B. Nguyen, and S. A. Nizkorodov. 2012. Formation of brown carbon via reactions of ammonia with secondary organic aerosols from biogenic and anthropogenic precursors. Atmos. Environ. 63:22–31. doi:10.1016/j.atmosenv.2012.09.012.
- USDA. 2023. Environmental quality incentives program (10601-0008-31(IN1)). In Natural Resources Conservation Service ed.https://www.nrcs.usda.gov/programs-initiatives/eqip-environmental-quality-incentives.
- U.S. EPA. 2008. Integrated Science Assessment (ISA) for oxides of nitrogen and sulfur ecological criteria. Washington, DC: U.S. Environmental Protection Agency.
- U.S. EPA. 2010. Chesapeake Bay total maximum daily load or nitrogen, phosphorus and sediment. https://www.epa.gov/chesapeake-bay-tmdl/chesapeake-bay-tmdl-document.
- U.S. EPA. 2019a. Guidance on regional haze state implementation plans for the second implementation period. Office of Air Quality Planning and Standards, U.S. Environmental Protection Agency, Research Triangle Park, NC.
- U.S. EPA. 2019b. Integrated science assessment for particulate matter, EPA/600/R-19/188. Office of Research and Development, U.S. Environmental Protection Agency, Washington, DC.
- U.S. EPA. 2020. Integrated Science Assessment (ISA) for oxides of nitrogen, oxides of sulfur and particulate matter ecological criteria. Washington, DC: U.S. Environmental Protection Agency.
- U.S. EPA. 2022a. Policy assessment for the reconsideration of the national Ambient Air Quality Standards for particulate matter, EPA-452/R-22-004. Office of Air Quality Planning and Standards, U.S. Environmental Protection Agency, Research Triangle Park, NC.
- U.S. EPA. 2022b. Supplement to the 2019 Integrated Science Assessment for particulate matter, EPA/600/R-22/028. Office of Research and Development, U.S. Environmental Protection Agency, Research Triangle Park, NC.
- U.S. EPA. 2023a. Epidemiology and health effects of cyanobacteria research. https://www.epa.gov/water-research/epidemiology-and-health-effects-cyanobacteria-research.
- U.S. EPA. 2023b. National emission inventory emissions trends report. https://www.epa.gov/air-emissions-inventories/air-pollutant-emissions-trends-data.
- U.S. EPA. 2023c. New source performance standards. Accessed October 13, 2023. https://www.epa.gov/stationary-sources-air-pollution/new-source-performance-standards.
- U.S. EPA. 2023d. NPDES Nutrient Data Tables, 2016 data. Accessed September 23, 2023. https://www.epa.gov/npdes/npdes-nutrient-data-tables.
- U.S. EPA. 2023e. MOVES4: Latest version of motor vehicle emission simulator. Ann Arbor, MI: Office of Transportation and Air Quality, U.S. Environmental Protection Agency.
- U.S. EPA-SAB. 2011. Reactive nitrogen in the United States: An analysis of inputs, flows, consequences and management options. A report of the EPA Science Advisory Board.
- Valiela, I., C. Owens, E. Elmstrom, and J. Lloret. 2016. Eutrophication of cape cod estuaries: Effect of decadal changes in global-driven atmospheric and local-scale wastewater nutrient loads. Mar. Pollut. Bull. 110 (1):309–15. doi:10.1016/j.marpolbul.2016.06.047.
- Van Damme, M., L. Clarisse, S. Whitburn, J. Hadji-Lazaro, D. Hurtmans, C. Clerbaux, and P.-F. O. Coheur. 2018. Industrial and agricultural ammonia point sources exposed. Nature. 564 (7734):99–103. doi:10.1038/s41586-018-0747-1.
- Van Den Berg, L. J. L., E. Dorland, P. Vergeer, M. A. C. Hart, R. Bobbink, and J. G. M. Roelofs. 2005. Decline of acid-sensitive plant species in heathland can be attributed to ammonium toxicity in combination with low pH. New Phytol. 166 (2):551–64. doi:10.1111/j.1469-8137.2005.01338.x.
- van der Graaf, S., E. Dammers, A. Segers, R. Kranenburg, M. Schaap, M. W. Shephard, and J. W. Erisman. 2022. Data assimilation of CrIS NH3 satellite observations for improving spatiotemporal NH3 distributions in LOTOS-EUROS. Atmos. Chem. Phys. 22 (2):951–72. doi:10.5194/acp-22-951-2022.
- van Vuuren, D. P., J. Edmonds, M. Kainuma, K. Riahi, A. Thomson, K. Hibbard, G.C. Hurtt, T. Kram, V. Krey, J.-F. Lamarque, et al. 2011. The representative concentration pathways: An overview. Clim. Change. 109 (1):5. doi:10.1007/s10584-011-0148-z.
- Vasilakos, P., A. Russell, R. Weber, and A. Nenes. 2018. Understanding nitrate formation in a world with less sulfate. Atmos. Chem. Phys. 18 (17):12765–75. doi:10.5194/acp-18-12765-2018.
- Vayenas, D. V., S. Takahama, C. I. Davidson, and S. N. Pandis. 2005. Simulation of the thermodynamics and removal processes in the sulfate-ammonia-nitric acid system during winter: Implications for PM2.5 control strategies. J. Geophys. Res. 110 (D7). doi:10.1029/2004JD005038.
- Vitousek, P. M., J. Aber, S. E. Bayley, R. W. Howarth, G. E. Likens, P. A. Matson, D. W. Schindler, W. H. Schlesinger, and G. D. Tilman. 1997. Human alteration of the global nitrogen cycle: Causes and consequences. Ecol. Appl. 7 (3):737–50. doi:10.1890/1051-0761(1997)007[0737:HAOTGN]2.0.CO;2.
- Vitousek, P. M., and R. W. Howarth. 1991. Nitrogen limitation on land and in the sea: How can it occur? Biogeochemistry. 13 (2):87–115. doi:10.1007/BF00002772.
- von Bobrutzki, K., C. F. Braban, D. Famulari, S. K. Jones, T. Blackall, T. E. L. Smith, M. Blom, H. Coe, M. Gallagher, M. Ghalaieny, et al. 2010. Field inter-comparison of eleven atmospheric ammonia measurement techniques. Atmos. Meas. Tech. 3 (1):91–112. doi:10.5194/amt-3-91-2010.
- Walker, J. T., G. M. Beachley, H. M. Amos, J.S. Baron, J. Bash, R. Baumgardner, M. D. Bell, K. B. Benedict, X. Chen, D. W. Clow, et al. 2019. Science needs for continued development of total nitrogen deposition budgets in the United States, U.S. Environmental Protection Agency, Washington, DC.
- Walker, J. T., G. Beachley, L. Zhang, K. B. Benedict, B. C. Sive, and D. B. Schwede. 2020. A review of measurements of air-surface exchange of reactive nitrogen in natural ecosystems across North America. Sci. Total Environ. 698:133975. doi:10.1016/j.scitotenv.2019.133975.
- Walker, J. T., X. Chen, Z. Wu, D. Schwede, R. Daly, A. Djurkovic, A. C. Oishi, E. Edgerton, J. Bash, J. Knoepp, et al. 2023. Atmospheric deposition of reactive nitrogen to a deciduous forest in the southern Appalachian Mountains. Biogeosciences. 20 (5):971–95. doi:10.5194/bg-20-971-2023.
- Wang, J., D. J. Jacob, and S. T. Martin. 2008. Sensitivity of sulfate direct climate forcing to the hysteresis of particle phase transitions. J. Geophys. Res. 113 (D11). doi:10.1029/2007JD009368.
- Wang, X. Q., C. G. Liu, D. Neff, P. F. Fulvio, R. T. Mayes, A. Zhamu, Q. Fang, G. R. Chen, H. M. Meyer, B. Z. Jang, et al. 2013. Nitrogen-enriched ordered mesoporous carbons through direct pyrolysis in ammonia with enhanced capacitive performance. J. Mater. Chem.A 1 (27):7920–26. doi:10.1039/C3ta11342f.
- Wang, R., D. Pan, X. Guo, K. Sun, L. Clarisse, M. Van Damme, P.F. Coheur, C. Clerbaux, M. Puchalski, and M. A. Zondlo. 2023. Bridging the spatial gaps of the Ammonia Monitoring Network using satellite ammonia measurements. EGUsphere. 2023:1–33. doi:10.5194/egusphere-2023-190.
- Wang, S., J. Xing, C. Jang, Y. Zhu, J.S. Fu, and J. Hao. 2011. Impact assessment of ammonia emissions on inorganic aerosols in East China using response surface modeling technique. Environ. Sci. Technol. 45 (21):9293–300. doi:10.1021/es2022347.
- Watson, J. G. 2002. Visibility: Science and regulation. J. Air Waste Manag. Assoc. 52 (6):628–713. doi:10.1080/10473289.2002.10470813.
- Weber, R. J., H. Guo, A. G. Russell, and A. Nenes. 2016. High aerosol acidity despite declining atmospheric sulfate concentrations over the past 15 years. Nat. Geosci. 9 (4):282–85. doi:10.1038/ngeo2665.
- Wentworth, G. R., J.G. Murphy, K. B. Benedict, E. J. Bangs, and J.L. Collett Jr. 2016. The role of dew as a night-time reservoir and morning source for atmospheric ammonia. Atmos. Chem. Phys. 16 (11):7435–49. doi:10.5194/acp-16-7435-2016.
- West, J. J., A. S. Ansari, and S. N. Pandis. 1999. Marginal PM25: Nonlinear aerosol mass response to sulfate reductions in the Eastern United States. J. Air Waste Manag. Assoc. 49 (12):1415–24. doi:10.1080/10473289.1999.10463973.
- Whitall, D., B. Hendrickson, and H. W. Paerl. 2003. Importance of atmospherically deposited nitrogen to the annual nitrogen budget of the Neuse River estuary, North Carolina. Environ. Int. 29 (2–3):393–99. doi:10.1016/S0160-4120(02)00175-7.
- Whitburn, S., M. Van Damme, J. W. Kaiser, G. R. van der Werf, S. Turquety, D. Hurtmans, L. Clarisse, C. Clerbaux, and P. F. Coheur. 2015. Ammonia emissions in tropical biomass burning regions: Comparison between satellite-derived emissions and bottom-up fire inventories. Atmos. Environ. 121:42–54. doi:10.1016/j.atmosenv.2015.03.015.
- Wilkins, K., C. Clark, and J. Aherne. 2022. Ecological thresholds under atmospheric nitrogen deposition for 1200 herbaceous species and 24 communities across the United States. Global Change Biol. 28 (7):2381–95. doi:10.1111/gcb.16076.
- Williams, J. J., J. A. Lynch, J. E. Saros, and S. G. Labou. 2017. Critical loads of atmospheric N deposition for phytoplankton nutrient limitation shifts in western U.S. mountain lakes. Ecosphere. 8 (10):e01955. doi:10.1002/ecs2.1955.
- Wing, S., R. A. Horton, N. Muhammad, G. R. Grant, M. Tajik, and K. Thu. 2008. Integrating epidemiology, education, and organizing for environmental justice: Community health effects of industrial hog operations. Am. J. Public Health.98 (8):1390–97. doi:10.2105/AJPH.2007.110486.
- Wing, S., and J. Johnston. 2014. Industrial hog operations in North Carolina disproportionately impact African-Americans. Hispanics and American Indians. http://www.ncpolicywatch.com/wp-content/uploads/2014/09/UNC-Report.pdf.
- World Health Organization. 2021. New WHO global air quality guidelines aim to save millions of lives from air pollution. https://www.who.int/news/item/22-09-2021-new-who-global-air-quality-guidelines-aim-to-save-millions-of-lives-from-air-pollution.
- Wurtsbaugh, W. A., H. W. Paerl, and W.K. Dodds. 2019. Nutrients, eutrophication and harmful algal blooms along the freshwater to marine continuum. Wiley Interdisciplinary Reviews 6 (5). doi:10.1002/wat2.1373.
- Wyer, K. E., D. B. Kelleghan, V. Blanes-Vidal, G. Schauberger, and T. P. Curran. 2022. Ammonia emissions from agriculture and their contribution to fine particulate matter: A review of implications for human health. J. Environ. Health. 323:116285. doi:10.1016/j.jenvman.2022.116285.
- Xu, L., and J.E. Penner. 2012. Global simulations of nitrate and ammonium aerosols and their radiative effects. Atmos. Chem. Phys. 12 (20):9479–504. doi:10.5194/acp-12-9479-2012.
- Xu, R., H. Tian, S. Pan, S. A. Prior, Y. Feng, W. D. Batchelor, J. Chen, and J. Yang. 2019. Global ammonia emissions from synthetic nitrogen fertilizer applications in agricultural systems: Empirical and process-based estimates and uncertainty. Global Change Biol. 25 (1):314–26. doi:10.1111/gcb.14499.
- Xu, X., J. Wang, D. K. Henze, W. Qu, and M. Kopacz. 2013. Constraints on aerosol sources using GEOS-Chem adjoint and MODIS radiances, and evaluation with multisensor (OMI, MISR) data. J. Geophys. Res. 118 (12):6396–413. doi:10.1002/jgrd.50515.
- Xu, W., Y. Zhao, Z. Wen, Y. Chang, Y. Pan, Y. Sun, X. Ma, Z. Sha, Z. Li, J. Kang, et al. 2022. Increasing importance of ammonia emission abatement in PM2.5 pollution control. Sci. Bull. 67 (17):1745–49. doi:10.1016/j.scib.2022.07.021.
- Yanai, R. D., M. A. Vadeboncoeur, S. P. Hamburg, M. A. Arthur, C. Fuss, P. M. Groffman, T. G. Siccama, and C. T. Driscoll. 2013. From missing source to missing sink: Long-term changes in the nitrogen budget of a northern hardwood forest. Environ. Sci. Technol. 47 (20):11440–48. doi:10.1021/es4025723.
- Yao, X., and L. Zhang. 2019. Causes of large increases in atmospheric ammonia in the last decade across North America. ACS. Omega. 4 (26):22133–42. doi:10.1021/acsomega.9b03284.
- Yokelson, R. J., J. D. Crounse, P. F. DeCarlo, T. Karl, S. Urbanski, E. Atlas, T. Campos, Y. Shinozuka, V. Kapustin, A. D. Clarke, et al. 2009. Emissions from biomass burning in the Yucatan. Atmos. Chem. Phys. 9 (15):5785–812. doi:10.5194/acp-9-5785-2009.
- Yu, X. Y., T. Lee, B. Ayers, S. M. Kreidenweis, W. Malm, and J. L. Collett Jr. 2006. Loss of fine particle ammonium from denuded nylon filters. Atmos. Environ. 40 (25):4797–807. doi:10.1016/j.atmosenv.2006.03.061.
- Zeng, Z. C., L. Lee, C. Qi, L. Clarisse, and M. Van Damme. 2023. Optimal estimation retrieval of tropospheric ammonia from the geostationary interferometric infrared sounder on board FengYun-4B. Atmos. Meas. Tech. 16 (15):3693–713. doi:10.5194/amt-16-3693-2023.
- Zhang, L., D. J. Jacob, E. M. Knipping, N. Kumar, J. W. Munger, C. C. Carouge, A. van Donkelaar, Y. X. Wang, and D. Chen. 2012. Nitrogen deposition to the United States: Distribution, sources, and processes. Atmos. Chem. Phys. 12 (10):4539–54. doi:10.5194/acp-12-4539-2012.
- Zhang, L., J. Shao, X. Lu, Y. Zhao, Y. Hu, D. K. Henze, H. Liao, S. Gong, and Q. Zhang. 2016. Sources and processes affecting fine particulate matter pollution over North China: An adjoint analysis of the Beijing APEC period. Environ. Sci. Technol. 50 (16):8731–40. doi:10.1021/acs.est.6b03010.
- Zhu, L., D. Henze, J. Bash, G. R. Jeong, K. Cady-Pereira, M. Shephard, M. Luo, F. Paulot, and S. Capps. 2015. Global evaluation of ammonia bidirectional exchange and livestock diurnal variation schemes. Atmos. Chem. Phys. 15 (22):12823–43. doi:10.5194/acp-15-12823-2015.
- Zhu, L., D. K. Henze, K. E. Cady-Pereira, M. W. Shephard, M. Luo, R. W. Pinder, J. O. Bash, and G. R. Jeong. 2013. Constraining U.S. ammonia emissions using TES remote sensing observations and the GEOS-Chem adjoint model. J. Geophys. Res. 118 (8):3355–68. doi:10.1002/jgrd.50166.
- Zhu, S., K. Wu, S. A. Nizkorodov, and D. Dabdub. 2022. Modeling reactive ammonia uptake by secondary organic aerosol in a changing climate: A WRF-CMAQ evaluation. Front. Environ. Sci. 10. doi:10.3389/fenvs.2022.867908.
- Zimmermann, A. 2023. Politico. https://www.politico.eu/article/eu-conservative-big-win-industrial-emissions-directive/.