
 ?Mathematical formulae have been encoded as MathML and are displayed in this HTML version using MathJax in order to improve their display. Uncheck the box to turn MathJax off. This feature requires Javascript. Click on a formula to zoom.
ABSTRACT
Survival is often associated with body size, growth rate, and stress, but the latter two are more difficult to observe non-lethally. Non-lethal methods can be particularly important for endangered and culturally valuable species. With fish scales, growth and stress indices could be inferred without needing to sacrifice fish. We examined scales from ~350 wild Chinook salmon (Oncorhynchus tshawytscha) in Valley Creek and at Lower Granite Dam (Pacific Northwest, USA) in 2007–2019. From a von Bertalanffy model and scale circulus spacings, we estimated a brood-year-specific growth coefficient K (hereafter ). Using the scale-derived
and other biological and environmental covariates, we examined how these potential predictors associated with juvenile-to-adult survival of >136,000 passive-integrated-transponder-tagged Chinook salmon from the Snake River Basin (Pacific Northwest, USA). We found that the effects on survival from brood-year-specific
, fork length of the tagged individuals, and interaction between
and fork length were positive. We also determined that the proportion of fish samples with regenerated scales (an indicator of stress) had a negative effect on survival. For further refinement of non-lethal, scale-derived indices on survival, we encourage examination of indices across populations, juvenile habitats, and juvenile life stages, and not simply a regional, brood-year-specific growth index.
Résumé
La survie est souvent associée à la taille du corps, au taux de croissance et au stress, mais ces deux derniers sont plus difficiles à observer de manière non létale. Les méthodes non létales peuvent être particulièrement importantes pour les espèces en péril et culturellement importantes. Avec les écailles de poisson, les indices de croissance et de stress pourraient être déduits sans avoir à sacrifier les poissons. Nous avons examiné les écailles d’environ 350 saumons quinnat sauvages (Oncorhynchus tshawytscha) à Valley Creek et à Lower Granite Dam (Nord-Ouest Pacifique, États-Unis), de 2007 à 2019. À partir d’un modèle de von Bertalanffy et des espacements des cercles des écailles, nous avons estimé un coefficient de croissance K spécifique à l’année d’éclosion (ci-après ). En utilisant le
dérivé des écailles et d’autres covariables biologiques et environnementales, nous avons examiné comment ces prédicteurs potentiels étaient associés à la survie des stades juvénile à adulte de plus de 136 000 saumons quinnat avec des étiquettes de transpondeur passif intégré du Snake River Basin (Nord-Ouest Pacifique, États-Unis). Nous avons trouvé que les effets sur la survie du
spécifique à l’année d’éclosion, de la longueur à la fourche des individus étiquetés, et de l’interaction entre
et la longueur à la fourche étaient positifs. Nous avons également déterminé que la proportion des échantillons de poissons avec des écailles régénérées (un indicateur de stress) avait un effet négatif sur la survie. Pour affiner davantage les indices de survie non létaux dérivés des écailles, nous encourageons l’étude des indices entre les populations, les habitats des juvéniles, et les stades de vie, et pas simplement un indice de croissance régional spécifique à une année d’éclosion.
Introduction
Obtaining biological information underlying mechanistic processes of survival often requires sacrificing the organism. But this practice is a contradictory endeavor, especially in conservation where the goals are to increase survival and to sustain living organisms. Lethal sampling is a concern for species listed under the Endangered Species Act (ESA; Ford Citation2022). For many Pacific salmon populations listed under the ESA, the examination of predictors of juvenile-to-adult survival is often reliant on lethal measures of fish condition (e.g., indices of energetic reserves in lipids and dry mass; Gosselin et al. Citation2022) or is indirectly inferred through environmental indices hypothesized to affect fish condition. For example, increased survival is associated with increased river flow that indirectly captures the mechanism of reduced travel time and therefore reduced predation risk or increased survival is due to lower river temperature because of the reduction or elimination of chronic thermal stress. Non-lethal methods and the resulting biological observations could be used to help with conservation management decisions, trigger-based mitigative actions, and assessments of restoration efforts for salmon. Non-lethal methods for biological and physiological indices (Thorstensen et al. Citation2022) are an important area of research and practice to continue developing.
Three indices of biological information that can be derived non-lethally are as follows: 1) fish body length from direct measurement and 2) growth rate and 3) stress from indices representing patterns on fish scales. We describe the importance of these three biological indices on survival, and how these can have effects across multiple stages of the life cycle of complex species. We then describe how the indices could be tracked on fish scales in a non-lethal manner.
Fish body length is often a biological index associated with energetic reserves, predation-risk-linked behaviors, and ultimately survival (Sogard Citation1997). Size-selective mortality can occur under varying physiological conditions, habitats, ages of the fish, water years, and seasons (Sogard Citation1997; Garrido et al. Citation2015; Ulaski et al. Citation2020). For example, survival through a winter can depend on the severity of environmental conditions and the energy stores of different sized fish (Biro et al. Citation2005). Size-selective mortality can also be absent in other circumstances, dependent on body length distributions of the fish and of other prey, their spatiotemporal distributions, prey energy densities, encounter rates, handling times, and prey preferences (Claiborne et al. Citation2011; Woodson et al. Citation2013; Beacham et al. Citation2018). Thus, size-selective mortality is generally observed, but may not always occur.
In contrast to body length, growth rates are not representing size-selectivity per se but could represent favorable conditions that yield surplus energetic resources following requirements of basal metabolism (Enberg et al. Citation2012). In unfavorable conditions (e.g., waterborne copper exposure), reduced health can result in reduced growth and survival (Gao et al. Citation2023). Salmon growth rates are often measured as an index of recent or current biological condition and can be positively associated with survival (e.g., insulin-like growth factor-I, Beckman et al. Citation1999), while an index of growth rate across a longer time period will integrate past experiences and potentially across life stages too. Given that survival can be associated with conditions experienced in a prior life stage (Gosselin et al. Citation2021), an index of growth rate that integrates a fish’s experiences over long periods may be important to survival. The growth coefficient K from the von Bertalanffy model does not represent absolute nor current growth rate but is an index of growth rate that describes how quickly the asymptotic size is reached (Quist and Isermann Citation2017). Growth rates and related indices are, therefore, not necessarily representing the same mechanisms as size-selectivity and can be short-term measures or long-term indices.
Stress is another factor that can affect survival, and there are numerous indices representing different underlying mechanisms stemming from physical, chemical, and perceived stressors (Barton Citation2002; Portz et al. Citation2006). Physical injuries may be one of the most easily observed stressors. Occurrences of descaling, body injuries, and fin damage can predict lower survival in salmonids (Hostetter et al. Citation2015). Chemical and perceived stressors that result in physiological changes may be less easily observable than physical injuries. Thus, an area that warrants further research is determining a minimally invasive, non-lethal index of non-physical stressors associated with survival.
Tracking biological indices across life stages in habitats (e.g., spanning freshwater, estuarine, and marine environments) can be important for predicting the survival of a complex species, such as salmon. Fish body length of juveniles in rivers and streams is positively associated with salmon ocean survival (Faulkner et al. Citation2019; Gregory et al. Citation2019; Gosselin et al. Citation2021). Growth in fishes can also relate to survival across life stages and habitats (Beckman et al. Citation1999; Budy et al. Citation2002; Houde et al. Citation2019). Physical stress, including descaling, can lower survival in salmonids (Hostetter et al. Citation2015). Assessing the extent to which fish body length, growth rate, and stress are important to survival across life stages would be helpful to management in the freshwater system aiming to improve ocean survival.
Biological indices of past, cumulative experiences could be tracked through the patterns of visible increments, called circuli, on fish scales (Fisher and Pearcy Citation1990, Citation2005). As a fish grows, the scales increase in size with the addition of circuli, like rings in a tree trunk. Thus, a record of a fish’s body length and growth rate could be inferred from cumulative circulus spacing and with data on conditions experienced, such as temperature (Beakes et al. Citation2014; Todd et al. Citation2014; Walker and Sutton Citation2016; Izzo and Zydlewski Citation2017). In some environmental conditions of endured stress, there may also be signs of discontinuity on the scales (e.g., checks), where a disruption in growth occurred, and there may be resorption and regeneration at the edge of the scale (Johnson et al. Citation2012; Hernandez et al. Citation2014; Ghods et al. Citation2020).
In the current study, we investigated the feasibility of fish scale-derived indices as non-lethal methods for their potential use as part of a monitoring program to help predict ocean survival of wild, spring/summer-run Chinook salmon. More specifically, the objectives were to 1) estimate growth coefficient K using scale circulus spacing data in a von Bertalanffy model, 2) determine a stress index from fish scale patterns, and 3) determine the association between cohort-specific ocean survival with scale-derived indices (i.e., growth coefficient K and stress) and other biological (i.e., fork length) and environmental covariates.
Materials and methods
Overall, we observed and assembled data on juvenile fish and environmental condition to examine with juvenile-to-adult survival of tagged wild, spring/summer-run Chinook salmon from the Snake River Basin, Idaho and Washington, USA (See Figure S1 in the Supplementary Material for an overview of the data collection, model covariates, and analyses).
Data
Fish samples and measurements
We subsampled 139 subyearlings (also known as parr) from a long-term tagging and monitoring study on the survival and migration timing of multiple populations of wild Snake River spring/summer-run Chinook salmon juveniles (for field sampling methods, see Achord et al. Citation2007; Lamb et al. Citation2019; Lamb et al. Citation2020). Our subsamples were from incidental take of accidental mortality during electrofishing and were placed on ice in the field and later transported to the Northwest Fisheries Science Center (NWFSC, Seattle, Washington, USA) where they were stored in a freezer at −20°C. Among the populations of frozen samples available, we observed those that originated from Valley Creek (Idaho, USA) because this population had the largest number of years and fish samples available. The Valley Creek samples used in the current study were collected in the summers of 2007, 2008, 2010–13, 2015, 2016, and 2018. We observed fork length to the nearest mm and mass to the nearest 0.1 g from the thawed frozen subyearlings. After lab processing, we returned the fish samples to the freezer for storage at −20°C.
For yearlings (also known as smolts) of wild, spring/summer-run Chinook salmon, we subsampled 219 live fish, which were originating from multiple populations, from a long-term tagging and monitoring study (NWFSC Citation2022) in 2019 at Lower Granite Dam (Washington, USA; University of Washington Institutional Animal Care and Use Committee protocol #3382–05). The fish were anesthetized in MS-222 (tricaine methanesulfonate, Tricaine-S; 75 mg/L), measured to the nearest mm and weighed to the nearest 0.1 g at the time of PIT-tagging. Immediately afterwards, the yearlings were briefly handled to collect scales, placed in a recovery tank, and then returned to the river through the bypass system at Lower Granite Dam (for more details on field methods, see NWFSC Citation2022).
To collect fish scales from the subyearlings and yearlings, we followed the method outlined by Campbell (Citation2012). Briefly, we collected scales using a scalpel or forceps to gently remove approximately 5–10 scales from an area above the lateral line and along an imaginary line from the posterior base of the dorsal fin to the anterior base of the anal fin. The scales were then transferred onto Rite-in-the-Rain® paper and stored in scale envelopes.
Scale imaging and observations
Scales were mounted on glass slides and imaged at 4X magnification under digital microscopes (Axioskop 40, Leica Microsystems Ltd. CH-9435 Heerbrugg, DFC450 with Image-Pro Plus 7.0; or AmScope M158C-E5, 40X-1000X, Biology Science All-Metal Optical Glass Lens Student Microscope with 5MP Digital Camera). Care was taken to calibrate image software settings before measurements were taken. Image J software (version 1.51) was used to take measurements of each scale image. For each scale observed, five radial axes (0°, 45°, 90°, 135°, 180°; ) were drawn from the center of the scale to the outer edge of the scale. Along each of these radial axes, we marked where there was a circulus, counted the number of circuli, and measured the distance between each adjacent circulus (hereafter referred to as circulus spacing) starting with the circulus closest to the focus.
Figure 1. Fish scales from wild, spring/summer Chinook salmon: (a) Subyearling, (b) yearling, (c) subyearling with scale regeneration, and (d) yearling with scale regeneration. Axes are marked in (a) and (b) by their representative degree (°) starting with the lateral side of the scale closest to the dorsal side of the fish.
We searched for signs of scale regeneration, as indicated by a large focus (which is the center of the scale up to the first circulus), relatively fewer, more spaced-out circuli than usual, and sometimes a shorter radius than usual. The original focus is the span of the scale of a newly hatched fish, and thus a large focus represents significant scale regeneration. Scales from Valley Creek fish that had a large focus and five or less circuli (e.g., see ) were categorized as having significant regeneration of scales. Although we observed for signs of regeneration at the time of imaging subyearling scales (Figure S2a in Supplementary Material), we did not for yearling scales. Thus, we determined a regeneration index based on the fork length of the fish and the radius of the fish scales on each of the five axes observed. From these data, we ran a K-means analysis, using the function kmeans in the package stats (version 4.2.2) of R statistical software (R Core Team Citation2023). The K-means cluster analysis revealed three clusters, and we used these as the three categories for a scale regeneration index (‘Original’, ‘Small’, ‘Large’). There were 16 out of 139 Chinook salmon from Valley Creek and 48 out of 219 from Lower Granite Dam that were categorized as having signs of scale regeneration (Table S1 and Figure S2 in Supplementary Material).
PIT-tagged fish data
We obtained data on juvenile spring/summer-run Chinook salmon and adult returns from the database, Columbia Basin PIT Tag Information System (PTAGIS; www.ptagis.org; Pacific State Fisheries Management Commission, Portland, Oregon, USA). Specifically, we queried PIT-tagged fish that were a) wild, spring/summer-run, subyearling Chinook salmon from above Lower Granite Dam, b) run-at-large, wild, spring/summer-run, yearling Chinook salmon detected at Lower Granite Dam, for the same years represented in our fish scale samples, and c) juveniles that were 45–155 mm in fork length to help differentiate from hatchery and fall-run Chinook salmon (see similar method in Gosselin et al. Citation2022). Although we originally planned to use only Valley Creek PIT-tagged fish to associate with our subyearling fish scale samples, the limited number of adult returns necessitated using the broader data set with multiple populations. Adult returns were defined as any juveniles returning from the ocean as adults that were detected at or upstream of Bonneville Dam (Washington and Oregon, USA) during their upriver spawning migration.
Regional climate index
We included a climate-related regional index because these types of indices can provide strong associations with salmon survival and abundance at an annual, baseline-like scale (Burke et al. Citation2013; Gosselin et al. Citation2021). We included an annual mean of the Pacific Decadal Oscillation (PDO) index (www.ncei.noaa.gov/pub/data/cmb/ersst/v5/index/ersst.v5.pdo.dat) associated with year of ocean entry by the yearling Chinook salmon. The PDO index is a convenient and easily accessible index of annual ocean conditions that generally represents favorable conditions for salmon with patterns of cooler than normal temperatures around the northwest coast of North America (Mantua et al. Citation1997).
Analyses
Fish scale-derived index of growth rate
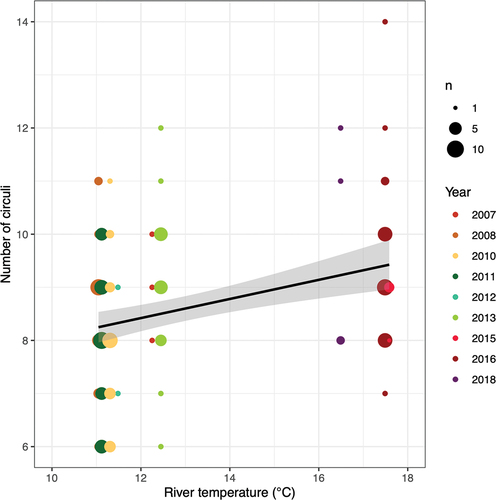
We examined how representative a fish scale index could be of growth rate. Given that temperature can positively influence the rate of circulus deposition on scales (Beakes et al. Citation2014), the assumption of constant deposition rate that we had originally assumed needed to be addressed. We examined the relationship of circuli deposition rate and temperature using Snake River temperature (Water Quality Monitoring, US Army Corps of Engineers; site ANQW, near Anatone, Washington; averaged hourly data from November through August associated with each cohort by brood year) and the number of circuli on the 90° axis for Valley Creek Chinook salmon subyearlings. We found a positive linear relationship () and therefore needed to determine a more appropriate rate than one assumed to be constant across all temperatures. We estimated the circulus deposition rate by dividing their approximate age (assumed to be 8 months for subyearlings and 18 months for yearlings) by the maximum number of circuli observed for each fish. Thus, brood-year- and individual-specific estimates of time when each circulus was deposited and the cumulative measurements of circulus spacing were used in a von Bertalanffy growth model:
Figure 2. Linear relationship between number of circuli deposited on a scale of subyearling, spring/summer, Chinook salmon from Valley Creek and the average November–August river temperature near Anatone, Washington.
where Lt is the cumulative circulus spacing starting from the focus of the fish scale and along the 90° axis () and is the asymptotic maximum scale radius at a rate governed by the growth coefficient K (and associated random effect
by brood year), from initial index of time t0 (i.e., when the fish scale is of length zero) to index of time t (i.e., estimated age of the fish) when the circulus is deposited on the scale. Only scales that did not show signs of regeneration were included in this analysis. We acknowledge a few assumptions and caveats in the analyses here and further in the discussion: 1) there is proportionality between scale radius and fork length; 2) circuli are deposited in a relatively regular fashion (e.g., every 4–8 days; Gamble et al. Citation2018), are deposited more often at higher temperatures (Beakes et al. Citation2014), and are an index of age for fish in similar life stages and with similar morphometric characteristics (Fisher and Pearcy Citation2005); and 3) the samples only represent fish that are still alive (i.e., not including individuals culled from the population). These will be important in the interpretations of results and future studies. The Bayesian analysis of the von Bertalanffy growth model was run in R statistical software with the function brm in the package brms (version 2.20.4; Bürkner Citation2017; Bürkner et al. Citation2023) and with rstan (version 2.26.13, Stan Development Team Citation2024) and Stan (version 2.34, Stan Development Team Citation2022). We simulated 3500 draws from the posterior distribution and discarded the first 500 for warmup, resulting in a total of 3000 saved draws. We assessed model convergence visually with traceplots, quantitatively with
<1.05 to avoid any potential scale reduction factor, and with absence of divergent transitions (Gelman et al. Citation2014). We compared the von Bertalanffy growth model fit to that from a null model that included an intercept and year as random effect using the function loo from the package loo (version 2.7.0; Vehtari et al. Citation2017, Citation2024).
Juvenile-to-adult survival
We predicted juvenile-to-adult survival for PIT-tagged subyearlings from Valley Creek and seven other release locations in tributaries in the Snake River Basin (Table S2 in Supplementary Material), and run-at-large yearlings from 32 release locations and passing Lower Granite Dam (Snake River, Washington, USA; Table S3 in Supplementary Material), migrating out to the Pacific Ocean, and returning as an adult to Bonneville Dam (Columbia River, Washington and Oregon, USA). Other populations in addition to Valley Creek were needed because of limited adult returns from PIT-tagged subyearlings (Table S2 in Supplementary Material). We applied a generalized linear mixed-effects model linking the probability of the juveniles migrating out to the Pacific Ocean and returning as an adult with various predictors:
where is the fixed intercept and
are the fixed slopes for
covariates associated with individual
. The covariates, with m = 1 through M = 6, respectively, were as follows: 1) a life stage index representing the groupings of subyearlings in the tributaries vs yearlings at Lower Granite Dam; 2) brood-year-specific
, estimated from EquationEq 1
(1)
(1) (Table S4 in Supplementary Material); 3) fork length of individual PIT-tagged fish (Table S5 in Supplementary Material); 4) an interaction effect between
and fork length; 5) proportion of fish samples that had regenerated scales (an indicator of stress for each cohort); and 6) PDO index associated with each cohort (Table S6 in Supplementary Material). For random effects,
is a normally distributed group-level error corresponding to the tagged fish release location, with a mean of 0 and standard deviation
. Because
and proportion of scale samples regenerated were estimated by brood year from only the Valley Creek population and run-at-large fish at Lower Granite Dam, we included the random effect of tagged fish release location to help better estimate the effects from these covariates in the model. All covariates were scaled to a mean of 0 and 1 standard deviation. Because fork length data were available for the PIT-tagged individuals through PTAGIS, we decided to include these measurements rather than the cohort-averaged estimates of fork length from the fish we subsampled scales. The survival model was run in R statistical software with the function brm in the package brms (version 2.20.4; Bürkner Citation2017; Bürkner et al. Citation2023) and with rstan (version 2.26.13, Stan Development Team Citation2024) and Stan (version 2.34, Stan Development Team Citation2022). We simulated 3500 draws from the posterior distribution, in each of three randomly initiated chains, discarded the first 500 draws, and then applied a thinning of 3, thus resulting in a total of 3000 saved draws. We assessed model convergence visually with traceplots, quantitatively with
<1.05 to avoid any potential scale reduction factor, and with absence of divergent transitions (Gelman et al. Citation2014).
Results
Scale circulus spacing: an index of growth
We examined the association between cumulative scale circulus spacing and the estimated age when each circulus was deposited using the von Bertalanffy growth model (; see Figure S3 in Supplementary Material for posterior distributions and traceplots of parameter estimates, and Table S4 for random effects associated with brood-year-specific estimates of growth coefficient ). We thus determined
, which tended to be lowest in 2016 and 2018 (). Overall, the predicted patterns of growth derived from fish scales provided reasonable fits to the data (). The von Bertalanffy model (looic = 1525.3 ± SE 95.7) outperformed a null model with an intercept and yearly random effects (looic = 9748.1 ± SE 76.2) by a difference in looic of 8222.8 ± SE 115. The marginal R2 of EquationEq 1
(1)
(1) fit to the data was 0.916 (90% CI 0.914–0.917).
Figure 3. Estimated growth coefficient () from the von Bertalanffy model of subyearlings from Valley Creek (2007–2018) and yearlings at Lower Granite Dam (2018) of wild, spring/summer-run Chinook salmon. Points represent medians and error bars represent 90% CI.
Figure 4. (Continued).
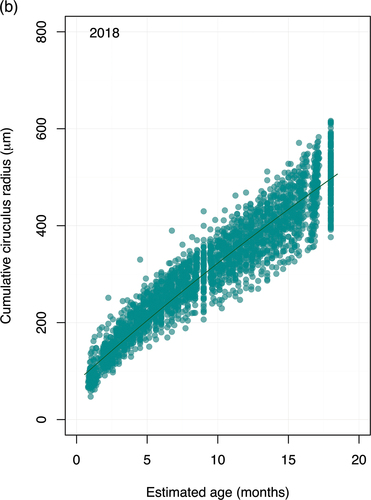
Figure 4. (a) Cumulative circulus distance (μm) observed in scales of wild, spring/summer-run, subyearling Chinook salmon at Valley Creek by estimated age at each deposited circulus, assuming subyearlings were 8 months old at time of sampling. Lines represent predicted relationship from von Bertalanffy model using the median associated with each brood year. (b) Same as Figure 4a, except for spring/summer-run, yearling Chinook salmon at Lower Granite Dam in 2019 (i.e., brood year 2018); and the estimated age at each deposited circulus was with the assumption that yearlings were 18 months old at time of sampling.
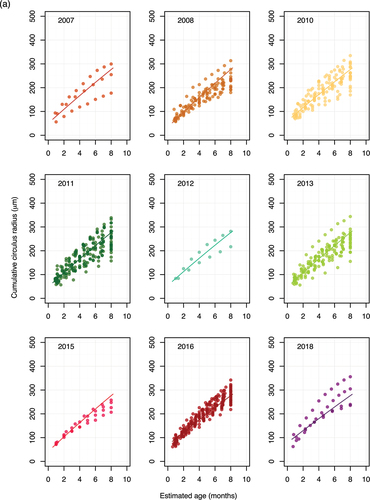
Table 1. Fixed effects parameters from the von Bertalanffy growth model estimated from cumulative scale circulus distances in subyearling and yearling Chinook salmon.
Juvenile-to-adult survival
Our results suggest that the covariates altogether represent a combination of biological, developmental, physical, and large-scale, environmental effects on juvenile-to-adult survival. The covariates that demonstrated effects with certainty at 90% credible intervals were life stage (subyearling vs yearling), growth coefficient , fork length, proportion of fish samples with regenerated scales, and the PDO index (; ; see Figure S4 in Supplementary Material for posterior distributions and traceplots of parameter estimates). Juveniles that had higher
and that were larger in fork length exhibited higher survival (). The interaction effect between
and fork length on survival was also positive. Similarly, survival was lower in cohorts with a higher proportion of individuals with regenerated scales. Not surprisingly, the life stage covariate indicated that subyearling-to-adult survival was lower than yearling-to-adult survival. Lastly, higher salmon survival was associated with a PDO index representing a cool and productive ocean. There were some noticeable random effects associated with tagged fish release locations (Table S7 in Supplementary Material) that we conceived would help address some population and sampling differences and better isolate main effects examined. The release locations that had among the most negative random effects included Valley Creek [VALEYC], Elk Creek [ELKC], and Bear Valley Creek [BEARVC], and those with the most positive random effects included Marsh Creek Trap [MARTRP], Lower Marsh Creek Trap [MARTR2], and Lower Lemhi River Trap [LLRTP], but also had wide-ranging 80% credible intervals that spanned across zero for some of the estimates. Still, Valley Creek had the most negative random effect with an estimate of −0.4327 (80% CI: −0.7378, −0.1404). The results altogether bring interesting patterns across diverse yet interrelated biological, life history, cumulative effects, and climate-derived processes.
Figure 5. Estimated covariate effects on survival of wild, spring/summer-run Chinook salmon sampled as subyearlings in tributaries, above Lower Granite Dam, and as yearlings at Lower Granite Dam. Violin plot: tips represent the minimum and maximum parameter posteriors; middle line represents medians, and additional top/bottom lines represent 90% credible intervals.
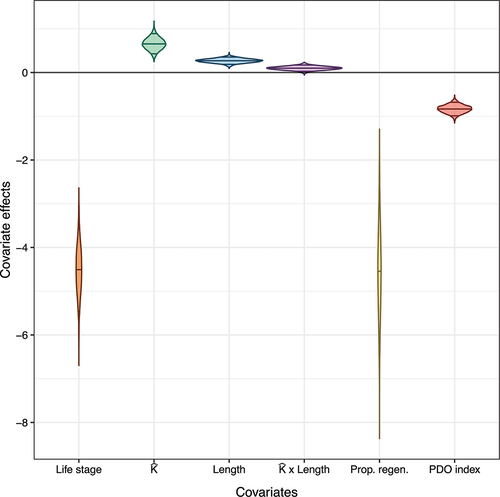
Figure 6. Marginal effect plots of covariates on juvenile-to-adult survival. Each covariate was varied over observed range, while other covariates were held constant. Posterior medians are represented by lines and 90% credible intervals are represented by shaded areas.
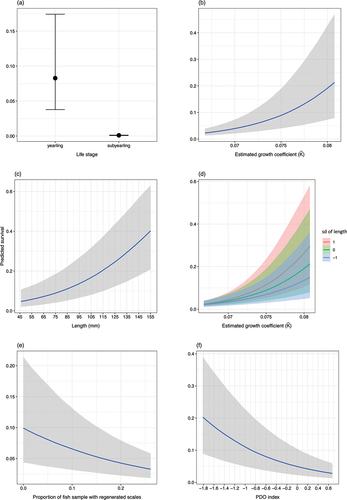
Table 2. Model of juvenile-to-adult survival of PIT-tagged, wild Chinook salmon predicted with life stage (subyearlings in the tributaries, above Lower Granite Dam; yearlings at Lower Granite Dam), growth coefficient , fork length, an interaction effect between fork length and
, proportion of scale samples regenerated, and Pacific Decadal Oscillation (PDO) index.
Discussion
Biological indices are sought because they often represent underlying processes of survival. However, biological and physiological indices are routinely observed through lethal methods, which can be problematic for endangered species. We investigated non-lethal indices of juvenile fish condition to relate to adult survival. We found that the scale-derived, brood-year-specific growth coefficient , the fork length of individuals, and the interaction between these two covariates, all had positive effects on juvenile-to-adult survival. Also, the proportion of fish samples with regenerated scales appears to be an easily observable index of prior stress and had negative effects on juvenile-to-adult survival. With regard to environmental indices, the PDO may be representing many processes through broad spatiotemporal scales across years and long-distance from the ocean to the mainstem and tributaries. We review and consider these underlying biological and ecological processes as well as large-scale effects from environmental and climate-influenced indices.
The growth coefficient of subyearlings and yearlings provided information that helped to predict adult survival. Mechanisms underlying growth include health and metabolism, which in turn are closely linked with temperature, as well as other conditions (e.g., food resources and pathogens) and habitat preferences (Fisher and Pearcy Citation2005; Killen and Humphries Citation2014). In our study, the main effect from
on survival was larger in magnitude than that from fork length (, ), and there was a positive interaction effect from these two covariates on survival. These results suggest that underlying growth-related mechanisms, such as health, are comparatively as important, if not additionally important in some situations, than size-selective processes. A more specific interpretation could be that large individuals survive better than small individuals, but when growth conditions are good, they survive even better than when growth conditions are not good.
Still, both body length and growth indices are important to consider together because, for example, fish with the same body lengths at capture may have different growth rates. Body length may be more directly related to size-selective mortality and growth rate may be more directly related to physiological processes of health. Growth rate could also be an indicator of body length in the future (e.g., when size-selective mortality occurs), age at maturation, and consequently juvenile-to-adult survival (Jensen et al. Citation2012). Growth rates can change across life stages, habitats, seasons, and environmental conditions (Fisher and Pearcy Citation2005; Todd et al. Citation2021). The main effects from and the interrelationship between juvenile growth rate and length on how they carry over to influence future ocean survival to the adult stage warrant further investigation.
It is important to note that is an index for all fish grouped by brood year, and that we made several assumptions to estimate this index. Estimating
requires observing circulus spacing, age of the fish at time of circulus deposition, how temperature may influence the circulus deposition rate, and how representative the samples may be of populations and cohorts across space (e.g., stream-specific populations) and time (e.g., sub-annual or seasonal). We relied on an assumed age for the subyearlings and yearlings to approximate the ages at time of circulus deposition. To examine this assumption, additional analyses using combinations of ages of 7, 8, and 9 months for subyearlings with 17, 18, and 19 months for yearlings yielded similar results to our current findings. The only change was that in some of the scenarios with the most different subyearling and yearling ages, the interaction effect between
and fork length was uncertain (e.g., 7-month subyearlings and 19-month yearlings: median effect = 0.0911 with 90% CI ranging −0.0060 to 0.1875). Estimating an age was important to avoid relying on an erroneous assumption of constant circulus deposition rate in our study and that it was likely influenced by temperature (; Beakes et al. Citation2014). This assumption of a constant deposition rate could result in bias or greater uncertainty (Table S8 in Supplementary Material). Future studies with more accurate estimates of fish ages and environmental conditions experienced for multiple populations would help confirm whether and determine under what situations
is a good predictor of survival.
In comparison to , observing for signs of scale regeneration is a relatively simple method that can provide important information as a predictor of survival. The proportion of fish samples with regenerated scales as a covariate of survival showed one of the strongest effects. Observing for scale regeneration at the individual level, scored as presence/absence or as patterns in subannual checks, could be a future avenue of research similar to the study by Hostetter et al. (Citation2015). In relation to our study, it is important to note that the effect was in conjunction with other effects such as the direct effect from ocean conditions. In a simpler model with only the covariates for proportion of sample with regenerated scales, life stage, and release location as a random effect, the former had a zero effect rather than a negative effect; while including the PDO index in the simple model, the effect was negative like in the full model of the current study. Repeating this study with additional samples from different populations and additional years (Lamb et al. Citation2019; Lamb et al. Citation2020; NWFSC Citation2022) would help confirm or instigate deliberation of our findings. Our results showed that fish tagged and released at Valley Creek had the most negative random effects (Table S7 in Supplementary Material) and thus were different from other release locations in ways that we did not capture explicitly in our study. As well, the type of sampling (e.g., repeated measures over time of individuals, individuals at different life stages, and individuals at different ages at a single point in time and place) may be important for interpretation of K from the von Bertalanffy model, which is most often used for samples of fish of different lengths at age sampled at one time. Furthermore, given the scope of our study, we could not determine if the regeneration of scales was due to physical or biological stress, or even a combination of these, and would necessitate controlled laboratory experiments. Determining this mechanism could help better understand indices of regenerated scales that represent non-lethal, juvenile experiences that carry over through the next life stage to affect their ocean survival (Gosselin et al. Citation2021). Further investigation on stress and scale regeneration could uncover findings similar to the formation of checks on scales representing changes in fish experiences and stress, such as that shortly after hatchery release (Fukuwaka Citation1998). To what extent regenerated scales may represent past physical injury, biological stress, energy loss, and other processes negatively affecting survival would need additional investigation.
In this study, we focused on the non-lethal aspect of sampling, which is important to concerns arising from species at risk, but also an important first step towards understanding the values of respecting the lives of other animals, as Two-Eyed Seeing (Reid et al. Citation2021). For many indigenous people, epistemology is as follows: ‘As all life is our relations, any loss of life is a loss of kin and spirit’ (Mi’kmaw Elder Albert Marshall, personal communication in Denny and Fanning Citation2016). Incorporating non-lethal methods into Western scientific approaches would help sustain life and be a step towards reconciliation and at the very least, making one’s view compatible with another’s that is different. Respectfully partnering with others with different worldviews would help us work on common problems, gain a more holistic appreciation of a complex system, all while maintaining the integrity and process of each partner. Such partnerships may be compromised to an extent or not be possible with lethal sampling. The three non-lethal, biological indices of fork length, growth rate, and stress were important predictors of salmon survival in this study, and we hope this helps future studies bridge between Western scientific approaches and Indigenous knowledge systems and methodologies (Kovach Citation2021; Reid et al. Citation2021).
In future work, the non-lethal method of estimating growth coefficient K and proportion of samples with regenerated scales can be refined for more accurate measurements by population, juvenile habitat, and juvenile life stages. This work may require multiple partnerships to feasibly conduct at such a large scale but would help provide greater insight into complex and diverse ecological and methodological processes. Utilizing archived scale samples and adding a relatively minor step of scale sampling in monitoring programs could help provide samples for future studies across multiple life stages and populations. Estimates of body length and growth rate in subyearlings could be compared to those in yearlings (or smolts), post-smolts, and adults to examine any patterns of culling and associated carryover effects. This type of study would be an expansion to studies on back-calculated smolt lengths (Claiborne et al. Citation2011; Yasumiishi et al. Citation2016) and changes in growth across life stages (Fisher and Pearcy Citation1990). Expanding our current study with investigations of population differences and whether habitat restoration efforts benefit salmon would likely be among the most feasible future studies. The findings could help provide a better understanding of the biological and physical effects (e.g., juvenile habitat carrying capacity and growth; experiences during passage through a hydroelectric power system and physical injury and biological stress) that carryover to affect adult survival in a changing climate and identify effective mitigative programs (Peyronnet et al. Citation2007; Morrongiello et al. Citation2012; Goertler et al. Citation2016; Lee and Punt Citation2018; Hinrichsen and Paulsen Citation2020; Gosselin et al. Citation2021). The investigation across life stages would likely be more involved but would help provide insight into patterns and processes across life stages, which are important to consider in complex species such as salmon in freshwater, estuarine, and ocean habitats. The relatively simple sample collection and study of non-lethally collected fish scales would be a method that could make life-cycle investigations more easily attainable, than other lethal and time-consuming processing methods.
Supplemental Material
Download MS Word (1.8 MB)Acknowledgments
We are deeply grateful for the biologists, including Gordon Axel, Jesse Lamb, Matthew Nesbit, who helped collect the fish scale samples as part of the Wild Snake River Spring/Summer Chinook Salmon Juveniles monitoring program (Northwest Fisheries Science Center, NOAA Fisheries). We are also very grateful to Tiffani Marsh and her staff for allowing us to subsample from their fish collections as part of their Seasonal Transport study (Northwest Fisheries Science Center, NOAA Fisheries) at Lower Granite Dam. Thank you to Karl Veggerby and Paul Chittaro for helping us get setup in the lab and for their input in interpreting the fish scale samples early in the project. We appreciate Chris Van Holmes’ and Matthew Carter’s help in querying and putting together the PIT tag data set for our study. We are very grateful for all the biologists who PIT-tagged these fish and made the data available through PTAGIS. We are deeply grateful to the anonymous reviewers for their comments, which greatly helped improve our paper.
Disclosure statement
No potential conflict of interest was reported by the author(s).
Supplementary material
Supplemental material for this article can be accessed online at https://doi.org/10.1080/11956860.2024.2374052 and the data can be accessed at https://www.cbr.washington.edu
Additional information
Funding
References
- Achord S, Zabel RW, Sandford BP. 2007. Migration timing, growth, and estimated parr-to-smolt survival rates of wild Snake River spring–summer Chinook salmon from the Salmon River basin, Idaho, to the lower Snake River. T Am Fish Soc. 136(1):142–154. doi: 10.1577/T05-308.1.
- Barton BA. 2002. Stress in fishes: a diversity of responses with particular reference to changes in circulating corticosteroids. Integr Comp Biol. 42(3):517–525. doi: 10.1093/icb/42.3.517.
- Beacham TD, Araujo HA, Tucker S, Trudel M, Fujiwara M. 2018. Validity of inferring size-selective mortality and a critical size limit in Pacific salmon from scale circulus spacing. PLoS One. 13(6):e0199418. doi: 10.1371/journal.pone.0199418.
- Beakes MP, Sharron S, Charish R, Moore JW, Satterthwaite WH, Sturm E, Wells BK, Sogard SM, Mangel M. 2014. Using scale characteristics and water temperature to reconstruct growth rates of juvenile steelhead Oncorhynchus mykiss. J Fish Biol. 84(1):58–72. doi: 10.1111/jfb.12254.
- Beckman BR, Dickhoff WW, Zaugg WS, Sharpe C, Hirtzel S, Schrock R, Larsen DA, Ewing RD, Palmisano A, Schreck CB, et al. 1999. Growth, smoltification, and smolt-to-adult return of spring chinook salmon from hatcheries on the Deschutes River, Oregon. T Am Fish Soc. 128(6):1125–1150. doi: 10.1577/1548-8659(1999)128<1125:GSASTA>2.0.CO;2.
- Biro PA, Post JR, Abrahams MV. 2005. Ontogeny of energy allocation reveals selective pressure promoting risk-taking behaviour in young fish cohorts. Proc R Soc B. 272(1571):1443–1448. doi: 10.1098/rspb.2005.3096.
- Budy P, Thiede GP, Bouwes N, Petrosky CE, Schaller HA. 2002. Evidence linking delayed mortality of Snake River salmon to their earlier hydrosystem experience. T Am Fish Soc. 22(1):35–51. doi: 10.1577/1548-8675(2002)022<0035:ELDMOS>2.0.CO;2.
- Burke BJ, Peterson WT, Beckman BR, Morgan C, Daly EA, Litz M, MacKenzie BR. 2013. Multivariate models of adult Pacific salmon returns. PLOS ONE. 8(1):e54134. doi: 10.1371/journal.pone.0054134.
- Bürkner P-C. 2017. brms: an R package for Bayesian multilevel models using Stan. J Stat Softw. 80(1):1–28. doi: 10.18637/jss.v080.i01.
- Bürkner P-C, Gabry J, Wever S, Johnson A, Modrak M, Badr HS, Weber F, Ben-Shachar MS, Rabel H, Mills SC, et al. 2023. Bayesian regression models using ‘Stan’, brms package, version 2.20.4, date published 2023-09-25.
- Campbell M. 2012. Obtaining scales from juvenile steelhead and Chinook salmon v1.0. Method ID 1360. https://www.monitoringresources.org/Document/Method/Details/1360.
- Claiborne AM, Fisher JP, Hayes SA, Emmett RL. 2011. Size at release, size-selective mortality, and age of maturity of Willamette River hatchery yearling Chinook salmon. T Am Fish Soc. 140(4):1135–1144. doi: 10.1080/00028487.2011.607050.
- Denny SK, Fanning LM. 2016. A Mi’kmaw perspective on advancing salmon governance in Nova Scotia, Canada: setting the stage for collaborative co-existence. Int Indigenous Pol J. 7:4. doi: 10.18584/iipj.2016.7.3.4.
- Enberg K, Jorgensen C, Dunlop ES, Varpe O, Boukal DS, Baulier L, Eliassen S, Heino M. 2012. Fishing-induced evolution of growth: concepts, mechanisms and the empirical evidence. Mar Ecol-Evol Persp. 33(1):1–25. doi: 10.1111/j.1439-0485.2011.00460.x.
- Faulkner JR, Bellerud BL, Widener DL, Zabel RW. 2019. Associations among fish length, dam passage history, and survival to adulthood in two at-risk species of Pacific salmon. T Am Fish Soc. 148(6):1069–1087. doi: 10.1002/tafs.10200.
- Fisher JP, Pearcy WG. 1990. Spacing of scale circuli versus growth rate in young Coho salmon. Fish Bull. 88:637–643.
- Fisher JP, Pearcy WG. 2005. Seasonal changes in growth of Coho salmon (Oncorhynchus kisutch) off Oregon and Washington and concurrent changes in the spacing of scale circuli. Fish Bull. 103:34–51.
- Ford MJ, editor. 2022. Biological viability assessment update for pacific salmon and steelhead listed under the Endangered Species Act: Pacific Northwest. In: U.S. Department of Commerce, NOAA Technical Memorandum NMFS-NWFSC-171. doi: 10.25923/kq2n-ke70.
- Fukuwaka MA. 1998. Scale and otolith patterns prove growth history of Pacific salmon. N Pac Anadromous Fish Commission Bull. 1:190–198.
- Gamble MM, Connelly KA, Gardner JR, Chamberlin JW, Warheit KI, Beauchamp DA. 2018. Size, growth, and size-selective mortality of subyearling Chinook salmon during early marine residence in Puget Sound. T Am Fish Soc. 147(2):370–389. doi: 10.1002/tafs.10032.
- Gao SY, Sun P, Zhao XY, Chang K, Chen WJ. 2023. Waterborne copper exposure decreases fish growth and survival by promoting gills and liver impairments in largemouth bass (Micropterus salmoides). Environ Sci Pollut Res. 30(56):119204–119216. doi: 10.1007/s11356-023-30755-7.
- Garrido S, Ben-Hamadou R, Santos AMP, Ferreira S, Teodósio MA, Cotano U, Irigoien X, Peck MA, Saiz E, Ré P. 2015. Born small, die young: Intrinsic, size-selective mortality in marine larval fish. Sci Rep. 5(1):17065. doi: 10.1038/srep17065.
- Gelman A, Carlin JB, Stern HS, Dunson DB, Vehtari A, Rubin DB. 2014. Bayesian Data Analysis. 3rd ed. Boca Raton, Florida: Chapman & Hall Book, CRC Press.
- Ghods S, Waddell S, Weller E, Renteria C, Jiang HY, Janak JM, Mao SS, Linley TJ, Arola D. 2020. On the regeneration of fish scales: structure and mechanical behavior. J Exp Biol. 223:jeb211144. doi: 10.1242/jeb.211144.
- Goertler PAL, Scheuerell MD, Simenstad CA, Bottom DL, Castonguay M. 2016. Estimating common growth patterns in juvenile Chinook salmon (Oncorhynchus tshawytscha) from diverse genetic stocks and a large spatial extent. PLOS ONE. 11(10):e0162121. doi: 10.1371/journal.pone.0162121.
- Gosselin JL, Anderson JJ, Sanderson BL, Middleton MA, Sandford BP, Weitkamp LA. 2022. Assessing seasonal and biological indices of juvenile Chinook salmon for freshwater decision triggers that increase ocean survival. Freshw Sci. 41(2):253–269. doi: 10.1086/720007.
- Gosselin JL, Buhle ER, Van Holmes C, Beer WN, Iltis S, Anderson JJ. 2021. Role of carryover effects in conservation of wild Pacific salmon migrating regulated rivers. Ecosphere. 12(7):e03618. doi: 10.1002/ecs2.3618.
- Gregory SD, Ibbotson AT, Riley WD, Nevoux N, Lauridsen RB, Russell IC, Britton JR, Gillingham PK, Simmons OM, Rivot E, et al. 2019. Atlantic salmon return rate increases with smolt length. ICES J Mar Sci. 76(6):1702–1712. doi: 10.1093/icesjms/fsz066.
- Hernandez K, Copeland T, Wright K. 2014. Quantitative assessment of scale resorption in migrating and spawning steelhead of the Snake River Basin. T Am Fish Soc. 143(6):1562–1568. doi: 10.1080/00028487.2014.954054.
- Hinrichsen RA, Paulsen CM. 2020. Low carrying capacity a risk for threatened Chinook salmon. Ecol Model. 432:109223. doi: 10.1016/j.ecolmodel.2020.109223.
- Hostetter NJ, Evans AF, Loge FJ, Rr O, Cramer BM, Fryer D, Collis K. 2015. The influence of individual fish characteristics on survival and detection: similarities across two salmonid species. N Am J Fish Manage. 35(5):1034–1045. doi: 10.1080/02755947.2015.1077176.
- Houde ALS, Akbarzadeh A, Güntherd OP, Li S, Pattersone DA, Farrell AP, Hinch SG, Miller KM. 2019. Salmonid gene expression biomarkers indicative of physiological responses to changes in salinity, temperature, but not dissolved oxygen. J Exp Biol. 222:jeb198036. doi: 10.1242/jeb.198036.
- Izzo LK, Zydlewski J. 2017. Retrospective analysis of seasonal ocean growth rates of two sea winter Atlantic salmon in eastern Maine using historic scales. Mar Coast Fish. 9(1):357–372. doi: 10.1080/19425120.2017.1334723.
- Jensen AJ, Maoileidigh NO, Thomas K, Einarsson SM, Haugland M, Erkinaro J, Fiske P, Friedland KD, Gudmundsdottir AK, Haantie J, et al. 2012. Age and fine-scale marine growth of Atlantic salmon post-smolts in the Northeast Atlantic. ICES J Mar Sci. 69(9):1668–1677. doi: 10.1093/icesjms/fss086.
- Johnson J, Johnson T, Copeland T. 2012. Defining life histories of precocious male parr, minijack, and jack Chinook salmon using scale patterns. T Am Fish Soc. 141(6):1545–1556. doi: 10.1080/00028487.2012.705256.
- Killen SS, Humphries M. 2014. Growth trajectory influences temperature preference in fish through an effect on metabolic rate. J Anim Ecol. 83(6):1513–1522. doi: 10.1111/1365-2656.12244.
- Kovach M. 2021. Indigenous methodologies: characteristics, conversations, and contexts. 2nd ed. Toronto: University of Toronto Press.
- Lamb JJ, Sandford BP, Axel GA, Nesbit MG, Sanderson BL. 2019. Monitoring the migrations of wild Snake River spring/summer Chinook salmon juveniles: fish collection and tagging, 2019. Report of research by the Fish Ecology Division, Northwest Fisheries Science Center, National Marine Fisheries Service, National Oceanic and Atmospheric Administration, Seattle, Washington, for the Division of Fish and Wildlife, Bonneville Power Administration, U.S. Department of Energy, Portland, Oregon.Contract No.: 46273 REL 163.
- Lamb JJ, Sandford BP, Axel GA, Smith SG, Nesbit MG, Sanderson BL. 2020. Monitoring the migrations of wild Snake River spring/summer Chinook salmon juveniles: survival and timing, 2019. Report of research by the Fish Ecology Division, Northwest Fisheries Science Center, National Marine Fisheries Service, National Oceanic and Atmospheric Administration, Seattle, Washington, for the Division of Fish and Wildlife, Bonneville Power Administration, U.S. Department of Energy, Portland, Oregon. Contract No.: 46273 REL 163.
- Lee Q, Punt AE. 2018. Extracting a time-varying climate-driven growth index from otoliths for use in stock assessment models. Fish Res. 200:93–103. doi: 10.1016/j.fishres.2017.12.014.
- Mantua NJ, Hare SR, Zhang Y, Wallace JM, Francis RC. 1997. A Pacific interdecadal climate oscillation with impacts on salmon production. Bull Amer Meteor Soc. 78(6):1069–1079. doi: 10.1175/1520-0477(1997)078<1069:APICOW>2.0.CO;2.
- Morrongiello JR, Thresher RE, Smith DC. 2012. Aquatic biochronologies and climate change. Nat Clim Change. 2(12):849–857. doi: 10.1038/nclimate1616.
- [NWFSC] Northwest Fisheries Science Center. 2022. Seasonal transport – a study to determine the seasonal effects of transporting fish from the Snake River to optimize a transportation strategy. Seattle (WA): Northwest Fisheries Science Center. https://www.fisheries.noaa.gov/inport/item/20563.
- Peyronnet A, Friedland KD, Maoileidigh NO, Manning M, Poole WR. 2007. Links between patterns of marine growth and survival of Atlantic salmon Salmo salar L. J Fish Biol. 71(3):684–700. doi: 10.1111/j.1095-8649.2007.01538.x.
- Portz DE, Woodley CM, Cech JJ. 2006. Stress-associated impacts of short-term holding on fishes. Rev Fish Biol Fisher. 16(2):125–170. doi: 10.1007/s11160-006-9012-z.
- Quist MC, Isermann DA. 2017. Age and growth of fishes: principles and techniques. Bethesda (MD): American Fisheries Society.
- R Core Team. 2023. R: a language and environment for statistical computing. Vienna, Austria: R Foundation for Statistical Computing. https://www.R-project.org/.
- Reid AJ, Eckert LE, Lane JF, Young N, Hinch SG, Darimont CT, Cooke SJ, Ban NC, Marshall A. 2021. “Two-eyed seeing”: an indigenous framework to transform fisheries research and management. Fish Fisher. 22(2):243–261. doi: 10.1111/faf.12516.
- Sogard SM. 1997. Size-selective mortality in the juvenile stage of teleost fishes: a review. Bull Mar Sci. 60:1129–1157.
- Stan Development Team. 2022. Stan modeling language users guide and reference manual, version 2.34. https://mc-stan.org.
- Stan Development Team. 2024. RStan: the R interface to Stan. R package version 2.32.5. https://mc-stan.org/.
- Thorstensen MJ, Vandervelde CA, Bugg WS, Michaleski S, Vo L, Mackey TE, Lawrence MJ, Jeffries KM. 2022. Non-lethal sampling supports integrative movement research in freshwater fish. Front Genet. 13:19. doi: 10.3389/fgene.2022.795355.
- Todd CD, Hanson NN, Boehme L, Revie CW, Marques AR. 2021. Variation in the post-smolt growth pattern of wild one sea-winter salmon (Salmo salar L.), and its linkage to surface warming in the eastern North Atlantic Ocean. J Fish Biol. 98(1):6–16. doi: 10.1111/jfb.14552.
- Todd CD, Whyte BDM, Jc M, Revie CW, Lonergan ME, Hanson NN, Gillanders BM. 2014. A simple method of dating marine growth circuli on scales of wild one sea-winter and two sea-winter Atlantic salmon (Salmo salar). Can J Fish Aquat Sci. 71(5):645–655. doi: 10.1139/cjfas-2013-0359.
- Ulaski ME, Finkle H, Westley PAH. 2020. Direction and magnitude of natural selection on body size differ among age-classes of seaward-migrating Pacific salmon. Evol Appl. 13(8):2000–2013. doi: 10.1111/eva.12957.
- Vehtari A, Gabry J, Magnusson M, Yao Y, Bürkner P, Paananen T, Gelman A. 2024. loo: efficient leave-one-out cross-validation and WAIC for Bayesian models. R package version 2.7.0. https://mc-stan.org/loo/.
- Vehtari A, Gelman A, Gabry J. 2017. Practical Bayesian model evaluation using leave-one-out cross-validation and WAIC. Stat Comput. 27(5):1413–1432. doi: 10.1007/s11222-016-9696-4.
- Walker BM, Sutton TM. 2016. Growth-increment formation using otoliths and scales for age-0 Chinook salmon. N Am J Fish Manage. 36(5):995–999. doi: 10.1080/02755947.2016.1184202.
- Woodson LE, Wells BK, Weber PK, MacFarlane RB, Whitman GE, Johnson RC. 2013. Size, growth, and origin-dependent mortality of juvenile Chinook salmon Oncorhynchus tshawytscha during early ocean residence. Mar Ecol Prog Ser. 487:163–175. doi: 10.3354/meps10353.
- Yasumiishi EM, Farley EV, Ruggerone GT, Agler BA, Wilson LI. 2016. Trends and factors influencing the length, compensatory growth, and size-selective mortality of juvenile Bristol Bay, Alaska, Sockeye salmon at sea. Mar Coast Fish. 8:315–333. doi: 10.1080/19425120.2016.1167793.