
 ?Mathematical formulae have been encoded as MathML and are displayed in this HTML version using MathJax in order to improve their display. Uncheck the box to turn MathJax off. This feature requires Javascript. Click on a formula to zoom.
ABSTRACT
Recently, the concept of the global innovation network (GIN) has been emphasized in view of increasing joint international research within regional economies as enabled by drastic changes in technology. However, insights gained from quantitative analysis of GINs are lacking. This study empirically investigated the GINs among major cities in East Asia by using data on patented co-inventions. This included an analysis of the factors that influence networks in the formation of international research collaborations in East Asia, and its interplay with geographical proximity. The results of the analysis suggest that there is a system of mesoscale international networks such as those in East Asia between GINs and national innovation systems. Our findings suggest that future policy should be more supportive of international innovation networks, especially in East Asia.
Highlights
This study traces the evolution of global innovation networks among major East Asian cities over time.
China, South Korea, and Taiwan are increasing their share in the network.
Geographical proximity has the greatest influence on global innovation network.
Networks formed by transnational geographic proximity are found between major cities.
1. Introduction
1.1. Research background and objective
Innovation is considered an important component of regional development (Jones, Citation1995). In particular, the role of innovation networks in regional innovation systems is crucial (Cooke, Citation2017), since it is more productive for actors to cooperate through innovation networks than to carry out independent innovation. Recently, regional innovation systems have been widely adopted in the Organisation for Economic Co-operation and Development and Northern Europe. However, research on regional innovation systems in emerging economies in Asia is currently ongoing.
Numerous studies on the spatial distribution of knowledge networks have been conducted (Maggioni & Uberti, Citation2009; Maggioni, Nosvelli, & Uberti, Citation2007; Mudambi et al., Citation2018; Scherngell & Barber, Citation2009; Takeuchi, Taima, Kidokoro, Seta, & Bureau, Citation2018). In the early 2000s, analyses of co-authorships using network science were also conducted. These studies were often derived from a single law of network data (Barab´asi et al., Citation2002; Newman, Citation2001).
As such, research on the spatial analysis of innovation networks is gaining prominence and numerous research achievements have been made (Balland, Boschma, & Ravet, Citation2019; Broekel, Balland, Burger, & van Oort, Citation2014; Chaminade & Plechero, Citation2015). Evident is that various analyses have been projected from the local network space to the global dimension. Chaminade and Plechero (Citation2015) conducted an empirical analysis of global innovation networks (GINs) for the European Union (EU) using data from a previous case study.
We use the term ‘GIN’ in this paper, implying that the network which is one step up from a regional innovation network is a GIN, not an international network according to economic geography. Related work (Cano-Kollmann, Hannigan, & Mudambi, Citation2018) pointed that if an innovation network crosses an international border, it is usually defined as a GIN rather than an international innovation network.
Balland et al. (Citation2019) and Ter Wal (Citation2014) also analyzed network dynamics in the EU. Despite these studies were conducted on various distance scales, some provide insights into the development of innovation networks in East Asia (Cano-Kollmann et al., Citation2018; Lin, Liu, Han, & Chen, Citation2018; Nepelski & De Prato, Citation2018).
Proximity is one important factor in innovation networks (Boschma, Citation2005; Hoekman, Frenken, & Tijssen, Citation2010; Katz, Citation1994). A recent study of how proximity affects the structure of each network revealed that proximity is key in achieving collaboration. Of the five categories of proximity (cognitive, organizational, social, institutional, and geographical), the more ambiguous are institutional and geographical proximity (Hoekman et al., Citation2010; Morescalchi, Pammolli, Penner, Petersen, & Riccaboni, Citation2015; van Dijk & Maier, Citation2006). Research considering the recent structural development of each network clarifies the proximity of each discipline.
Furthermore, as multicentric globalization increases, cities are key in the cyclical evolution of capitalist economies, commonly understood as inherently unstable economic systems (Dadashpoor & Yousefi, Citation2018). In an advanced context, previous study analyzed the relationship between spatial urban networks within global cities and the relationship between knowledge and innovation networks (Glaeser, Ponzetto, & Zou, Citation2016). The spatial structure of innovation networks in cities does not only imply a specialized economy with agglomeration. Rather, knowledge exchange is also a crucial element of a city with economic development that is technology based (Tang & Chau, Citation2020).
In case studies, the primary research sites for the spatial analysis of GINs were located in the EU (Balland et al., Citation2019; Berǵe, Citation2017; Frenken, Ponds, & Van Oort, Citation2010; Hazir et al., Citation2014; Hazir, LeSage, & Autant-Bernard, Citation2014; Hoekman et al., Citation2010). There has also been ongoing research on regional innovation systems in emerging East Asian countries (Cano-Kollmann et al., Citation2018; Chen, Citation2004; Li & Phelps, Citation2019; Lin et al., Citation2018). Furthermore, case studies indicate that these East Asian research and development (R&D) networks are well developed and linked to global R&D networks (Morescalchi et al., Citation2015; Ter Wal, Citation2014; Wanzenböck, Scherngell, & Brenner, Citation2014). However, few studies have conducted a spatial analysis using quantitative methodology. In addition, a small body of research discusses the spatial structure of knowledge exchange and interregional networks. Qualitative research is excellent to examine in-depth the status or history of innovation networks in each region. However, there is a limit to considering different regions at the same time. In addition, it is not easy to identify networks based on relationships with other regions, which renders quantitative research important. However, thus far, quantitative research has remained largely in the scope of domestic analysis rather than international analysis because of data limitations.
Therefore, this research empirically investigated the GINs among cities in East Asia by analyzing co-invention networks. To confirm this, we analyzed the status and time series changes in the spatial distribution of the innovation networks throughout urban areas in East Asia, focusing on co-invention from 2001 to 2016. Changes in the power nodes of the network were tracked based on network changes over time. In addition, the diversity in subgroups and impact of proximity are discussed. Through this research, suggestions regarding the implications for future regional development strategies and regional policies are suggested.
The distinctive approach of this study is that we used a large database to analyze the spatial features of the network dynamics in a time series. Another feature of this research is that it expanded previous innovation network studies that focused on East Asian countries with analyses of cross-border networks and proximity as a factor.
1.2. Why should we focus on linkages between cities in East Asia?
The globalization of knowledge is accelerating not only in the EU, but also in Asia. In the future, cooperation beyond cities will be important for East Asia, in addition to active economic exchanges beyond national borders. In particular, the overseas relocation of R&D functions has been highlighted as an important factor.
What are the objectives of studying the global collaboration structure of Asian cities? The study focused on East Asia’s major metropolitan areas because of the technology-driven rapid growth experienced in the region. China, Taiwan, South Korea, and Japan have experienced rapid growth on the back of information and communication technology (ICT) innovation and production. In other words, they have experienced growth as a result of focusing on fostering certain industries and developing an efficient innovation system. Furthermore, in terms of R&D, they have sound nurturing policies equal to those of the EU or United States (US).
A study by Liu, Chaminade, and Asheim (Citation2013) showed that global networks have grown rapidly since 2005 according to data from global companies: Tacit knowledge is strong and tends to remain local, but codified and analytical knowledge is transferable globally. In particular, several papers highlight the importance of the global network, which Japan is part of (e.g. Fukuda, Kidokoro, Seta, & Sato, Citation2019; Takeuchi et al., Citation2018).
The reason for focusing on East Asia is to examine the distribution of innovation networks and easements with countries having less social proximity than others. Previous studies showed that research exchanges within the EU are more closely related to East Asia than to networks with other international regions. We believe that East Asian regions are of significance as global regions since they are as active in economic and academic exchange as the EU.
Moreover, when exchange blocs are aligned with economic blocs, as in the EU, there are frequent cases where the innovation network transverses countries. The importance of GINs in East Asia is increasing with the development of networks in the region. Therefore, this paper examines how GINs have been formed in East Asian countries and the factors influencing their development. The paper is organized as follows: Section 2 provides a theoretical review of GINs and global networks between city regions. Then, the research questions are formulated based on an examination of the theory. Section 3 introduces the methodology for constructing the database and analysis. In Section 4, we track the spatial changes in the GINs among major cities in East Asia. In Section 5, an empirical study with the model is reported, and the effects of geographical and institutional proximity are verified. We derive conclusions in Section 6.
Through this research, we discuss the possibilities of Asia adopting GIN promotion policies similar to those in the EU. In addition, this study contributes to building knowledge in network dynamics in the spatial context of GINs in East Asia.
2. Related research on global innovation networks
This section is a theoretical review of GINs. First, we describe the theory and model in which innovation networks are spatially based. We reveal that a GIN plays a pipeline role in the system that generates regional innovation. Next, the importance of knowledge networks about production plants not only in innovation, but also in the aspect of urban networks is highlighted. It is noted that the development of urban and physical networks in East Asia has increased the importance of GINs in the region. Finally, we use the proximity argument to determine the factors of network formation. This illustrates how geographical proximity and institutional proximity, which are influenced by the National Innovation System (NIS), also affect the GIN. A comprehensive review of innovation studies showed that the discipline with the most variety in innovation research is geography. Other disciplines are economics, environmental studies, urban and regional planning, and management (Dahesh, Tabarsa, Zandieh, & Hamidizadeh, Citation2020). This research focused on urban and regional planning and geography. As such, this section describes major theories including urban and regional planning, geography, innovation research, and economics.
2.1. Innovation networks-related spatial innovation systems and urban systems
Innovation networks are mainly discussed as an economic activity with embedded social networks in a knowledge economy (Granovetter, Citation1985; Uzzi, Citation1997). Innovation networks consist of networks of development knowledge and mutual exchange between actors that contribute to innovation (Camagni, Citation1991). In addition, neo-geographical economics are based on technology and knowledge through innovation networks (Castells, Citation1999).
Previous studies examining the role of networks in promoting innovation have focused on finding effective network structures. Other approaches have explored the requirements for effective innovation networks, identifying a process or series of activities by various innovation actors that exchange resources in a mutually complementary manner through communication.
In other words, early studies on innovation networks focused on relationships between people or organizations.
On the other hand, requirements for innovation have been discussed as an environment of knowledge exchange and the spatial innovation system that influences the interaction between actors. Innovation networks play an important role in innovation systems. Cooke (Citation2017) proposed various spatial innovation systems with innovation networks, ranging from the local to global innovation system.
Numerous studies have quantitatively illustrated the relationship between a local place and one outside the agglomeration (Giuliani, Morrison, Pietrobelli, & Rabellotti, Citation2010; Porter, Citation2003). Bathelt, Malmberg, and Maskell (Citation2004) presented a growth model for the space and innovation of industrial agglomeration, using the concepts of buzz and pipeline. Buzz is a local, regional unit that can be used to define districts (Bathelt et al., Citation2004; Storper & Venables, Citation2004) and is a place where close exchanges of seeds of innovation such as information and knowledge can be made. This takes advantage of the location such that the benefits are only available in that specific location. However, the study described this as a place-based external economy, and found that the effect could only be obtained with ease at the location.
In this context, the global pipeline implies a network outside the region. This type of network is a sustainable source of innovation and prevents lock-in within a region. Initially, the pipeline is the links of communication that bring in new knowledge and the seeds of new ideas in external relationships. This is a connection between the local area and other areas, which taps into foreign knowledge. In the case of pipelines, the location conditions are different, and organizations and companies have to pursue information.
Although the innovation process differs greatly for each knowledge-based and industry-based innovation, they have a common factor for innovation, namely the integration of knowledge across organizations beyond local labour and the environment. This illustrates why the focus should be on GINs. Nowadays, despite the importance of research in one particular field, interdisciplinary integration is also developing. Therefore, to observe the characteristics of intra-regional and extra-regional networks in collaborative research, an approach that handles all fields of technology is adopted because it expands the possibilities of collaboration. In summary, the GIN represents pipelines in a system that generates regional innovation.
Furthermore, innovation networks have been discussed with urban systems because they are relevant to cities’ competitiveness. Research on urban systems has been conducted primarily based on geography. Studies have also analyzed cities in which firms locate their establishments from a hierarchical perspective. In other words, by considering cities as nodes and inter-city relationships as links, the network between firms is extended to a network of cities.
The systems theory of the city seems to have a multilayered spatial scale, which is defined according to international, national, and regional urban systems. The accumulation of empirical research on urban systems on the global level has been active since the second half of 1990, with the Globalization and World Cities Research Network (GaWC) pointing out intercity relations and the hierarchy of cities worldwide. GaWC focuses on analyzing service industries such as accounting, advertising, banking and finance, insurance, and law, as well as office locations and the hierarchy of world cities.
The abovementioned urban systems study ranks and examine the importance of cities to global companies, that is, organizations. In addition, there are active studies in each country and for several regional bodies such as the EU (Hall & Pain, Citation2006).
From a spatial perspective, Hall and Pain (Citation2006) identify eight representative polycentric metropolitan areas in the EU, where not only functional relationships such as commuting are empirically analyzed but also urban area structures related to inter-company networks and knowledge exchanges. The current research presents actual space-based empirical research to address the gap created by the paucity of concrete discussions on the innovation space thus far.
Attempts to quantitatively analyze the relationships between cities have resulted in the development of analytical methods (Hennemann & Derudder, Citation2014). Notably, these studies were able to track the location of the company’s office and the actual network in which it exists.
In particular, most studies on GINs examine the relationship between regional and global innovation systems and the differences in their impacts. For example, Chen (Citation2004) examined the impact of Taiwanese firms’ networks with China on GIN. Malik, Sharma, Pereira, and Temouri (Citation2021) analyzed knowledge networks by applying network analysis with a focus on the Quintuple Helix, and Ascani, Bettarelli, Resmini, and Balland (Citation2020) investigated GIN by patents in urban areas in Italy. Verginer and Riccaboni (Citation2021) analyzed innovation networks between cities worldwide, focusing on the global mobility of researchers. Yao, Li, and Li (Citation2020) analyzed inter-city joint patenting in China between 2001 and 2016, finding that networks within regions and those among city-regions significantly impact innovation. This implies that city innovation is not only determined by the local environment. This study also adopts this perspective, and analyzes the formation factors of GIN based on the premise that it has an important impact on each city.
Consequently, in terms of the urban network, besides the network of production plants, the network of knowledge creation is also gaining prominence. In addition, the presence of an innovative class is a crucial element of a city’s competitiveness.
2.2. Proximity of innovation networks in global knowledge collaboration
In particular, proximity has been pointed out as the most important concept in the development of innovation networks. Research has considered how each network has recently developed structurally and the extent to which the proximity of resistance and of distance by the respective disciplines are evident.
Proximity is regarded as sufficient to create collaboration for innovation (Boschma, Citation2005). Brenner and Broekel (Citation2011) observed that cognitive, social, organizational, and geographical proximity were crucial in describing the knowledge network.
Marrocu, Paci, and Usai (Citation2013) investigated the relationship between innovation and proximity, conducting a validation using a dataset of R&D and human capital across the 276 EU regions. According to the results, technological and cognitive proximity are more important than geographical proximity. Social and organizational proximity are also significant; however, their roles are not prominent.
Albert-Cromarias and Asselineau (Citation2013) asserted that geographic proximity is necessary but not sufficient. Boschma (Citation2005) and Rallet and Torre (Citation1999) found that organizational and cognitive proximity might act as substitutes for geographical proximity. Furthermore, technological evolution has resulted in an increase in the mobility of people, which facilitates temporary geographical proximity (Torre & Rallet, Citation2005). Lorentzen (Citation2008) disagrees with the basic premise of territorialized innovation theories, which state that firms’ innovativeness and competitiveness is affected by the region in which they are located. Conversely, Lorentzen (Citation2008) suggested that firms have a hold on their capabilities and network environment, and it is not regional networks and institutions that drive innovation.
Previous studies considered how each network has recently developed structurally, revealing the influence of proximity on each discipline. In contrast, current studies examined networks in terms of geographical proximity, and considered how similarities or differences in the spatial distribution of subgroups in a network affect innovation (Berǵe, Citation2017). The current research (Hoekman et al., Citation2010; Morescalchi et al., Citation2015; van Dijk & Maier, Citation2006) also revealed geographical and institutional proximity as the most ambiguous among the five categories of proximity. Cooke (Citation2017) pointed out GIN evolved from the Territorial Innovation System (TIS) which includes NIS and RIS, and the GIN-TIS integration has powered recent global innovation and evolution. This research investigated GIN from the point of view of TIS. Therefore, we focused on determinants of TIS, such as geographical proximity and national institutional proximity. Regarding geographical and institutional proximity, we conducted a regression model to establish the main factors influencing the GIN in East Asia. Finally, we used the proximity argument to establish the factors guiding the formation of the network. We found that geographical and institutional proximity, which are influenced by the NIS, also affect the GINs in East Asia.
2.3. Related research on East Asian innovation networks including co-patent and co-publication networks
There has also been progressive research in the field of international business administration. Research trends in spatial innovation systems in East Asia are now shifting focus from research based on national domestic innovation systems to global interactions.
Kamakura and Matsubara (Citation2012) investigated the global flow of R&D human resources and presented the relationship between knowledge procurement within a local R&D cluster and global knowledge coupling. They examined the offices and research stations of multinational companies from the perspective of global knowledge integration. Research on global knowledge integration includes that of Cooke, Davies, and Wilson (Citation2002), Maggioni et al. (Citation2007), and Maggioni and Uberti (Citation2009), as well as Inoue, Souma, and Tamada’s (Citation2007) citation analysis of patents and academic papers. In South Korea, related research was conducted on how to improve the regional innovation power for regional development with various analyses of aspects including the innovation index, influence on the regional economy, and promotion of the governance of the regional innovation system. In addition, regarding the analysis of innovation networks in Japan, network analyses and factor analyses were conducted by participants in the regional consortium R&D project. There is also a study on the role of universities in knowledge exchange (Tang & Chau, Citation2020).
In East Asia, Tokyo, Osaka, and Beijing are major urban areas according to a study that visualized early global networks. These East Asian cities did not have strong connections with Western countries. Tokyo and Osaka had strong internal networks, but Beijing was independent and had less connection with other cities (Matthiessen, Schwarz, & Find, Citation2002). In subsequent research, Seoul and Hong Kong were added to the global urban network in respect of innovation. However, Japan and China have yet to be dealt with independently of Western collaboration networks in ICT and Biotechnology case studies (Matthiessen, Schwarz, & Find, Citation2010).
Recently, innovation network research on China began actively. A study that analyzed the network of Chinese domestic co-authors using gravitational models highlighted a Beijing bias (Andersson, Gunessee, Matthiessen, & Find, Citation2014). This study developed a hypothesis that the network of major cities in China, such as the capital of each region, has a multi-polar distribution rather than single polar concentration. In contrast, the results showed that Beijing had a higher status than other cities. This paper also pointed out that this is due to political reasons. Another study further revealed that the formation factor of this knowledge network in China is geographical proximity. Given the time series change, the study noted that the impact has been growing in recent years (Ma, Fang, Pang, & Li, Citation2014).
In addition, according to a study analyzing Chinese urban networks according to domestic joint patents, China’s urban network is diamond-shaped and has two centres around Beijing and Shanghai (Ma, Fang, Pang, & Wang, Citation2015).
Recently, China’s innovation network and spatial characteristics have been analyzed in the Yangtze River Delta Region (YRDR), a representative knowledge cluster (Cao et al., Citation2019; Li & Phelps, Citation2018a, Citation2018b, Citation2019). Research on this region has been particularly active in driving China’s innovation system. These studies reveal the influence of the YRDR in China and local knowledge networks in the region. This research emphasized that the YRDR forms a functional polycentric urban area (Li & Phelps, Citation2018a).
Following a similar approach, Ma et al. (Citation2014) calculated the degrees of functional poly-centricity of the YRDR and Middle Yangtze Region at the regional, national, and global scales. These studies commonly conclude that the higher the geographical scale at which functional polycentricity is measured, the less functionally polycentric the region is.
A study looking at glocalization in the YRDR analyzed both sides of the international and local networks, showing the development of the network in these two aspects (Li & Phelps, Citation2019).
Therefore, research on East Asian innovation networks, including in Korea, China, and Japan, has been actively carried out in recent years. Furthermore, previous studies contended that knowledge networks need to consider patents that are capable of actual technology transfer. They have also emphasized the need for a time series rather than a point in time, and the necessity of analyzing, not merely describing, the factors and mechanisms of the knowledge network.
Therefore, this study analyzed the spatial structure of urban areas in East Asia in a time series using patent data, referring to the problem consciousness of existing research. It also considered geographical and institutional proximity, which are considered representative factors of GINs.
2.4. Research questions
This study described a theory and model in which innovation networks are spatially considered. In this regard, the GIN plays a pipeline role in a system that generates regional innovation. Network diversity is also necessary to function as a pipeline. In addition, relatively few studies have applied such a theory to Asia, as most focus on the EU. We also pointed out that knowledge creation networks are now becoming more important, not only in terms of innovation, but also in terms of urban networks. In this context, we observed that the development of networks of cities and companies in East Asia increases the importance of GINs. We also discussed the proximity argument to determine the factors influencing innovation networks. There are two representative proximities: geographic proximity and institutional proximity influenced by the NIS. We illustrated how these proximities affect the GIN. Based on the above findings, the following research questions (RQ) were generated.
RQ 1: What is the structure of hubs and subgroups of the GIN in East Asia? How does the diversity of the inventors’ countries change in the subgroups?
RQ 2: Does geographical proximity have an effect on the co-patent network between East Asian cities, and if so, what is its impact and how does it change?
3. Methodology: empirical strategy and the measures of the network
3.1. Overview of research method
In this study, East Asian innovation networks were analyzed using the indicators of social network analysis.
In the analysis presented in Section 4, the power nodes (inventors) were extracted using closeness centrality and betweenness centrality. In addition, a Herfindahl-Hirschman Index (HHI) analysis of each subgroup was conducted based on the results of the communities.
In Section 5, we present the characteristics of the networks using the extracted metropolitan areas. The formation factors of networks between urban areas based on distance, that is, geographic and cultural proximity, are categorized as either domestic or international. We also consider the possibility of forming a network in each metropolitan area based on the number of inventors versus the population of that metropolitan area. The Euclidean distance between each link was used as geographical proximity. Using these variables, an empirical study was conducted through a negative binomial regression analysis using network data across the metropolitan areas.
Social network analysis integrates theories and methodology approaches from fields as far-ranging as graph theory, information sciences, social sciences, and physics. Previous research used large-scale database processing to examine the various ways in which increasingly complex social networks impact all aspects of society. This is rooted in network theory, which is based on the assumption that relationships between interacting units matter, and which explores both attributes and structural features. It most commonly represents a network as a web of links and nodes.
Moreover, the interaction between network structures can illustrate the macro and mesoscales. Therefore, network analysis is a flexible tool that can overcome the limitations of previous analyses that focused on individual attributes rather than on associations. As a result of this feature, there has been an increase in the use of network analysis in innovation research in recent years (Berǵe, Citation2017; Dahlander & McFarland, Citation2013; Maggioni et al., Citation2007; Morescalchi et al., Citation2015; van Dijk & Maier, Citation2006).
In this study, a network analysis database was constructed by extracting US patents with at least one inventor residing in East Asia. GINs were investigated for all industries through co-inventor networks via a time series. The database used in this study contains patents in all fields, so only spatial aspects are considered. As there may be shortcomings because domestic patent data were not used and therefore, domestic intercity connections may seem weaker than they are, this study employed US patent data because it focuses on global rather than domestic networks.
Previous research was empirically conducted using a variety of indicators such as academic papers, inter-company collaboration, and informal gatherings. However, the reason the patent network is still geographically significant is that patents represent the most fundamental knowledge in an industry.
While research on innovation networks with patents has several limitations, many researchers still opt for the patent network, because patent information is easily obtainable and represents explicit knowledge.
Lim and Kidokoro (Citation2017) focused on domestic patents in South Korea and Japan. The results showed that foreign inventors had an influence in every country, and the influence of Japanese inventors was particularly considerable. Based on this, it was necessary to analyze not only domestic but also international patents, and data were required to enable a cross-sectional analysis.
However, there is no such thing as an actual international patent, although international patents should be used to analyze international academic and technological networks. In other words, patent applications can only be filed for each country. However, US patents essentially act as international patents because the US has global innovation hubs with a concentration of research institutions of global companies.
As such, we used the US patent database provided by the United States Patent and Trademark Office (USPTO) PatentsView (https://www.patentsview.org/). In addition, the headquarters and core branches of many global companies are located in the US. Furthermore, the US activates patent disputes and defends patents.
Among all patent data, patents that had at least one inventor from East Asia (including Singapore) were selected. For a time-series analysis, we divided them into 4 time periods (4 years per period) within the 16 years from 2001 to 2016. The number of eligible patents was 2,880,577. Generally, patents include two types of personal information: inventor and applicant (assignee in the case of US data). The ‘applicant’ represents those who own the intellectual property, while the ‘inventor’ recognizes the original invention’s branch or research. By referring to the inventors’ physical location, we can track where the invention actually occurred. The location data within the inventor’s attributes were used to construct the spatial network of patents.
3.2. Index of network analysis
In this subsection, the network and other indicators used in this study are described. First, we describe the indicators of the weighted network, and then indicators such as centrality and detecting community.
Recently, numerous studies using network analysis have opted for weighted networks from binary networks. The method, based on a study by Opsahl, Agneessens, and Skvoretz (Citation2010), tries to convert the index of network analysis from a binary to a weighted network.
Centrality is an index for evaluating and comparing the importance of each vertex (node) in a network. It is also the most commonly used index in network analysis.
This study used two types of power nodes according to the concept of centrality: Quantitative power nodes and structural power nodes. A quantitative power node consists of high closeness centrality, while a structural power node consists of a high level of betweenness centrality (Lim & Kidokoro, Citation2017).
3.2.1. Closeness centrality
The degree of centrality indicates the extent to which a node can be considered central to a network. It measures a node’s number of links or ties, both incoming and outgoing, to the rest of the network. The larger the degree, the more central is the node. The closeness centrality of a vertex is defined as follows (Freeman, Citation1978; Opsahl et al., Citation2010):
(1)
(1) where dij is the (possibly directed and/or weighted) distance from i to j. In the case that there is no path between the two vertices, the distance is taken to be zero.
3.2.2. Betweenness centrality
Betweenness centrality, first proposed by Freeman (Citation1978), measures the number of paths that passes through a node if the network’s shortest distance is followed. If a node’s betweenness centrality is significant, then the node’s position is considered a broker that connects the other nodes.
Let the vertex with the largest relative betweenness centrality and then the central point of dominance (Freeman, Citation1978) be defined as:
(2)
(2) where σst is the number of shortest paths from s to t, and σst(v) is the number of shortest paths from s to t that pass through a vertex v. CB(v) is the normalized betweenness centrality of vertex v. The value of CB lies in the range [0,1]. This may be normalized by dividing by the number of pairs of vertices excluding v, which is (n−1)(n−2)/2, for undirected graphs and (n−1)(n−2)/2 for the direct paths.
3.2.3. Subgroup detection
Network subgroup detection is based on modularity. Modularity is the ratio of the number of inner community links to the entire number of links. The entire modularity Q can be obtained from the following equation. To test whether a particular division is meaningful, we define a quality function or modularity Q, following Newman (Citation2001) as
(3)
(3) Let Avw be an element of the adjacency matrix of the network; hence, Avw is 1 if vertices v and w are connected; otherwise, it is 0. kv is the degree of a vertex v, and cv is the vertex v belonging to the community of cv. m denotes the number of edges in the graph.
Let Q denote the fraction of edges that lie within communities, excluding the expected value of the same quantity if the edges lie randomly without regard for community structure. If a particular division gives no more within-community edges than would be expected by a random chance, then Q = 0. Values other than 0 indicate deviations from randomness, and values greater than approximately 0.3 tend to indicate the existence of a significant community structure.
3.3. Characteristics of East Asia with regards to co-invention networks
Most US patent data account for a large proportion of patents from developed economies located in East Asia and Europe. Among them, South Korea, Japan, China, and Taiwan have a great impact in terms of size and growth rate. In this study, a time series analysis of data from 2001 to 2016 indicated that globalization began in earnest from around the 2000s.
shows the number of patent applications from East Asian countries. There has been drastic growth since 2001, and the number of patents from East Asia has grown significantly to the present time.
Figure 1. Number of inventors by countries in US Patents.
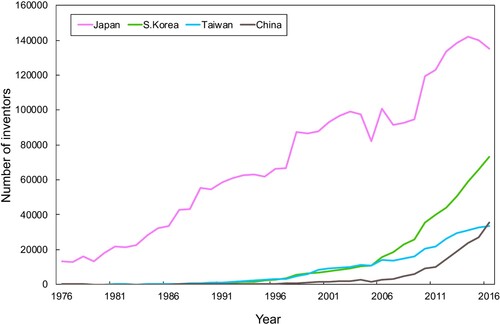
Therefore, in this study, time-series data are used to examine how GINs have changed, with a focus on co-invention networks in East Asia.
Equally, a recent study focused on the global network of regions within Europe, as mentioned (Berǵe, Citation2017). Based on this, it would be important to track the development of innovation networks among nations, especially patents within East Asia.
4. Results of the network analysis
In this section, we track spatial changes in the GIN in East Asia.
The results of the analysis were used to examine the changes experienced in the hub of the innovative network.
4.1. Current state of the global innovation network
4.1.1. Network growth and relative country contributions
First, the overall network was observed. As shows, the network was observed based on the number of inventors, applicants, and patents. The number of inventors and applicants has been steadily increasing since the 2000s, and the number of network nodes and links for each applicant is increasing. The density of the network of inventors and applicants is very low. As indicates, there are many networks, mainly between two parties and isolated networks. Specifications of the network are provided in Section 4.2.
Table 1. Database of co-invention network.
Next, the network status of patented inventions by country is observed. shows the co-invention network classified by inventors’ countries in East Asia and other countries. The node colours indicate the corresponding country of origin of the inventor. Overwhelmingly, Japan and South Korea had the highest percentage, followed by Taiwan and Singapore. The recent focus on the growth of China’s innovation network is clearly shown in the fact that their patents only began to appear from the 2010s. Interestingly, Japan’s influence changes over time. In the early 2000s, the country had a very large share of the network, but this decreased over time while that of other East Asian countries and regions increased. By 2013–2016, Korea and Taiwan had a comparable share of the network in relation to that of Japan.
Figure 2. Network dynamics of East Asia.
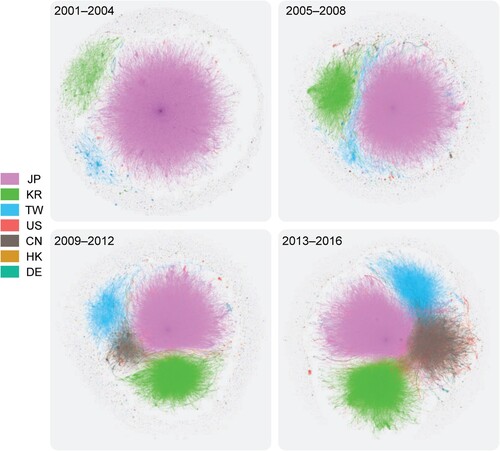
The structure through which existing Japanese companies applied for patents and used them for technical purposes of protection has been in existence since the 1980s. Later, the global technology war between South Korea and Taiwan, and China since the late 1990s, started to morph into a technical property war. The relationship between South Korea and Japan is already becoming apparent (Chang, Lai, & Chang, Citation2009) and can be assessed not only in the simple network provided in a national dimension, but also in the network between metropolitan areas.
4.1.2. Power law
A network is referred to as scale-free if its characteristics are independent of its size, that is, the number of nodes. This means that when the network grows, the underlying structure remains the same. A scale-free network is defined by the distribution of the number of edges of the nodes following a power law distribution. A power law distribution is different from the so-called normal distribution (Easley & Kleinberg, Citation2010, p. 480).
A scale-free network distinguishable through the power law has the following characteristics. First, there is a super-power node. A large portion of the network is connected to several power nodes, often referred to as hubs. These hubs are characterized as nodal points within the network, and when information from the outside flows through them, it rapidly exerts a ripple effect throughout the network. Second, the form of the network often takes on a fractal structure with multiple hubs connected to it.
The East Asian network was found to be a scale-free network satisfying the law at all points since 2001, as shown in . That is, some applicants may exist as power nodes, which may belong to a given subgroup. In the next section, we focus on the distribution of important power nodes. We also investigate whether some structures revolve around the subgroups from which the power nodes are formed.
Table 2. Fitted power law distribution.
4.2. Power nodes of the network
In the previous subsection, we confirmed that the GIN in East Asia is a scale-free network. Consequently, we considered the power nodes, which are the most important part of the network. In particular, we investigated whether the power nodes functioned as hubs or not in huge networks.
The evolution of network hubs was investigated. In this study, we examined trends since 2001, when full-scale globalization began. The criteria for selecting power nodes involved extracting the 1,000 nodes with the highest centrality for each period.
4.2.1. Power nodes: betweenness, closeness
Based on the results, several countries had more than the required number of power nodes (see and ). In the early 2000s, Japanese cities were the most dominant city regions in terms of the innovation network. From the results, all power nodes in the case of closeness centrality and betweenness centrality overwhelmingly consisted of Japanese inventors. However, in the late 2000s, power nodes started to change with time in terms of closeness. In particular, the number of closeness hubs increased rapidly for South Korean cities after 2009. Finally, the results for cities in South Korea outperformed those for Japanese cities from 2013 to 2016. These findings manifested in the exponential growth of the Korean innovation network since 2009. This result indicates that South Korea’s innovation network is not connected to the network hubs in the overall network; however, there has been some quantitative growth. It also suggests that the hub in South Korea has yet to grow sufficiently.
Figure 3. Power node distribution by country.
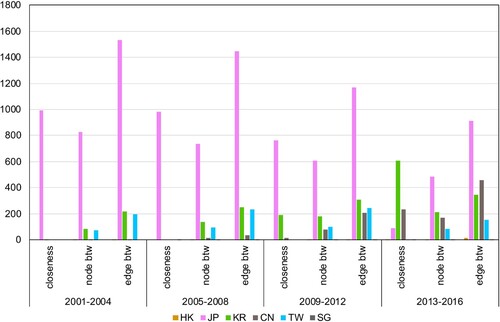
Table 3. Centrality of each time period.
Next, the structural power nodes and hubs with betweenness centrality are discussed. These findings show that there are numerous power nodes, mainly in Japanese cities. However, the share of Japanese cities has steadily decreased over time. In addition, the results of the latest period (2013–2016) show that China, South Korea, and Taiwan have a much larger share in the networks.
The distribution of structural power nodes (betweenness centrality) in East Asia seems to be correlated with changes in the proportion of the overall network. In the early 2000s, most power nodes were located in Japan (over 80%), with the rest in Taiwan and South Korea. However, over time, we observe that the percentage of power nodes in Japan decreased while that of South Korea and Taiwan increased. The characteristic period is 2009–2012: Overall, different aspects are observed in comparison to other years, bearing in mind the global economic crisis. However, the increasing trend of increasing networks in South Korea stagnated, while the percentage growth of Taiwan and the US remained high. In addition, China’s fast-growing network begins to stand out. In particular, in 2009–2012, the growth in China and South Korea rose sharply while that of Japan declined. The latest data show that Japan’s growth has dropped by about half, while that of China, South Korea, and Taiwan has become more evenly distributed.
Thus, from the number of co-inventions, we observe that there has been a change in the main hubs of GINs in East Asia from Japan to China, and South Korea.
Next, we investigated the number of power nodes and factors influencing changes in the centrality of each country’s power nodes. presents the validation of the changes in Japan and the other countries.
Figure 4. Structural power nodes plot.
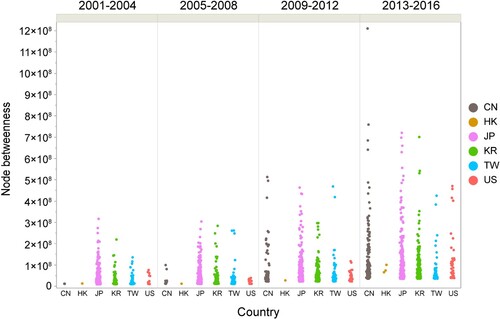
In addition to the overall number, indicates that the Japanese power nodes are decreasing in centrality. However, several key power nodes still have the highest centrality, from which it can be inferred that Japan still plays an important role in the GIN in East Asia.
4.3. Diversity of nationality in subgroups
In this section, we focus on how the subgroups of the network change. Each subgroup is integrated and spatially classified, and a detailed analysis of the subgroups is required.
In particular, it is necessary to determine whether the East Asian GINs presented in the previous section have decreased simply because more countries have applied for domestic patents in the US, or because the inventions have been made by a variety of international inventors. It is therefore necessary to ascertain the extent to which the nationalities of inventors have diversified in the subgroups of co-invention networks.
For this purpose, we used the HHI, which can intuitively assess diversity by dividing subgroups using the time period.
The HHI is a common measure of market concentration and is used to determine market competitiveness. It can range from zero to 10,000 (Hirschman, Citation1964). A market with an HHI of less than 1,500 is considered competitive, an HHI ranging from 1,500 to 2,500 is considered a moderately concentrated marketplace, and an HHI of 2,500 or greater is considered a highly concentrated marketplace. The primary disadvantage of the HHI is that it is a simple measure that does not consider the complexities of various markets.
We investigated the country-specific diversity within each subgroup. The balance of countries within each subgroup was then examined.
shows the share of inventors by country within each subgroup for each period using the HHI. shows that the circle size of the network subgroups for each era increases. The HHI indicates the share of the group by country; however, the closer to 10,000, the more exclusive it becomes. That is, if there are only internal inventors of some countries in the group, the HHI will tend to the maximum value of 10,000. Conversely, it is a form in which various countries could have a minimum value when they consist of various proportions.
Figure 5. Average HHI for each period.
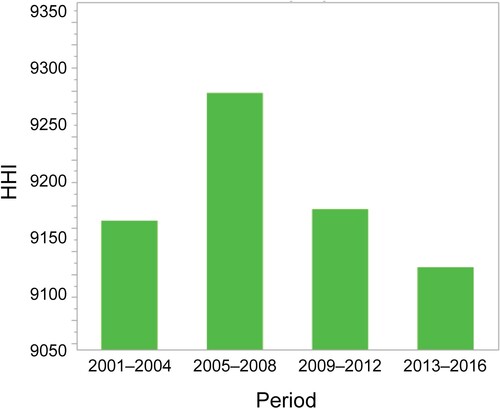
Figure 6. Bubble chart by group size for each period.
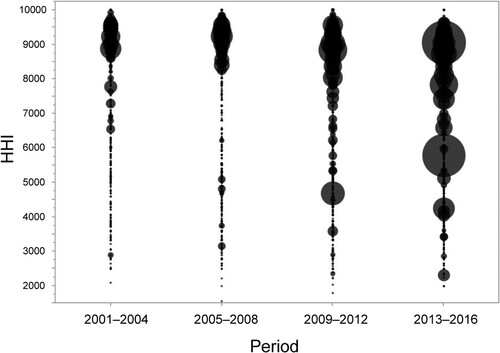
Time series observations indicate that the group size of the medium-level HHI increased as the period from 2013 to 2016 approached.
In terms of the average HHI, the 2005–2008 period was marginally the least diverse. Since then, diversity has increased over time. The results of this analysis show a gradual increase in the diversity of the nationalities of the inventors of the GIN subgroups.
5. Formation and factors of the intercity innovation network in East Asia
This section describes the spatial features of East Asia’s intra-innovation networks and their development around major metropolitan areas, and analyzes the factors underlying their development.
First, the current state of GINs in East Asia was examined through an innovation network analysis by metropolitan area. We reconstructed the innovation network of major East Asian metropolitan areas by aggregating the patent network by country. Based on this, we first examined the changes in the network by major metropolitan area in East Asia.
Next, we analyzed the factors that led to the development of the network between these metropolitan areas. To consider geographic proximity, which is a major factor in the formation of the network between each metropolitan area, the distance between metropolitan centres was set as a variable. Institutional proximity was distinguished as representative of the domestic or international network. The model was then developed to account for the population of each metropolitan area.
5.1. Formation of the metropolitan area network and its evolution in Ease Asia
In this section, the databases were projected onto major metropolitan areas based on the addresses of the inventors using the network data of the East Asian networks analyzed in Section 4. The main metropolitan areas were established to be 11, as listed in . The criteria were applied considering the population size and importance within the patent network. In addition, the capital city region of each country was included.
Table 4. List of metropolitan areas and populations.
These metropolitan areas play a significant role within the network, in addition to a high level of phase in the selected countries. Hitachi was included despite not being a metropolitan area. It has a large number of inventors compared to its population based on its patent network.
First, regarding spatial structure in the innovation network by metropolitan area through instruction, illustrates the intercity linkages. The map of the city network on co-invention demonstrates the characteristics of a network, as shown in . The values in are the summation of the edge weights and expressed as intra- and inter-networks across metropolitan areas.
Figure 7. Heat map of GIN among major cities (regions).
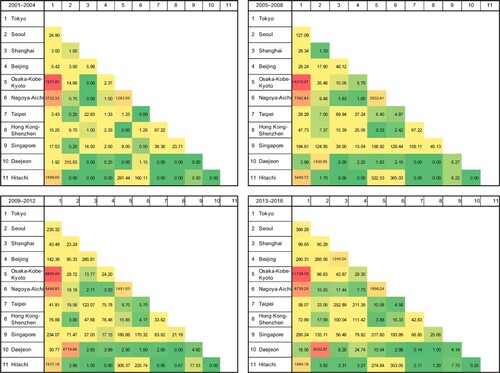
Figure 8. Map of network in the metropolitan areas of East Asia.
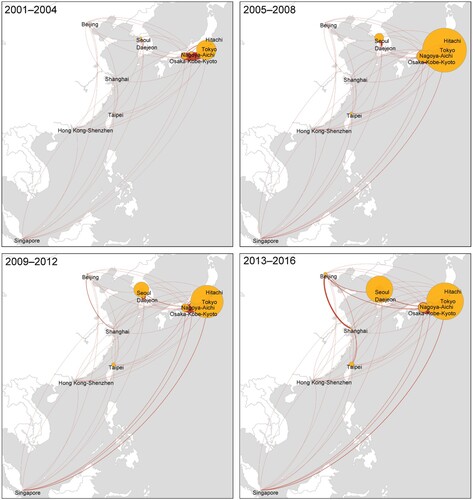
Based on Figures 7 and 8, the time series is observed. At the start of 2000, the Asian internal network consisted of a network within each country, in particular the Tokyo metropolitan area, Osaka-Kyoto-Kobe metropolitan area, and Nagoya metropolitan area. However, as time progressed, the domestic networks of Seoul and Daejeon as well as the Chinese network were also developed. Most distinctive is Singapore, which is connected to each of the Japanese metropolitan areas.
5.2. Model: considering the impacts of geographical proximity in GINs in ease Asian metropolitan cities
Next, we analyzed the factors that influenced the formation of the network between these metropolitan areas. An empirical study was conducted with the following factors using the gravity model:
We considered whether location in the same country that forms the network between each metropolitan area was reflected in the institutional proximity.
The distance variable, which reflects the geographical proximity was considered.
Finally, we selected inventors per population for each metropolitan area to consider the effects that have the internal demographic characteristics of the metropolitan area.
5.2.1. Developing the model
Here, time series data were analyzed to track changes in the geographic distance and whether domestic or international factors have an influence on innovation networks. Predictable hypotheses were as follows.
There are two main factors based on the gravity model: distance and mass of innovation (the ratio of inventors to the metropolitan population). Both their impacts will vary with time. The impact of distance will be lessened by ICT technology, smartphones, and transportation. In addition, networks will be actively formed, whether within or beyond a country. The larger the number of inventors per population in a given metropolitan area, the more networks there will be.
Based on the above hypotheses, the following model was constructed.
The estimation of gravity models of the co-patent network as Equation (4) tend to be based on a Poisson process (Andersson et al., Citation2014; Balland, Rigby, & Boschma, Citation2015; Berǵe, Citation2017). The gravity-type regressions employ the negative binomial regression model.
Therefore, this model was used with a negative binomial regression model by metropolitan unit and four periods of the time series.
(4)
(4)
y: Number of co-inventions over 4 years (weight) 4 sets × 55 combinations (for 11 metropolitan areas) X1: The product of inventors per million populations in two metropolitan areas X2: Inverse of the square of the Euclidean distance X3: The dummy variable of the national link (=1) or international link (=0) ϵ: Error term
The model was constructed using the possibility of the formation of an innovation network for each metropolitan area (the number of inventors as a percentage of the population of each metropolitan area), and inverse of the square of the Euclidean distance between metropolitan areas (converted as centres), whether within the same country or not (dummy variables). provides an overview of the determinants.
Table 5. Overview of determinants.
5.2.2. Results
From the results of the analysis conducted between 2001 and 2016, the significance of the negative binomial regression was verified for all perspectives. provides the results of the negative binomial regression.
Table 6. Results of Negative binomial regression.
First, the model investigated whether the location of the network has a sound effect on the number of joint patents. This contrasts with the hypothesis that co-patenting increases when they are in the same country, but not in the same metropolitan area. In contrast, there has been an increase in co-patenting with other metropolitan areas within East Asia, instead of exchanges with other metropolitan areas within the same country. In addition, according to the results of the analysis of chronological changes in all decades, there is no tendency for the joint patent network to increase when the metropolitan areas are in the same country. In contrast, the number of joint patents tends to increase between metropolitan areas that have active cross-border exchanges and are located in different countries but close to each other.
Second, the product of the inventor ratio in the two cities affects the number of joint patents in 2001–2004 and 2005–2008. Here, the number of inventions relative to the population size of each metropolitan area was used as a variable for the quantity in the gravity model. These results, when viewed in a time series, achieved a positive parameter in the periods 2001–2004 and 2005–2008. However, no significant effects are evident from the period after 2009. This has major implications for Japan’s metropolitan areas. The population ratio can be developed. Although many metropolitan areas are predominantly in Japan (especially Hitachi), the finding showed that the impact of these metropolitan areas has decreased from 2009 amidst the increasing number of metropolitan areas.
Third, the estimated coefficient for index of distance (X2) is positive in 2012–2016. X2 means the inverse of square of the distance. In other words, a sound correlation was derived, especially with respect to distance. The number of co-inventions when the distance decreases can be increased by the square. This is considered applicable to both domestic and international networks. The closer the geographic proximity within a country (as is usually the case), the more likely it is for a joint patent or an innovation network to be formed, and the more likely it is that this phenomenon occurs even in East Asian global metropolitan areas.
In addition, regarding the time-series, the findings suggest that the more recent the development of the network, the more the effects of decreasing the distance increases.
In other words, the analysis confirmed the effect of decreasing distance while simultaneously developing information and communication as well as transportation. However, if the distance decreases as much as it appears in chronological order, the joint patents then increase over time. Indeed, the closer you get, the more pronounced the probability of joint patents, and the more recent they are. In addition, the importance of geographical proximity in international networks is becoming more evident.
5.2.3 Additional analysis: quadratic assignment procedure
In addition to the negative binomial regression, we investigated the correlation between distance proximity and intensity of knowledge exchange, i.e. the correlation coefficients and causal relationships between networks, using the quadratic assignment procedure (QAP). As a result, correlations were found, as shows.
Table 7. Results of QAP.
According to the negative binomial regression analysis, the values for 2009–2012 are the largest. However, in the QAP, the correlation coefficient for 2013–2016 was the highest, which shows that the negative correlation became more assertive in the recent period. In other words, the strength of knowledge exchange between major metropolitan areas has become more inversely proportional to distance.
On the other hand, we decided not to employ the regression model because of its low determination coefficient. Because not all of the dependent variables are network data, the use of the QAP regression model could not obtain significant results without considering other dependencies.
6. Conclusion
This study investigated the factors influencing networks in the formation of international research collaborations in East Asia as well as its interplay with geography. To this end, a database was constructed using USPTO data and we subsequently used social network analysis. The main findings were as follows.
First, we established that a GIN exists in East Asian countries and city regions with network indicators. The East Asian network was found to be a scale-free network that satisfied the laws of this kind of network at certain time periods. Japan and South Korea had the highest share of patents followed by Taiwan and Singapore. With regard to the recent focus on the growth of China’s innovation network, their patents only began to appear from the 2010s. In the latest period (2013–2016), Korea and Taiwan have a comparable share of the network to that of Japan.
Second, a power node analysis was used to derive the centrality. There were numerous power nodes, mainly in Japanese cities, but the share of Japanese cities is steadily decreasing over time. Besides, China, South Korea, and Taiwan have a much bigger share of the networks in the latest period (2013–2016). However, several key power nodes still have the highest centrality, from which can be inferred that Japan still plays an important role in the GIN in East Asia. These results indicate that the major network hubs in Asian city regions are located in Japan, South Korea, Taiwan, and China. Looking at the chronology, the recent growth of cities in China stands out. Network hubs of cities in Japan have continuously decreased, while those of China and South Korea have experienced a sharp increase.
Third, an HHI, which can intuitively assess diversity by dividing subgroups using the time period, was calculated. In terms of the average HHI, the 2005–2008 period was marginally the least diverse. Since then, diversity has increased over time. The results of this analysis show a gradual increase in the diversity of the constituent states of inventors in the GIN subgroups.
Fourth, the influence of geographical proximity on network formation was empirically assessed using data on co-invention from 11 metropolitan regions. The structure of the GIN was introduced, and an empirical study was conducted. The first step was the creation of a database of the city-region network in East Asia. Looking at the network by metropolitan area, the networks of major cities including Tokyo, Seoul, and Taipei continue to produce large numbers of joint patents.
Finally, to examine the formation factors of networks by metropolitan area, an estimation via a negative binomial regression analysis was used to examine the effects based on distance, whether national or international, and the ratio of inventors to the metropolitan population as a mass of innovation. Consistent with the existing literature, a significant negative effect of separation variables was established, such as geographical distance and national borders. Institutional proximity was also found to have significant hampering effects on collaboration. The results show that the factor of being either domestic or international decreases over time, while geographical proximity has the greatest influence on joint invention.
In addition, the results of the QAP indicate that the strength of knowledge exchange between major metropolitan areas has become more inversely proportional to distance with a negative correlation in time series.
With the growing influence of China’s science and technology development and innovation network, East Asia’s status is growing no less than that of the US and Europe. This includes China, which leads innovation under a robust centralized system, and Japan, which has long continued its Western and independent research and development. Korea and Taiwan, which have also developed international networks, will take on more critical positions in the future global network. Therefore, international cooperation beyond the independent networks of each country is expected to become more powerful. The results of the analysis suggest that a system based on mesoscale international networks such as in East Asia exists between GIN and NIS. Unlike in the EU, countries in East Asia have established significant innovation policies domestically. However, our findings suggest that future policy should be more supportive of international networks, especially in East Asia. In addition, while geographical proximity still has significant effects among intercity networks, there seems to be a smaller effect based on whether the network is domestic or international. Based on these findings, innovation networks between nearby global metropolitan areas should be further encouraged.
Disclosure statement
No potential conflict of interest was reported by the author(s).
Additional information
Funding
References
- Albert-Cromarias, A., & Asselineau, A. (2013). Proximity cooperation driving innovation: The Naturopˆole case-file. Problems and Perspectives in Management, 11(3), 37–46.
- Andersson, D. E., Gunessee, S., Matthiessen, C. W., & Find, S. (2014). The geography of Chinese science. Environment and Planning A: Economy and Space, 46(12), 2950–2971.
- Ascani, A., Bettarelli, L., Resmini, L., & Balland, P.-A. (2020). Global networks, local specialisation and regional patterns of innovation. Research Policy, 49(8), 104031. https://doi.org/10.1016/j.respol.2020.104031
- Balland, P. A., Boschma, R., & Ravet, J. (2019). Network dynamics in collaborative research in the EU, 2003–2017. European Planning Studies, 27(9), 1811–1837.
- Balland, P.-A., Rigby, D., & Boschma, R. (2015). The technological resilience of US cities. Cambridge Journal of Regions, Economy and Society, 8(2), 167–184. doi:10.1093/cjres/rsv007
- Barab´asi, A. L., Jeong, H., Ńeda, Z., Ravasz, E., Schubert, A., & Vicsek, T. (2002). Evolution of the social network of scientific collaborations. Physica A: Statistical Mechanics and its Applications, 311(3-4), 590–614.
- Bathelt, H., Malmberg, A., & Maskell, P. (2004). Clusters and knowledge: Local buzz, global pipelines and the process of knowledge creation. Progress in Human Geography, 28(1), 31–56. Retrieved from http://journals.sagepub.com/doi/10.1191/0309132504ph469oa
- Berǵe, L. R. (2017). Network proximity in the geography of research collaboration. Papers in Regional Science, 96(4), 785–815. Retrieved from https://rsaiconnect.onlinelibrary.wiley.com/doi/abs/10.1111/pirs.12218
- Boschma, R. A. (2005). Proximity and innovation: A critical assessment. Regional Studies, 39(1), 61–74.
- Brenner, T., & Broekel, T. (2011). Methodological issues in measuring innovation performance of spatial units. Industry and Innovation, 18(1), 7–37.
- Broekel, T., Balland, P. A., Burger, M., & van Oort, F. (2014). Modeling knowledge networks in economic geography: A discussion of four methods. Annals of Regional Science, 53(2), 423–452.
- Camagni, R. (1991). Innovation networks: Spatial perspectives. London: Belhaven-Pinter.
- Cano-Kollmann, M., Hannigan, T. J., & Mudambi, R. (2018). Global innovation networks – organizations and people. Journal of International Management, 24(2), 87–92. doi:10.1016/j.intman.2017.09.008
- Cao, Z., Derudder, B., & Peng, Z. (2019). Interaction between different forms of proximity in inter-organizational scientific collaboration: The case of medical sciences research network in the Yangtze River Delta region. Papers in Regional Science, 98(5), 1903–1924. https://doi.org/10.1111/pirs.12438
- Castells, M. (1999). An introduction to the information age. London: Sage.
- Chaminade, C., & Plechero, M. (2015). Do regions make a difference? Regional innovation systems and global innovation networks in the ICT industry. European Planning Studies, 23(2), 215–237. doi:10.1080/09654313.2013.861806
- Chang, S. B., Lai, K. K., & Chang, S. M. (2009). Exploring technology diffusion and classification of business methods: Using the patent citation network. Technological Forecasting and Social Change, 76(1), 107–117. doi:10.1016/j.techfore.2008.03.014
- Chen, S.-H. (2004). Taiwanese IT firms’ offshore R&D in China and the connection with the global innovation network. Research Policy, 33(2), 337–349.
- Cooke, P., Davies, C., & Wilson, R. (2002). Innovation advantages of cities: From knowledge to equity in five basic steps. European Planning Studies, 10, 233–250. doi:10.1080/09654310120114517
- Cooke, P. (2017). Complex spaces: Global innovation networks & territorial innovation systems in information & communication technologies. Journal of Open Innovation: Technology, Market, and Complexity, 3(2), 9. doi:10.1186/s40852-017-0060-5
- Dadashpoor, H., & Yousefi, Z. (2018). Centralization or decentralization? A review on the effects of information and communication technology on urban spatial structure. Cities, 78(September 2017), 194–205.
- Dahesh, M. B., Tabarsa, G., Zandieh, M., & Hamidizadeh, M. (2020, September). Reviewing the intellectual structure and evolution of the innovation systems approach: A social network analysis. Technology in Society, 63, 101399.
- Dahlander, L., & McFarland, D. A. (2013). Ties that last. Administrative Science Quarterly, 58(1), 69–110. Retrieved from http://journals.sagepub.com/doi/10.1177/0001839212474272
- Easley, D., & Kleinberg, J. (2010). Networks, crowds, and markets: Reasoning about a highly connected world. Cambridge: Cambridge University Press. Retrieved from https://www.cambridge.org/core/books/networks-crowds-and-markets/A70C7855A3003FE1079C25F8397AF641
- Freeman, L. C. (1978). Centrality in social networks conceptual clarification. Social Networking, 1. doi:10.1016/0378-8733(78)90021-7
- Frenken, K., Ponds, R., & Van Oort, F. (2010). The citation impact of research collaboration in science-based industries: A spatial-institutional analysis. Papers in Regional Science, 89(2), 351–271. Retrieved from http://doi.wiley.com/10.1111/j.1435-5957.2010.00309.x
- Fukuda, R., Kidokoro, T., Seta, F., & Sato, R. (2019). Relocations are determined by firms’ relationships with financing institutions: A paper based on network data for Japanese firms. Papers in Regional Science, 98(October 2017), 1685–1712. doi:10.1111/pirs.12425
- Giuliani, E., Morrison, A., Pietrobelli, C., & Rabellotti, R. (2010). Who are the researchers that are collaborating with industry? An analysis of the wine sectors in Chile, South Africa and Italy. Research Policy, 39(6), 748–761.
- Glaeser, E. L., Ponzetto, G. A. M., & Zou, Y. (2016). Urban networks: Connecting markets, people, and ideas. Papers in Regional Science, 95(1), 17–59. Retrieved from https://rsaiconnect.onlinelibrary.wiley.com/doi/abs/10.1111/pirs.12216
- Granovetter, M. (1985). Economic action and social structure. American Journal of Sociology, 91. doi:10.1086/228311
- Hall, P., & Pain, K. (2006). The polycentric metropolis: Learning from mega-city regions in Europe. London: Routledge. Retrieved from https://www.taylorfrancis.com/books/9781849773911
- Hazir, C. S., LeSage, J. P., & Autant-Bernard, C. (2014). The role of R&D collaboration networks on regional innovation performance. SSRN Electronic Journal. Retrieved from http://www.ssrn.com/abstract=2507284
- Hennemann, S., & Derudder, B. (2014). An alternative approach to the calculation and analysis of connectivity in the world city network. Environment and Planning B: Planning and Design, 41(3), 392–412. Retrieved from http://journals.sagepub.com/doi/10.1068/b39108
- Hirschman, A. O. (1964). The paternity of an index. American Economic Review, 54, 761–762.
- Hoekman, J., Frenken, K., & Tijssen, R. J. (2010). Research collaboration at a distance: Changing spatial patterns of scientific collaboration within Europe. Research Policy, 39(5), 662–673.
- Inoue, H., Souma, W., & Tamada, S. (2007). Spatial characteristics of joint application networks in Japanese patents. Physica A: Statistical Mechanics and its Applications, 383(1), 152–157.
- Jones, C. I. (1995). R & D-based models of economic growth. Journal of Political Economy, 103(4), 759–784.
- Kamakura, N., & Matsubara, H. (2012). Global knowledge linkage by multinational companies and geographical agglomerations of R&D. Annals of the Association of Economic Geographers, 58(2), 118–137.
- Katz, J. S. (1994). Geographical proximity and scientific collaboration. Scientometrics, 31(1), 31–43.
- Li, Y., & Phelps, N. (2018a). Megalopolis unbound: Knowledge collaboration and functional polycentricity within and beyond the Yangtze River Delta Region in China, 2014. Urban Studies, 55(2), 443–460.
- Li, Y., & Phelps, N. A. (2018b). Articulating China’s science and technology: Knowledge collaboration networks within and beyond the Yangtze River Delta megalopolis in China. Chinese Geographical Science, 28(2), 247–260.
- Li, Y., & Phelps, N. (2019). Megalopolitan glocalization: The evolving relational economic geography of intercity knowledge linkages within and beyond China’s Yangtze River Delta region, 2004-2014. Urban Geography, 40(9), 1310–1334.
- Lim, H., & Kidokoro, T. (2017). Comparing a spatial structure of innovation network between Korea and Japan: Through the analysis of co-inventors’ network. Asia-Pacific Journal of Regional Science, 1(1), 133–153. doi:10.1007/s41685-017-0037-1
- Lin, X., Liu, B., Han, J., & Chen, X. (2018). Industrial upgrading based on global innovation chains: A case study of Huawei technologies Co., Ltd. Shenzhen. International Journal of Innovation Studies, 2(3), 81–90. doi:10.1016/j.ijis.2018.08.001
- Liu, J., Chaminade, C., & Asheim, B. (2013). The geography and structure of global innovation networks: A knowledge base perspective. European Planning Studies, 21(9), 1456–1473.
- Lorentzen, A. (2008). Knowledge networks in local and global space. Entrepreneurship & Regional Development, 20(6), 533–545. doi:10.1080/08985620802462124
- Ma, H., Fang, C., Pang, B., & Li, G. (2014). The effect of geographical proximity on scientific cooperation among Chinese cities from 1990 to 2010. PloS One, 9(11), e111705.
- Ma, H., Fang, C., Pang, B., & Wang, S. (2015). Structure of Chinese city network as driven by technological knowledge flows. Chinese Geographical Science, 25(4), 498–510.
- Maggioni, M. A., Nosvelli, M., & Uberti, T. E. (2007). Space versus networks in the geography of innovation: A European analysis. Papers in Regional Science, 86(3), 471–493. Retrieved from http://doi.wiley.com/10.1111/j.1435-5957.2007.00130.x
- Maggioni, M. A., & Uberti, T. E. (2009). Knowledge networks across Europe: Which distance matters? Annals of Regional Science, 43(3 SPEC. ISS.), 691–720.
- Malik, A., Sharma, P., Pereira, V., & Temouri, Y. (2021). From regional innovation systems to global innovation hubs: Evidence of a Quadruple Helix from an emerging economy. Journal of Business Research, 128, 587–598. https://doi.org/10.1016/j.jbusres.2020.12.009
- Marrocu, E., Paci, R., & Usai, S. (2013). Proximity, networking and knowledge production in Europe: What lessons for innovation policy? Technological Forecasting and Social Change, 80(8), 1484–1498. doi:10.1016/j.techfore.2013.03.004
- Matthiessen, C. W., Schwarz, A. W., & Find, S. (2002). The Top-level global research system, 1997-99: Centres, networks and nodality. An analysis based on bibliometric indicators. Urban Studies, 39(5-6), 903–927.
- Matthiessen, C. W., Schwarz, A. W., & Find, S. (2010). World cities of scientific knowledge: Systems, networks and potential dynamics: An analysis based on bibliometric indicators. Urban Studies, 47(9), 1879–1897.
- Morescalchi, A., Pammolli, F., Penner, O., Petersen, A. M., & Riccaboni, M. (2015). The evolution of networks of innovators within and across borders: Evidence from patent data. Research Policy, 44(3), 651–668.
- Mudambi, R., Li, L., Ma, X., Makino, S., Qian, G., & Boschma, R. (2018). Zoom in, zoom out: Geographic scale and multinational activity. Journal of International Business Studies, 49(8), 929–941. doi:10.1057/s41267-018-0158-4
- Nepelski, D., & De Prato, G. (2018). The structure and evolution of ICT global innovation network. Industry and Innovation, 25(10), 940–965. doi:10.1080/13662716.2017.1343129
- Newman, M. E. J. (2001). The structure of scientific collaboration networks. Proceedings of the National Academy of Sciences, 98(2), 404–409.
- Opsahl, T., Agneessens, F., & Skvoretz, J. (2010). Node centrality in weighted networks: Generalizing degree and shortest paths. Social Networks, 32(3), 245–251. Retrieved from https://www.sciencedirect.com/science/article/pii/S0378873310000183?via%3Dihub
- Porter, M. E. (2003). The economic performance of regions. Regional Studies, 37(6-7), 549–578. doi:10.1080/0034340032000108688
- Rallet, A., & Torre, A. (1999). Is geographical proximity necessary in the innovation networks in the era of global economy? GeoJournal, 49(4), 373–380.
- Scherngell, T., & Barber, M. J. (2009). Spatial interaction modelling of cross-region R&D collaborations: Empirical evidence from the 5th EU framework programme. Papers in Regional Science, 88(3), 531–546. Retrieved from http://doi.wiley.com/10.1111/ j.1435-5957.2008.00215.x
- Storper, M., & Venables, A. J. (2004). Buzz: Face-to-face contact and the urban economy. Journal of Economic Geography, 4(4), 351–370.
- Takeuchi, K., Taima, M., Kidokoro, T., Seta, F., & Bureau, I. (2018). Analysis on spatial pattern of Japanese technological innovation based on patent data – focusing on sectoral innovation system. Journal of the City Planning Institute of Japan, 53(2), 172–178.
- Tang, H.-H. H., & Chau, C.-F. W. (2020). Knowledge exchange in a global city: A typology of universities and institutional analysis. European Journal of Higher Education, 10(1), 93–112. https://doi.org/10.1080/21568235.2019.1694424
- Ter Wal, A. L. J. (2014). The dynamics of the inventor network in German biotechnology: Geographic proximity versus triadic closure. Journal of Economic Geography, 14(3), 589–620.
- Torre, A., & Rallet, A. (2005). Proximity and localization. Regional Studies, 39(1), 47–59.
- Uzzi, B. (1997). Social structure and competition in interfirm networks: The paradox of embeddedness. Administrative Science Quarterly, 42. doi:10.2307/2393808
- van Dijk, J., & Maier, G. (2006). ERSA conference participation: Does location matter? Papers in Regional Science, 85(4), 483–504. Retrieved from http://doi.wiley.com/10.1111/j.1435-5957.2006.00102.x
- Verginer, L., & Riccaboni, M. (2021). Talent goes to global cities: The world network of scientists’ mobility. Research Policy, 50(1), 104127.
- Wanzenböck, I., Scherngell, T., & Brenner, T. (2014). Embeddedness of regions in European knowledge networks: A comparative analysis of inter-regional R&D collaborations, co-patents and co-publications. Annals of Regional Science, 53(2), 337–368.
- Yao, L., Li, J., & Li, J. (2020, June). Urban innovation and intercity patent collaboration: A network analysis of China’s national innovation system. Technological Forecasting and Social Change, 160, 120185.