
ABSTRACT
Genetic diversity is a crucial component for plant survivability and fitness in terms of adaptation, genetic stability and variability. In this study, a total of 160 genotypes were investigated using 12 random amplified polymorphic DNA (RAPD) primers to understand the genetic structure and diversity of nine naturally distributed Ostrya carpinifolia populations in Turkey. Twelve RAPD primers yielded 111 clearly identifiable DNA bands, of which 71 bands were found to be polymorphic (64%). Observed number of alleles (Na), effective number of alleles (Ne) and Nei's gene diversity (h) were found as 2, 1.53 and 0.32, respectively. Total genetic variation (HT), within-population genetic variation (HS) and Nei's genetic differentiation coefficient (GST) were found as 0.32, 0.09 and 0.70, respectively. Genetic diversity analysis (AMOVA) revealed highly significant (P < 0.001) genetic variations among and within populations. 69.94% of total variation was observed among populations while 26.69% was within populations. Gene flow value was calculated as 0.21 (Nm < 0.5), which could homogenize the genetic structure of a population. Two geographically isolated populations demonstrated high gene diversity and polymorphic loci ratio, indicating a relationship between geographic distribution of populations and eco-geographic factors. The findings of this study will pave the way for understanding the genetic diversity between inter- and intra-populations of O. carpinifolia species, as well as they would provide valuable information for management, conservation and utilization of in situ and ex situ Ostrya germplasms.
Introduction
Habitat destruction is a crucial problem in biodiversity preservation in most ecosystems.[Citation1,Citation2] Besides, to understand the genetic structure of populations is essential prerequisite in biodiversity conservation and management practices.[Citation3,Citation4] Many studies have reported the negative effects of fragmentations on population structure and genetic diversity in plants.[Citation5–Citation7] Population fragmentations reduce the genetic diversity and increase the genetic differentiation due to reduced gene flow, random inbreeding and genetic drift.[Citation1,Citation8,Citation9] Anthropogenic activities and climatic changes have been mainly regarded as two major factors in population fragmentations, finally leading to the formation of barriers between populations and changing the genetic diversity.[Citation10–Citation12] Therefore, policy makers are required to assess the genetic structure and diversity of populations to develop more comprehensive and effective conservation policies in plant species.[Citation2]
Betulaceae (birch) family includes about 120–150 species, comprising the trees and shrubs in six genera and two subfamilies such as Betuloideae (Alnus sp. and Betula sp.) and Coryloideae (Carpinus sp., Corylus sp., Ostrya sp. and Ostryopsis sp.).[Citation13] This family members are mainly distributed in northern temperate zone and usually characterized with their stipulate, doubly serrate leaves, catkins and small winged fruits or nuts with leafy bracts.[Citation14,Citation15] Ostrya, which is a genus in Betulaceae family, comprises the several species, including O. carpinifolia (European hophornbeam), O. virginiana (Eastern hophornbeam), O. chiosensis (Chisos hophornbeam) and O. knowltonii (Knowlton hophornbeam),[Citation16,Citation17] which are native to Mexico, Eurasia, eastern Asia/Japan, USA and Canada.[Citation18,Citation19] Ostrya carpinifolia, or European hophornbeam, has a distribution from South France to Bulgaria, West Syria, Anatolia and to Transcaucasia. In Turkey, O. carpinifolia populations are distributed as small groups in angiosperm mixed forests in north and south Anatolia.[Citation19–Citation21] Turkey, which is located at crossroads of Europe and Asia, harbours a broad range of natural habitats, including from Mediterranean, Aegean and Black Sea beaches, to coastal and interior mountains, from fertile alluvial plains to arid, rocky hillslopes and valleys and to expansive steppes.[Citation22] In addition, O. carpinifolia has also been used in various studies such as wood properties,[Citation18,Citation23] pathogenicity,[Citation24] NO2 pollution, pollen research and allergenicity [Citation25] and seed germination.[Citation26] However, the number of genetic studies about this species is still limited, although some of its relatives were reported in phylogenetic analyses.[Citation13,Citation15,Citation27] Traditional assessments of plant systematics or phylogeny were mainly based on the analyses of anatomical and morphological characteristics of plants, which are usually affected by plant habitat and variability.[Citation28] However, molecular markers are now commonly used in systematics studies, as well as in genetic diversity assessments in plants.[Citation2,Citation28] Random amplified polymorphic DNA (RAPD) is a simpler, cheaper and faster PCR-based marker system.[Citation29] RAPD markers have been widely used in some wood species, including Tilia tomentosa,[Citation30] Dalbergia monticola,[Citation31] Larix gmelinii [Citation32] and Olea europaea.[Citation33] Despite of the ecological and commercial value of O. carpinifolia, little is known about the genetic aspects of this forest tree. Therefore, this study aimed to evaluate the genetic structure and diversity of natural O. carpinifolia populations distributed in Turkey using RAPD molecular markers. Study findings will pave the way for understanding of genetic diversity between inter- and intra-populations of O. carpinifolia species, as well as will provide valuable information for conservation initiatives.
Materials and methods
Sample collection and DNA extraction
A total of 160 plant leaf samples, average 20 individuals per population were collected from natural O. carpinifolia habitats in nine different regions of Turkey ( and ). Fresh leaf samples were carried to the laboratory using liquid nitrogen tank and stored at –80 °C until DNA extraction. Total genomic DNA was extracted from 0.1g of powdered fresh leaves using E.Z.N.A. Plant DNA Kit (Omega Bio-tek, Norcross, GA, USA) according to the manufacturer's instructions. DNA concentration of each sample was measured by using BioSpec-nano (Shimadzu, Kyoto, Japan) and then elutions were diluted with distilled water to a final concentration of 50 ng µL−1.
Figure 1. Natural distribution of O. carpinifolia populations in Turkey. Dots show the sampled populations (1–9) and natural distribution areas.
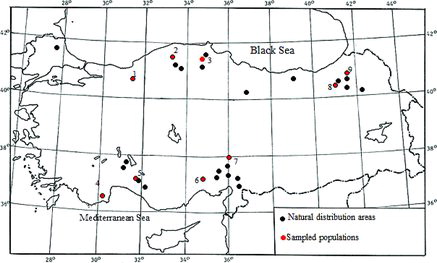
Table 1. Some geographical features of sampled O. carpinifolia populations.
RAPD-PCR amplification
A total of 23 RAPD (Operon Technologies Inc., Alameda, CA, USA) primers were checked and 12 primers, which produced clear DNA bands, were selected for further analysis (). RAPD reactions were performed in a 20-µL volume, containing 50 ng DNA, 2.5 mmol/L MgCl2, 0.25 mmol/L dNTPs, 0.5 µ mmol/L primers, 1 U Taq DNA polymerase and 2.5 µL of 10X Taq DNA polymerase buffer (Thermo Sci., Waltham, MA, USA). RAPD-PCR reactions were performed for a cycle of 3 min at 94 °C, followed by 45 cycles of 1 min at 94 °C, 1 min at 36 °C, and 1 min at 72 °C and a final cycle of 7 min at 72 °C. Amplification products were separated on 1.2% agarose gel with ethidium bromide in 1.2X TBE buffer, and digitally photographed under UV light. A 100-bp DNA ladder (Thermo Sci.) was used as a molecular ruler.
Table 2. Details of 12 RAPD primers used in this study.
Data analysis
For statistical analysis, RAPD bands were scored as present (1) or absent (0) for each population and then band patterns were translated into binary data matrix according to statistical analysis platform. Subsequently, percentage of polymorphic loci (P), mean number of observed (Na) and effective (Ne) alleles per locus,[Citation34] Nei's gene diversity (h),[Citation35–Citation37] Shannon's information index (I), total genetic variation (HT), within-population genetic variation (HS), Nei's genetic differentiation coefficient (GST) and gene flow (Nm) [Citation38] were estimated using POPGENE v. 1.32.[Citation39] Inter- and intra-population analyses were performed by Arlequin 3.5.2 software [Citation40] using AMOVA (Analysis of MOlecular VAriance) and population comparison tools with following settings; for population comparisons, Slatkin's and Reynold's distances using FST methods and pairwise differences (π) with Nei's method were selected for 100 permutations and 0.05 significance level; for AMOVA, standard AMOVA computations with 1000 permutations were adapted. A dendrogram was constructed based on Nei's [Citation36] by using unweighted pair group method with calculating the arithmetic average (UPGMA) by POPGENE. Principal coordinate analysis was performed using MVSP 3.2 (MultiVariate Statistical Package).
Results and discussion
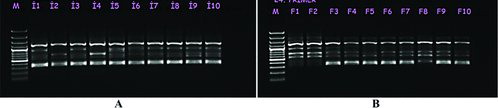
Genetic diversity is a fundamental component for plant survivability and fitness for adaptation, genetic stability and variability.[Citation41] In this study, a total of 160 genotypes were evaluated using 12 RAPD primers to understand the genetic structure and diversity of nine naturally distributed O. carpinifolia populations in Turkey. From 160 individuals of 9 natural populations, 12 primers yielded 111 clearly identifiable DNA bands (), of which 71 bands were found to be polymorphic (64%). An average band number per primer was found as 9.25 while polymorphic band number was found as 5.9. Banding patterns and polymorphism of primer OPA04 are shown in . Similar genetic diversity analyses were performed in some O. carpinifolia relatives using RAPD primers. For example, Zeng et al. [Citation42] have identified 131 highly reproducible DNA bands in Betula alnoides using 16 RAPD primers with 64.1% (84 bands) polymorphism, which significantly shared the same polymorphic loci ratio with O. carpinifolia species. In a different study, a total of 83 DNA bands were reported in six populations of B. pendula subsp. fontqueri while 81 DNA bands were found in two B. pubescens populations using six RAPD primers. Besides, polymorphic DNA bands were reported as 32.2% and 44.6% in B. pendula subsp. fontqueri and B. pubescens, respectively,[Citation43] which were considerably low compared to O. carpinifolia species. Moreover, in various studies of hazelnut (Corylus avellana), a total and mean polymorphic DNA bands were found as 216 and 9.4,[Citation44] 96 and 3.84[Citation45] and 241 and 5.7,[Citation46] respectively. Compared to O. carpinifolia species, hazelnut genotypes demonstrated about 5.9 less yields of polymorphic DNA bands.
Figure 2. RAPD profiles of selected 10 genotypes in Erzurum–Ispir (A) and Antalya–Finike (B) populations obtained by using OPA04 primer. (M: 100-bp standard marker)
Within populations, percentage of polymorphic loci (P) ranged from 17.39% (Antalya–Akseki population) to 39.13% (Antalya–Finike) (). In addition, observed number of alleles (Na), effective number of alleles (Ne), Nei's gene diversity (h) and Shannon's information index (I) were found to vary between 1.17–1.30, 1.14–1.28, 0.07–0.16 and 0.09–0.23, respectively. For all loci, genetic variation parameters (Na, Ne, h and I) were found to be as 2, 1.53, 0.32 and 0.48, respectively. Zeng et al. [Citation42] also reported mean number of alleles, effective number of alleles and gene diversity as 1.64, 1.36 and 0.214 for all loci, respectively. Thus, gene diversity in O. carpinifolia (0.32) species was found higher than that of B. alnoides (0.214).
Table 3. Genetic diversity within O. carpinifolia populations (mean ± standard error).
Furthermore, gene diversity analyses in subdivided populations demonstrated Nei,[Citation36] total genetic variation (HT), within-population genetic variation (HS), Nei's genetic differentiation coefficient (GST) and gene flow (Nm) as 0.32, 0.09, 0.70 and 0.21, respectively. Genetic differentiation coefficient (GST) was found higher (0.70) than other parameters, suggesting that GST is affected by mutation and heterozygosity.[Citation47] In addition, gene diversity or heterozygosity in entire population (HT: 0.32) was higher than average gene diversity of subpopulations (HS: 0.09). Gene flow was calculated as 0.21, indicating that genetic variations within populations could be related with low level of gene flow that shaped the genetic divergence among populations. Gene flow (Nm) is considered to be able to homogenize the genetic structure of a population.[Citation10] It is the main determinant of population structure at Nm > 0.5, and important genetic differentiation could result from genetic drift when Nm < 0.5.[Citation48] Besides, genetic variations formed by dynamic processes, including genetic drift can affect the survivability and adaptation of plant populations to changing environmental conditions.[Citation49,Citation50] Thus, genetic drift may become a major factor in genetic differentiation of gene pool in O. carpinifolia populations. Moreover, it is well known that breeding and mating system, floral morphology and reproduction mode could significantly contribute to genetic diversity.[Citation51] Therefore, breeding systems and long perennial life history of Ostrya species may have become other major contributing factors to high level of genetic diversity in O. carpinifolia populations.
Moreover, genetic identity and distance data revealed that highest (0.8927) and lowest (0.5529) genetic identity values were between Artvin–Hatilla & Duzce–Yıgılca and Nigde–Horoz & Sinop–Ayancık populations, respectively. Highest (0.5177) and lowest (0.1135) genetic distance values were between Antalya–Akseki & Niğde–Horoz and Artvin–Hatilla & Düzce–Yığılca populations, respectively ().
Table 4. Nei's unbiased measures of genetic identity (above diagonal) and genetic distance (below diagonal).
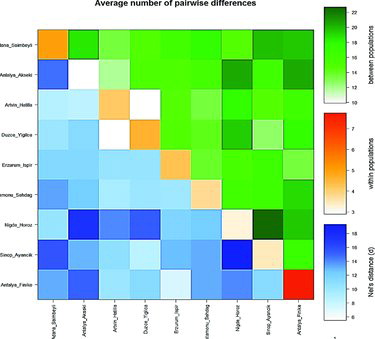
The comparative analysis of inter- and intra-population genetic variations was performed using Arlequin 3.5.2 software. For population comparison analysis (), three different colours were used to scale the average number of pairwise differences (π) between/among populations. Differences (π) within populations were diagonally scaled with orange, while differences (πxy) between populations were scaled above the diagonal with green. In addition, net number of differences between populations using Nei's distance was scaled below the diagonal with blue. Between populations (πxy), Sinop–Ayancık & Nigde–Horoz, Antalya–Akseki & Adana–Saimbeyli, Antalya–Finike & Antalya–Akseki, Nigde–Horoz & Antalya–Akseki, Sinop–Ayancık & Adana–Saimbeyli and Nigde–Horoz & Duzce–Yıgılca populations demonstrated high variations. Within population (π; diagonal), Antalya–Finike and Adana–Saimbeyli showed higher variations. Based on Nei's distance, Antalya–Akseki & Nigde–Horoz and Sinop–Ayancık & Nigde–Horoz populations represented high genetic distance.
Figure 3. Inter- and intra-population comparisons by using average number of pairwise differences. Below diagonal, diagonal and above diagonal scales represent Nei's distance, variation of within and between populations, respectively.
For molecular variation analysis (AMOVA; ), nine populations were analysed under four main groups, namely Groups 1–4, based on their geographic distributions. Group 1 included Erzurum–Ispir and Artvin–Hatilla populations; Group 2 included Duzce–Yigilca, Kastamonu–Sehdag and Sinop–Ayancik populations; Group 3 included Nigde–Horoz and Adana–Saimbeyli populations and Group 4 included Antalya–Finike and Antalya–Akseki populations. Analysis showed highly significant (P < 0.001) genetic variations among and within populations. Estimation of total genetic variation demonstrated that 69.94% of total variation was observed among populations within the groups, while 26.69% was within populations. However, genetic variation was found as low as 3.37% among groups. Previous studies have reported that in seven B. alnoides populations, 8.60% of total variation was among populations while 91.40% was within populations.[Citation42] In B. pendula, total variance was found as 64.22% among populations and 35.78% within populations.[Citation43] Moreover, there has been also reported an important relationship between geographic distribution of populations and eco-geographic factors. Some important eco-geographic factors such as latitude, altitude, temperature and moisture are also crucial determinants in genetic variability. So, morphological and physiological traits of plants are closely associated with their habitats.[Citation41] Based on geographic location, Duzce–Yıgılca and Antalya–Finike populations were isolated from other populations (as shown in ). In addition, these two populations also demonstrated high gene diversity and polymorphic loci ratio in analyses. Therefore, it seems that geographic distributions of populations and eco-geographic factors may affect the gene flow, resulting in genetic variations.
Table 5. Molecular variance (AMOVA) analysis of 160 individuals of O. carpinifolia genotypes from nine different populations using 12 primers with 111 identifiable DNA bands.
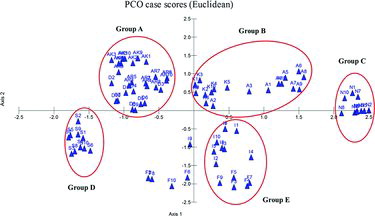
Principal coordinate analysis of selected 90 individuals from nine populations demonstrated five major groups, namely as A–E (). Highest number genotypes were detected in group A, including Antalya–Akseki, Artvin–Hatilla and Duzce–Yıgılca populations. Nigde–Horoz population (N) in group C and Sinop–Ayancık (S) population in group D were clearly separated from other populations. In addition, Adana–Saimbeyli and Kastamonu–Sehdag populations were grouped together in group B, while Antalya–Finike and Erzurum–Ispir populations were in group E. However, some genotypes of Antalya–Finike population (F2, 6, 8 and 10) and I9 genotype from Erzurum–Ispir population were isolated from all groups.
Figure 4. Principal coordinate analysis of RAPD profiles among 90 individuals of O. carpinifolia by using MVSP program. Each population was represented as 10 individuals. D: Duzce–Yıgılca, K: Kastamonu–Sehdag, S: Sinop–Ayancık, F: Antalya–Finike, AK: Antalya–Akseki, N: Nigde–Horoz, A: Adana–Saimbeyli, I: Erzurum–Ispir; AR: Artvin–Hatilla.
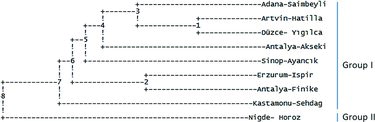
Genetic cluster analysis was performed using UPGMA method (). Analysis demonstrated two major groups namely as group I and II. Group I included eight populations such as Adana–Saimbeyli, Artvin–Hatilla, Duzce–Yıgılca, Antalya–Akseki, Sinop–Ayancık, Erzurum–Ispir, Antalya–Finike and Kastamonu–Sehdag, while group II only contained Nigde–Horoz population. This showed that genetic similarity data were in agreement with principal coordinate analysis. In addition, Artvin–Hatilla & Duzce–Yıgılca and Erzurum–Ispir & Antalya–Finike populations were identified as most similar populations, while Nigde–Horoz was the most diverged population.
Figure 5. Genetic distance dendrogram of O. carpinifolia populations using UPGMA clustering method. The tree was constructed by using POPGENE v. 1.32.
Conclusion
Distribution of genetic diversity within and among populations is a crucial factor to be taken into consideration in conservation efforts, particularly in case of in situ conservation. Molecular methods have become an important part of genetic diversity studies.[Citation52] Knowledge obtained from genetic diversity analyses could be used in managing and conservation of both in- situ and ex situ germplasms.[Citation41] Thus, genetic structure and diversity analyses in O. carpinifolia populations could provide valuable information for management, conservation and utilization of in situ and ex situ Ostrya germplasms. In this study, total variation among populations was found as 69.94%, however Duzce–Yıgılca and Antalya–Finike populations showed high percentage of polymorphic loci (P%) and gene diversity (h). Therefore, these two populations should be subject to major conservation with special attention. However, all natural populations are recommended to be considered as a distinct management unit to provide germplasm resource for large-scale development of plantations in future. Also, ex situ conservation strategies such as seed collection, clonal multiplication, etc. should be separately developed.
Disclosure statement
No potential conflict of interest was reported by the authors.
Additional information
Funding
References
- Young AG, Boyle T, Brown T. The population genetic consequences of habitat fragmentation for plants. Trends Ecol Evol. 1996;11:413–441.
- Bajpai PK, Warghat AR, Sharma RK, et al. Structure and genetic diversity of natural populations of Morus alba in the Trans-Himalayan Ladakh region. Biochem Genet. 2014;52:137–152. 3-4
- Baverstock PR, Moritz C. Project design. In: Hillis D, Moritz C, Mable B, editors. Molecular systematics. Sunderland (MA): Sinauer Associates Inc; 1996. p. 17–27.
- Allendorf FW, Luikart G. Conservation and the genetics of populations. Carlton: Blackwell Publishing; 2007.
- Cardoso SRS, Provan J, Lira CDF, et al. High levels of genetic structuring as a result of population fragmentation in the tropical tree species Caesalpinia echinata Lam. Biodivers Conserv. 2005;14:1047–1057.
- Prentice HC, Lonn M, Rosquist G, et al. Gene diversity. Princeton (NJ): Princeton University Press; 2006.
- Yao XH, Ye QG, Kang M, et al. Microsatellite analysis reveals interpopulation differentiation and gene flow in the endangered tree Changiostyrax dolichocarpa (Styracaceae) with fragmented distribution in central China. New Phytol. 2007;176:472–480.
- Sork VL, Nason J, Campbell DR, et al. Landscape approaches to historical and contemporary gene flow in plants. Trends Ecol Evol. 1999;14:219–224.
- Lowe AJ, Boshier D, Ward M, et al. Genetic resource impacts of habitat loss and degradation; reconciling empirical evidence and predicted theory for neotropical trees. Heredity. 2005;95:255–273.
- Slatkin M. Gene flow and the geographic structure of populations. Science. 1987;236:787–792.
- Ruttanaprasert R, Banterng P, Jogloy S, et al. Genotypic variability for tuber yield, biomass, and drought tolerance in Jerusalem artichoke germplasm. Turk J Agr Forestry. 2014;38:570–580.
- Mlcek J, Valsikova M, Druzbikova H, et al. The antioxidant capacity and macroelement content of several onion cultivars. Turk J Agr Forestry. 2015;39:999–1004.
- Grimm GW, Renner SS. Harvesting Betulaceae sequences from GenBank to generate a new chronogram for the family. Bot J Linn Soc. 2013;172:465–477.
- Kubitzki K. Betulaceae. In: Kubitzki K, editor. The families and genera of vascular plants. Berlin: Springer; 1993. p. 152–157.
- Chen ZD, Manchester SR, Sun HY. Phylogeny and evolution of the Betulaceae as inferred from DNA sequences, morphology and palaeobotany. Am J Bot. 1999;86:1168–1181.
- Flynn JH. A guide to useful woods of the world. Portland (ME): King Philip Publishing Co; 1994.
- Alden HA. Hardwoods of North America. General Technical Report-Forest Products Laboratory. USDA Forest Service. ( FPL-GTR-83); 1995.
- Dogu AD, Kartal SN, Kose C, et al. Some anatomical properties and wood density of Ostrya carpinifiloa Scop. JFFIU. 2000;50:167–176.
- Yaltirik F, Efe A. Dendrology handbook, Gymnospermae–Angiospermea. ( University of Istanbul Publication; no. 4265). ( Faculty of Forestry Publication; no. 465); 2000.
- Davis PH. Flora of Turkey and the East Aegean Island. Vol. 7. Edinburgh (TX): Edinburgh University Press; 1982.
- Ansin R, Ozkan, ZC. Phanerogameus woody taxons. Vol. 167. Trabzon: Karadeniz Technical University Publication; 2001.
- Kaya Z, Raynal DJ. Biodiversity and conservation of Turkish forests. Biol Conserv. 2001;97:131–141.
- Korkut S, Guller B. Physical and mechanical properties of European Hophornbeam (Ostrya carpinifolia Scop.) wood. Bioresource Technol. 2008;99:4780–4785. 11
- Piskur B, Pavlic D, Slippers B, et al. Diversity and pathogenicity of Botryosphaeriaceae on declining Ostrya carpinifolia in Slovenia and Italy following extreme weather conditions. Eur J Forest Res. 2011;130:235–249.
- Cuinica LG, Abreu I, Silva JE. Effect of air pollutant NO2 on Betula pendula, Ostrya carpinifolia and Carpinus betulus pollen fertility and human allergenicity. Environ Pollut. 2014;186:50–55.
- Kulaç Ş, Güney D, Çiçek E, et al. Effect of provenance, stratification and temperature on the germination of European hophornbeam (Ostrya carpinifolia Scop.) seeds. J Food Agric Environ. 2013;11:2815–2819.
- Li J. Sequences of low-copy nuclear gene support the monophyly of Ostrya and paraphyly of Carpinus (Betulaceae). J Syst Evol. 2008;46:333–340.
- Feng SG, Lu JJ, Gao L, et al. Molecular phylogeny analysis and species identification of Dendrobium (orchidaceae) in China. Biochem Genet. 2014;52:127–136.
- Williams JG, Kubelik AR, Livak KJ, et al. DNA polymorphisms amplified by arbitrary primers are useful as genetic markers. Nucleic Acids Res. 1990;18(22):6531–6535.
- Filiz E, Birbilener S, Ozyigit II, et al. Assessment of genetic variations of silver lime (Tilia tomentosa Moench.) by RAPD markers in urban and forest ecosystems. Biotechnol Biotec Equip. 2015;29:631–636.
- Andrianoelina O, Rakotondraoelina H, Ramamonjisoa L, et al. Genetic diversity of Dalbergia monticola (Fabaceae) an endangered tree species in the fragmented oriental forest of Madagascar. Biodivers Conserv. 2006;2:49—68.
- Zhang L, Zhang HG, Li XF. Analysis of genetic diversity in Larix gmelinii (Pinaceae) with RAPD and ISSR markers. Genet Mol Res. 2013;12:196–207.
- Hagidimitriou M, Katsiotis A, Menexes G, et al. Genetic diversity of major Greek olive cultivars using molecular (AFLPs and RAPDs) markers and morphological traits. J Am Soc Hort Sci. 2005;130:211–217.
- Kimura M, Crow JF. The number of alleles that can be maintained in a finite population. Genetics. 1964;49:725–738.
- Nei M. Analysis of gene diversity in subdivided populations. P Natl Acad Sci USA. 1973;70:3321–3323.
- Nei M. Estimation of average heterozygosity and genetic distance from a small number of individuals. Genetics. 1978;89:583–590.
- Nei M. Molecular evolutionary genetics. New York (NY): Columbia University Press; 1987.
- McDermott JM, McDonald BA. Gene flow in plant pathosystems. Ann Rev Phytopathol. 1993;31:353–373.
- Yeh FC, Boyle T, Rongcai Y, et al. POPGENE version 1.32: Microsoft windows-based freeware for population genetic analysis. Edmonton: University of Alberta; 1999.
- Excoffier L, Lischer HEL. Arlequin suite ver 3.5: a new series of programs to perform population genetics analyses under Linux and Windows. Mol Ecol Resour. 2010;10:564–567.
- Rao VR, Hodgkin T. Genetic diversity and conservation and utilization of plant genetic resources. Plant Cell Tiss Org. 2002;68:1–19.
- Zeng J, Zou Y, Bai J, et al. RAPD analysis of genetic variation in natural populations of Betula alnoides from Guangxi, China. Euphytica. 2003;134:33–41.
- Martín C, Parra T, Clemente-Muñoz M, et al. Genetic diversity and structure of the endangered Betula pendula subsp. fontqueri populations in the south of Spain. Silva Fenn. 2008;42:487–498.
- Pop IF, Pamfil D, Raica PA, et al. Evaluation of the genetic diversity of several Corylus avellana accessions from the Romanian national hazelnut collection. Not Bot Hort Agrobot Cluj. 2010;38:61–67.
- Kafkas S, Doğan Y, Sabır A, et al. Genetic characterization of hazelnut (Corylus avellana L.) cultivars from Turkey using molecular markers. Hortscience. 2009;44:1557–1561.
- Erdogan V, Koksal AI, Aygun A. Assessment of genetic relationships among Turkish hazelnut (Corylus avellana L.) cultivars by RAPD markers. Rom Biotech Lett. 2010;15:5591–5601.
- Ryman N, Leimar O. GST is still a useful measure of genetic differentiation – a comment on Jost's D. Mol Ecol. 2009;18:2084–2087.
- Wolf PG, Soltis PS. Estimates of gene flow among populations, geographic races, and species in the ipomopsis aggregata complex. Genetics. 1992;130:639–647.
- Hartl DL, Clark AG. Principles of population genetics. Vol. 116. Sunderland (MA): Sinauer Associates; 1997.
- Lacerda DR, Acedo MDP, Lemos FJP, et al. Genetic diversity and structure of natural populations of Plathymenia reticulata (Mimosoideae), a tropical tree from the Brazilian Cerrado. Mol Ecol. 2001;10:1143–1152.
- Loveless MD, Hamrick JL. Ecological determinants of genetic structure in plant populations. Ann Rev Ecol Syst. 1984;15:65–96.
- Karp A, Edwards KJ. Molecular techniques in the analysis of the extent and distribution of genetic diversity. Paper presented at: IPGRI Workshop on Molecular Genetic Tools in Plant Genetic Resources; 1995 October 9–11; Rome: IPGRI.