
 ?Mathematical formulae have been encoded as MathML and are displayed in this HTML version using MathJax in order to improve their display. Uncheck the box to turn MathJax off. This feature requires Javascript. Click on a formula to zoom.
ABSTRACT
An aspartate aminotransferase (AATase) gene from Lactobacillus brevis CGMCC 1306 was cloned, which contains a 1182-bp open reading frame coding for 393 amino acids (41.43 kDa). When expressed in Escherichia coli BL21 (DE3), the recombinant AATase was purified and subsequently characterized. The recombinant AATase can catalyse the conversion of L-Asp to L-Glu, and the kcat/Km was determined to be 25.5 (mmol/L)−1 s−1 for L-Asp and 207.8 m(mol/L)−1 s−1 for α-ketoglutarate. With optimum temperature as 25 ˚C, the AATase may be a novel and special psychrophilic enzyme which exhibited a good thermal stability below 55 ˚C. The conserved active site residue of AATase was identified as Lys237 by phylogenetic analysis. Secondary structure of the enzyme includes α-helix (39.2%), β-sheet (5.5%), β-turn (8.8%), and random coil (36.5%) by circular dichroism spectral analysis. Phase diagram for the fluorescence data analysis showed that guanidinium chloride-induced unfolding of AATase involved at least one intermediate.
Introduction
Aspartate aminotransferase (AATase, EC 2.6.1.1), with pyridoxal 5'-phosphate (PLP) as a coenzyme, catalyses the reversible transamination reaction of L-aspartate and α-ketoglutarate into the corresponding oxaloacetate and L-glutamate via a ping-pong mechanism [Citation1]. The reaction can be divided into two half reactions, where the amino group of dicarboxylic amino acids is first transferred to PLP to form pyridoxamine phosphate (PMP) and then from PMP to of α-keto-acids acceptor [Citation2]. AATase, which links amino acid metabolism to carbohydrate metabolism, plays a key role in carbon and nitrogen metabolism regulation in all organisms [Citation3,Citation4]. Due to the advantages of transamination reaction in synthesizing chiral amino compounds or fragile compounds amination, AATases become promising biocatalysts to produce large quantities of chiral compound [Citation5].
AATases from many species have been isolated and characterized, and the three-dimensional (3D) structures of AATases from various sources have been determined [Citation6–10]. The structure and active site residues of the enzymes are well conserved. The roles of active site residues around PLP in AATase have been clarified by X-ray crystallographic studies coupling with site-directed mutagenesis [Citation11]. However, the biochemical and molecular properties of this AATase are not well characterized in lactic acid bacteria (LAB), even though a gene annotated as encoding AATase has been identified by analysing the complete genome sequence of Lactobacillus brevis ATCC 367. As obligate fermentative microorganisms, the main product of LAB in glycolysis is lactic acid [Citation12]. Because LAB do not possess a complete citric acid cycle (TCA), their amino acid metabolic pathways are perhaps incomplete or altogether different to those studied prokaryotic organisms such as Escherichia coli or Bacillus. LAB are applied to produce the fermented product such as yogurt or kimchi, so that the catabolism products of amino acid are also concerned for the safety and the quality of fermented foods and beverages. To date and in the context of LAB enzyme, little is known about the specific roles of AATase in amino acid catabolic pathways of LAB. Accordingly, it is important to study the structure–function relationships of AATase in LAB.
In the present study, a new gene encoding an AATase was cloned from Lb. brevis CGMCC 1306 strain and analysed phylogenetically. The aat gene was expressed in E. coli BL 21 (DE3) using pET-28a vector and the purified AATase was characterized. We also attempted to investigate guanidinium chloride (GdmCl)-induced unfolding of AATase.
Materials and methods
Chemicals and strain
L-aspartic acid, L-glutamate acid, α-ketoglutaric acid, and Nicotinamide adenine dinucleotide (NADH) were acquired from Aladdin-reagent Co., Ltd. (Shanghai, China). 5'-pyridoxal phosphate (5'-PLP), kanamycin (Kan), and isopropyl-β-D-thiogalactopyranoside (IPTG) were purchased from Sangon Inc. (Shanghai, China). EasyPure Plasmid Mini-preps Kit and EasyPure QuickGel Extraction Kit were obtained from TransGen Biotech (Beijing, China). Sodium dodecyl sulphate-polyacrylamide gel electrophoresis (SDS-PAGE) protein markers were from Sangon (Shanghai, China). Malate dehydrogenase was from Amresco Inc. (Solon, OH, USA). The strain used in this work, Lb. brevis CGMCC 1306, is kept in the China General Microbiological Culture Collection Center (CGMCC) [Citation13]. E. coli DH 5α and E. coli BL21 (DE3) were from Novagen (Madison, WI, USA).
Plasmids and culture medium
Plasmid pMD19-T simple vector from Takara Bio Inc. (Dalian, China) was used as aat gene cloning, and pET-28a(+) vector was used for expression of aat gene. Lb. brevis CGMCC 1306 was cultured at 30 ˚C in Glucose-Yeast Extract-Peptone (GYP) medium without agitation. All E. coli strains were cultivated in Luria–Bertani (LB) medium at 37 ˚C. When necessary, kanamycin sulphate was added in LB at a final concentration of 50 μg/mL.
Cloning of Lb. brevis CGMCC 1306 aat gene and construction of pET-28a(+)-aat
Fan et al. reported that 16S rDNA of Lb. brevis CGMCC 1306 had 99% similarity with Lb. brevis NRIC 0138 and Lb. brevis TCCC13001 by alignment with other sequences in GenBank [Citation14]. Genomic DNA was extracted from this strain and used as the polymerase chain reaction (PCR) template. The aat gene was amplified from the genomic DNA using a primer set based on Lb. brevis ATCC 367 genome sequences [Citation15]: 5′-CGCGGATCCATGCGACTTTCACAGCGAG-3′ (forward) and 5′-CCGGAATTCTTACGGGGTTGTCATAAATTTAG-3′ (reverse). The PCR program for aat gene amplification was: (1) 95 °C for 5 min, (2) 25 cycles of 95 °C for 30 s, 55 °C for 30 s, and 72 °C for 2 min, and (3) a final extension at 72 °C for 10 min. The resulting PCR-amplified fragments were ligated into the pMD19-T simple vector to generate the pMD19-T-aat plasmid. Next, the pMD19-T-aat plasmid was transformed into E. coli DH5α, and the sequences of positive clones were determined by Sangon Co., Ltd. (Shanghai, China). The nucleotide sequence of the aat gene has been submitted to the Genbank databases under accession no. KJ025080. The PCR-amplified aat gene was digested with BamH I-EcoR I, and followed by purification. The purified products were mixed with the linearized vector pET-28a digested with BamH I-EcoR I for ligation using T4 DNA ligase. The recombinant expression vector pET-28a-aat was transformed into E. coli BL21 (DE3) competent cells by heat shock. Positive colonies of E. coli BL21 cells carrying pET-28a(+)-aat were selected on LB-kanamycin plates and confirmed by colony PCR as well as restriction enzyme analysis with BamH I-EcoR I.
Expression and purification of AATase-(His)6 fusion protein
E. coli BL21 cells containing pET-28a(+)-aat were grown in LB medium with kanamycin (50 μg/mL) at 37 °C until cell density (OD600) reached 0.6, and then cooled to 25 °C. AATase expression was induced with 1 mmol/L IPTG for 18 h at 25 °C, and the cells were harvested by centrifugation at 6000 rpm for 10 min at 4 °C. And then the cells were re-suspended in buffer A (100 mmol/L sodium phosphate, 300 mmol/L NaCl, 10 mmol/L imidazole, pH 8.0). After the samples were processed through a high-pressure homogenizer (ATS-AH100B, ATS Engineering Inc., Canada) at 800 bar for two times, the lysed debris was removed by centrifugation at 12,000 rpm for 30 min at 4 °C and the supernatant was used for protein purification.
Because the pET-28a(+) vector carries an N-terminal His•Tag sequence (ATGGCTAGCATGACTGGTGGACAGCAA) which is upstream of the BamH I recognition sequence (GGATCC) and the aat gene was introduced into the vector between the BamH I site and EcoR I site, the recombinant AATase obtained one His6-tag in its N-terminal and was correspondingly purified from the cell lysate by using Ni-affinity chromatography, according to the manufacturer's instruction. AATase protein was eluted in buffer B (100 mmol/L sodium phosphate, 300 mmol/L NaCl, 200 mmol/L imidazole, pH 8.0). SDS-PAGE was used for determining AATase purity using 8% (w/v) acrylamide gel for separation and 5% (w/v) gel for stacking. The protein concentration was determined using the Bradford method [Citation16].
Characterization of recombinant AATase
AATase activity was measured according to the method of Collier and Kohlhaw [Citation17]. A total of 2 mL assay mixture contained 100 mmol/L potassium phosphate buffer (pH 8.0), 15 mmol/L L-aspartate, 5 mmol/L α-ketoglutarate and enzyme solution. The assay was performed at 25 °C for 30 min, the reaction was stopped with 0.1 mL of 10 mol/L NaOH and the absorbance of the test sample was determined at 265 nm.
Using α-ketoglutarate as amino acceptor, the conversion of L-Asp to L-Glu was analysed by high-performance liquid chromatography (HPLC) using a Waters e2695 HPLC Series System and a Waters 2689 UV/Vis detector equipped with ODS C18 reverse-phase column using a gradient elution procedure [Citation18]. After reaction, a 100 μL sample was mixed with 900 μL NaHCO3 solution (0.2 mol/L, pH 9.8), and an aliquot of 100 μL of the above mixture was added to 100 μL of dansyl chloride (8 g/L) and incubated at 30 °C for 1 h. After derivatization, HPLC was used to analyse the sample for determining the L-Glu synthesized as described previously.
To investigate the optimal pH of the enzyme, two buffered systems were used: 100 mmol/L potassium phosphate (pH 6.0–8.0) and 100 mmol/L Tris-HCl (pH 7.2–8.8). The temperature effects on AATase activity were determined at pH 8.0, and the enzyme stability was measured by incubating enzyme for 5, 15, 30 and 60 min at 40, 45, 50, 55 and 65 °C before measuring the activity, respectively.
For kinetic parameters determination, the assay was performed at 25 °C with reaction volume of 900 µL containing 0.1 mol/L potassium phosphate buffer (pH 8.0), 25 µmol/L PLP, 0.1 mmol/L NADH, 1.52 U/mL malate dehydrogenase, and 4.5 µL of purified enzyme [Citation19]. The reaction was monitored continuously by recording the change rate in NADH absorbance at 340 nm by UV-5500 UV-vis spectrophotometer (Yuanxi Inc., Shanghai, China). When determining the Km for L-Asp (KmL-Asp), AATase substrate concentrations were varied in the range of 1–20 mmol/L of L-aspartate with a fixed concentration of α-ketoglutarate (10 mmol/L); and when determining the Km for α-ketoglutarate (Kmα-KG), α-ketoglutarate was varied in the range of 0.1–1 mmol/L with a fixed concentration of L-aspartate (10 mmol/L). Data were fitted to the Michaelis–Menten equation by nonlinear regression using Origin 7.5 (Northampton, MA, USA).
Circular dichroism and sequence analysis
The purified AATase (dissolved in 20 mmol/L potassium phosphate buffer, pH 8.0) was diluted to 30 µg/mL. Circular dichroism (CD) measurements were made with a Jasco J-815 spectropolarimeter (Nihon Bunko, Tokyo). Wavelength scan data were collected from 190 to 250 nm at a scan speed of 100 nm/min and with a response time of 2 s.
Alignments of protein sequences were conducted with ENDscript 2 program (http://endscript.ibcp.fr). The AATase sequences of different species were retrieved from Protein Daba Bank (PDB) and aligned by using ENDscript 2. The 3D structure of AATase from Lb. brevis CGMCC 1306 was obtained by homology modelling via the SWISS-MODEL service platform [Citation20,Citation21]. The subunit A of AATase from Phormidium lapideum (PDB ID: 1j32) was used as the model building template [Citation22]. The structure was viewed with PyMOL 1.5.0.4 software.
Chemical denaturation of AATase with GdmCl
Native AATase was denatured by incubating in 50 mmol/L phosphate buffer (pH 8.0) for 24 h at 4 °C containing 0–6 mol/L GdmCl. Emission spectra (300–500 nm) at 240 nm/min with a slit width of 5 nm were recorded on a Hitachi F-4500 fluorescence spectrophotometer (Tokyo, Japan) at a 280 nm excitation with a slit width of 5 nm.
To confirm the formation of intermediates in the unfolding of AATase, the method of phase diagrams was applied for fluorescence data analysis [Citation23,Citation24]. The essence of this method is to construct the diagram Y320 versus Y365, where Y320 and Y365 are the fluorescence intensity values measured at wavelengths 320 and 365, respectively. The fluorescence intensity at 320 (Y320) and 365 nm (Y365) was measured at different GdmCl concentrations. If the folded protein (N) unfolds without a stable intermediate to the unfolded form (U), then the changes at Y320 and Y365 are proportional according to the following equation:(1)
(1)
(2)
(2)
(3)
(3) Y320 (N) stands for the fluorescence intensity of the folded form at 320 nm, and Y365 (U) represents the fluorescence intensity of the unfolded form at 365 nm. If the parametric relationship between Y320 and Y365 is not linear, one or several intermediate states exist in the transition process from the initial to the final state.
Results and discussion
Sequence analysis
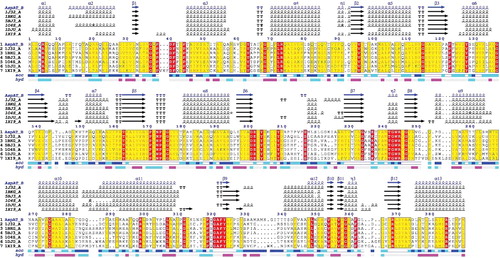
Based on the DNA isolation from Lb. brevis CGMCC 1306 and PCR described previously, a specific band of approximately 1182 bp in length was obtained from the agarose gel analysis. The nucleotide sequence of the aat gene was cloned and sequenced; it was 1182 bp in length and encodes a 393 amino acid protein with a calculated molecular weight of 41.43 kDa and a predicted isoelectric point of 5.68. The nucleotide sequence of the aat gene was deposited in the GenBank database under the accession number KJ025080. Alignment of AATase from Lb. brevis CGMCC 1306 with known AATase using ENDscript 2 program indicated a much lower identity (). The AATase deduced that amino acid sequence of this stain had 39%, 41%, 40%, 37%, 34%, and 33% identity with P. lapideum (PDB accession no. 1J32_A), Thermus thermophilus (PDB accession no. 1BKG_A), Thermus aquaticus (PDB accession no. 5BJ3_A), Thermotoga maritima (PDB accession no. 1O4S_A), Pyrococcus horikoshii (PDB accession no. 1DJU_A), and Pyrococcus furiosus (PDB accession no. 1XI9_A), respectively. The AATase domain also possesses a conserved lysine residue (Lys237) that is required for the binding of cofactor PLP to form a Schiff base, via a covalent imino linkage between the ϵ-amino group of the Lys residue and C-4’ of the PLP cofactor. The conserved amino acids (Tyr64, Trp125, Asp202, Tyr204, and Arg245) in the active site were found in other AATases [Citation9]. Grand average of hydropathicity value of the AATase was 0.239, and the protein was hydrophobic.
Figure 1. Sequence alignment of several members of the AATase family. (1) AATase from Lb. brevis CGMCC 1306; (2) AATase from Phormidium lapideum; (3) AATase from Thermus thermophilus; (4) AATase from Thermus aquaticus; (5) AATase from Thermotoga maritima; (6) aromatic aminotransferase from Pyrococcus horikoshii; (7) alanine aminotransferase from Pyrococcus furiosus. The deduced amino acid sequence was analysed using the ENDscript 2 program. Alternate residues are highlighted by grey stars. Identical and similar residues are boxed in black and grey, respectively. Solvent accessibility (acc) is rendered by a first bar below the sequence (in dark is accessible, grey is intermediate, white is buried) and hydropathy (hyd) by a second bar below (in dark is hydrophobic, white is neutral, gray is hydrophilic). The alignment of secondary structure was based on the 3D data through structural modelling.
Recombinant AATase expression and purification
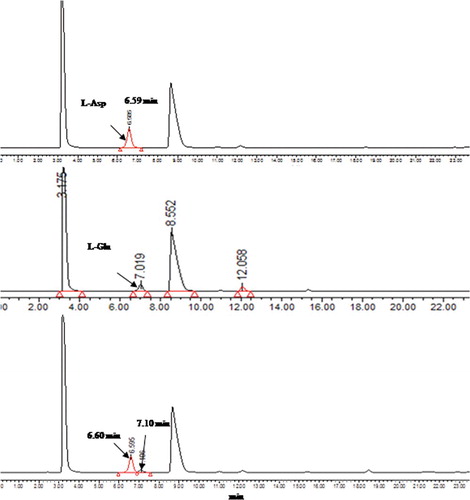
After transforming the pET-28a(+)-aat plasmid into E. coli BL21 (DE3), expression of AATase under the control of T7 promoter was induced by IPTG and monitored by SDS-PAGE, which showed the presence of target AATase protein in the crude cell extracts (). After high-pressure homogenization and centrifugation, the clear cell lysate was loaded onto the Ni-NTA-agarose column and samples collected at the elution peak were pooled and subjected to SDS-PAGE. As shown in , a clear single band corresponding to the expected size (41 kDa) of the target recombinant enzyme was observed in the eluted samples. To further confirm whether this new AATase from Lb. brevis CGMCC 1306 might still possess AATase activity, HPLC analysis showed that retention time (7.1 min) of a noticeable peak in the reaction products was in accordance with that of the L-Glu standard (). The result showed that recombinant AATase had the ability to transfer the amino group of L-Asp onto the carbonyl group of α-ketoglutarate to produce L-Glu, but transamination activity was not detected using aromatic amino acids as amino donors.
Figure 2. Sodium dodecyl sulphate-polyacrylamide gel electrophoresis (SDS-PAGE) analysis of the expression and purification of recombinant AATase in E. coli BL21. The protein was visualized with Coomassie blue staining. Lanes: (1) cell extracts; (2) flow-through sample after loading on crude extract; (3) sample of 20 mmol/L imidazole elution; (4) sample of 50 mmol/L imidazole elution; (5) sample of 100 mmol/L imidazole elution; (6) sample of 250 mmol/L imidazole elution; (7) low-weight protein marker.
Figure 3. High-performance liquid chromatography (HPLC) analysis of reaction products of purified recombinant AATase with L-Asp as the substrate. Absorption traces of the column eluates are shown. Absorption of the derivatized L-Asp and L-Glu was measured at 254 nm.
CD spectra of the recombinant AATase were measured in the far UV region (190–250 nm). The secondary structure of AATase included α-helix (39.2%), β-sheet (5.5%), β-turn (8.8%), and random coil (36.5%) by CD spectral analysis (data not shown). The secondary structure of AATase predicted by "self-optimized prediction method with alignment" (SOPMA) [Citation25] was mainly composed of α-helix (44.0%), β-sheet (18.1%), β-turn (9.2%), and random coil (28.7%).
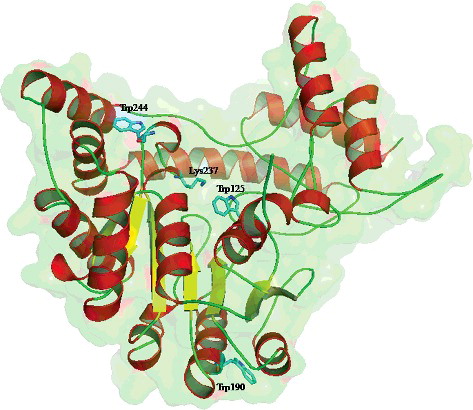
showed the 3D structure of wild-type AATase from Lb. brevis CGMCC 1306. When sequence identity is below 30%, the accuracy of comparative models decreases sharply mainly because of a rapid increase in alignment errors [Citation26]. Due to the high degree of sequence identity (39.6%), the monomer homology model of wild-type AATase has almost the same fold as the subunit A of AATase from P. lapideum. As depicted in , each AATase monomer is composed of 19 α-helices and 12 β-sheets. Moreover, the QMEAN value of −2.83 also indicated that the constructed model of AATase from Lb. brevis CGMCC 1306 had good quality which was satisfactory for the following study even without further optimization [Citation27].
Figure 4. Cartoon representation of the homology model of wild-type AATase monomer from Lb. brevis CGMCC 1306. Lys237, Trp125, Trp190, and Trp244 residues in sticks are marked.
Influence of temperature and pH on the activity of the recombinant AATase
The optimal temperature of purified AATase was 25 °C in potassium phosphate buffer (pH 8.0) ((A)), which is significantly lower than that of AATase from E. coli (EcAATase) and AATase from psychrophilic bacterium Pseudoalteromonas haloplanktis TAC 125 (PhAATase). It was reported that the optimal temperature for EcAATase and PhAATase was approximately 75 and 64 °C, respectively [Citation28]. Considering the fact that PhAATase is a psychrophilic enzyme and AATases usually exhibit a remarkable tendency towards thermophilicity and thermostability, this special lower optimum temperature clearly suggested that the AATase from Lb. brevis CGMCC 1306 may be a novel psychrophilic enzyme and can offer distinctive advantages for industrial applications. Although it belongs to psychrophilic enzyme, however, the AATase from Lb. brevis CGMCC 1306 exhibited a good thermal stability below 55 °C at the same time. It maintained its initial activity more than 70% after incubation of 60 min at 40 °C ((B)). Even incubated at 50 °C for 60 min, the recombinant AATase still retained about 57% of the initial activity, which is remarkably stronger than Ph AATase, an ordinary psychromhilc enzyme which half-life of inactivation at 50 °C was 6.8 min [Citation27]. When temperature is higher than 55 °C, obvious heat inactivation happened and the enzyme had only about 26% of initial activity after 60 min of incubation at 65 °C. The thermostability of AATase from Lb. brevis CGMCC 1306 is related to the composition of its amino acid with a higher proline content (6.4%), which limits the unfolded protein flexibility, thereby shifting the equilibrium towards the folded conformation.
Figure 5. Characterization of the purified AATase. (A) Effects of reaction temperature on the activity of AATase in potassium phosphate buffer (pH 8.0). (B) Thermostability of AATase. The temperature stability of the purified AATase was determined by measuring the remaining activity after incubating the enzyme for various time separately at 40, 45, 50, 55, or 65 °C in the absence of the substrate. (C) Effects of reaction pH on the activity of AATase. Two different buffers including potassium phosphate (solid square) and Tris-HCl (solid circle) were applied. The data represent the mean ± SD of three parallel experiments.
The pH dependence of AATase activity was measured from pH 6.0 to 8.8 in different buffer systems ((C)). The AATase displayed higher catalytic activity at neutral pH, and the buffer components also had a significant impact on the activity. The optimal pH of purified activity was 7.2 in Tris-HCl buffer, but AATase had a much lower activity at the same pH using potassium phosphate buffer.
Kinetics parameters of AATase
To further characterize the enzyme, the kinetic parameters Km, kcat, and kcat/Km were calculated for the purified AATase. As depicted in , the Km values of AATase were 0.65 ± 0.06 and 0.06 ± 0.01 mmol/L for L-Asp and α-ketoglutarate, respectively; the calculated kcat/Km which represent the catalytic efficiency for L-Asp and α-ketoglutarate were 25.5 and 207.8 (mmol/L)−1 s−1, respectively. Compared with other AATases from various microbial sources, the AATase of Lb. brevis CGMCC 1306 stood out with marked higher affinity toward its substrate: for instance, the Km for L-Asp of AATases of E. coli (1.0–2.0 mmol/L), yeast (1.1 mmol/L), P. haloplanktis TAC 125 (3.35 mmol/L) [Citation28], Methanococcus aeolicus (3.7 mmol/L) [Citation29], T. thermophilus HB8 (1.1 mmol/L) [Citation7], Thermophilic Bacillus sp. strain YM-2 (3.0 mmol/L) [Citation30], and Bacillus subtilis B3 (6.7 mmol/L) [Citation8] were greater than those of the AATase in this work. This feature made the AATase not only a valuable subject of studying the catalytic mechanism of transamination reaction but a promising candidate for industrial application.
Figure 6. Kinetic parameters for recombinant AATase from Lactobacillus brevis CGMCC 1306. (A) L-Asp; (B) α-ketoglutaric acid. Kinetic parameters were obtained by fitting the data to Michaelis–Menten equation. The data represent the mean ± SD of three parallel experiments.
Chemical denaturation of AATase with GdmCl
AATase contains three tryptophan residues: Trp124, Trp189 and Trp243. Buried Trp residues typically have the maximum fluorescence intensity at 330 nm, while solvent exposed Trp residues have the maximum fluorescence intensity at 350 nm. The wavelength of the fluorescence maximum shifts from 330 to 350 nm when the protein unfolds. illustrated the changes of fluorescence emission wavelength and intensity of the native AATase by GdmCl. Indeed, the shift midpoint in fluorescence wavelength occurs at 2.7 and 3.0 mol/L. When GdmCl concentration is in the range of 0–2 mol/L, the fluorescence emission intensity of the AATase increased. The AATase fluorescence emission intensity decreased with GdmCl concentration further increasing from 2 to 3.6 mol/L. The maximum emission peak redshifted from 332 to 340 nm when GdmCl concentration increased from 0.5 to 2.5 mol/L, and levelled off with further increasing GdmCl concentration. AATase activity was measured immediately after removing an aliquot from the GdmCl solution. also showed that the denaturation in GdmCl decreased AATase activity, and the activity decreased quickly when GdmCl concentration increased from 2 to 3.9 mol/L.
Figure 7. Unfolding of AATase in GdmCl solutions. (A) Effects of GdmCl concentration on AATase fluorescence maximum emission wavelength, intensity. Protein concentration of AATase was 0.2 mg/mL. Fluorescence was excited at 280 nm and measurements were carried out at 24 °C. (B) Effects of GdmCl concentration on AATase activity.
Fluorescence phase diagram of AATase with GdmCl
The unfolding of AATase induced by GdmCl was studied by phase diagram method of fluorescence (). The phase diagram of unfolding of AATase induced by GdmCl consisted of two straight lines, and fluorescence changes at Y320 did not vary linearly with fluorescence changes at Y365, indicating the existence of at least an intermediate.
Figure 8. Phase diagram representing the unfolding of AATase induced by GdmCl. Protein concentration of AATase was 0.2 mg/mL. Fluorescence was excited at 280 nm and measurements were carried out at 24 °C. The values on the curves are the concentrations of GdmCl. Each straight line represents an all or none transition between two conformers of AATase. I320 and I365 represent the fluorescence intensities at emission wavelengths of 320 and 365 nm, respectively.
Conclusion
An AATase gene from Lb. brevis CGMCC 1306 was cloned, recombinant overexpressed in E. coli, and characterized for the first time. Different from the majority of AATase generally endowing with thermophilicity, the AATase is a particular psychrophilic enzyme. Furthermore, AATase also exhibited a good thermal stability and higher affinity toward substrates, and it possesses promising utilization in food, chemical, and pharmaceutical industries. The results will lay the foundation for gaining a further understanding of its function in LAB amino acid metabolism. The knowledge and information obtained in this study may also be helpful for further investigation of conformation, coenzyme PLP interaction mechanisms, and activation of AATase from Lb. brevis.
Disclosure statement
No potential conflict of interest was reported by the authors.
Additional information
Funding
References
- Toney MD. Aspartate aminotransferase: an old dog teaches new tricks. Arch Biochem Biophys. 2014;544:1345–1351.
- Hammes GG, Benkovic SJ, Hammes-Schiffer S. Flexibility, diversity, and cooperativity: pillars of enzyme catalysis. Biochemistry. 2011;50:10422–10430.
- de la Torre F, De Santis L, Suarez MF, et al. Identification and functional analysis of a prokaryotic-type aspartate aminotransferase: implications for plant amino acid metabolism. Plant J. 2006;46:414–425.
- de la Torre F, Cañas RA, Pascual MB, et al. Plastidic aspartate aminotransferases and the biosynthesis of essential amino acids in plants. J Exp Bot. 2014;65:5527–5534.
- Ward J, Wohgemuth R. High-yield biocatalytic amination reactions in organic synthesis. Curr Org Chem. 2010;14:1914–1927.
- Ford GC, Eichele G, Jansonius JN. Three-dimensional structure of a pyridoxal- phosphate-dependent enzyme, mitochondrial aspartate aminotransferase. Proc Natl Acad Sci USA. 1980;77:2559–2263.
- Jäger J, Moser M, Sauder U, et al. Crystal structures of Escherichia coli aspartate aminotransferase in two conformations: comparison of an unliganded open and two liganded closed forms. J Mol Biol. 1994;239:285–305.
- Jeffery CJ, Barry T, Doonan S, et al. Crystal structure of Saccharomyces cerevisiae cytosolic aspartate aminotransferase. Protein Sci. 1998;7:1380–1387.
- Jiang XP, Wang J, Chang HY, et al. Recombinant expression, purification and crystallographic studies of the mature form of human mitochondrial aspartate aminotransferase. Biosci Trends. 2016;10:79–84.
- Rhee S, Silva MM, Hyde CC, et al. Refinement and comparisons of the crystal structures of pig cytosolic aspartate aminotransferase and its complex with 2-methylaspartate. J Biol Chem. 1997;272:17293–17302.
- de la Torre F, Moya-García AA, Suárez M, et al. Molecular modeling and site-directed mutagenesis reveal essential residues for catalysis in a prokaryote-type aspartate aminotransferase. Plant Physiol. 2009;149:1648–1460.
- Fernández M, Zúñiga M. Amino acid catabolic pathways of lactic acid bacteria. Critical reviews in microbiology. Crit Rev Microb. 2006;32:155–183.
- Huang J, Mei LH, Xia J. Application of artificial neural network coupling particle swarm optimization algorithm to biocatalytic production of GABA. Biotechnol Bioeng. 2007;96:924–931.
- Fan EY, Huang J, Hu S, et al. Cloning, sequencing and expression of a glutamate decarboxylase gene from the GABA-producing strain Lactobacillus brevis CGMCC 1306. Ann Microbiol. 2012;62:689–698.
- Makarovaa K, Slesarevb A, Wolfa Y, et al. Comparative genomics of the lactic acid bacteria. Proc Natl Acad Sci USA. 2006;103:15611–15616.
- Bradford MM. A rapid and sensitive method for the quantitation of microgram quantities of protein utilizing the principle of protein-dye binding. Anal Biochem. 1976;72:248–254.
- Collier RH, Kohlhaw G. Nonidentity of the aspartate and the aromatic aminotransferase components of transaminase A in Escherichia coli. J Bacteriol. 1972;112:365–371.
- Chen XX, Li D, Lv JX, et al. Determination of gamma-aminobutyric acid and glutamic acid in human cerebrospinal fluid by high performance liquid chromatography. Chin J Chromatogr. 1997;15:237–239.
- Yagi T, Kagamiyama H, Nozaki M, et al. Glutamate-aspartate transaminase from microorganisms. Methods Enzymol. 1985;113:83–89.
- Arnold K, Bordoli L, Kopp J, et al. The Swiss-model workspace: a web-based environment for protein structure homology modelling. Bioinformatics. 2006;22:195–201.
- Biasini M, Bienert S, Waterhouse A, et al. Swiss-model: modelling protein tertiary and quaternary structure using evolutionary information. Nucleic Acids Res. 2014;42:252–258.
- Kim H, Ikegami K, Nakaoka M, et al. Characterization of aspartate aminotransferase from the cyanobacterium Phormidium lapideum. Biosci Biotechnol Biochem. 2003;67:490–498.
- Burstein EA, Vedenkina NS, Ivkova MN. Fluorescence and the location of tryptophan residues in protein molecules. Photochem Photobiol. 1973;18:263–279.
- Huang J, Jones BJ, Kazlauskas RJ. Stabilization of an α/β-hydrolase by introducing proline residues: salicylic acid binding protein 2 from tobacco. Biochemistry. 2015;54:4330–4341.
- Geourjon C, Deléage G. SOPMA: significant improvements in protein secondary structure prediction by consensus prediction from multiple alignments. Cabios. 1989;11:681–684.
- Madhusudhan MS, Marti-Renom MA, Eswar N, et al. Comparative protein structure modeling. Encyclopedia Biophysics. 2010;15:578–585.
- Benkert P, Kunzli M, Schwede T. QMEAN server for protein model quality estimation. Nucleic Acids Res. 2009;37:510–514.
- Birolo L, Tutino ML, Fontanella B, et al. Aspartate aminotransferase from the Antarctic bacterium Pseudoalteromonas haloplanktis TAC 125. Cloning, expression, properties, and molecular modelling. Eur J Biochem. 2000;267:2790–2802.
- Xing RY, Whitman WB. Characterization of amino acid aminotransferases of Methanococcus aeolicus. J Biotech. 1992;174:541–548.
- Sung M, Tanizawa K, Tanaka H, et al. Purification and characterization of thermostable aspartate aminotransferase from a Thermophilic bacillus species. J Biotechnol. 1990;172:1345–1351.