
 ?Mathematical formulae have been encoded as MathML and are displayed in this HTML version using MathJax in order to improve their display. Uncheck the box to turn MathJax off. This feature requires Javascript. Click on a formula to zoom.
ABSTRACT
This study examines and evaluates a colourimetric technique that could be implemented as a real-time continuous monitoring system for fungal culture growth in submerged fermentation (SmF) with the presence of solid particles. Fungal SmF of Aspergillus awamori and Aspergillus oryzae was carried out on complex heterogeneous solid media: wheat bran, soybean hull and rapeseed meal, which were constituted of various soluble and insoluble solid particles. As a comparison, another set of experiments in SmF using synthetic medium was carried out. The theory of measuring colour changes in SmF by UV-Vis spectroscopy demonstrates that this colourimetric technique provides valuable information complementary to visual observations. Typical normalized UV absorption spectra were obtained using a scanning spectrophotometer for each colour solution. These demonstrated that samples used in this work have very similar patterns. The typical normalized optical density spectra show a local absorbance maximum near 300 nm, a region where colour absorbance rapidly increases. It was suggested that the colour developed during the progress of fermentation is closely related to either or both of the growth and the actual biomass of the fungus. The findings show that colour-based methods seem to be the most promising approach for biomass estimation in SmF in the presence of solid particles.
Introduction
Biomass estimation is of fundamental importance in many microbial fermentation processes. This study was conducted as an extension of a study performed in solid state fermentation (SSF) using fungi and the same solid substrate to prove the hypothesis that colour changes during the fermentation process over time could be used as a new technique to measure fungal growth [Citation1].
It is a general observation that the colour of the fermenting solid substrate changes during the course of the SSF due to the growth of the fungus. During the course of the investigation of fungal growth on solid substrate, it was found that the colour of the solid substrate became darker with progressive growth (for review, see [Citation2]). In this work, a new colourimetric technique is proposed as a tool with which to characterize and monitor fungal growth in SSF. The methodology proposed in this work was based on the colour solution extracted from fermented substrate determined by UV-vis specrophotometer at suitable wavelength.
Very often, fungal submerged fermentation (SmF) is carried out on complex heterogeneous media such as whole-wheat flour, wheat bran, soybean hulls and rapeseed meal, which are constituted of various soluble and insoluble solid particles [Citation3]. For example, complex media containing solid substrates are used for the industrial production of enzymes using fungi [Citation4]. The estimation of the course of fungal growth during such fermentation, conducted using either SmF or SSF, is hindered by the presence of insoluble particles [Citation5]. One of the most critical problems encountered in such fermentations is the fungal mycelium remaining attached to the solid substrate particles, making it difficult to separate them. This situation means that it is impossible to measure fungal growth during fermentation. Measuring growth through a direct or an indirect technique is important to provide better understanding of process control and information about the productivity of a cell culture [Citation6]. It is important to understand that the biomass growth profile throughout a fermentation process is a key parameter in the estimation of kinetic variables and any subsequent scale-up of the process [Citation3]. In such systems, adherence of the fungus to solid particles hinders the partition of the solid mass to its components. Therefore, direct estimation of fungal growth using the dry weight method is not possible. Another reason might be due to the mixture of the content of cells and high molecular weight compounds, which cannot be filtered out [Citation7]. The on-line measurement of capacitance using the Biomass Monitor (Aber Instruments Ltd, Science Park, Cefn Llan, Dyfed SY23 3DA, UK) technique seemed very promising [Citation8,Citation9]. This technique was demonstrated to measure biomass in SmF without the presence of solid particles, using either yeast, bacteria or fungi [Citation8]. This technique shows potential for further development for fungal biomass estimation in large-scale SmF containing solid substrate particles in the medium. Measuring enzymatic activity or other secondary metabolites would be considered reasonable and informative [Citation10,Citation11]. It is possible to estimate biomass development in SmF by considering oxygen uptake rate (OUR), carbon dioxide evolution rate (CER) and heat evolved, which are easily measurable parameters. According to Mitchell et al. [Citation12–16], OUR and and CER offer the advantage of a fast response time and are directly linked to the metabolism of the microorganism, either in SmF or SSF. The total carbon dioxide produced is assumed to be proportional to the cumulative cell concentration [Citation17,Citation18]. This also holds true for the heat evolved as a result of microbial metabolism during fermentation [Citation8]. The measurements can be performed on-line without involving tedious sampling procedures, albeit at a higher cost [Citation19].
To implement a fermentation process based on such solid particles, the determination of cell concentration throughout the fermentation process is essential [Citation3]. In order to achieve this, the problem caused by the presence of various heterogeneous and insoluble solid particles should be overcome. Since the use of a direct analytical method such as dry cell weight is impractical and inaccurate, the use of an indirect estimation method is considered the only alternative [Citation20,Citation21]. Arguably, monitoring colour changes occurring in SmF can be used as an alternative indirect method for measuring fungal growth during fermentation. The production of colour in both SSF and SmF would be directly or indirectly affected by the cultivation environment and cultivation methods.
In the present work, experiments were carried out to quantify the colour of fermentation medium as a means for estimating growth. The main aim of this study is to provide better insight into monitoring biomass growth in Aspergillus awamori and Aspergillus oryzae SmF using colourimetric techniques. Other objectives of this study are: (1) to investigate colour production from different fungal components: spores, mycelium and a combination of both; (2) to establish an accurate estimation model using a spectrophotometer at a wavelength ranging from 200 to 800 nm and (3) to investigate colour production changes with three different solid substrates used in SmF.
Materials and methods
Microorganisms and inoculum preparation
A. awamori and A. oryzae obtained from the School of Chemical Engineering and Analytical Science, Faculty of Engineering and Physical Science, University of Manchester were used throughout this study. Fungal spores in a universal bottle were stored at 4 °C in agar slopes of solid sporulation medium containing 5% (w/v) whole wheat flour and 2% (w/v) agar as a stock culture and they were sub-cultured in the time interval of every two months. A. awamori and A. oryzae produce compact colonies with huge spores and accumulate large quantities of black and green pigments during growth in the form of mycelium. To prepare a spore suspension, well-sporulated slants of both fungi were used.
Solid agar medium
All three selected substrates (wheat bran, soybean hulls and rapeseed meal) and whole wheat flour were used as a solid agar medium for growing A. awamori and A. oryzae. All experiments were done in 9.0 cm petri dishes. Solid sporulation media containing 5% (w/v) of each substrate and 2% (w/v) agar in distilled water were prepared and sterilised at 121 °C for 15 min. In addition, potato dextrose agar (Sigma–Aldrich, UK) and nutrient agar (Sigma–Aldrich, UK) were prepared according to the manufacturer's instructions. After autoclaving, the agar media were immediately distributed onto petri dishes and allowed to cool down and solidify at room temperature before inoculating with 100 µL A. awamori and A. oryzae spores. All petri dishes were incubated at 30 °C for 7 days. At the end of the incubation period, the colour was extracted from spores, mycelium and a combination of the spores, mycelium and agar with distilled water.
Fermentation medium and media preparation
The medium consisting of the solid substrate (5% w/v), whole wheat flour (WWF), wheat bran (WB), soybean hulls (SBH) and rapeseed meal (RSM) were prepared without adding any nutrients. The flasks were sterilized at 121 °C for 15 min. Then, 1.2 × 10⁶ spores/mL were used to inoculate the media in 500 mL flasks containing 100 mL working volume of distilled water. The flasks were incubated in an orbital incubator shaker (Gallenkamp, Germany) at 30 °C operating at 250 rpm. Sampling was carried out at defined time intervals for colour analysis.
In order to study whether the colour is developed by the fungus itself or as a result of microbial activity, another set of experiments in SmF using synthetic medium (non-proteinaceous) was carried out. Inorganic nitrogen was used to avoid colour development in the original medium and therefore the final medium was colourless. In this approach, both fungi (A. awamori and A. oryzae) grow in submerged medium where protein must be absent from the medium.
The medium proposed by Ariff [Citation22] was used in this study. This medium consists of glucose (50.0 g/L) as a carbon source and (NH4)2SO4 (5.0 g/L) as a nitrogen source. Other salt components of the medium are: CaCl2.2H2O (0.1 g/L), FeSO4.7H2O (0.1 g/L), MgSO4.7H2O (0.5 g/L) and KH2PO4 (0.2 g/L). The glucose solution and the salts solution need to be prepared and autoclaved separately. After cooling, the two solutions were mixed together.
SmF was conducted in 500 mL flasks with 200-mL working volume. Here, 1.2 × 10⁶ spores/mL inoculum size were inoculated into each flask and flasks were shaken at 250 rpm at 30 °C. Sampling was done at defined time intervals for biomass determination using dry cell weight. Colour measurement using a spectrophotometer (Shimadzu UV-Vis 2410PC, Japan) was performed using samples from the supernatants and cell-free extracts from the fungal mycelium using water as described below.
Analytical methods
Colour extraction
Samples from solid agar media
At the end of the incubation period, the colour was extracted from spores, mycelium and a combination the spores, mycelium and agar. Ten milliliters of sterile distilled water and several sterile glass beads (4 mm diameter) were added onto a petri dish. The spores were suspended by shaking the petri dish gently and collected in 250 mL flask as a spore suspension. This step was repeated until all the spores were harvested and the final volume of the spore suspension was made up to 40 mL. The petri dish with the washed spores from the previous step was used to obtain mycelial material. The surface was gently scratched with a spatula to collect about 2.0 g (wet weight) of mycelium in a 250-mL flask containing 40 mL distilled water.
One (1) piece of 4 × 4 mm of mycelial blocks of A. awamori and A. oryzae was used to extract the colour in a 250-mL flask containing 40 mL distilled water. All the flasks were kept shaking on an orbital rotary shaker (Infors AG-CH4103, Switzerland) at 30 °C and 250 rpm for 30 min. The suspensions were then centrifuged (Eppendorf Centrifuge 5804, Germany) at 3,400 x g for 10 min at 4 °C. This procedure was repeated until a clear solution is obtained.
Samples from SmF
Samples collected during the fermentation were centrifuged at 3,400 x g for 5 min using laboratory centrifuge (Eppendorf Centrifuge 5804, Germany). The colour was present in the fractions, filtrate and mycelium. In order to measure colour in the mycelium, extraction of the pigment was carried out using distilled water. The method of extraction used was as follows: 10 mL of distilled water was added to 1 g wet cells in a 250-mL flask and this was shaken at 250 rpm for 1 h at 30 °C. The mixture was then filtered through filter paper (Whatman No. 1) and the filtrate was used for colour determination. The overall colour measurement was obtained by adding the two values for the supernatant and cell-free extract.
Spectrophotometric analysis
To identify the most suitable wavelength for absorbance measurement of the filtrate obtained using the extraction procedure, samples were scanned over the wavelength range 200–800 nm and the wavelength corresponding to absorption maxima was determined. Water was used as a blank. Whenever necessary, the filtrate samples or supernatant were diluted with distilled water prior to absorbance measurement. Colour production was calculated by multiplying the absorbance units by the dilution factor. Colour yield was expressed as unit absorbance (UA300) (measured at absorbance 300 nm). Total extracellular and intracellular colour was measured, which is the sum of the absorbance of extracellular colour (the absorbance of the liquid culture medium after filtration) and intracellular colour (the absorbance of a water extract of the mycelium after filtration). It is important in this study that all samples were analyzed using a scanning spectrophotometer within the wavelength range of 200–800 nm to observe a typical normalized UV absorption spectrum. The spectrum of colour absorbance was obtained using a Shimadzu UV-Vis 2410PC series scanning spectrophotometer (Japan) taking into consideration the dilution factor of samples. The readings of absorbance were used for the calculation of optical density using the general formula below:
Results and discussion
Effect of different solid agar media on growth, sporulation and colour production of A. awamori and A. oryzae
In order to cover the objective of this work to determine whether the proposed hypothesis could be applied for quantifying fungal growth, different sets of experiments were conducted. Each one of the sets of experiments and fermentations were planned to address one or several of the objectives described above. Preliminary experiments in petri dishes were carried out in order to confirm the theory of using colour changes in fungal SSF as an approach for biomass estimation.
This experiment was carried out to demonstrate the effect of different solid agar media on the growth of solid culture of A. awamori and A. oryzae and to examine whether spores and mycelial growth on plates correlates with colour production. Examining the colour density and morphology of fungal growth on different solid agar media on plates would provide preliminary information consisting of spectral profiles obtained by scanning UV-Vis spectrophotometry at wavelengths between 200 and 800 nm.
It is a necessity to confirm whether the production of colour from either fungal species is from the spores, from the mycelium or from a combination of spores and mycelial material. In addition, the correlation between spores concentration and colour production and that between colour produced by fungi and cell weight of fungi growing on solid agar medium were examined.
The growth morphology and absorbance of colour extracted in distilled water for A. awamori and A. oryzae are shown in and , respectively. Visual observation indicated different growth morphology on different agar media. The UV absorption spectra showed that colour could be produced either by the spores themselves or by the mycelium. In addition, there were some significant optical density spectral patterns as shown in the two figures.
Figure 1. Different morphologies of A. awamori colonies cultivated using six different solid agar media after 7 days. Spectra from scanning spectrophotometer (200–800 nm wavelengths) extracted from spores (![]()
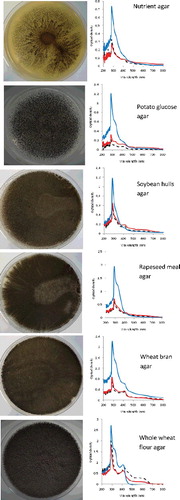
Figure 2. Different morphologies of A. oryzae colonies cultivated using six different solid agar media after 7 days. Spectra from scanning spectrophotometer (200–800 nm wavelengths) extracted from spores (![]()
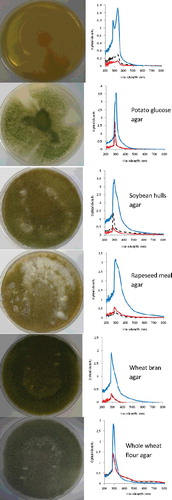
Maximum absorbance was observed to occur in the region 270–300 nm for all samples tested, indicating maximum absorbance for the pigment largely responsible for the colour. Variations in the wavelength corresponding to absorption maxima and in the size of peaks in the spectra might be because of contaminants present in the colour solution. For that reason, centrifugation and filtration need to be carried out adequately in order to obtain a clear and clean colour solution since UV absorption is very sensitive to impurities.
Growth and sporulation response was markedly affected by the solid medium used. Both fungi grew well on whole wheat flour agar as their sole source of carbon and energy. In both cases of A. awamori and A. oryzae, sporulation is highly efficient when fungi are grown on whole wheat flour agar and colour production was also highest, followed by wheat bran agar (starch 23.3%) [Citation23], rapeseed meal agar (starch 4.9%) [Citation24] and soybean hulls agar (starch 1.8%) [Citation25]. This may be explained by the nutritionally rich base with high starch content (69.82%) and full flavoured flour containing vitamins, minerals and protein (14.98%) [Citation26], which encourages sporulation and colour production. The knowledge of the culture conditions is useful in the study of the fungal growth. Considering the starch content, whole wheat flour can be used as an alternative to commercial potato glucose agar, which is expensive to formulate in media for fungal growth. Both fungi showed poor growth on nutrient agar since nutrient agar was made to be more suitable for growing bacteria.
Colour development in SmF using solid substrates (I)
This study was conducted with the objective of examining colour development in SmF using A. awamori and A. oryzae with four different heterogeneous fermentation media. Colour solutions from the liquid broth and colour extracts from cell/fungal mycelium were measured using a spectrophotometer to obtain the UV absorption spectra at a wavelength range of 200–800 nm. depicts the UV absorption spectra for the two fungi, A. awamori and A. oryzae, in different substrates measured at different fermentation times. Colour density increased with time, indicating growth of fungi in the tested media. In all cases, the spectra had a maximum absorption in the region 260–300 nm. The UV absorption spectra at their absorbance maxima were used to quantify the colour produced. Both A. awamori and A. oryzae growing on substrates tested in SmF showed identical patterns of optical density spectra obtained using a scanning spectrophotometer. In SmF, using whole wheat flour, both fungi also showed almost the same spectral pattern.
Figure 3. Typical normalized optical density spectra using a scanning spectrophotometer (200–800 nm wavelengths) obtained with SmF at different fermentation times for [AA]: A. awamori and [AO]: A. oryzae. WWF, whole wheat flour; WB, wheat bran; SBH, soybean hulls and RSM, rapeseed meal.
![Figure 3. Typical normalized optical density spectra using a scanning spectrophotometer (200–800 nm wavelengths) obtained with SmF at different fermentation times for [AA]: A. awamori and [AO]: A. oryzae. WWF, whole wheat flour; WB, wheat bran; SBH, soybean hulls and RSM, rapeseed meal.](/cms/asset/7dbaa3f2-2c85-4743-ac18-7a896bf25837/tbeq_a_1440974_f0003_oc.jpg)
The absorbance maxima of colour extracts from SmF were compared. For SmF with A. awamori on rapeseed meal, the maximum absorbance wavelength was between 287 and 317 nm and for A. oryzae, the maximum absorbance wavelength for SSF was between 284 and 307 nm. However, these small differences are reasonable. This study revealed that the colour produced from microbial activity in SmF might correspond to the same pigments for both fungi. This was suggested based on the identical spectra obtained using UV-Vis spectrophotometry. Indeed, in both fermentation processes, colour is associated with fungal growth. Naturally, this equivalence should not apply to crude colour extracts, which may contain several substances with different absorbance patterns. The fact that the colour was produced as a mixture of compounds probably affects the analysis, especially when a simple analytical method is used such as measuring colour absorbance.
Colour development in SmF using a synthetic medium (II)
Finally to acquire an idea about the production of colour in fungi, another study was carried out to investigate the colour production in a synthetic medium. This synthetic medium contained zero protein concentration except for an inorganic nitrogen source. This medium was colourless and constituted a very clear solution. In previous experiments using SmF, there was an amount of organic protein present in solid substrates. Through metabolic activity, fungi consumed this protein and synthesized other proteins and compounds (such as proteins responsible for the colour itself, enzymes and other secondary products). Explanation of the production of colour during the fermentation process by fungi may require further study. The UV absorption spectra at their absorbance maxima are used to express the concentration of pigment produced by fungal growth.
shows the typical normalized UV absorption spectra for both fungi growing in a synthetic medium measured at different fermentation times. In line with observations with SmF and SSF using solid substrates, colour density increased with time, indicating the growth of fungi. A. awamori and A. oryzae growing in the synthetic medium showed a similar pattern of UV absorption spectra. In all cases, the spectra had a maximum absorption in the region 260–300 nm, which corresponds to the colour. A comparison was made with spectra from SSF and SmF using solid substrates, as explained above, and the spectra were very comparable for all samples with a maximum absorbance wavelength between 260 and 300 nm [Citation27].
Figure 4. Optical density spectra measured at wavelength range 200–800 nm for [AA]: A. awamori and [AO]: A. oryzae in SmF using a synthetic medium at different fermentation times.
![Figure 4. Optical density spectra measured at wavelength range 200–800 nm for [AA]: A. awamori and [AO]: A. oryzae in SmF using a synthetic medium at different fermentation times.](/cms/asset/c7338882-1266-4ff4-8fe7-c11f137f7a46/tbeq_a_1440974_f0004_oc.jpg)
This study suggests that the colour produced by microbial activity during the fermentation process is linked to the cellular component dynamics. shows the correlation between dry cell weight and absorbance at 300 nm for both fungi: A. awamori and A. oryzae. Colour density proportionally increases with dry cell weight for both fungi with very good linearity and a correlation coefficient of 0.96. Dry cell weight is a well-known technique for biomass estimation in SmF. In this work, comparison of colour density was carried out for media with the same composition. The results showed that the amount of pigment can be the same for different dry cell weights in different fungal strains. As mentioned earlier in the case of SSF, the amount of pigment produced was different depending on the solid substrate used [Citation1]. This was assumed to be true for SmF in different synthetic media with different compositions.
Figure 5. Correlation between colour density and dry cell weight in a synthetic medium inoculated with A. awamori (![]()
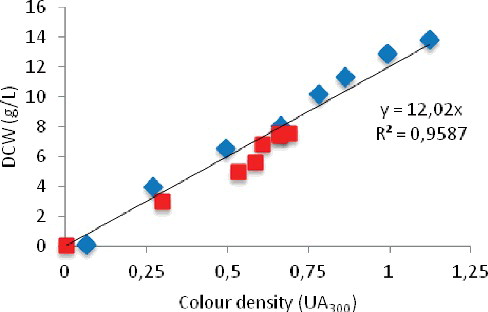
By using the linear regression equation obtained for SmF data using the same medium with different fungi, quantities of dry cell weight could be easily measured and expressed as grams per liter (g/L). Under these considerations, this study showed that biomass estimation can be carried out using the UV absorption spectra, since the change in colour density and dry cell weight are shown to be closely related. Poilpre et al. [Citation28] reported that the on-line estimation of biomass concentration during transient growth on yeast chemostat culture using light reflectance was shown to be accurate for rapid biomass changes.
This investigation showed that the colour was produced by the fungus itself either in the spores or the mycelium as a result of microbial activity. This shows that when the fungus consumes nutrients, it starts producing spores and mycelium; at the same time, it also produces colour, protein and other primary and secondary products, which are related to the growth of the fungus. The approach of colourimetric estimation seems to be very similar to measuring optical density (usually at absorbance 550–600 nm), which has been widely used in SmF for biomass determination. In the case of SmF, the solid biomass of bacteria or yeast is very easily separated by centrifugation for dry cell weight estimation.
According to Alupoaie and Garcia-rubio [Citation29], multi-wavelength transmission spectra of microorganisms and cells suspension consist of combined absorption and scattering phenomena resulting from the interaction of light with microorganisms or cells typically suspended in a non-absorbing media. In their study, the growth behaviour of Escherichia coli measured by using UV-vis spectroscopy demonstrated that the spectroscopic methods have high potential for real-time analysis and characterization of microbial populations. Callahan et al. [Citation30] demonstrated that the combined scattering and absorption properties of suspended particles in SmF could be obtained as a function of wavelength by measuring the complete UV−Vis spectrum. Recently, Oto et al. [Citation31] demonstrated a non-destructive estimation of adenosine triphosphate (ATP) contents and plate count on pork meat surface by UV-vis spectroscopy spectra analysis that can be used for sanitation management. In addition, image analysis techniques have also been studied to estimate the cell density and biomass concentration of Trichoderma reesei [Citation19,Citation32], Penicillium chrysogenum [Citation33] and concentration of yeast [Citation34] in the presence of solid substrates. On top of that, real-time measurements of fungal biomass using dielectric spectroscopy or capacitance measurement technique [Citation8,Citation9,Citation35,Citation36], monitoring of OUR [Citation37], CER [Citation38] and metabolic heat [Citation39] in the fermentation broth are extremely interesting for on-line bioprocess monitoring fungal growth with or without presence of solid particles.
From a theoretical point of view, it is clearly demonstrated that the colour produced increased with fermentation time in fungal SmF; this can be explained by changes in the chemical composition (colour in this case) of the fungus itself and by microbial activity as a result of solid substrate degradation by fungi to acquire nutrients for growth. Colour solutions extracted from fermented substrates at different times of fermentation were used to measure the absorbance at 300 nm. In , the colour density gradually increased when measured at 300 nm. The growth curve for a microorganism population is usually divided into four phases: lag phase, exponential phase or log phase, stationary phase and death phase. Notice that the measured optical density at 300 nm follows the expected behavioural growth curve. However, a death phase was not clearly observed in this work. This might be due to SmF being carried out for only 6 days. Clearly, changes in the colour of the fermented substrates during SmF can be related to changes in the cell population. To solve the long-standing problems of biomass estimation, this approach could be useful as an indirect estimation of fungal biomass in SmF and may become an important complementary technique to existing indirect methods. Additionally, the use of a colourimetric technique seems promising for the direct comparison between SSF and SmF, especially for basic laboratory-based research.
Figure 6. Growth profiles of A. awamori [AA] and A. oryzae [AO] on three different solid substrates and synthetic medium based on colour estimation expressed as unit absorbance (UA300/g) [dry substrate]. Wheat flour (•); wheat bran (☐); soybean hulls (○); rapeseed meal (Δ) and synthetic medium (![]()
![Figure 6. Growth profiles of A. awamori [AA] and A. oryzae [AO] on three different solid substrates and synthetic medium based on colour estimation expressed as unit absorbance (UA300/g) [dry substrate]. Wheat flour (•); wheat bran (☐); soybean hulls (○); rapeseed meal (Δ) and synthetic medium (Display full size).](/cms/asset/5fc86bb3-74e6-4351-be9a-0ddee3453193/tbeq_a_1440974_f0006_oc.jpg)
Conclusions
Colour density for fungal SmF in cell-free extracts can be determined quickly and accurately using absorbance measurements at the chosen wavelength of 300 nm, which is a similar observation to the spectra obtained for SSF extracts. Moreover, after verification of the absence of interference from solid particles, the colour will also be useful to estimate the growth of fungus in SmF. For the growth of A. awamori and A. oryzae on wheat bran, soybean hulls and rapeseed meal, it was confirmed that colour production was directly proportional to fungal growth. Overall; the estimation of colour density through UV-vis spectrophotometry from SmF would be a favourable indirect method to describe the growth of fungi. The advantages of this method include the fact that the procedure is cheap, fast, objective, simple to carry out and non-destructive and does not require special or expensive reagents. Cell-free extracts from fermented fungal biomass were obtained using distilled water and the procedure was performed in less than 2 h. Water was efficient in the recovery of colour from the mycelium. This new approach is an important complementation to the existing techniques especially for basic studies. A higher number of experiments and improvements to the colour change technique in SmF using various microorganisms and solid substrates are needed to validate the technique. Further studies should be carried out to obtain more data to support the colourimetric technique using different fungi or microorganisms (bacteria and yeast) and also using different types of solid substrate, whether in single form or mixed-solid substrate from different solid wastes. No method is ideally suited to all situations and hence the most appropriate method to a particular fermentation application must be chosen in each case based on the simplicity of the procedure, its cost and its accuracy.
Acknowledgements
This work was funded by Malaysian Agricultural Research and Development Institute (MARDI) and Government of Malaysia through the scheme's study leave.
Disclosure statement
No potential conflict of interest was reported by the authors.
Additional information
Funding
References
- Abdul Manan M, Webb C. Extracted substrate colour as an indicator of fungal growth in solid state fermentation. Malaysian J Microbiol. 2016;12(6):445–449.
- Abdul Manan M, Webb C. Estimation of growth in solid state fermentation: a review. Malays J Microbiol. Forthcoming 2018. Available from: http://mjm.usm.my/uploads/issues/1028/Estimation%20of%20growth%20in%20solid%20state%20fermentation%20A%20review.pdf.
- Koutinas AA, Wang R, Webb C. Estimation of fungal growth in complex, heterogeneous culture. Biochem Eng J. 2003;14(2):93–100.
- Cui YQ, Ouwehand JNW, van der Lans RGJM, et al. Aspects of the use of complex media for submerged fermentation of Aspergillus awamori. Enzyme Microb Technol. 1998;23:168–177.
- Scotti CT, Vergoignan C, Feron G, et al. Glucosamine measurement as indirect method for biomass estimation of Cunninghamella elegans grown in solid state cultivation conditions. Biochem Eng J. 2001;7(1):1–5.
- Borzani W. A weighing method to identify the microbial growth phases in solid-state fermentation tests. World J Microbiol Biotechnol. 2000;16(7):601–605.
- Oolman T, Liu TC. Filtration properties of mycelial microbial broths. Biotechnol Prog. 1991;7(6):534–539.
- Harris CM, Kell DB. The estimation of microbial biomass. Biosensors. 1985;1(1):17–84.
- Harris CM, Todd RW, Bungard SJ, et al. Dielectric permittivity of microbial suspensions at radio frequencies: A novel method for the real-time estimation of microbial biomass. Enzyme Microbial Technol. 1987;9(3):181–186.
- Raimbault M. General and microbiological aspects of solid substrate fermentation. EJB Elec J Biotechnol. 1998;1(3):174–188.
- Mitchell DA. Growth patterns growth kinetics and the modelling of growth in solid state cultivation. In: Doelle HW, Mitchell DA, Rolz CE, editors. Solid substrate cultivation. Amsterdam: Elsevier Science Publishers; 1992. p. 87–112.
- Mitchell DA, Berovic M, Nopharatana M, et al. Introduction to solid-state fermentation bioreactors. In: Mitchell DA, Krieger N, Berovic M, editors. Solid-state fermentation bioreactors: Fundamentals of design and operation. Berlin, Heidelberg: Springer-Verlag; 2006. p. 33–43.
- Mitchell DA, Krieger N, Berovic M, et al. Continuously-mixed, forcefully-aerated bioreactors. In: Mitchell DA, Krieger N, Berovic M, editors. Solid-state fermentation bioreactors: fundamentals of design and operation. Berlin, Heidelberg: Springer-Verlag; 2006. p. 115–128.
- Mitchell DA, von Meien OF, Krieger N, et al. A review of recent developments in modelling of microbial growth kinetics and intraparticle phenomena in solid-state fermentation. Biochem Eng J. 2004;17:15–26.
- Mitchell DA, Berovic M, Krieger N. Overview of solid state fermentation. EL-Gewely MR. (eds.). Biotechnol Ann Rev. 2002;8:183–225.
- Mitchell DA, Tongta A, Stuart DM, et al. The potential for establishment of axial temperature profiles during solid-state fermentation in rotating drum bioreactors. Biotechnol Bioeng. 2002;80(1):114–122.
- Terebiznik MR, Pilosof AMR. Biomass estimation in solid state fermentation by modelling dry matter weight loss. Biotechnol Tech. 1999;13:215–219.
- Koutinas AA, Wang R, Kookos IK, et al. Kinetics parameters of Aspergillus awamori in submerged cultivations on whole wheat flour under oxygen limiting conditions. Biocheml Eng J. 2003;16:23–34.
- Kell DB, Markx GH, Davey CL, et al. Real-time monitoring of cellular biomass: methods and applications. Trends Anal Chem. 1990;9(6):190–194.
- Lecault V, Patel N, Thibault J. An image analysis technique to estimate the cell density and biomass concentration of Trichoderma reesei. Let App Microbiol. 2008;48:402–407.
- Lynd LR, Weimer PJ, Baron GV. Microbial cellulose utilization: Fundamentals and biotechnology. Microbiol Mol Bio Rev. 2002;66(3):506–577.
- Ariff A. The influence of mode of operation on the production of glucoamylase by Aspergillus awamori [dissertation]. Manchester (UK): University of Manchester Institute of Science and Technology; 1993.
- Favaro L, Basaglia M, Casella S. Processing what bran into ethanol using mild treatments and highly fermentative yeasts. Biomass Bioenergy. 2012;14:605–617.
- Wang RH, Shaarani SM, Godoy LC, et al. Bioconversion of rapeseed meal for production of a generic microbial feedstock. Enzyme Microbial Technol. 2010;47:77–83.
- Corredor DY. Pretreatment and enzymatic hydrolysis of lignocellulosic biomass [dissertation]. Manhattan (USA): Kansas State University; 2008.
- Fistes A, Dosenovic T, Rakic D, et al. Statistical analysis of the basic chemical composition of whole grain flour of different cereal grains. Acta Univ Sapientiae Alimentaria. 2014;7:45–53.
- Abdul Manan M. Design aspects of solid state fermentation [dissertation]. Manchester (UK): University of Manchester; 2014.
- Poilpre E, Tronquit D, Goma G, et al. On-line estimation of biomass concentration during transient growth on yeast chemostat culture using light reflectance. Biotechnol Lett. 2002;24(24):2075–2081.
- Alupoaei CE, Garcia-rubio LH. Growth behaviour of microorganisms using UV-vis spectroscopy: Escherichia coli. Biotechnol Bioeng. 2004;86(2):163–167.
- Callahan MR, Rose JB, Garcia-rubio LH. Use of multiwavelength transmission spectroscopy for the characterization of Cryptosporidium parvum oocycts: Quantitative interpretation. Environ Sci Technol. 2003;37(22):5254–5261.
- Oto N, Oshita S, Kawagishi S, et al. Non-destructive estimation of ATP contents and plate count on pork meat surface by UV-Vis reflectance spectrum analysis. J Food Eng. 2012;110(1):9–17.
- Lejeune R, Nielsen J, Baron GV. Morphology of Trichoderma reesei QM-9414 in submerged cultures. Biotechnol Bioeng. 1995;47:609–615.
- Packer HL, Keshavarzmoore E, Lilly MD, et al. Estimation of cell volume and biomass of Penicillium chrysogenum using image analysis. Biotechnol Bioeng. 1992;39(4):384–391.
- Bittner C, Wehnert G, Scheper T. In situ microscopy for on-line determination of biomass. Biotechnol Bioeng. 1998;60(1):24–35.
- Carvell JP, Dowd JE. On-line measurement and control of viable cell density in cell culture manufacturing processes using radio-frequency impedance. Cytotechnol. 2006;50:35–48.
- Quintanilla D, Hagemann T, Hansen K, et al. Fungal morphology in industrial enzyme production – modelling and monitoring. Adv Biochem Eng / Biotechnol. 2015;149:29–54.
- Ghosalkar A, Kashid MG. Oxygen uptake rate measurement by modified dynamic method and effect of mass-transfer rates on growth of Pichia stipites: modelling and experimental data comparison. Austin J Biotechnol Bioeng. 2016;3(3):1–6.
- Paulson D, Gustavsson R, Mandenius CF. A soft sensor for bioprocess control based on sequential filtering of metabolic heat signals. Sensors. 2014;14:17864–17882.
- Soccol CR, Spier MR, Vandenberghe LPS, et al. Data acquisition systems in bioprocesses. In: Karakehayov Z, editor. Data acquisition applications. Rijeka (Croatia): InTech; 2012. p. 79–106.