
Abstract
The genetic diversity and relationships among 48 landrace and improved safflower (Carthamus tinctorius L.) genotypes were analyzed using three gene-targeted markers, start codon-targeted (SCoT) polymorphism, conserved DNA-derived polymorphism (CDDP) and CAAT box-derived polymorphism (CBDP). A total of 30 primers (10 primers from each marker) detected genetic polymorphism among the safflower genotypes. Three different marker types showed high level of polymorphism and the CDDP markers produced a higher number of polymorphic bands (74) in comparisons with SCoT and CBDP. The average PIC values for SCoT, CDDP, and CBDP were 0.39, 0.43, and 0.41, respectively. The marker index (MI) in CDDP markers was higher than that in SCoT and CBDP markers. Cluster analysis using SCoT and CDDP markers grouped the safflower genotypes into three distinct groups, whereas the CBDP markers divided the genotypes into two clusters. There were positive correlations between the similarity matrices obtained by each marker type. The results from the cluster analysis and STRUCTURE analysis using combined data grouped the genotypes into two clusters, generally in agreement with their origins. To our knowledge, this is the first detailed report of using gene-targeted molecular markers for genetic diversity analysis in safflower. Our results showed the efficiency of these markers for genetic diversity analysis in safflower and their potential for genome diversity and germplasm conservation.
Keywords:
Introduction
Safflower (Carthamus tinctorius L.) is one of the most important annual oilseed crops which are grown throughout the semiarid regions. Safflower is a highly branched, diploid (2n = 2x = 24) and thistle-like annual plant that is believed to have originated and to have been domesticated in the Fertile Crescent region dating to approximately 4500 years ago [Citation1,Citation2]. In recent years, safflower has become an important crop especially with the increasing interest in its cultivation as a potential biofuel crop [Citation3]. Traditionally, safflower has been grown for its seeds, and used as a food additive for colouring and flavouring foods, as well as in teas. Safflower florets have also been used in medicine for their soothing effect in cases of hysteria, such as that associated with chlorosis, and for reduction of blood cholesterol levels [Citation4]. Crop genetic diversity is important for germplasm conservation and food security. The loss of diversity is reportedly one of the most essential environmental concerns outlined by the Food and Agriculture Organization [Citation5]. Wild relative species and landrace genotypes of domesticated crops possess valuable traits for crop breeding, such as pest and disease resistance [Citation5]. Recently, there have been different studies for characterization of safflower germplasm, including morphological studies [Citation6,Citation7], biochemical analyses [Citation8,Citation9], and also different molecular markers such as randomly amplified polymorphic DNA (RAPDs) [Citation10–12], amplified fragment length polymorphisms (AFLPs) [Citation13], inter-simple sequence repeats (ISSRs) [Citation14,Citation15], and simple-sequence repeats (SSR) [Citation16]. Characterization of the genetic diversity in plant species based on gene families can be exploited for better estimates of genetic relationships for germplasm conservation and breeding programmes [Citation17,Citation18]. In recent years, there has been a shift away from random DNA markers (such as, RAPD, ISSR, and AFLP) towards gene-targeted markers such as start codon-targeted polymorphism [Citation17], conserved DNA-derived polymorphism (CDDP) [Citation18] and CAAT box-derived polymorphism (CBDP) [Citation19]. The SCoT molecular markers are based on conserved short regions flanking the ATG translation start codon in the plant genome. These markers can amplify both DNA stands [Citation17,Citation20]. SCoT markers have been applied for genetic diversity analysis in different plant species such as chickpea [Citation20,Citation21], potato [Citation22], tomato [Citation23], peanut [Citation24], and wheat [Citation25,Citation26]. CDDP markers are developed on the basis of short conserved amino acid sequences and designed polymerase chain reaction (PCR)-based primers based on the corresponding DNA. CDDP markers designed based on the sequences of gene families in the plant genome that are present in multiple copies. These specific primers are designed for specific annealing to known functional genes such as homeobox (KNOX) or auxin-binding protein (ABP1) coding genes and the generated polymorphic bands are detected in an agarose gel [Citation18,Citation27]. CDDP primers targeted plant genes which are mostly related to biotic and abiotic stresses. This technique has been shown to be highly polymorphic and efficient, and it has been successfully utilized in rice [Citation17], bittersweet [Citation27], chickpea [Citation28], and wheat [Citation25,Citation26]. CBDP molecular markers exploit the CAAT box region of promoters in plant genes [Citation19]. The CAAT box has a distinct pattern of nucleotides with a consensus sequence GGCCAATCT located ∼80 bp upstream of the start codon of eukaryote genes and plays an important role during transcription [Citation19]. These gene-targeted markers (SCoT, CDDP, and CBDP) have longer primers with high annealing temperature, so their reproducibility has proved to be high compared to dominant arbitrary markers such as RADP and ISSR. The developments of these markers is based on public biological databases and does not require genome sequences for specific species [Citation28]. These are dominant markers; however, a number of co-dominant markers are also generated during amplification. A literature survey shows that for the genetic diversity in safflower, only arbitrary dominant markers (RAPD, ISSR and AFLP) and SSR markers have been used. Therefore, in the present study, for the first time an effort was made to study the genetic diversity of 48 genotypes of safflower including both landrace and cultivated genotypes from different geographical regions using gene-targeted (SCoT, CDDP and CBDP) markers. We also compared the efficiency of these markers in genetic diversity analysis.
Material and methods
Plant material and DNA extraction
A total of 48 safflower genotypes (), including 24 landrace accessions from different geographical location of Iran, 12 Iranian improved genotypes provided by Iranian Seed and Plant Improvement Institute (SPII) and 12 genotypes from different countries (provided by Iranian National Gene Bank) were considered for genetic diversity using SCoT, CDDP, and CBDP molecular markers. All the genotypes were grown in the greenhouse and total genomic DNA was extracted from a pool of 10 plants of each genotypes following a CTAB extraction protocol [Citation29]. DNA concentrations were estimated by both spectrophotometry (260/280) and gel electrophoresis (0.8% agarose gel) and used for PCR analysis in final concentration of 30 ng/μL.
Table 1. Details about the 48 safflower genotypes analyzed for genetic diversity using gene-targeted molecular markers.
SCoT-PCR analysis
Ten SCoT primers developed by Collard and Mackill [Citation17] were used for genetic diversity analysis in safflower genotypes (). PCR amplification was performed in 20-μL reactions containing 30 ng of template DNA, 1× PCR buffer, 0.2 mmol/L dNTPS, 0.4 μmol/L of primer and 1.5 U of Taq polymerase (Cinaclon, Iran). The PCR reaction was performed in a TGradient 96 Thermocycler (What-man Biometra GmbH, Goettingen, Germany) as follows: 95 °C for 4 min, followed by 38 cycles of denaturation at 94 °C for 45 s, annealing at 49 °C for 45 s and extension at 72 °C for 2 min. A final extension cycle at 72 °C for 10 min followed. The PCR products were separated in 1.3% agarose gels and stained with ethidium bromide.
Table 2. Description of the gene-targeted markers used for genetic diversity analysis in the 48 safflower genotypes.
CDDP-PCR analysis
Ten CDDP primers () were used in 48 safflower genotypes based on the protein sequences of well-characterized genes from diverse plant species [Citation18]. CDDP primers were synthesized by Sinaclon Company (Tehran, Iran). The CDDP-PCR reaction mixture was performed in a total volume of 20 μL containing approximately 100 ng of template DNA, 0.2 mmol/L dNTPs, 0.4 μmol/L of primer, and 1.5 U of Taq polymerase (Cinnagene, Tehran, Iran). The PCR reaction was performed in a TGradient 96 Thermocycler (What-man Biometra GmbH) as follows: an initial denaturation step at 94 °C for 5 min, followed by 38 cycles of denaturation at 94 °C for 30 s, optimal annealing temperature for 40 s and elongation at 72 °C for 90 s, followed by a final elongation step at 72 °C for 10 min. The PCR products were analyzed using 1.5% agarose electrophoresis gels stained with ethidium bromide.
CBDP-PCR analysis
According to the primer sequences previously designed [Citation19], a set of 10 CBDP primers () with clearly separated bands and high polymorphism were selected for genetic diversity in 48 safflower genotypes. PCR amplifications were performed in a total volume of 20 μL containing 30 ng of template DNA, 0.2 mmol/L dNTPs, 0.4 μmol/L of primer, and 1.5 U of Taq polymerase (Cinnagene). The PCR reaction was performed in a TGradient 96 Thermocycler (Whatman Biometra GmbH) as follows: initial DNA denaturation at 95 °C for 4 min, followed by 3 cycles of 1 min denaturation at 94 °C, 1 min annealing at 36 °C, and 2 min of extension at 72 °C. In the following 32 cycles, the annealing temperature was increased to 50 °C with a final extension of 72 °C for 7 min. The amplification products were resolved in 1.5% agarose gels stained with ethidium bromide.
Data analysis
The PCR products of SCoT, CDDP, and CBDP primers were scored visually. Only clear bands were considered for final scoring and data analysis. For each marker, the bands were scored visually for presence (1) or absence (0) in all the 48 accessions. Cluster analysis using un-weighted pair-group method with arithmetic averages (UPGMA) using the similarity matrices was performed with the NTSYS-pc 2.1 program package (State University of New York, USA) [Citation30]. It was also used to perform principal coordinate analysis (PCoA) to visualize the 48 genetic relationships among individual safflower genotypes. Mantel statistic was used to compare the similarity matrices as well as the dendrograms produced by the SCoT, CDDP and CBDP techniques. Polymorphic information content (PIC) values were calculated for each SCoT, CDDP, and CBDP primers according to the formula: PIC =1 − Σ(Pij)2, where Pij is the frequency of the ith pattern revealed by the jth primer summed across all patterns revealed by the primers. Marker index (MI) was obtained by multiplying the average PIC with the effective multiplex ratio (EMR). The EMR is the product of the number of polymorphic loci per primer (n) and the fraction of polymorphic fragments [Citation30]. For the analysis of population structure, a Bayesian model-based analysis was performed using STRUCTURE 2.1 software (Pritchard Lab, Stanford University, USA) [Citation31]. This software assumes a model in which there are K populations (clusters) that contribute to the genotype of each individual and each is characterized by a set of allele frequencies at each marker locus. A Monte Carlo Markov chain method was used to estimate allele frequencies in each of the K populations and the degree of admixture for each individual plant. The number of clusters was inferred using 10 independent simultaneous runs with 1000 replications using the admixture model and correlated allele frequencies with the K value ranging from 1 to 10.
Results and discussion
SCoT markers diversity pattern
Ten SCoT primers were screened to study the genetic diversity among safflower accessions; all the primers produced distinct scorable fragments. The amplification profile of safflower genotypes generated using the SCoT12 primer is presented in . A total of 73 bands were generated, out of which 61 bands were polymorphic (83% polymorphism) across 48 safflower accessions (). The maximum and minimum number of polymorphic bands were obtained using SCoT35 (11 bands) and SCoT22 (3 bands), respectively. The PIC values for the 10 primers ranged from 0.22 (SCoT 1) to 0.48 (SCoT 35) with an average of 0.39 per primer. The marker index (MI) of the primers ranged from 0.88 (SCoT 1) to 5.28 (SCoT 35). A diverse level of polymorphism using SCoT markers has been reported in different plant species. The level of polymorphism observed in safflower genotypes here was relatively higher than that reported in wheat [Citation25], potato [Citation22], and chickpea [Citation28]. The Jaccard’s genetic similarity values of the safflower genotypes based on SCoT molecular markers ranged from 0.49 to 0.93. Un-weighted pair-group (UPGMA) clustering using SCoT molecular dataset grouped the safflower genotypes into three major groups (). Cluster I comprised 34 accessions and divided into two sub-groups. The first sub-group contained Iranian landraces, whereas in the second sub-group, Iranian improved cultivars grouped with genotypes from China, Turkey, and Cyprus (). Cluster II contained 10 genotypes, all of which were Iranian landraces. In cluster III, two Iranian landraces grouped with two cultivars from Turkey and Pakistan. The results also showed that the SCoT clusters had relatively direct connection with the origin and the source of the genotypes.
Figure 1. Amplification profile obtained with SCoT12 (a), ERF2 (b), and CAAT3 (c) primers in chickpea genotypes. M, molecular size marker (Cinagen, Iran); lanes 1–24, the lane numbers correspond to the genotypes listed in .
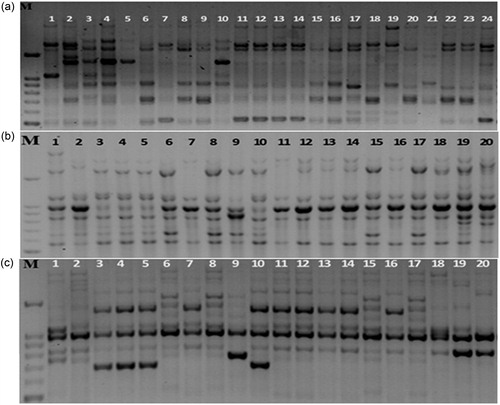
Figure 2. Cluster analysis of 48 safflower genotypes based on genetic similarity obtained by SCoT markers.
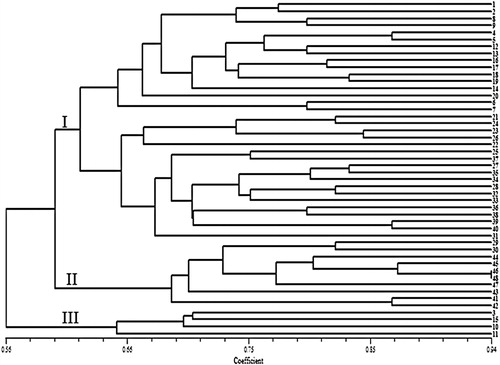
Table 3. Description of the polymorphism, PIC and marker index (MI) values of gene-targeted molecular markers used in the genetic diversity analysis of 48 safflower genotypes.
CDDP markers diversity pattern
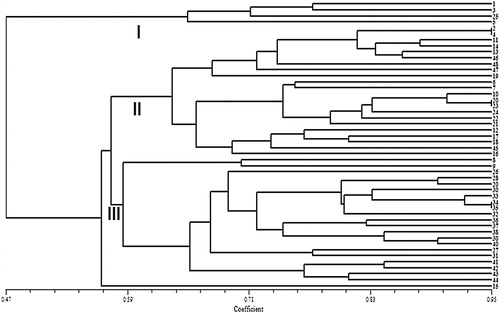
When 10 CDDP markers were used for genetic diversity analysis in 48 safflower genotypes, a total of 89 sharp and scorable bands were generated, out of which 74 bands were polymorphic (83.1% of polymorphism) across the 48 safflower genotypes. The amplification profile of the safflower genotypes generated using the ERF2 primer is presented in . The maximum and minimum number of polymorphic bands were obtained using ABP-1 and WRKY-1 (10 bands) and Knox2 (4 bands), respectively. The PIC values for the 10 CDDP primers ranged from 0.24 (Knox2) to 0.49 (ABP-1) with an average of 0.43 per primer. The MI of the primers ranged from 0.96 (Knox2) to 4.6 (ABP-1 and WRKY-1). High level genetic diversity in safflower using ISSR and SSR markers has been reported previously [Citation15,Citation16]. The level of variability using the CDDP markers for safflower genetypes is similar to that found in durum wheat [Citation26], bittersweet [Citation27], and chickpea [Citation28]. UPGMA clustering using the CDDP markers grouped the safflower genotypes into three major clusters (). Cluster I included four genotypes from Iran, Pakistan and the United States. Cluster II comprised 22 genotypes, most of which were Iranian landrace and five improved cultivars originated from Iran. Cluster III comprised 21 genotypes, most of which were Iranian landraces and improved cultivars from Turkey, Cyprus and China. Interestingly, the Iranian landrace genotypes grouped in cluster II and III and all Iranian improved cultivars also grouped in these clusters. The grouping of the genotypes into clusters was also connected with the geographical origin and the sources of genotypes.
Figure 3. Cluster analysis of 48 safflower genotypes based on genetic similarity obtained by CDDP markers.
CBDP markers diversity pattern
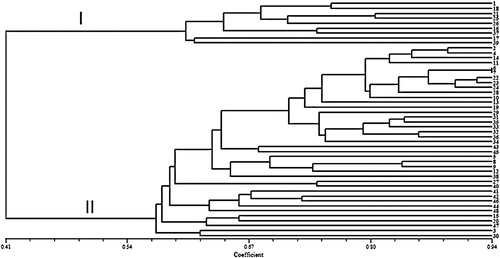
The 10 CBDP primers used in this study yielded 65 distinct and bright bands and their sizes ranged from 200 to 2900 bp. The amplification profile of the safflower genotypes generated using the CAAT3 primer is presented in . The number of bands varied from 5 (CAAT4 and CAAT5) to 9 (CAAT1, CAAT8 and CAAT10), with an average of 6.5 bands per primer. Out of 65 bands, 57 (87.6%) were polymorphic, and the number of polymorphic bands varied from 4 (CAAT4) to 9 (CAAT8), with an average of 5.7 bands per primer. The detected polymorphism per primer ranged from 57.5 to 100% (). The PIC values for the 10 CBDP primers ranged from 0.19 (CAAT4) to 0.49 (CAAT1) with an average of 0.41 per primer. The primers’ MI ranged from 1.16 (CAAT9) to 4.41 (CAAT1) (). UPGMA clustering grouped the 48 safflower genotypes into two major clusters. Cluster I comprised nine genotypes originating from the United States, Cyprus, and Turkey. The second cluster contained 39 genotypes mainly originated from Iran. In this cluster, landrace and Iranian improved genotypes were grouped together in closer sub-clusters ().
Figure 4. Cluster analysis of 48 safflower genotypes based on genetic similarity obtained by CBDP markers.
Diversity and population structure analysis by combined data
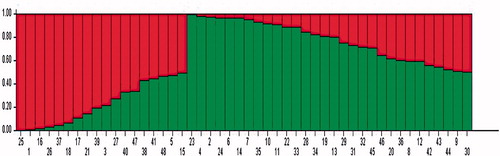
The general dendrogram () that was constructed using the combined data of all the molecular markers used in this study (SCoT, CDDP, and CBDP) grouped the genotypes into two major clusters. Cluster I comprised nine genotypes which mostly originated from USA and Turkey. Cluster II contained 39 genotypes, all of which originated from Iran. The dendrogram from the CBDP data was most consistent with the general dendrogram. The cophenetic coefficient for different molecular marker types (0.73 for SCoT; 0.81 for CDDP; and 0.84 for CBDP) indicated good fit for clustering. The values of the Mantel test correlation showed a positive correlation between the three different marker types. The correlation coefficient (r) was 0.53 between SCoT and CBDP (significant p<.05), 0.43 between CDDP and SCoT, 0.44 between CDDP and CBDP. The Mantel test showed significant correlation between the CDDP and CBDP clusters with the general dendrogram (r = 0.52* and r = 0.74**, receptively). The Jaccard’s similarity matrices generated from the whole marker dataset were used for PCoA. The 48 safflower genotypes were clearly classified into two groups (), which was in agreement with the UPGMA clustering above. The first and the second principal axis explained 26.11 and 12.01% of the variation, respectively. The genetic structure of 48 safflower genotypes was further explored using the Bayesian clustering model implemented in the STRUCTURE software. The results showed the highest peak at K = 2 indicating the presence of two major clusters (). These results mean that the 48 genotypes should be divided into two populations (). The results obtained from the STRUCTURE analysis are in good agreement with those obtained from the UPGMA clustering and PCoA.
Figure 5. Cluster analysis of 48 safflower genotypes based on genetic similarity obtained by combined data (SCoT, CDDP, and CBDP markers).
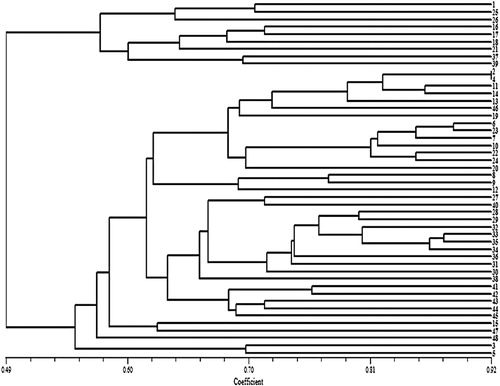
Figure 6. Principal coordinate analysis of 48 safflower genotypes based on Jaccard’s similarity from the molecular data set for SCoT, CDDP, and CBDP markers.
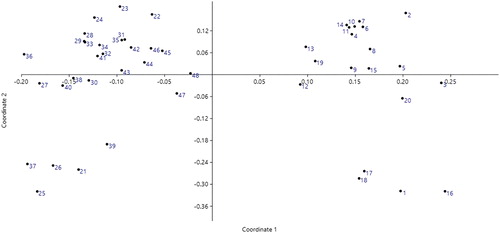
Figure 7. K values based on three independent runs and K ranging from 1 to 8 based on 48 safflower genotypes using SCoT, CDDP and CBDP markers.
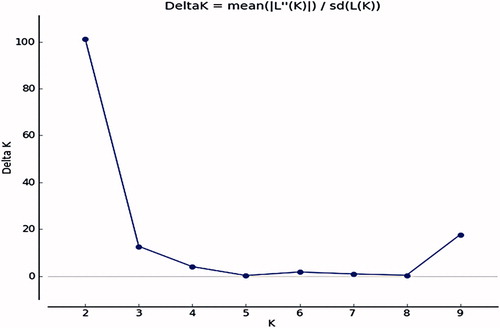
Figure 8. Population genetic diversity of 48 safflower genotypes based on SCoT, CDDP, and CBDP markers.
In this study, the three different gene-targeted molecular markers, i.e. SCoT, CDDP, and CBDP, adopted to study the genetic diversity among landrace and improved safflower genotypes from different sources demonstrated that gene-targeted molecular markers have advantages over the use of dominant random markers (such as ISSR, RAPD, and AFLP), as these markers reveal genetic diversity from the genic region in the genome and this functional diversity can be used in any species [Citation32,Citation33]. Gene-based molecular markers have not been used for genetic diversity analysis in safflower so far. To our knowledge, the present study is the first analysis of the genetic diversity among landrace and improved safflower genotypes collected from different geographical sources using gene-targeted (SCoT, CDDP, and CBDP) molecular markers. In our study, three different types of markers (SCoT, CDDP, and CBDP) showed high level of polymorphism and were found to be effective in determining the genetic diversity among safflower genotypes. Their efficiency was evident from the high number of polymorphic bands, PIC and MI values. A high level of diversity in safflower using SSR [Citation34,Citation35], AFLP [Citation36], RAPD [Citation11], and ISSR [Citation37] markers has been reported earlier. In our study, three different markers showed relatively the same efficiency with regard to the average polymorphism and PIC values. The average PIC value of the CDDP markers (0.43) was higher than those of the SCoT and CBDP markers (0.39.5 and 0.41, respectively). The average MI of the CDDP markers (3) was also higher than those of the SCoT and CBDP markers (2.08 and 2.64, respectively). The CBDP marker utility for genetic diversity has been reported in cotton, linseed and Ajwain [Citation19,Citation38], Jojoba [Citation33], and Kalmegh [Citation39], whereas SCoT and CDDP markers have been proved effective in the analysis of genetic diversity in diverse plant species [Citation20,Citation22,Citation23,Citation25,Citation26,Citation39–41]. These functional markers are also known as perfect markers, or diagnostic markers. The most important advantages of these types of markers are the direct link between the markers and the alleles of a locus of interest and the prevention of loss of information in marker-assisted selection due to recombination between gene and marker [Citation42]. Gene-targeted molecular markers were used in the present study for several reasons. Firstly, these markers are easy to work with in laboratory conditions and their reproducibility compared to arbitrary markers such as RAPD markers is higher due to the use of longer primers [Citation17,Citation18]. We found that there was a feasible relationship between the diversity patterns obtained by gene-targeted markers and the geographical origin. The high correlations between the genetic distances and the geographical origin of the examined safflower genotypes suggest that natural selection has significantly affected the genome regions that were amplified by SCoT, CDDP, and CBDP markers. In the other hand, maybe if more genotypes from the Fertile Crescent are included in the genetic diversity analysis, the results for geographical relationships and origins will be more acceptable. This was particularly observed from the results that the genotypes from Iran and Turkey grouped in distinct clusters. Overall, the present study showed high genetic diversity in safflower genotypes, as well as in Iranian landrace accessions. This level of genetic variation can be useful for more systematic germplasm management and utilization in breeding programmes [Citation21].
Conclusions
This study, for the first time, demonstrated the capability of three different gene-targeted molecular markers (SCoT, CDDP, and CBDP) not only to determine the polymorphism rate, but also to be used for management of the genetic diversity in different improved and landrace safflower genotypes as well as in applied breeding programmes, particularly for the development of a core collection. The obtained results provide data for the characterization of safflower genotypes in addition to previous analyses by RAPD, AFLP, and SSR markers. The results showed that SCoT, CDDP, and CBDP molecular markers can be used as reliable techniques for detecting the levels of DNA polymorphism and genetic relationship in safflower.
Disclosure statement
No potential conflict of interest was reported by the authors.
Additional information
Funding
Related Research Data
References
- Knowles P, Ashri A. Safflower: Carthamus tinctorius (Compositae). In: Smartt J, Simmonds NW, editors. Evolution of crop plants. Harlow (UK): Longman; 1995. p. 47–50.
- Burke JM, Tang S, Knapp SJ, et al. Genetic analysis of sunflower domestication. Genetics. 2002;161:1257–1267.
- Dordas CA, Sioulas C. Dry matter and nitrogen accumulation, partitioning, and retranslocation in safflower (Carthamus tinctorius L.) as affected by nitrogen fertilization. Field Crops Res. 2009;110:35–43.
- Morrell PL, Buckler ES, Ross-Ibarra J. Crop genomics: advances and applications. Nat Rev Genet. 2012;13:85–96.
- Castañeda-Álvarez NP, Khoury CK, Achicanoy HA, et al. Global conservation priorities for crop wild relatives. Nature Plants. 2016;2(4):16022.
- Khan MA, von Witzke-Ehbrecht S, Maass BL, et al. Evaluation of a worldwide collection of safflower for morphological diversity and fatty acid composition. Vorträge für Pflanzenzächtung. 2004;62:104–106.
- Jaradat AA, Shahid M. Patterns of phenotypic variation in a germplasm collection of Carthamus tinctorius L. from the Middle East. Genet Resour Crop Evol. 2006;53:225–244.
- Zhang ZW. Studies on genetic diversity and classification of safflower (Carthamus tinctorius L.) germplasm byisozyme techniques. In: Bergman J, Mundel HH, editors. Proceedings of the 5th International Safflower Conference; 2001 Jul 23–27; Williston, ND and Sidney, MT. Fargo (ND): Department of Plant Pathology, North Dakota State University; 2001. p. 157–162.
- Yielaghi H, Arzani A, Ghaderian M, et al. Effect of salinity on seed oil content and fatty acid composition of safflower (Carthamus tunctorius L.) genotypes. Food Chem. 2012;130:618–625.
- Amini F, Saeidi GH, Arzani A. Study of genetic diversity in safflower genotypes using agro-morphological traits and RAPD markers. Euphytica. 2008;163:21–30.
- Khan MA, von Witzke-Ehbrech S, Maass BL, et al. Relationships among different geographical groups, agro-morphology, fatty acid composition and RAPD marker diversity in Safflower (Carthamus tinctorius). Genet Resour Crop Evol. 2009;56:19–30.
- Mahasi MJ, Wachira FN, Pathak RS, et al. Genetic polymorphism in exotic safflower (Carthamus tinctorious L.) using RAPD markers. J Plant Breed Crop Sci. 2009;1:8–12.
- Johnson RC, Kisha TJ, Evans MA. Characterizing safflower germplasm with AFLP molecular markers. Crop Sci. 2007;47:1728–1736.
- Ash GJ, Raman R, Crump NS. An investigation of genetic variation in Carthamus lanatus in New South Wales, Australia, using inter-simple sequence repeats (ISSR) analysis. Weed Res. 2003;43:208–213.
- Yang YX, Wu W, Zheng YL, et al. Genetic diversity and relationships among safflower (Carthamus tinctorius L.) analyzed by inter-simple sequence repeats (ISSRs). Genet Resour Crop Evol. 2007;54:1043–1051.
- Usha Kiran B, Mukta N, Kadirvel P, et al. Genetic diversity of safflower (Carthamus tinctorius L.) germplasm as revealed by SSR markers. Plan Genet Resour. 2015;15(1):1–15.
- Collard BCY, Mackill DJ. Start codon targeted (SCoT) polymorphism: a simple, novel DNA marker technique for generating genetargeted markers in plants. Plant Mol Biol Report. 2009;27:86–93.
- Collard BCY, Mackill DJ. Conserved DNA-derived polymorphism (CDDP): a simple and novel method for generating DNA markers in plants. Plant Mol Biol Report. 2009;27:558–562.
- Singh AK, Rana MK, Singh S, et al. CAAT box-derived polymorphism (CBDP): a novel promoter-targeted molecular marker for plants. J Plant Biochem Biotechnol. 2014;23:175–183.
- Amirmoradi B, Talebi R, Karami E. Comparison of genetic variationand differentiation among annual Cicer species using start codon targeted (SCoT) polymorphism, DAMD-PCR, and ISSR markers. Plant Syst Evol. 2012;298:1679–1688.
- Pakseresht F, Talebi R, Karami E. Comparative assessment of ISSR, DAMD and SCoT markers for evaluation of genetic diversity and conservation of chickpea (Cicer arietinum L.) landraces genotypes collected from north-west of Iran. Physiol Mol Biol Plant. 2013;19(4):563–574.
- Gorji AM, Poczai P, Polgar Z, Taller J. Efficiency of arbitrarily amplified dominant markers (SCOT, ISSR and RAPD) for diagnostic fingerprinting in tetraploid potato. Am J Potato Res. 2011;88:226–237.
- Shahlaei A, Torabi S, Khosroshahli M. Efficacy of SCoT and ISSR markers in assessment of tomato (Lycopersicum esculentum Mill.) genetic diversity. Int J Biol Sci. 2014;5:14–22.
- Xiong F, Zhong R, Han Z, Jiang J, He L, Zhuang W, Tang R. Start codon targeted polymorphism for evaluation of functional genetic variation and relationships in cultivated peanut (Arachis hypogaea L.) genotypes. Mol Biol Rep. 2011;38:3487–3494.
- Hamidi H, Talebi R, Keshavarz F. Comparative efficiency of functional gene-based markers, start codon targeted polymorphism (SCoT) and conserved DNA-derived Polymorphism (CDDP) with ISSR markers for diagnostic fingerprinting in wheat (Triticum aestivum L.). Cereal Res Commun. 2014;44(4):558–567.
- Seyedimoradi H, Talebi R, Fayaz F. Geographical diversity pattern in Iranian landrace durum wheat (Triticum turgidum) accessions using start codon targeted polymorphism and conserved DNA-derived polymorphism markers. Environ Exp Biol. 2016;14:63–68.
- Poczai P, Varga I, Bell NE, Hyvonen J. Genetic diversity assessment of bitter sweet (Solanum dulcamara, Solanaceae) germplasm using conserved DNA-derived polymorphism and intron-targeting markers. Ann Appl Biol. 2011;159:141–153.
- Hajibarat Z, Saidi A, Hajibarat Z, et al. Characterization of genetic diversity in chickpea using SSR markers, Start Codon Targeted Polymorphism (SCoT) and Conserved DNA-Derived Polymorphism (CDDP). Physiol Mol Biol Plants. 2015;21(3):365–373.
- Lassner MW, Peterson P, Yoder JI. Simultaneous amplification of multiple DNA fragments by polymerase chain reaction in the analysis of transgenic plants and their progeny. Plant Mol Biol Report. 1989;7:116–128.
- Perrier X, Flori A, Bonnot F. Data analysis methods. In: Hamon P, Seguin M, Perrier X, Glaszmann JC, editors. Genetic diversity of cultivated tropical plants. Boca Raton (FL): CRC Press; 2003. p. 43–76.
- Pritchard JK, Stephens M, Donnelly P. Inference of population structure using multilocus genotype data. Genetics. 2000;155:945–959.
- Paliwal R, Singh R, Singh AK, et al. Molecular characterization of Giloe (Tinospora cordifolia Willd. Miers ex Hook. F. and Thoms.) accessions using Start Codon Targeted (SCoT) markers. Int J Med Aromat Plants. 2013;3:413–422.
- Heikrujam M, Kumar J, Agrawal V. Genetic diversity analysis among male and female Jojoba genotypes employing gene targeted molecular markers, start codon targeted (SCoT) polymorphism and CAAT box-derived polymorphism (CBDP) markers. Meta Gene. 2015;5:90–97.
- Lee G-A, Sung J-S, Lee SY, et al. Genetic assessment of safflower (Carthamus tinctorius L.) collection with microsatellite markers acquired via pyrosequencing method. Mol Ecol Resour. 2014;14:69–78.
- Derakhshan E, Majidi MM, Sharafi Y, et al. Discrimination and genetic diversity of cultivated and wild safflowers (Carthamus spp.) using EST–microsatellites markers. Bioch Syst Ecol. 2014;54:130–136.
- Kumar S, Ambreen H, Murali TV, et al. Assessment of genetic diversity and population structure in a global reference collection of 531 accessions of Carthamus tinctorius (safflower) using AFLP markers. Plant Mol Biol Report. 2014;33(5):1299–1313.
- Yaman H, Tarıkahya-Hacıoğlu B, Arslan Y, et al. Molecular characterization of the wild relatives of safflower (Carthamus tinctorius L.) in Turkey as revealed by ISSRs. Genet Resour Crop Evol. 2014;61:595–602.
- Tomar P, Malik CP. Genetic diversity assessment in Trachyspermum ammi L. Sprague using CDDP and CBDP markers. J Plant Sci Res. 2016;32:27–36.
- Tiwari G, Singh R, Singh N, et al. Study of arbitrarily amplified (RAPD and ISSR) and gene targeted (SCoT and CBDP) markers for genetic diversity and population structure in Kalmegh [Andrographis paniculata (Burm. f.) Nees]. Indust Crop Prod. 2016;86:1–11.
- Bhattacharya A, Jaime A, Silva TD. Molecular systematics in Chrysanthemum × grandiflorum (Ramat.) Kitamura. Sci Hortic. 2006;109:379–384.
- Guo DL, Zhang JY, Liu CH. Genetic diversity in some grape varieties revealed by SCoT analyses. Mol Biol Rep. 2012;39:5307–5313.
- Nadeem MA, Nawaz MA, Shahid MQ, et al. DNA molecular markers in plant breeding: current status and recent advancements in genomic selection and genome editing. Biotechnol Biotechnol Equip. 2018;32:261–285.