
Abstract
We used a mitochondria-penetrating nitroxide, mito-TEMPO, as a contrast probe for imaging of kidney dysfunction in mice, based on the redox-imbalance and oxidative stress in the renal tissues. Kidney dysfunction was triggered by hypercholesterolemia. The mice were divided in three groups: (i) on normal diet (ND; control); (ii) on cholesterol diet (CD); (iii) on cholesterol plus cholestyramine diet (CC). CD mice showed increased plasma levels of total cholesterol and non-HDL-cholesterol, as well as increased serum levels of blood urea nitrogen, uric acid and creatinine, compared to ND mice. CC mice showed slightly increased plasma levels of total cholesterol and HDL-cholesterol, but not non-HDL-cholesterol, compared to ND mice. The serum levels of blood urea nitrogen, uric acid and creatinine in CC mice were equal to those in ND mice. The MRI signal of mito-TEMPO in the kidneys was characterized by: high intensity and long life-time in CD mice, indicating a high oxidative capacity of renal tissues; poor intensity and short life-time in ND mice, indicating a high reducing capacity of renal tissues; moderate intensity and relatively short life-time in CC mice, which shows the protective effect of lipid-lowering agents against oxidative damage. The data suggest that hypercholesterolemia induces redox-imbalance and oxidative stress in kidneys and this process could be visualized using MRI and mito-TEMPO as a redox-sensitive contrast substance.
Introduction
Renal dysfunction is mainly caused by inflammatory and/or atherogenic factors (e.g. environmental pollutants, drugs, insecticides, unhealthy foods, etc.), inducing increased serum levels of cholesterol, lactate dehydrogenase, alkaline phosphatase, aminotransferases, urea, creatinine, creatine kinases, and plasma pro-inflammatory cytokines (interleukin-1-beta, interleukin-6, and tumour necrosis factor-alpha), as well as decreased levels of glutathione and ascorbate and suppression of antioxidant enzymes [Citation1–5]. All these events are accompanied by a redox-imbalance, resulting in decreased antioxidant capacity and oxidative stress [Citation6,Citation7]. The prolonged effect of inflammatory and atherogenic factors leads to irreversible structural damage of kidney and development of renal failure – a severe pathology, in which the life of patient is maintained through haemodialysis to find a suitable donor for transplantation. In this context, early diagnosis of renal dysfunction and prevention of renal failure has a significant social impact. Extensive research has found that many antioxidants and redox-modulators of natural or synthetic origin have a protective effect against renal dysfunction [Citation1–7]. They are suitable candidates for the prevention of renal dysfunction.
The redox-status of cells, tissues and body fluids is one of the basic parameters, monitored in clinical trials of chronic kidney disease and renal transplantation [Citation8,Citation9]. The tissue redox-status is determined by the balance between endogenous redox-active compounds: (i) oxidizers [e.g. reactive oxygen and nitrogen species (ROS/RNS)]; and (ii) reducers (e.g. antioxidant systems, thiol-containing proteins, endogenous redox-pairs) [Citation10]. Significant progress has been made in the selective localized detection of many redox-active compounds in vitro and in vivo due to the development of new synthetic or genetically encoded redox-sensitive contrast substances and improvement of visualization techniques: fluorescence, chemiluminescence, magnetic resonance, nuclear, ultrasonic imaging [Citation11–13]. At present, the efforts are focused on mapping the redox-status of tissues and organs in intact organisms. The perfect methodology should provide direct and non-invasive detection of the redox-status of the target organ in vivo.
Some of the most attractive redox-sensitive contrast substances are cyclic nitroxide radicals, which can be registered and analyzed in vitro and in vivo by various magnetic resonance techniques, such as electron-paramagnetic resonance imaging (EPRI), magnetic resonance imaging (MRI) and Overhauser-enhanced MRI (OMRI) [Citation13,Citation14]. The paramagnetic nitroxide radical is involved in electron-transfer reactions with oxidizers and reducers, leading to the formation of diamagnetic intermediate products (hydroxylamine and oxoammonium) (). The rate constants of these reactions determine the dynamics of nitroxide-enhanced MRI/EPRI signal in living biological objects. Thus, the nitroxide probes allow an assessment of the total (overall) redox-status of cells, tissues and body fluids. Some studies have shown that cyclic nitroxides exist mainly in two forms in vivo, radical and hydroxylamine [Citation13,Citation15]. Various endogenous reducers and oxidizers could be involved (directly or indirectly via oxoammonium) in the formation of diamagnetic hydroxylamine, but only the interaction of hydroxylamine with superoxide can restore the radical form of nitroxide and its contrast properties at physiological pH (7.4) [Citation11,Citation14,Citation16–18]. Thus, the intensity of the nitroxide-enhanced MRI/EPRI signal in а particular organ indicates the tissue redox-status and can serve as a marker for non-invasive assessment of redox-imbalance and oxidative stress in vivo.
Figure 1. Redox-cycle of nitroxide and dynamics of its MRI/EPR contrast in living cells and tissues (original scheme; reprinted with permission from Zhelev et al. [Citation31] Copyright © 2012 Elsevier Ltd.)
![Figure 1. Redox-cycle of nitroxide and dynamics of its MRI/EPR contrast in living cells and tissues (original scheme; reprinted with permission from Zhelev et al. [Citation31] Copyright © 2012 Elsevier Ltd.)](/cms/asset/67dd8821-80a5-40c9-9904-770d5081af86/tbeq_a_1573153_f0001_c.jpg)
In this study, we used a cell-penetrating and mitochondria-penetrating nitroxide radical, mito-TEMPO, as a contrast probe for non-invasive imaging of kidney dysfunction in mice, based on the induction of redox-imbalance and oxidative stress in the renal tissues. The renal dysfunction was triggered by hypercholesterolemia. Experimental and clinical studies have shown that hypercholesterolemia is a risk factor for development of chronic kidney disease accompanied by structural and functional changes in this organ [Citation19–21]. High level of cholesterol in the bloodstream and tissues causes inflammation and induces oxidative stress, which leads to renal fibrosis, cell apoptosis and lesions, respectively to severely impaired and reduced filtration [Citation22,Citation23].
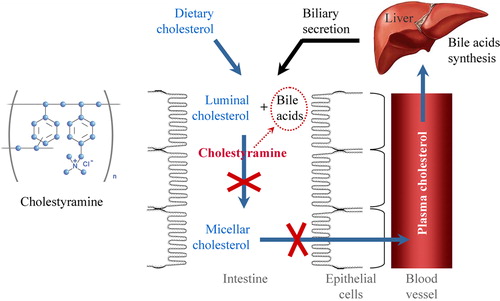
We also evaluated the effect of a lipid-lowering drug (cholestyramine) on the tissue redox-status of kidney. Cholestyramine is an ion-exchange polymer and bile acid sequestrant (). It can exchange its chloride anions with anionic bile acids in the gastrointestinal tract and bind them in the polymer matrix.
Figure 2. Structural formula and mechanism of lowering plasma cholesterol by bile acid sequestrant cholestyramine. Bile acids are synthesized in the liver from cholesterol and secreted to the intestine through the gallbladder. Cholestyramine binds bile acids in the gastrointestinal tract, prevents their re-absorption and increases their excretion from the organism. The low level of bile acids in the portal vein and liver induces synthesis of bile acids ‘de novo’, which is accompanied by consumption of cholesterol and its removal from the plasma. Thus, plasma cholesterol decreases.
Materials and methods
Ethics of experimentation statement
The care, maintenance, and experiments with animals were in accordance to the ‘Principles of Laboratory Animal Care’ (NIH publication number 85-23, revised 1985) and the Guidelines of the Animal Investigation Committee of the National Institute of Radiological Sciences (QST-NIRS, Chiba, Japan).
Animals
Male C57Bl/6 mice were purchased from Japan SLC Inc. (Shizuoka, Japan). Mice were subjected to a normal diet (ND mice) (MF; Oriental Yeast Co., Tokyo, Japan) or a cholesterol diet (ATT6492210; 1.25% [wt/wt] cholesterol, Oriental Yeast Co.) without (CD mice) or with 3% cholestyramine (CC mice), starting at 5 weeks of age.
Throughout the experiments, the mice were kept in stainless steel cages with food and water available ad libitum and maintained on a 12-h light-dark cycle.
MRI measurements
The MRI measurements were performed on 7.0 Tesla horizontal magnet (Kobelco and Jastec, Kobe, Japan) interfaced to a Bruker Avance-I console (Bruker BioSpin, Rheinstetten, Germany) and controlled with ParaVision 4.0.1 (Bruker BioSpin).
Mice were anesthetized by isoflurane (2.0%, Abbott Japan, Tokyo, Japan) and placed in a body holder (Rapid Biomedical, Rimpar, Germany), stomach side down and fixed head. A polyethylene catheter (PE-10, Becton-Dickinson, NJ, USA) was placed in the tail vein for probe administration. The mouse’s body was then placed in the 1H-volume coil 35 mm in diameter. Rectal temperature of the mouse was maintained at 36.5 ± 0.5 °C using a circulating hot water pad and monitored using an optical temperature probe (FOT-L and FTI-10, FISO Technologies Inc., Germany). A respiration sensor (TDS160A, BIOPAC Systems Inc., CA, USA) was placed on the chest of the mouse for monitoring.
Before nitroxide administration, five control images of the mouse body were acquired with the following parameters: T1-weighted incoherent gradient-echo sequence (fast low-angle shot); repetition time = 75 ms; echo time = 3.2 ms; flip angle = 45°; number of averages = 4; scan time = 19.2 s; matrix = 64 × 64; slice thickness = 1.5 mm; number of slices = 5. We selected the coronal slice orientations with a 500 × 625 × 1500 μm3 nominal voxel resolution. Mito-TEMPO was dissolved in phosphate-buffered saline (10 mmol/L PBS, pH 7.4) to 100 mmol/L stock solution. Ninety-six seconds after starting the MRI scan (five scans as pre-administration data), 100 μL of mito-TEMPO per 25 g mouse were injected via the tail vein during scanning. T1-weighted images were acquired continuously within ∼15 min.
The MRI data were analyzed using the ImageJ software (National Institute of Health, Bethesda, MD, USA). The intensity of the nitroxide-enhanced MRI signal in the kidney area (region-of-interest, ROI) was normalized to the average intensity of the MRI signal in the same area before injection of mito-TEMPO (first five scans).
Analysis of plasma cholesterol levels
Blood samples were taken from the tail vein in a heparinized microhematocrit tubes. The samples were centrifuged at 12,000×g for 5 min at room temperature, to obtain plasma. Plasma was stored at −80 °C until cholesterol analysis. The total cholesterol level was determined by a modification of the cholesterol oxidase method with the use of kit reagents (Wako Pure Chemical Industries, Osaka, Japan). The high-density lipoprotein (HDL) cholesterol levels were measured by the cholesterol oxidase assay of the supernatant from the precipitate of non-HDL lipoproteins with phosphotungstic acid and magnesium chloride using the kit reagents (Wako Pure Chemical Industries). The non-HDL cholesterol levels were calculated as HDL cholesterol levels subtracted from total cholesterol levels.
Histochemical staining
Isolated kidney was fixed with 4% formaldehyde in PBS overnight. The tissue was embedded in paraffin. Tissue sections were prepared and stained with haematoxylin and eosin. The analysis of stained tissue sections was performed with a microscope (Olympus FV1000, Olympus, Japan).
Statistical analysis
The results are expressed as means with standard error (±SE) or means with standard deviation (±SD). Comparisons between the groups were performed using Student’s t-test. A value of P < 0.05 was considered significant.
Results and discussion
The mice were divided in three groups: (i) group 1 – on normal diet (control) (ND mice); (ii) group 2 – on cholesterol diet (CD mice); (iii) group 3 – on cholesterol plus cholestyramine diet (CC mice). After 15 weeks of feeding, the mice were subjected to the following analyses: (i) plasma cholesterol levels; (ii) serum test, representative for renal functionality; (iii) evaluation of redox-status of the kidneys in vivo, using nitroxide-enhanced MRI and mito-TEMPO as a redox-sensor.
The CD mice were characterized by significantly elevated levels of total plasma cholesterol and non-HDL cholesterol, and decreased levels of HDL cholesterol, compared to the ND mice (). CC mice were characterized by slightly elevated total plasma cholesterol, control level of non-HDL cholesterol and slightly increased HDL cholesterol, compared to the ND mice. These data prove the development of hypercholesterolemia in CD mice and lipid-lowering effect of cholestyramine.
Figure 3. (A) Plasma cholesterol levels in mice on high cholesterol diet with and without cholestyramine. TC, total cholesterol; non-HDL-C, non-HDL cholesterol; HDL-C, HDL-cholesterol; CD mice, mice on cholesterol diet; CC, mice on cholesterol plus cholestyramine diet. (B) Biochemical test of serum for renal functionality. TP, total protein; BUN, blood urea nitrogen; CRE, creatinine; UA, uric acid. The control level of each parameter in the plasma of mice on normal diet was considered 100% (red dotted lines). All parameters were measured on the 15th week after feeding. The results are means ± SE. ns, non-significant versus control group; ***P < 0.001, **P < 0.01, *P < 0.05, ns, non-significant versus control group; +++P < 0.001, ++P < 0.01, +P < 0.05; NS, non-significant versus CD group. Each group consisted of 6 mice.
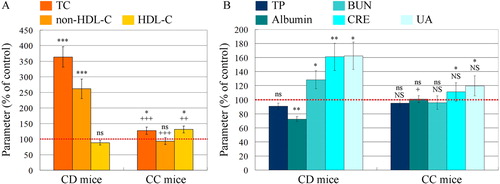
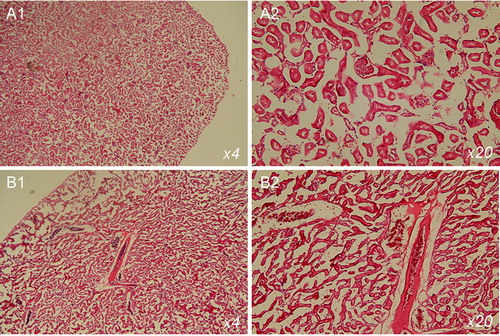
The hypercholesterolemia compromised the renal function of CD mice: blood urea nitrogen, creatinine and uric acid increased significantly, compared to the control group (ND mice) (). In CC mice, all these parameters were almost equal to the reference values, measured in the control group. Histochemical analysis, performed at the end of the study, showed glomerular and tubular lesions in CD mice (). Similar results, showing the development of renal dysfunction in experimental models of hypercholesterolemia, have been also reported by other authors [Citation22,Citation24,Citation25].
Figure 4. Haematoxylin and eosin staining of tissue sections of kidneys isolated from mice on normal diet (A) and cholesterol diet (B). The mice were 20 weeks of age. The images indicate glomerular and tubular damage.
Representative nitroxide-enhanced magnetic resonance images of kidney are shown in . The nitroxide-enhanced signal was extracted from each image after injection of mito-TEMPO and normalized to the average baseline signal, obtained before the injection. Thus, it is possible to assess the redox-status of the nitroxide probe (oxidized/reduced), respectively to assess the redox-capacity of the tissues in vivo.
Figure 5. (A–C) Representative nitroxide-enhanced magnetic resonance images of kidneys in mice on: normal diet (A); cholesterol plus cholestyramine diet (B) or cholesterol diet (C). Black and white image: T1-weighted MR images of kidneys before injection of mito-TEMPO. Colour images: extracted MRI signal intensity after injection of mito-TEMPO, normalized to the averaged baseline level (before injection of mito-TEMPO). The yellow arrows indicate the kidneys. (D) Kinetic curves of the normalized MRI signal before and after injection of mito-TEMPO in mice on normal diet (n = 5), cholesterol diet (n = 7) and cholesterol plus cholestyramine diet (n = 7) (n, number of mice in each experimental group). The data are means ± SD.
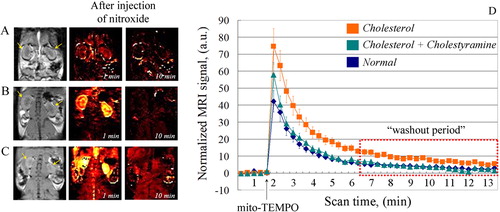
In ND mice, a weak MRI signal was detected in the kidney immediately after injection of mito-TEMPO, but it disappeared completely within 3 minutes (). This indicates a conversion of nitroxide radical to its diamagnetic form (hydroxylamine), which can be explained by the high reducing capacity of normal (healthy) renal tissues. In CD mice, a strong MRI signal was detected in the kidney immediately after injection of mito-TEMPO (). The intensity decreases within 15 min but is still above the baseline (). This indicates the presence of nitroxide in paramagnetic form, which can be explained by the high oxidative capacity of the renal tissues. In CC mice, the nitroxide-enhancement was very well expressed immediately after injection of mito-TEMPO, but the signal disappeared completely within 10 min (). Obviously, the renal tissues of cholestyramine-treated mice were characterized by lower oxidative and higher reducing capacity than those of untreated CD mice. The kinetic curves of nitroxide-enhanced MRI signal in support this assumption. In CD mice, the signal was long-lived and had a significantly higher intensity than that of ND mice. The differences were statistically significant even in the ‘washout period’ (P < 0.05). No statistically significant difference was found between the integrated MRI signals (area under the curve) of CC mice and ND mice.
It is known that hypercholesterolemia provokes a significant decrease of reduced glutathione and ascorbate in renal lesions, which indicates a redox-imbalance [Citation25–27]. Ascorbate is the main endogenous reducer of nitroxide radical and ‘quencher’ of its MRI contrast [Citation17,Citation28]. Ascorbate and glutathione are major factors responsible for the rapid decay of nitroxide-enhanced MRI signal in normal (healthy) kidney. On the other hand, hypercholesterolemia-induced oxidative stress is accompanied by up-regulation of NADPH-dependent oxidase complex (NOX) and mitochondrial dysfunction in kidney [Citation29,Citation30], which results in overproduction of superoxide. Superoxide is the main oxidizer that can restore the nitroxide-enhanced MRI contrast [Citation11,Citation14,Citation18].
Another important factor can also influence the dynamics of MRI contrast in this organ. This is the penetration of nitroxide into the tissues and the rate of excretion from the organism.
Recently, we demonstrated that the relationship between the physicochemical properties of nitroxide probes and their rate of penetration and distribution in cells and tissues is crucial for the proper interpretation of the data from nitroxide-enhanced MRI studies in vivo [Citation31,Citation32]. The rate of metabolism and excretion of nitroxide radical from the organism compete with its penetration in the target tissue and its resistance to reduction. The dynamics of nitroxide-enhanced MRI signal in vivo follow all these processes.
In vitro MRI/EPRI studies have also shown that the nitroxide should penetrate easily and quickly into the cells and interact with intracellular reducers and oxidizers, to serve as a sensor of cellular redox-status [Citation33,Citation34]. Nevertheless, most of the in vivo MRI/EPRI studies of tissue redox-status have been conducted with pyrrolidine-type nitroxides, carboxy-PROXYL (CPx) and carbamoyl-PROXYL (CMPx) [Citation35–38], due to their higher resistance to reduction in biological specimens compared to the piperidine-type nitroxides (as mito-TEMPO). CPx and CMPx are hydrophilic and non-penetrating or poorly penetrating in cells and tissues; they are also excreted very rapidly through the kidney in normal conditions [Citation36].
In our previous study on CD mice, we did not observe any nitroxide-enhanced MRI signal in the kidney, using CMPx as a contrast probe [Citation39]. However, this observation was not a result of a rapid reduction of CMPx to its diamagnetic form. This was a result of strongly decreased renal perfusion, which was proved by a gadolinium-enhanced MRI.
CMPx was recorded by MRI in the bladder of healthy mice at the second minute after tail injection [Citation36], but not in the bladder of mice with hypercholesterolemia [Citation39]. Moreover, we found that the serum albumin and total protein decreased significantly in CD mice (). This should accelerate the renal filtration of nitroxide and its excretion from the organism, compared to ND mice. However, the nitroxide-enhanced MRI signal had higher intensity and longer life-time than in ND mice. All these data provide indirect evidence that the higher intensity of MRI signal of mito-TEMPO in the kidneys of CD mice was mainly due to the higher oxidative capacity of renal tissues, compared to ND mice. The comparative analysis with our previous study [Citation39] shows that hydrophilic nitroxide radicals (such as CMPx), that poorly penetrate or do not penetrate in the cells, are not suitable for ‘redox-imaging’ of kidney dysfunction, accompanied by oxidative stress and severely decreased filtration due to glomerulosclerosis.
Cyclic nitroxides are relatively low toxic (much better than gadolinium complexes) and are not mutagenic [Citation40]. They are characterized by beneficial biomedical effects, such as: anticancer effect, regulation of body weight, protection against ischemia-reperfusion injury, protective effect against cataract, sensitizing cancer cells and tissues to ionizing radiation and protecting normal cells and tissues, etc. [Citation15,Citation41,Citation42]. This increases the interest in nitroxides as contrast substances for MRI/EPRI in vivo. Nitroxide radicals appear to be appropriate candidates as new contrast probes for redox-imaging in translational studies. Our study showed that the higher sensitivity of cell-penetrating piperidine-type nitroxides to reduction should not be considered as a disadvantage. This provides a new opportunity for MRI/EPRI analysis of metabolic pathways, accompanied by minor changes in the reducing capacity of biological objects and induction of oxidative stress.
Conclusions
The present study showed that mito-TEMPO is an appropriate contrast probe for magnetic resonance imaging of hypercholesterolemia-induced kidney dysfunction based on impaired redox-capacity of renal tissues. The probe is also suitable for assessing the effect of anti-lipidemic drugs. The experimental data suggest that hypercholesterolemia induces oxidative stress in kidney and this process could be visualized using MRI and cell-penetrating nitroxide radicals as a redox-sensitive contrast probe (especially mito-TEMPO).
Acknowledgements
We would like to thank Mr. Yoshikazu Ozawa (from the National Institute for Radiological Sciences, QST-NIRS, Chiba, Japan) for his assistance during MRI experiments.
Disclosure statement
No potential conflict of interest was reported by the authors.
Funding
This study was partially supported by the Grant-in-aid ‘Kakenhi-C’ from the Japanese Society for the Promotion of Science (JSPS) and the Diversity grant from the QST-NIRS & Chiba University (both granted to R.B.).
References
- Abdel-Daim MM, Abd Eldaim MA, Mahmoud MM. Trigonella foenum-graecum protection against deltamethrin-induced toxic effects on hematological, biochemical, and oxidative stress parameters in rats. Can J Physiol Pharmacol. 2014;92:679–685.
- Abdou RH, Abdel-Daim MM. Alpha-lipoic acid improves acute deltamethrin-induced toxicity in rats. Can J Physiol Pharmacol. 2014;92:773–779.
- Abdel-Daim M, El-Bialy BE, Rahman HGA, et al. Antagonistic effects of Spirulina platensis against sub-acute deltamethrin toxicity in mice: biochemical and histopathological studies. Biomed Pharmacother. 2016;77:79–85.
- Abdel-Daim MM, Khalifa HA, Abushouk AI. Diosmin attenuates methotrexate-induced hepatic, renal, and cardiac injury: a biochemical and histopathological study in mice. Oxid Med Cell Longev. 2017;2017:3281670.
- Abdel-Daim MM, Dessouki AA, Abdel-Rahman HG, et al. Hepatorenal protective effects of taurine and N-acetylcysteine against fipronil-induced injuries: the antioxidant status and apoptotic markers expression in rats. Sci Total Environ. 2019;650:2063–2073.
- Betjes MG. Immune cell dysfunction and inflammation in end-stage renal disease. Nat Rev Nephrol. 2013;9:255–265.
- Kon V, Linton MRF, Fazio S. Atherosclerosis in chronic kidney disease: the role of macrophages. Nat Rev Nephrol. 2011;7:45–54.
- Vostalova J, Galandakova A, Svobodova AR, et al. Time-course evaluation of oxidative stress-related biomarkers after renal transplantation. Ren Fail. 2012;34:413–419.
- Ilori TO, Sun RY, Kong SY, et al. Oxidative balance score and chronic kidney disease. Am J Nephrol. 2015;42:320–327.
- Georgieva E, Ivanova D, Zhelev Z, et al. Mitochondrial dysfunction and redox imbalance as a diagnostic marker of “free radical diseases”. Anticancer Res. 2017;37:5373–5381.
- Maulucci G, Bacic G, Bridal L, et al. Imaging of ROS-induced modifications in living cells. Antioxid Redox Signal. 2016;24:939–957.
- Kalyanaraman B, Darley-Usmar V, Davies KJ, et al. Measuring reactive oxygen and nitrogen species with fluorescent probes: challenges and limitations. Free Radic Biol Med. 2012;52:1–6.
- Dikalov SI, Harrison DG. Methods for detection of mitochondrial and cellular reactive oxygen species. Antioxid Redox Signal. 2014;20:372.
- Bacic G, Pavicevic A, Peyrot F. In vivo evaluation of different alterations of redox status by studying pharmacokinetics of nitroxides using magnetic resonance techniques. Redox Biol. 2016;8:226–242.
- Soule BP, Hyodo F, Matsumoto K, et al. The chemistry and biology of nitroxide compounds. Free Radic Biol Med. 2007;42:1632–1650.
- Batinic-Haberle I, Reboucas JS, Spasojević I. Superoxide dismutase mimetics: chemistry, pharmacology, and therapeutic potential. Antioxid Redox Signal. 2010;13:877–918.
- Bobko AA, Kirilyuk IA, Grigor'ev IA, et al. Reversible reduction of nitroxides to hydroxylamines: roles for ascorbate and glutathione. Free Radic Biol Med. 2007;42:404–412.
- Zhelev Z, Bakalova R, Aoki I, et al. Magnetic resonance imaging of mitochondrial dysfunction and metabolic activity accompanied by overproduction of superoxide. ACS Chem Neurosci. 2015;6:1922–1929.
- Domrongkitchaiporn S, Sritara P, Kitiyakara C, et al. Risk factors for development of decreased kidney function in a southeast Asian population: a 12-year cohort study. J Am Soc Nephrol. 2005;16:791–799.
- Cheng ZZ, Patari A, Aalto-Setala K, et al. Hypercholesterolemia is a prerequisite for puromycin inducible damage in mouse kidney. Kidney Int. 2003;63:107–112.
- Rodriguez-Porcel M, Krier JD, Lerman A, et al. Combination of hypercholesterolemia and hypertension augments renal function abnormalities. Hypertension. 2001;37:774–780.
- Fang Q, Zou C, Zhong P, et al. EGFR mediates hyperlipidemia-induced renal injury via regulating inflammation and oxidative stress: the detrimental role and mechanism of EGFR activation. Oncotarget. 2016;7:24361–24373.
- Okamura DM, Pennathur S, Pasichnyk K, et al. CD36 regulates oxidative stress and inflammation in hypercholesterolemic CKD. J Am Soc Nephrol. 2009;20:495–505.
- Bentley MD, Rodriguez-Porcel M, Lerman A, et al. Enhanced renal cortical vascularization in experimental hypercholesterolemia. Kidney Int. 2002;61:1056–1063.
- Qiao M, Zhao Q, Lee CF, et al. Thiol oxidative stress induced by metabolic disorders amplifies macrophage chemotactic response and accelerates atherogenic and kidney injury in LDL receptor-deficient mice. ATVB. 2009;29:1779–1786.
- Cachofeiro V, Goicochea M, de Vinuesa SG, et al. Oxidative stress and inflammation, a link between chronic kidney disease and cardiovascular disease. Kidney Int Suppl. 2008;74:S4–S9.
- Deepa PR, Varalakshmi P. Salubrious effect of low molecular weight heparin on atherogenic diet-induced cardiac, hepatic and renal lipid peroxidation and collapse of antioxidant defences. Mol Cell Biochem. 2003;254:111–116.
- Mehlhorn RJ. Ascorbate- and dehydroascorbic acid-mediated reduction of free radicals in the human erythrocytes. J Biol Chem. 1991;266:2724–2731.
- Wan C, Su H, Zhang C. Role of NADPH oxidase in metabolic disease-related renal injury: an update. Oxid Med Cell Longev. 2016;2016:7813072.
- Gamboa JL, Billing FT, Bojanowski MT, et al. Mitochondrial dysfunction and oxidative stress in patients with chronic kidney disease. Physiol Rep. 2016;4:e12780.
- Zhelev Z, Aoki I, Gadjeva V, et al. Tissue redox activity as a sensing platform for imaging of cancer based on nitroxide redox cycle. Eur J Cancer. 2013;49:1467–1478.
- Bakalova R, Zhelev Z, Aoki I, et al. Tissue redox activity as a hallmark of carcinogenesis: from early to terminal stages of cancer. Clin Cancer Res. 2013;19:2503–2517.
- Samuni Y, Gamson J, Samuni A, et al. Factors influencing nitroxide reduction and cytotoxicity in vitro. Antioxid Redox Signal. 2004;6:587–595.
- Suzuki-Nishimura T, Swartz HM. Reduction of lipid-soluble nitroxides in CHO cells and macrophage tumor cells. Free Radic Biol Med. 1994;17:473–479.
- Hyodo F, Yasukawa K, Yamada K-I, et al. Spatially resolved time-course studies of free radical reactions with an EPRI/MRI fusion technique. Magn Reson Med. 2006;56:938–943.
- Hyodo F, Matsumoto K, Matsumoto A, et al. Probing the intracellular redox status of tumors with MRI and redox-sensitive contrast agents. Cancer Res. 2006;66:9921–9928.
- Matsumoto K, Hyodo F, Matsumoto A, et al. High-resolution mapping of tumor redox status by MRI using nitroxides as redox-sensitive contrast agents. Clin Cancer Res. 2006;12:2455–2462.
- Hirayama A, Ueda A, Oteki T, et al. In vivo imaging of renal redox status during azelnidipine treatment. Hypertens Res. 2008;31:1643–1650.
- Tomizawa A, Hadjidekov G, Ishii I, et al. Nitroxide derivatives for imaging of hypercholesterolemia-induced kidney dysfunction and assessing the effectiveness of antilipidemic drugs. Mol Pharm. 2011;8:1962–1969.
- Soule BP, Hyodo D, Matsumoto K, et al. Therapeutic and clinical applications of nitroxide compounds. Antioxid Redox Signal. 2007;9:1731–1743.
- Zuo L, Chen YR, Reyes LA, et al. The radical trap 5,5-dimethyl-1-pyrroline N-oxide exerts dose-dependent protection against myocardial ischemia-reperfusion injury through preservation of mitochondrial electron transport. J Pharmacol Exp Ther. 2009;329:515–523.
- Liu Y, Wang Y, Ding W, et al. Mito-TEMPO alleviates renal fibrosis by reducing inflammation, mitochondrial dysfunction, and endoplasmic reticulum stress. Oxid Med Cell Longev. 2018;2018:5828120.