
Abstract
Soybean is valued in foods, animal feed and some industrial applications, and agronomic traits are important targets for soybean breeding. In this study, two sets of recombinant inbred line (RIL) populations were used to map yield and quality trait quantitative trait loci (QTLs) across three environments. In total, we detected 37 QTLs in two RIL populations grown in three locations. In the 3613 RIL population, three QTLs related to quality traits and 13 related to yield traits were identified among the 16 QTLs. In the 6013 population, we identified six QTLs related to quality traits and 15 related to yield traits. Among these QTLs, some genomic regions showed pleiotropic effects on yield and quality traits. We further identified candidate genes from these regions. Our results lay the foundation for producing high-yielding soybean with excellent quality traits via molecular breeding.
Introduction
Soybean [Glycine max (L.) Merr.] is one of the most important legume crops worldwide, with extensive acreage in the USA, Brazil, China and other countries [Citation1]. Soybean has several beneficial properties, including a 20% oil content, 40% protein content and high fatty acid levels [Citation2]. Therefore, soybean represents an important source of raw materials for the production of plant protein and vegetable oil products, as well as industrial and pharmaceutical products [Citation3]. Although soybean breeders focus on increasing yield traits and improving quality traits, these quantitative traits are controlled by multiple genes, and the underlying genetic mechanisms are relatively complex [Citation4]. Traditional breeding methods based on phenotypic screening have several disadvantages, such as the large amount of labour and materials required, low efficiency and long operating cycles. Therefore, the use of molecular marker technology to construct soybean genetic linkage maps has become a growing area of study. This method, which involves detecting the degree of linkage between molecular markers and related quantitative trait loci (QTLs) underlying useful traits, can greatly facilitate soybean breeding efforts [Citation5].
Molecular genetic maps of soybean have been continuously improving, as they are required for QTL mapping of soybean quality- and yield-related traits. In the late 1980s, Apuya et al. [Citation4] constructed the first molecular genetic linkage map of soybean, containing 11 restriction fragment length polymorphism (RFLP) markers. In 1990, Keim et al. [Citation5] constructed a second soybean linkage map, which covered 1200 cM of the soybean genome with 130 RFLP markers. A map was constructed with 490 markers covering 3000 cM of the soybean genome. However, the lack of integration of conventional markers limited the use of these of molecular marker maps for QTL localisation. In 1995, Shoemaker and Specht [Citation6] used an F2 segregating population obtained via hybridisation of the near-isogenic soybean lines Clark and Harsoy and constructed the first soybean ‘consensus linkage map’. Cregan et al. [Citation7] integrated the genetic linkage maps of three populations and obtained a common map consisting of 26 classical and 10 isozyme loci along with 79 random amplified polymorphic DNA (RAPD), 689 RFLP and 606 simple sequence repeat (SSR) loci. Song et al. [Citation8] generated a genetic linkage map by integrating five soybean genetic maps, including those for two F2 populations (‘A81-56022’ × ‘PI468916’ and ‘Clark’ × ‘Harosoy’) and three recombinant inbred line (RIL) populations (‘Minsoy’ × ‘Noir1’, ‘Minsoy’ × ‘Archer’, and ‘Noir1’ × ‘Archer’). In the past 10 years, as genome sequencing efforts have advanced, many high-density genetic maps have been constructed for soybean [Citation9–11].
To date, many QTLs underlying agronomic traits in soybean have been mapped and deposited in the SoyBase database (www.soybase.org), including 322 seed oil QTLs, 240 seed protein QTLs, 318 seed weight QTLs, 255 plant height QTLs, 24 seed weight per plant QTLs and 48 pod number QTLs. However, to date, only a few QTLs affecting multiple agronomic traits have been mapped in crops. Gahlaut et al. [Citation12] performed QTL mapping of wheat double haploid populations planted in four different locations in India for 3 years and identified essential genomic regions carrying multiple QTLs for different traits on the 5A and 7A linkage groups. The locus associated with lodging in maize identified by Larsson et al. [Citation13] coincides with the positions of previously identified QTLs for stem strength. Using two F2:3 populations of maize under drought stress, Zhao et al. [Citation14] identified QTLs controlling multiple traits at several locations. Wu et al. [Citation15] integrated QTLs from soybean at different growth stages and identified 10 QTLs controlling multiple growth stages in five linkage groups (C2, D1a, D1b, F and J). Hacisalihoglu et al. [Citation16] performed QTL mapping of a soybean RIL population grown in environments with different levels of P availability, and found that QTLs controlling seed quality and volume on Gm06 shared overlapping regions. The use of these types of loci could help improve multiple agronomic traits in soybean, thereby increasing the yield and quality of this important crop.
In this study, we genotyped two sets of RIL populations and investigated their yield and quality traits in three environments. The aims of this study were to (1) construct a genetic map of two RILs, (2) map the main-effect QTLs of agronomic traits and (3) identify the key loci that affect multiple agronomic traits in soybean. The results lay the foundation for producing high-yielding soybean with excellent quality traits via molecular breeding.
Materials and methods
Construction of RIL populations and experimental design
Three soybean species G. max (from Northeast Agriculture University Soybean Institute) with clearly different morphological traits were employed as the parents for mapping. Two RIL populations were constructed using Dongnong L13 as the female parent and Heihe 36 and Heinong 60 as the male parents. An RIL mapping population was obtained by multiple-seed descent using single-seed descent until the F5 generation, and two F6 RIL populations were constructed: RIL3613 and RIL6013 [Citation17].
Field experiment
On 10 May 2016, soybean seeds were planted in the experimental fields of Northeast Agricultural University in Harbin (E128°N45°), S’cheng (E125°N45°) and Acheng (E126°N45°), China. Experimental treatments were applied in a randomised block design, and the planting density was 220,000 plants/hm2. The plants were arranged in a randomised experimental three-row plot (5 m long and 0.67 m wide) at a spacing of 13.89 cm via ridge cultivation.
Phenotypic measurements
At the maturity stage, five individual plants were randomly selected from the middle row to measure quality and yield traits. A FOSS Infratec™1241 Grain Analyser was used to analyse seed protein and oil content, and post-harvest surveys were performed to investigate yield-related traits
Genetic map construction and QTL mapping
Genetic maps have been constructed previously [Citation17]. The inclusive composite interval mapping (ICIM) method was employed to analyse 1-year multilocation RIL data using IciMapping software (http://www.isbreeding.net/software/). The model was used with a mapping step of 2.0 cM, a LOD significance threshold determined by 1000 permutation tests with a minimum value of 2.5, and significance set at the p = .05 level. The positive additive effect values were derived from the female parent, ‘Dongnong L13’, and the negative additive effect values were derived from the male parents, ‘Heihe 36 and Heinong 60’.
Gene mining involving consensus QTL intervals
Several candidate genes related to protein and oil accumulation and plant growth and development were selected based on genomic information from the Williams 82 Assembly two Genomic Sequence (Wm82.a2) and physical locations of the QTL intervals. These genes were annotated using information from various databases, primarily SoyBase (Integrating Genetics and Genomics to Advance Soybean Research) (https://www.soybase.org/), Phytozome (https://phytozome.jgi.doe.gov/pz/portal.html), QuickGO (Gene Ontology [GO] and GO Annotations) (https://www.ebi.ac.uk/QuickGO/) and the Kyoto Encyclopaedia of Genes and Genomes (KEGG) (https://www.kegg.jp/).
Results and discussion
Linkage map and traits of two RIL populations grown in three environments
Several studies have highlighted the importance of plant height and plant weight to soybean yield. Lee et al. [Citation18] used an RIL population to construct a high-density single-nucleotide polymorphism (SNP) map, and mapped QTLs associated with seven plant height traits in soybean via composite interval mapping in three environments. Liang et al. [Citation19] located two QTLs for plant weight in an RIL population derived from a cross between soybean lines BD2 and BX10. However, the RIL populations utilised in these studies were derived from two parents, and the linkage analysis involved only two alleles at the same locus. Due to the use of populations with limited genetic backgrounds, the low molecular marker polymorphism of such single populations leads to the identification of fewer markers for genetic map integration and low saturation, which limits the utility of these maps [Citation20].
Here, we used three soybean species differing in morphological traits to generate two RIL populations, RIL3613 and RIL6013 [Citation17], so that we could identify QTLs affecting yield-related traits. The RIL populations used in this study were designed by four-way hybridisation [Citation20–22]. The use of populations produced from four parental double crosses increased not only the number of polymorphic markers, but also the density of the genetic map. The total length of the RIL 3613 genetic map was 2848.56 cM, including 150 SSRs. The average distance between markers was 18.99 cM, the length of a single linkage group ranged from 1.15 to 283.42 cM, and the number of markers ranged from 2 to 13. The RIL 6013 genetic map was 1886.8 cM, with an average length between markers of 13.77 cM, including 137 pairs of SSR primers. The length of a single linkage group ranged from 19.68 to 163.67 cM, and the number of markers ranged from 4 to 11 [Citation17].
In recent years, most studies focused on QTL mapping of soybean quality and yield traits have been based on single-environment analyses, which makes the mapping results difficult to confirm. We reasoned that results from plants grown in different environments could be compared to increase the accuracy of the analysis. Phenotypic data for the two RIL populations grown in three environments are therefore provided in , and . Thirty-seven QTLs were detected in the two RIL populations from three environments. lists information about these populations, including the population name, trait ID, trait name, chromosome, position, left marker, right marker, LOD, phenotypic variability explained (PVE), additive effect, left confidence interval (CI), right CI and environment.
Figure 1. Phenotype distribution of RIL3613.
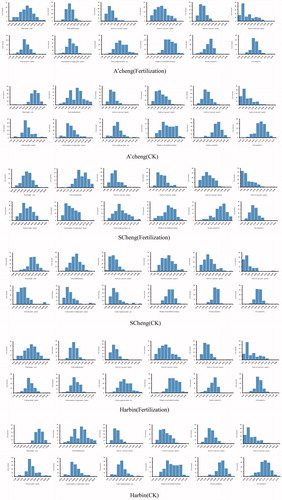
Figure 2. Phenotype distribution of RIL6013.
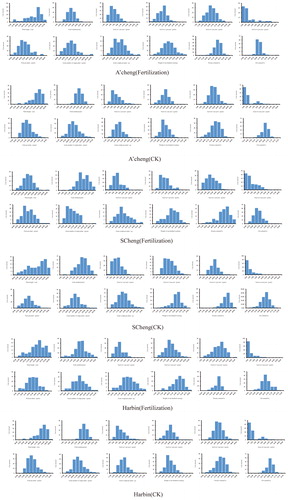
Table 1. QTL mapping information.
The high or low LOD values obtained in previous studies are another important factor limiting the reproducibility of those results; when LOD values are too high, QTLs might not be detected and data will be lost. By contrast, using an excessively low LOD value may result in a false positive for the detected QTL. In this study, we used multiyear and multipoint data for joint analysis, which not only increased the detection intensity of QTLs, but also greatly improved the accuracy of the detected locations and effects of the QTLs.
QTL mapping analysis of the RIL populations
The chromosome number was 17 in both populations. Chromosomes Gm04, Gm06 and Gm07 had 37 left markers but only 21 right markers, indicating that the QTLs in these populations contained overlapping regions, a phenomenon that deserves further investigation. The minimum LOD value was only 2.508, which was detected in the 3613 RIL population and is related to grain weight per plant. The maximum LOD value was 20.8606, which was detected in the 6013 RIL population and is associated with seed set one per pod. Eight QTLs (all from RIL population 6013) had PVE values of 0. The highest PVE value was also obtained from this population, which reached 13.0708%. The positive and negative additive effect values were derived from the female parent and male parent, respectively. The highest absolute additive effect value was 98.3181. The highest absolute additive effect values were all detected from RIL population 3613, and were all associated with grain number of a single plant; these QTLs had additive effects: −98.3181 − 43.1966 and −28.1164. The highest positive additive effect values were all related to plant height; these values were 26.7388, 23.8381, 23.5375, 23.314, 22.0246, 17.9361, 16.8258, 15.7834 and 15.6442. The QTLs with positive additive effect values were all mapped from RIL population 6013.
We detected 37 QTLs in the two RIL populations from three locations (). Sixteen QTLs were detected in RIL population 3613, and 21 were detected in RIL population 6013. In all three locations, the number of QTLs ranged from 22 to 32, and the number of traits ranged from 11 to 12, with 12 traits identified only in A’cheng City. These QTLs were related to various soybean traits, including protein, oil and other yield traits, and were distributed on all 17 chromosomes except Gm04, Gm06 and Gm07. Among these QTLs, five were associated with protein content, four with oil content, and the remaining QTLs with 10 yield traits. These yield-related QTLs were mainly located on chromosomes Gm01 and Gm16. The QTLs for both quality and yield traits were mainly located on Gm16, a key soybean chromosome. These QTLs were related to 12 types of traits. The largest number of QTLs (24) was associated with seed set per pod and the smallest number (4) was associated with 100-seed weight and oil content.
Warrington et al. [Citation23] previously located four QTLs related to protein content based on an RIL population. Wang et al. [Citation24] combined the positioning results from two RIL populations and conducted joint analysis, identifying 12 seed yield QTLs, 16 oil-related QTLs and 11 QTLs controlling protein content. Zhang et al. [Citation25] employed an RIL population derived from a cross between Bogao and Nannong94-156 to locate 10 QTLs that regulate the number of soybean pods. Here, we identified nine QTLs for protein and oil content, found on seven chromosomes: Gm11, Gm12, Gm15, Gm16, Gm18, Gm19 and Gm20. The QTLs related to protein content that were mined from the 3613 population all had negative additive effects, but the protein content-related QTLs mined from the other RIL population all had positive additive effects. The protein content QTLs had additive effect values ranging from −0.7244 to 2.6519.
Of the five QTLs associated with protein content identified in this study, four were mapped to QTL regions associated with protein content in previous studies. One protein QTL has been mapped to the region 23.91 cM (Sat_228) to 52.84 cM (Sat_366) located on Gm16 [Citation26]. The 50.52 cM (Satt352) to 100 cM (sat_117) region on Gm18 contains eight protein content-related QTLs identified in previous studies [Citation8,Citation27–30]. Only two protein content-related QTLs have been mapped to region 78.23 cM (Sat_099) to 93.88 cM (Satt229) on Gm19 [Citation31]. A region located on chromosome 20 is thought to be important, as it has been repeatedly associated with protein content by different breeders in several studies in the past. Twenty QTLs were mapped to the 18.5 cM (Satt571) to 82.77 cM (Satt292) region [Citation8,Citation24,Citation27,Citation30–36].
We identified four QTLs related to oil only in the 6013 population, with additive effects of −0.0592, −0.0156, 0.0351 and −0.0648. One of these QTLs (Gm15; 39.16–56.7 cM) associated with the soybean oil index is located in the same segment as a previously identified oil QTL [Citation24,Citation37–40], indicating that there is a high probability that this region contains one or several important genes that control oil traits.
The QTL related to 100-seed weight mined from the 3613 population had an additive effect value of −0.5026 and the highest LOD value (6.7912), indicating that it is located in a concentrated area of QTLs associated with 100-seed weight. Number of grains per pod was the most common yield trait among the QTLs identified from the two RIL populations, especially seed set four per pod, involving 24 QTLs. Among the QTLs related to seed set four per pod, two QTLs were detected, with additive effects of −4.2785 and −4.2216 and relatively large LOD values of 16.8139 and 15.0703, respectively, indicating that a concentrated area of QTLs is associated with seed set four per pod. A number of QTLs associated with pod number at the same position on chromosome Gm11 (satt197–sat_123) were also found to be related to pod numbers in previous studies [Citation40]. The QTLs related to plant height had the highest additive values and LOD values.
Identification of QTLs with pleiotropic effects
A total of 32 QTLs were found to control multiple traits (i.e. QTLs with pleiotropic effects), whereas only five were associated with a single trait, including seed set one per pod, seed set four per pod and plant height. In the 3613 population, the QTLs for 11 traits are distributed on 11 chromosomes, with most QTLs associated with seed set four per pod. In the 6013 population, the QTLs for 12 traits are distributed on 13 chromosomes, with most QTLs also related to seed set four per pod. QTLs associated with more than four traits were designated as multi-effect QTLs in this study.
In the 6013 RIL population, a QTL associated with markers sat_394 and Sat_366 is related to nine traits, including one quality trait and eight yield traits, making it the QTL associated with the most traits. This QTL has negative additive effects, with a maximum PVE value of 0. The multi-effect QTL related to the second highest number of traits was that associated with markers satt237 and Sat_166, which is related to seven traits, including pod number per plant, grain weight per plant and grain number of a single plant, with a PVE of 0. The QTL associated with markers satt197 and sat_123 is related to six yield traits, with a maximum LOD value of 20.8606. The QTL associated with markers Sat_413 and Sat_160 is related to six traits, including all seed pod numbers, plant height and 100-seed weight. The QTL related to seed pod number had negative additive effects and large LOD values of 13.1038, 14.2334 and 16.8139. The QTL associated with markers Sat_341 and Sat_221 was related to five yield traits and has a large LOD value of 18.7469, and the QTL related to the pod number per plant and seed set two per pod had a PVE of 0. The QTL associated with markers Sat_366 and sat_228 was also related to quality and yield traits, with positive additive effects for the quality trait and negative additive effects for the other yield traits. The QTLs associated with marker Sat_366 are all related to quality traits.
In the 3613 RIL population, we identified two major QTLs that were only related to yield traits. One QTL, with markers Sat_200 and Satt353, was related to five yield traits, and a QTL associated with grain number of a single plant was detected with a maximum additive effect of −98.3181. Another QTL associated with markers Satt424 and Sat_294 was related to five yield traits, with a large LOD value of 13.0507.
In summary, we detected 37 QTLs in two RIL populations from three locations. In the 3613 RIL population, three QTLs related to quality traits and 13 QTLs related to yield traits were identified among the 16 QTLs. In the 6013 population, we identified six QTLs related to quality traits and 15 related to yield traits. Seeds per pod was the main yield trait associated with QTLs in both populations, especially seed set four per pod. We identified one essential chromosome, Gm16, harbouring one major QTL, containing sat_394 as the left marker and Sat_366 as the right marker, related to quality and yield traits.
Candidate gene mining for multiple-effect QTLs
We used three types of QTLs for candidate gene annotation, including QTLs related to quality traits and yield traits, QTLs related to multiple quality traits and QTLs related to multiple yield traits. We identified two QTL intervals related to quality traits and yield traits and six QTL intervals associated only with yield traits; no QTL intervals were related only to quality traits. Based on information about the markers obtained using the SoyBase online program, in the eight consensus QTL intervals, 1215 candidate genes were screened and annotated using the GO and GO Annotations and KEGG databases. Among these, 344, 396, 218, 52 and 205 genes were located in consensus QTL regions on GM01, GM8, GM11, GM12 and GM16, respectively (). The following enriched GO categories were identified: GO:0006807 (nitrogen compound metabolic process), GO:0034641 (cellular nitrogen compound metabolic process), GO:0006886 (intracellular protein transport), GO:0008565 (protein transporter activity) and GO:0015031 (protein transport). Among the enriched KEGG pathways, Ko04075 is involved in the plant hormone signal transduction pathway [Citation41], including gibberellins, auxin, abscisic acid and other hormones. Plant hormones play important roles in modulating stem growth, plant growth and seed development. The other enriched KEGG pathways included K14484, K14493, K14496, K14486, K14488, K14498 and K13946, which are involved in plant hormone signal transduction (pathway ID ko04075).
Table 2. Consensus QTL intervals and distribution of candidate genes for related traits on five linkage groups.
Based on pathway and functional annotation, we ultimately identified 36 candidate genes (). Glyma.01G052800 was annotated as a vesicle transport v-SNARE family protein gene, which functions in intracellular vesicle transport processes in protein storage vacuoles in plants [Citation42,Citation43]. Glyma.11G118600, Glyma.08G222400 and Glyma.08G207300 were annotated as Coatomer with beta subunit and gamma-2 subunit genes, which function in intracellular biosynthetic protein transport mediated by non-clathrin-coated vesicles [Citation44] and might be related to protein accumulation. Among the candidate genes, 13 were annotated as SAUR-like auxin-responsive protein family genes; SAUR proteins are involved in cell division and auxin biosynthesis [Citation45]. Glyma.08G188300, Glyma.01G004500 and Glyma.01G183500 were annotated as sucrose non-fermenting-related protein kinase (SnRK) genes, which are closely related to sugar signalling, biotic and abiotic stress responses, seed germination and seedling growth [Citation46,Citation47].
Table 3. Annotation of candidate genes associated with consensus QTLs.
In addition, SnRK2 and SnRK3 are directly related to abscisic acid signal transduction [Citation48]. Glyma.01G019400, Glyma.08G207900 and Glyma.08G273500 were annotated as indole-3-acetic acid-inducible genes; indole-3-acetic acid is a ubiquitous endogenous auxin in plants. Glyma.11G180900 was annotated as encoding nitrilase 4, which converts indole-3-acetonitrile to auxin, as revealed in Arabidopsis thaliana [Citation49]. Glyma.08G203100 was annotated as encoding a phytochrome-associated protein related to flowering [Citation50]. Glyma.01G103500 was annotated as encoding auxin response factor 9; ARF9 is expressed during early fruit development and is auxin responsive [Citation51]. Six candidate genes were annotated as encoding Adaptin family proteins or Adaptin family proteins with gamma subunits, which are involved in the formation of intracellular transport vesicles and the selection of cargo for incorporation into the vesicles [Citation52]. Glyma.01G179300 was annotated as Clathrin heavy chain, which functions in transport from the Golgi to vacuoles [Citation53]. Glyma.11G215500 was annotated as glutamine synthase, a highly regulated enzyme at the core of nitrogen metabolism [Citation54]. Glyma.16G082400 was annotated as the Sec23/Sec24 protein transport family protein; the Sec23 subunit is essential for linking COPII vesicle formation to anterograde transport events [Citation55]. Finally, Glyma.12G018500 was annotated as exportin 1A, which is essential for various developmental pathways in plants [Citation56].
Conclusions
We identified 37 QTLs for yield traits using two RIL populations grown in three environments. Some of these QTLs corresponded to those previously reported in other studies. Notably, most of the QTLs identified in this study are clustered in seven locations in the genome (Gm01, Gm03, Gm08, Gm10, Gm11, Gm12 and Gm16). These seven regions contain multiple QTLs controlling different traits. Additional studies on the multi-effect QTLs at these seven positions should be conducted in the future.
Disclosure statement
No potential conflict of interest was reported by the authors.
Additional information
Funding
Related Research Data
References
- Masuda T, Goldsmith PD. World soybean production: area harvested, yield, and long-term projections. Int Food Agribus Manag Rev. 2019;12:143–162.
- Boerma HR, Specht JE. Soybeans: improvement, production and uses. Madison (WI): Am Soc of Agron; 2004.
- Bernardo R. Molecular markers and selection for complex traits in plants: learning from the last 20 years. Crop Sci. 2008;48(5):1649–1664.
- Apuya NR, Frazier BL, Keim P, et al. Restriction fragment length polymorphisms as genetic markers in soybean, Glycine max (L.) Merrill. Theor Appl Genet. 1988;75:889–901.
- Keim P, Diers BW, Olson TC, et al. RFLP mapping in soybean: association between marker loci and variation in quantitative traits. Genetics. 1990;126:735–742.
- Shoemaker RC, Specht JE. Integration of the soybean molecular and classical genetic linkage groups. Crop Sci. 1995;35(2):436–446.
- Cregan PB, Jarvik T, Bush AL, et al. An integrated genetic map of the soybean genome. Crop Sci. 1999;39(5):1464–1490.
- Song QJ, Marek LF, Shoemaker RC, et al. A new integrated genetic linkage map of the soybean. Theor Appl Genet. 2004;109(1):122–128.
- Choi IY, Hyten DL, Matukumalli LK, et al. A soybean transcript map: gene distribution, haplotype and single-nucleotide polymorphism analysis. Genetics. 2007;176(1):685–696.
- Hyten DL, Choi IY, Song QL, et al. A high density integrated genetic linkage map of soybean and the development of a 1536 universal soy linkage panel for quantitative trait locus mapping. Crop Sci. 2010;50(3):960–968.
- Hyten DL, Cannon SB, Song QL, et al. High-throughput SNP discovery through deep resequencing of a reduced representation library to anchor and orient scaffolds in the soybean whole genome sequence. BMC Genom. 2010;11:38.
- Gahlaut V, Jaiswal V, Tyagi BS, et al. QTL mapping for nine drought-responsive agronomic traits in bread wheat under irrigated and rain-fed environments. PLoS ONE. 2017;12(8):e0182857.
- Zheng ZP, Liu XH. Genetic analysis of agronomic traits associated with plant architecture by QTL mapping in maize. Genet Mol Res. 2013;12(2):1243–1253.
- Zhao X, Peng Y, Zhang J, et al. Identification of QTLs and meta-QTLs for seven agronomic traits in multiple maize populations under well-watered and water-stressed conditions. Crop Sci. 2018;58(2):507–520.
- Wu Q, Qi ZM, Liu CY, et al. An integrated QTL map of growth stage in soybean [Glycine max (L.) Merr.]: constructed through meta-analysis. Acta Agron Sin. 2010;35(8):1418–1424.
- Hacisalihoglu G, Burton AL, Gustin JL, et al. Quantitative trait loci associated with soybean seed weight and composition under different phosphorus levels. J Integr Plant Biol. 2018;60(3):232–241.
- Ning H, Yuan J, Dong Q, et al. Identification of QTLs related to the vertical distribution and seed-set of pod number in soybean [Glycine max (L.) Merri]. PLoS ONE. 2018;13(4):e0195830.
- Lee S, Jun TH, Michel AP, et al. SNP markers linked to QTL conditioning plant height, lodging, and maturity in soybean. Euphytica. 2015;203(3):521–532.
- Liang Q, Cheng X, Mei M, et al. QTL analysis of root traits as related to phosphorus efficiency in soybean. Ann Bot. 2010;106(1):223–234.
- Jiang B, Yu S, Xiao B, et al. Constructing linkage map based on a four-way cross population. J Zhejiang Univ. 2014;40:387–396.
- Tong CF, Zhang B, Shi JS. A hidden Markov model approach to multilocus linkage analysis in a full-sib family. Tree Genet Genomes. 2010;6(5):651–662.
- Lee SH, Bailey MA, Mian MA, et al. RFLP loci associated with soybean seed protein and oil content across populations and locations. Theor Appl Genet. 1996;93:649–657.
- Warrington CV, Abdel-Haleem H, Hyten DL, et al. QTL for seed protein and amino acids in the Benning × Danbaekkong soybean population. Theor Appl Genet. 2015;128(5):839–850.
- Wang X, Jiang GL, Green M, et al. Identification and validation of quantitative trait loci for seed yield, oil and protein contents in two recombinant inbred line populations of soybean. Mol Genet Genomics. 2014;289(5):935–949.
- Zhang D, Cheng H, Wang H, et al. Identification of genomic regions determining flower and pod numbers development in soybean (Glycine max L.). J Genet Genomics. 2010;37(8):545–556.
- Brummer EC, Graef GL, Orf J, et al. Mapping QTL for seed protein and oil content in eight soybean populations. Crop Sci. 1997;37(2):370–378.
- Jun TH, Van K, Kim MY, et al. Association analysis using SSR markers to find QTL for seed protein content in soybean. Euphytica. 2008;162(2):179–191.
- Liang HZ, Yu YL, Wang SF, et al. QTL mapping of isoflavone, oil and protein contents in soybean (Glycine max L. Merr.). J Integr Agric. 2010;9:1108–1116.
- Lu W, Li H, Yuan D, et al. Identification of the quantitative trait loci (QTL) underlying water soluble protein content in soybean. Theor Appl Genet. 2013;126(2):425–433.
- Mansur LM, Orf JH, Chase K, et al. Genetic mapping of agronomic traits using recombinant inbred lines of soybean. Crop Sci. 1996;36(5):1327–1336.
- Chung J, Babka HL, Graef GL, et al. The seed protein oil and yield QTL on soybean linkage group I. Crop Sci. 2003;43(3):1053–1067.
- Mukhtarov AS. Analysis of a quantitative trait locus allele from wild soybean that increases seed protein concentration in soybean. Crop Sci. 2000;40:1438–1444.
- Nichols DM, Glover KD, Carlson SR, et al. Fine mapping of a seed protein QTL on soybean linkage group I and its correlated effects on agronomic traits. Crop Sci. 2006;46(2):834–839.
- Reinprecht Y, Poysa VW, Yu K, et al. Seed and agronomic QTL in low linolenic acid, lipoxygenase-free soybean (Glycine max (L.) Merrill) germplasm. Genome. 2006;49(12):1510–1527.
- Sudhakar P, Agnieszka P, Molnar P, et al. Relationship between asparagine metabolism and protein concentration in soybean seed. J Exp Bot. 2012;63:3173–3184.
- Chen QS, Zhang ZC, Liu CY, et al. QTL analysis of major agronomic traits in soybean. J Integr Agric (农业科学学报(英文)). 2007;6:399–405.
- Wang X, Jiang GL, Green M, et al. Quantitative trait locus analysis of saturated fatty acids in a population of recombinant inbred lines of soybean. Mol Breeding. 2012;30(2):1163–1179.
- Li H, Zhao T, Wang Y, et al. Genetic structure composed of additive QTL, epistatic QTL pairs and collective unmapped minor QTL conferring oil content and fatty acid components of soybeans. Euphytica. 2011;182(1):117–132.
- Pathan SM, Vuong T, Clark K, et al. Genetic mapping and confirmation of quantitative trait loci for seed protein and oil contents and seed weight in soybean. Crop Sci. 2013;53(3):765–774.
- Liu N, Mu L, Hu X, et al. Construction of high-density genetic map and QTL mapping of yield-related and two quality traits in soybean RILs population by RAD-sequencing. BMC Genomics. 2017;18(1):466. [cited 2019 Jul 22].
- Jiang H, Li Y, Qin H, et al. Identification of major QTLs associated with first pod height and candidate gene mining in soybean. Front Plant Sci. 2018;9.
- Zheng H, Von Mollard GF, Kovaleva V, et al. The plant vesicle-associated SNARE AtVTI1a likely mediates vesicle transport from the trans-Golgi network to the prevacuolar compartment. Mol Biol Cell. 1999;10(7):2251–2264.
- Hara-Nishimura I, Shimada T, Hatano K, et al. Transport of storage proteins to protein storage vacuoles is mediated by large precursor-accumulating vesicles. Plant Cell. 1998;10(5):825–836.
- Stenbeck G, Harter C, Brecht A, et al. Beta′‐COP, a novel subunit of coatomer. EMBO J. 1993;12(7):2841–2845.
- Belles-Boix E, Babiychuk E, Montagu MV, et al. CEF, a sec24 homologue of Arabidopsis thaliana, enhances the survival of yeast under oxidative stress conditions. J Exp Bot. 2000;51(351):1761–1762.
- Chevalier D, Walker JC. Functional genomics of protein kinases in plants. Brief Funct Genom. 2005;3(4):362–371.
- Xue-Fei D, Na C, Li W, et al. The SnRK protein kinase family and the function of SnRK1 protein kinase. Int J Agric Biol. 2012;14(4):575–579.
- Shukla V, Mattoo AK. Sucrose non-fermenting 1-related protein kinase 2 (SnRK2): a family of protein kinases involved in hyperosmotic stress signaling. Physiol Mol Biol Plants. 2008;14(1–2):91–100.
- Schmidt RC, Müller A, Hain R, et al. Transgenic tobacco plants expressing the Arabidopsis thaliana nitrilase II enzyme. Plant J. 1996;9(5):683–691.
- Kim DH, Kang JG, Yang SS, et al. A phytochrome-associated protein phosphatase 2A modulates light signals in flowering time control in Arabidopsis. Plant Cell. 2002;14(12):3043–3056.
- De Jong M, Wolters-Arts M, Schimmel BC, et al. Solanum lycopersicum AUXIN RESPONSE FACTOR 9 regulates cell division activity during early tomato fruit development. J Exp Bot. 2015;66(11):3405–3416.
- Ritter B, Philie J, Girard M, et al. Identification of a family of endocytic proteins that define a new α‐adaptin ear‐binding motif. EMBO Rep. 2003;4(11):1089–1093.
- Blackbourn HD, Jackson AP. Plant clathrin heavy chain: sequence analysis and restricted localisation in growing pollen tubes. J Cell Sci. 1996;109(4):777–786.
- Eisenberg D, Gill HS, Pfluegl GM, et al. Structure–function relationships of glutamine synthetases. Biochim Biophys Acta (BBA) – Protein Struct Mol Enzym. 2000;1477(1–2):122–145.
- Miller EA, Beilharz TH, Malkus PN, et al. Multiple cargo binding sites on the COPII subunit Sec24p ensure capture of diverse membrane proteins into transport vesicles. Cell. 2003;114(4):497–509.
- Tamura K, Hara-Nishimura I. Functional insights of nucleocytoplasmic transport in plants. Front Plant Sci 2014;5:118.