
Abstract
Glyceraldehyde-3-phosphate dehydrogenase (GAPDH) is a housekeeping protein which plays various roles in non-metabolic processes in addition to its role in glucose catabolism. There are several GAPDH isoforms in plant cells. In this study, we cloned the full-length cDNA encoding the isoform GAPC in two ecotypes of Leymus chinensis (Trin.) Tzvelev, gray–green type and yellow–green type. The LcGAPC sequence includes an open reading frame (ORF) of 1014 bp encoding 337 amino acids. The predicted molecular weight is 36.5 kDa, and the pI is 6.19. The mRNA expression of LcGAPC decreased at 24 h and then increased significantly after 7 d after 400 mmol/L NaCl stress. At 200 mmol/L mixed alkali stress (NaHCO3:Na2CO3=9:1), the LcGAPC expression level gradually increased as time increased in the two ecotypes of L. chinensis. The results suggested that LcGAPC is a stress-inducible gene that might play a role in the salt and alkali stress response. This study provided a basis to further study the mechanism of expression characteristics under salt and alkali stress conditions of L. chinensis.
Introduction
In recent years, the increasing cold, high temperature, drought and salinity resulting from global climate changes are posing a vital constraint on plant survival and productivity. As soil salinity increases, a better understanding of plants’ response to environmental stress is important for improving agriculture management [Citation1]. Leymus chinensis (Trin.) Tzvel. is a perennial grass that is widely distributed in the Eurasian steppe zone (range 36–62°N, 120–132°E). This grass is also known as alkali grass, which is one of the major dominant species in temperate grasslands in northern China [Citation2]. According to intraspecific differentiation of L. chinensis for eco-geographic regions, leaf color and genetic distance [Citation3], L. chinensis could be classified into two ecotypes as gray–green type and yellow–green type [Citation4]. Many studies have demonstrated physiological, ecological and genetic variability, including drought resistance, salt-alkali stress and photosynthesis in the two ecotypes [Citation5–8]. Zhou et al. [Citation5,Citation6] reported that the physiological characteristics of drought [Citation5] and salt-alkali resistance [Citation6] in the gray–green type were significantly increased compared with the yellow–green type. Furthermore, the photosynthesis capability [Citation7], stomatal conductance and transpiration rate in the gray–green type were increased compared with the yellow–green type. Physiological characteristics in the gray–green type exhibited increased osmotic tolerance to drought. In addition, the anatomic characteristics in the yellow–green type revealed larger vessel, vascular and xylem diameters [Citation9]. These results suggest that the gray–green type has stronger physiological resistance than the yellow–green type. Our earlier studies have identified differentially expressed protein spots in two ecotypes of L. chinensis by two-dimensional electrophoresis (2-DE), and cytoplasmic glyceraldehyde-3-phosphate dehydrogenase (LcGAPC) showed significant differential expression in the two ecotypes [unpublished].
Glyceraldehyde-3-phosphate dehydrogenase (GAPDH) plays a central role in glycolysis and the Calvin cycle. Recent studies found that the function and regulation of GAPDH are quite diverse and complex. As a housekeeping gene or protein, GAPDH is widely used as a control in real-time polymerase chain reaction (PCR) experiments. However, studies on GAPDH participating in the cellular response to water stress [Citation10], oxidative stress [Citation11] and apoptosis [Citation12] demonstrated that GAPDH was subject to changes in many biological conditions and might be not stably expressed under stress conditions [Citation13]. Therefore, GAPDH as an internal standard should be tailored to the nature of the study. In higher plants, the metabolic reactions of GAPDH are presented in [Citation14,Citation15]. GAPDH could be divided into two major categories: phosphorylated and non-phosphorylated. Given the different cellular localizations, phosphorylated GAPDH is divided into three categories: GAPCp, GAPA/B, and GAPC [Citation15,Citation16]. GAPCp is mainly located in plastids and is dependent on NAD+ as a coenzyme. Through two consecutive reactions catalyzed by GAPCp, phosphoglycerate kinase (PGK), 3-phosphoglyceric acid and adenosine triphosphate (ATP) are formed. GAPA/B catalyzes the reverse reaction of 1,3-bisphosphoglyceric acid to glyceraldehyde 3-phosphate in glycolysis and CO2 assimilation in the Calvin cycle. GAPC is distributed in the cytoplasm. Using NAD+(H) as a coenzyme, GAPC catalyzes the reversible reaction of glyceraldehyde-3-phosphate to 1,3-diphosphoglycerate in glycolysis. As reviewed by Zaffagnini et al. [Citation15], GAPC is a multi-functional protein which is the potential target for redox modification. Recent studies indicate that GAPC could perform other functions in plants, which are not related to its catalytic activity. In addition, it has a central role in the abiotic stress response to cold [Citation13], cadmium [Citation17] and salt [Citation14,Citation18], and GAPC was suggested as a moonlighting (multifunctional) protein in plants [Citation15].
Figure 1. Schematic representation of different types of GAPDH in glycolysis and the Calvin cycle in a plant cell. Modified from Yang and Zhai [Citation14] and Zaffagnini [Citation15]. Left: The reaction of glycolysis under abiotic stress conditions with GAPN (non-phosphorylated form) and GAPC. Under oxidative stress conditions, GAPC might undergo glutathionylation. Then, GAPC activity is inhibited and results in down-regulation of the glycolysis pathway. Subsequently, this reaction prompts glucose equivalents to enter the pentose phosphate pathway, leading to the generation of NADPH (red arrow). The thiolate anion (-S-) in GAPC-S- is converted by H2O2 into sulfenic acid (GAPC-SOH). The GAPC-SOH interacts with PLDδ to generate phosphatidic acid (PA) leading to stomatal closure and activation of MAPK cascades [Citation14,Citation15]. Right: The catalytic reaction of GAPA/B and GAPCp in the chloroplast and plastid, respectively. Note: BPGA, 1,3-bisphosphoglycerate; G3P, glyceraldehyde-3-phosphate; DHAP, dihydroxyacetonephosphate; 3PGA, 3-phosphoglycerate; RuBP, ribulose-1,5-bisphosphate; RP, ribulose-5-bisphosphate.
![Figure 1. Schematic representation of different types of GAPDH in glycolysis and the Calvin cycle in a plant cell. Modified from Yang and Zhai [Citation14] and Zaffagnini [Citation15]. Left: The reaction of glycolysis under abiotic stress conditions with GAPN (non-phosphorylated form) and GAPC. Under oxidative stress conditions, GAPC might undergo glutathionylation. Then, GAPC activity is inhibited and results in down-regulation of the glycolysis pathway. Subsequently, this reaction prompts glucose equivalents to enter the pentose phosphate pathway, leading to the generation of NADPH (red arrow). The thiolate anion (-S-) in GAPC-S- is converted by H2O2 into sulfenic acid (GAPC-SOH). The GAPC-SOH interacts with PLDδ to generate phosphatidic acid (PA) leading to stomatal closure and activation of MAPK cascades [Citation14,Citation15]. Right: The catalytic reaction of GAPA/B and GAPCp in the chloroplast and plastid, respectively. Note: BPGA, 1,3-bisphosphoglycerate; G3P, glyceraldehyde-3-phosphate; DHAP, dihydroxyacetonephosphate; 3PGA, 3-phosphoglycerate; RuBP, ribulose-1,5-bisphosphate; RP, ribulose-5-bisphosphate.](/cms/asset/c32b67f3-338c-4248-9161-d1fde4c5ea63/tbeq_a_1719020_f0001_c.jpg)
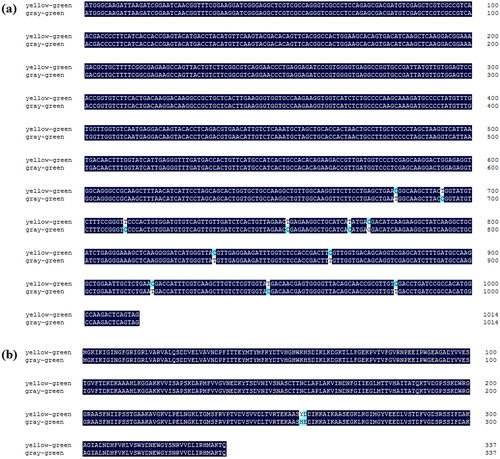
Figure 2. Nucleotide (a) and amino-acid (b) sequence alignments of the two ecotypes of Leymus chinensis. (a) Nucleotide sequence alignment of GAPC cDNA in the two ecotypes; (b) Amino acid sequence alignment of the predicted GAPC proteins in the two ecotypes. The sequences were compared using DNAMAN software. Dark blue color denotes 100% similarity. Light blue color denotes non-identical residues.
In this study, we cloned LcGAPC and analyzed its expression in three growth stages of L. chinensis, as well as under salt and alkali stress. Our results suggest that LcGAPC plays important roles in salt and alkali stress tolerance in L. chinensis.
Materials and methods
Plant material and growth conditions
Leymus chinensis plants were from natural L. chinensis grassland, Yaojingzi in Jilin Province. Gray–green ecotype and yellow–green ecotype plants were transplanted at Harbin Normal University and planted under the same environmental conditions for 6 years with phenotypic stability. The growth characteristics of L. chinensis were divided into three stages: turning green stage, growth stage and heading stage.
RNA extraction and reverse transcription
Total RNA was isolated from the second leaf of two ecotypes L. chinensis using the RNAiso Plus kit (TakaRa, Dalian, China). The samples were treated with recombinant DNase I (TakaRa, Dalian, China) to eliminate genomic DNA. The RNA concentration was determined by Gene Spec V (Hitachi Instruments, Japan). RNA was subsequently reverse transcribed into cDNA using the ReverTra Ace-α- Kit (TOYOBO, Osaka, Japan).
LcGAPC cloning and sequencing
Compared with different plant species in the NCBI (National Center for Biotechnology Inromation) database, LcGAPC F1 and R primers were designed based on conserved sequences (Supplemental Table S1). The PCR program was as follows: 94 °C for 3 min; 30 cycles of 94 °C for 30 s, 55 °C for 30 s, and 72 °C for 30 s; and 72 °C for 10 min (Biometra, Jena, Germany). The reaction products were subjected to electrophoresis in a 1.0% agarose gel stained with ethidium bromide in 1 × TAE (Tris–acetate–ethylenediaminetetraacetic acid) buffer. The PCR product was purified by a Sangon SanPrep gel extraction kit (Sangon Biotech, Shanghai, China), and then cloned into the pMD®18-T vector (TaKaRa, Dalian, China). The plasmids were transformed into Escherichia coli DH5α competent cells for sequencing (Sangon Biotech, Shanghai, China).
To obtain the full-length open reading frames (ORFs) of LcGAPC, we performed 5′ rapid amplification of cDNA ends (RACE) and 3′ RACE using a SMARTer™ RACE amplification kit (Clontech, Mountain View, CA,USA). The forward and reverse primers used for different reactions are shown in Supplemental Table S1 and Figure S1. For 5′ LcGAPC, amplification was performed on cDNA with LcGAPC-5′ GSP, LcGAPC-5′NGSP and universal primers. For 3′ RACE, LcGAPC-3′GSP and LcGAPC-3′NGSP were used as specially designed primers. Full-length LcGAPC cDNA was amplified by the LcGAPC-ORF F and LcGAPC-ORF R primers. The PCR reaction procedure used was similar to partial fragment amplification.
Bioinformatics and phylogenetic analysis
Sequence alignments and the ORFs were assessed using DNAMAN 8.0 (Lynnon Biosoft, Madison, Wisconsin, America). Amino acid sequences of the predicted proteins were assessed using ExPASy (http://web.expasy.org/translate/ ). Homology searches were performed using BLAST algorithms against various GenBank databases (http://www.ncbi.nlm/nih.gov/BLAST). LcGAPC structure and function were analyzed by ROSITE (http://prosite.expasy.org/). The cellular localization of LcGAPC was predicted by WoLF PSORT (http://psort.hgc.jp/). The gene structure of GAPC was analyzed by GSDS (http://gsds.cbi.pku.edu.cn/ ). The amino acid sequences of LcGAPC were used as an input of MEME (http://meme-suite.org/tools/meme). Phylogenetic and molecular evolutionary analysis of similar proteins from different species were conducted using the Neighbor-Joining (NJ) method of MEGA 5.0 software.
Semi-quantitative reverse transcription PCR
Amplification reactions were performed with forward and reverse primers, and the 18SrRNA gene served as an internal control (Supplemental Table S1). Amplified products from 50-μL PCR reaction were mixed with 10 mmol/L polymerase buffer, 2.5 mmol/L deoxynucleoside thriphosphates (dNTPs), 0.1 units rTaq polymerase (TaKaRa, Dalian, China) and 1 μmol/L specific primers. The annealing temperature for each primer and amplified fragment size is presented in Supplemental Table S1. After denaturation (1 min, 94 °C), samples were subjected to 26 cycles of 30 s at 94 °C, 30 s at 55 °C, and 1 min at 72 °C. Amplified products were visualized on 1 × TAE agarose gel containing ethidium bromide. Bands were analyzed using Quantity One 4.6.2 software (Bio-Rad, Hercules, California, America). PASW Statistic 22.0 software was used for data analysis. The results were analyzed with one-way analysis of variance (ANOVA) and t-test. PCR amplification was replicated three times. RT-PCR was used for analysis of the GAPC expression in two eoctypes of L. chinensis at the turning green stage, growth stage, heading stage and at different concentrations of NaCl stress at 24 h, 3 d and 7 d.
Salt and alkali stress treatment
At the growth stage of the two ecotypes of L. chinensis, the plants were divided into gray–green type and yellow–green type. The gray–green and yellow–green type plants were planted in buckets. The plants were cultured with half-strength Hoagland nutrient solution in dark environment. This solution has enough nutritious elements for the plant growth [Citation19]. The roots were just dipped in nutrient solution. After 2 d, plants were placed in an environmentally controlled light growth chamber maintained at a daytime temperature of 25 °C and a nighttime temperature of 20 °C, and the light time was from 4:00 to 16:30. The half-strength Hoagland solution was used until the end of the experiment.
For single salt stress, plants were treated only with 0 mmol/L, 200 mmol/L and 400 mmol/L NaCl for 24 h, 3 d and 7 d, separately. Three replicates were performed for each treatment. These treatments were used for semi-quantitative reverse transcription PCR (RT-PCR) to analyze the expression of LcGAPC. Moreover, based on the characteristics of the salt and alkali soil composition in northern China, we treated the two ecotypes of L. chinensis plants with NaCl/Na2SO4 mixed salt stress and NaHCO3/Na2CO3 mixed alkali stress, respectively. The proportion of NaCl and Na2SO4 in Hoagland solution was set as 9:1 (mol/mol), and the proportion of NaHCO3 and Na2CO3 in Hoagland solution was set as 9:1 (mol/mol) [Citation20]. For short-term mixed salt (NaCl:Na2SO4=9:1) and mixed alkali (NaHCO3:Na2CO3=9:1) stress, treatment groups were adjusted to 200 mmol/L using 1/2 Hoagland and were treated for 0, 4, 24 and 48 h. These treatments were used for real-time quantitative reverse transcription PCR (qRT-PCR) to analyze the expression of LcGAPC.
Real-time quantitative reverse transcription PCR
The relative expression levels of LcGAPC in the two ecotypes under mixed salt and mixed alkali stress conditions (treated for 0, 4, 24 and 48 h) were measured by qRT-PCR. qRT-PCR was performed on each cDNA template using the SYBR Green Master Mix on an ABI 7500 sequence detection system. Lcactin was used as an internal control gene. The LcGAPC qRT-PCR using cDNA employed the qLcGAPC-F and qLcGAPC-R primers (Supplemental Table S1). Relative expression levels were normalized to Lcactin and calculated using the 2−ΔΔCT method [Citation21]. PCR amplification was replicated three times.
Results and discussion
LcGAPC cDNA and deduced amino acid sequence analysis
The 376 bp sequence of LcGAPC was obtained first by PCR, and then the 460 bp 3′RACE product was cloned. According to expressed sequence tags (EST) in NCBI, the LcGAPC-F2 primers were designed to amplify the cDNA fragment, and a 499-bp partial cDNA fragment of LcGAPDH was amplified. The primers were designed to amplify 5′ sequences, and a 766-bp product was obtained (Supplemental Figures S1 and S2). These products were cloned into the pMD18-T® vector and sequenced. Fragment assembly was performed using DNAMAN 8.0 software, and the primers LcGAPC-ORF F and R were designed to amplify the full-length LcGAPC. The complete sequence of the LcGAPC cDNA was 1021-bp (Supplemental Figure S2).
Nucleotide sequence analysis revealed that the cDNA of the two ecotypes contained a 1014-bp ORF. The ORF encoded a polypeptide of 337 amino acids () with a predicted molecular mass of 36.5 kDa and a pI of 6.19. The sequences of the two ecotypes of LcGAPC were submitted to NCBI GenBank (Accession number of yellow–green type: KY454870; Accession number of gray–green type: KY454871). The cDNA sequences between the two ecotypes exhibited 98.92% identity, and 11 different nucleotides were noted in the two ecotypes. Among them, five bases changed from T to C in the two ecotypes (). There were two different amino acids at the 257–258 site (). In the gray–green type, the amino acids at the 257–258 site were Tyr and Asp; however, His and Glu were present in the yellow–green type.
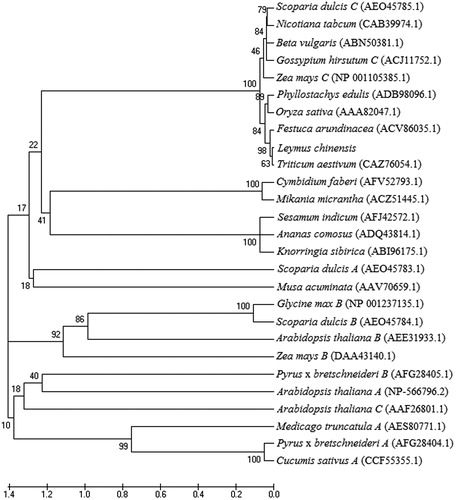
Figure 3. Phylogenetic tree of predicted amino acid sequences of LcGAPC in the two ecotypes. The analysis was performed using the NJ method with 1000 bootstraps in MEGA5 software.
Using the complete nucleotide sequences of LcGAPC, the structural features of the two ecotypes were assessed (Supplemental Figure S3 and S4). The structures of exons and introns were similar to other species of GAPC [Citation16]. LcGAPC contained 11 exons and 10 introns (Supplemental Figure S5). The amino acid structures of LcGAPC in the two ecotypes were fairly conserved, and some identical regions, such as ‘WYDNEWGY’, ‘CTTNCLAP’ and ‘AVNDPF’, were also similar to GAPC protein in other species (Supplemental Figures S5 and S6).
Prediction of the structures and features of the two ecotypes’ LcGAPC proteins
Secondary structural analysis predicted that the putative LcGAPC protein of the yellow–green type was composed of 32.05% alpha helix, 9.5% beta turn, 27.89% extended strand and 30.56% random coil. The LcGAPC in the gray–green type was predicted to contain 32.34% alpha helix, 9.2% beta turn, 28.19% extended strand and 30.27% random coil (Figure S7).
The tertiary structures of LcGAPC in the two ecotypes were predicted using SWISS-MODEL. The results showed that the protein was a homo-tetramer, including three NAD molecules. The subcellular localization analysis predicted that the protein was in the cytosol. The sequence similarities of Oryza Sativa GAPC with L. chinensis yellow–green and gray–green GAPC were 92.88% and 92.28%, respectively. The QMEAN4 scores were 0.14 and 0.13, and the GMQEs were 0.98 and 0.99, respectively. In the predicted 3 D structure, the protein included barrels in a helical complex (Supplemental Figure S8).
In agreement with the current understanding [Citation15], GAPC was a tetramer of four subunits and the monomer structure included a cofactor-binding domain (residues 1 to 153 and 318 to 337) and a catalytic domain (residues 154 to 317) (Supplemental Figure S8). The highly conserved N-terminal segment ‘NGFGRIGR’ (residues 9 to 16) interacted with the pyrophosphate moiety of the coenzyme [Citation15]. The other strictly conserved residue Asp-35 made two hydrogen bonds with two adjacent hydroxyl groups of the ribose molecule and linked to the adenine of NAD+ [Citation15,Citation22]. Asp-191 from the catalytic domain of the adjacent subunit could contribute to the stabilization of the cofactor [Citation15,Citation22]. The structure of the active site of LcGAPC includes Cys-154, which affects the reactivity towards H2O2. The other key residue of the active site is Arg-236, which contributes to glyceraldehyde 3-phosphate binding [Citation23].
In this study, GAPC cDNA was cloned from L. chinensis for the first time. According to the protein subcellular localization prediction and gene and protein structure analysis, the cloned LcGAPC was localized in the cytoplasm (Supplemental Figures S4, S5 and S9). The gene shared a high level of sequence similarity in the coding region, and the protein sequence was also highly conserved in the two ecotypes. S-glutathionylation is a reversible specific modification that allows the formation of a mixed-disulfide bond between the cysteine residue and glutathione. GAPC is sensitive to H2O2, which strongly inhibits the enzyme activity: the GAPC1 catalytic site of Cys-149 in Arabidopsis thaliana (Cys-154 in L. chinensis) is oxidized by H2O2, leading to completely or partially inactivated GAPC [Citation23]. Based on the glutathionylated GAPC, the GAPC activity was inhibited and the glycolysis pathway was consequently down-regulated, which could prompt the glucose equivalents to enter the pentose phosphate pathway, leading to the generation of NADPH. Overall, the redirection of primary metabolism in stressed plant cells by key enzymes could reinforce the antioxidant systems and create conditions for plant recovery [Citation15].
Multiple sequence alignment phylogenetic analysis
The amino acid sequences of the two ecotype proteins were aligned with sequences from other species using DNAMAN 8.0. The NJ phylogenetic tree was constructed by MEGA 5.0 software (). The two ecotypes exhibit evolutionary similarity with other gramineous plants. Homology analysis revealed that the two ecotypes of LcGAPC shared 95.85% and 82.67% sequence similarity with Festuca arundinacea and Zea mays C, respectively. The yellow–green type LcGAPC protein shared 92.88% and 87.24% sequence similarity with homologues in Oryza sativa Indica Group (long-grained rice) and Triticum aestivum (bread wheat), respectively. The gray–green LcGAPC protein shared 92.28% and 86.65% sequence similarity with Oryza sativa Indica Group (long-grained rice) and Triticum aestivum (bread wheat), respectively. These known amino acid sequences used in sequence alignment were obtained from GenBank.
LcGAC expression analysis at turning green stage, growth stage and heading stage
Semi-quantitative RT-PCR analysis revealed that LcGAPC was highly expressed in the growth stage and turning green stage in the yellow–green type and gray–green type, respectively ( and Supplemental Figure S10). Comparative analysis of the expression levels at the same stage in the two ecotypes, the expression of LcGAPC in the gray–green type was significantly increased compared with that in the yellow–green type in the turning green stage; however, the results were reversed in the growth stage. In the heading stage, there was no significant difference between the two ecotypes.
Figure 4. Relative LcGAPC expression in the yellow–green type and gray–green type of Leymus chinensis in different growth stages. The letters represent the significant differences in each ecotype of L. chinensis in different growth stages (p< .05). Asterisks (**) indicate a significant difference in the two ecotypes of L. chinensis at the same growth period (p<.01).
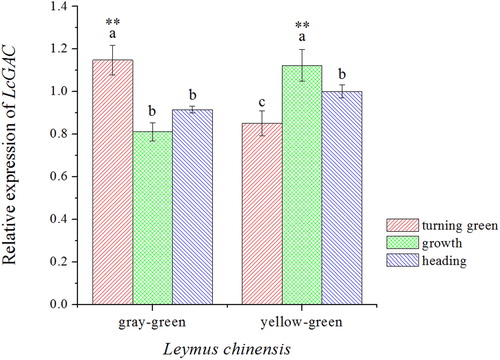
The role of GAPC may be associated with the function of stomata. Plant stomata regulate transpiration and photosynthesis, which plays central roles in plant growth. Previous researches indicated that the photosynthetic rate and transpiration rate exhibit significant differences between the two ecotypes, with higher rates in the gray–green type compared with the yellow–green type [Citation24]. Another study demonstrated that GAPC might cause the plants to have higher stomatal conductance via a more opened stomata to allow more CO2 uptake and increased nutrient transport [Citation7,Citation25]. In the turning green stage, plants were under low light intensity; however, the gray–green type has a lower light compensation point. Therefore, the gray–green type might use weaker light to complete photosynthesis. We speculate that the yellow–green type might have reduced LcGAPC expression to increase stomata conductance and enhance photosynthesis. In the growth stage, light was adequate, and the gray–green type exhibited a high photosynthetic rate [Citation24]. Therefore, expression of the gene might be reduced to avoid stomata closure. However, this speculation needs further experimental investigation.
Phenotype and LcGAC expression analysis under salt and alkali stress
Leymus chinensis was treated with different concentrations of NaCl during the growth stage. The phenotypes of the gray–green and yellow–green type plants under salt stress at different times were analyzed in comparison with a control check (CK) ( and Supplemental Figure S11). The results showed that the plants grew in normal conditions, 200 mmol/L NaCl and 400 mmol/L NaCl at 24 h, 3 d and 7 d. After 7 d of stress, the apex of old gray–green leaves under NaCl stress was brownish and yellow, and the yellow-green type leaves were seriously twisted. However, the CK leaves were still green. Salt toxicity harmed older leaves rather than younger leaves, and the yellow–green type exhibited more serious damage compared with the gray–green type. Furthermore, as the salt stress concentration and time increased, the damage to the plant was more serious.
Figure 5. Phenotypes of Leymus chinensis under different NaCl treatments for 7 d.
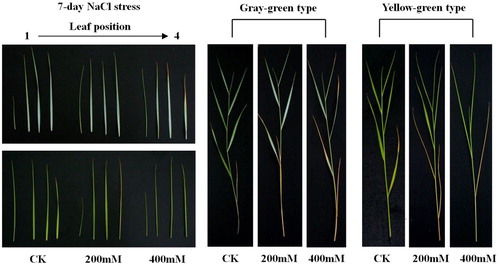
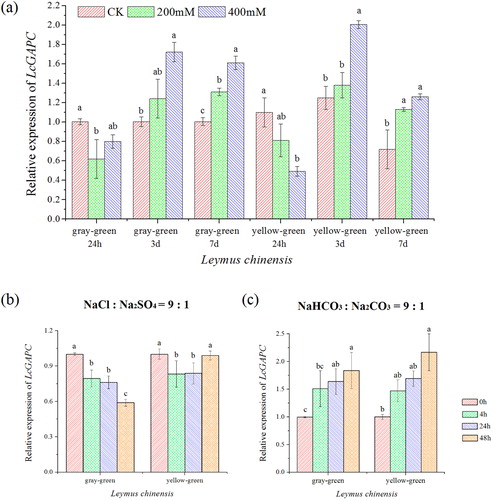
Figure 6. Relative mRNA expression levels of LcGAPC. (a) Expression level of LcGAPC in different concentrations of NaCl at different times; (b) Expression level of LcGAPC compared with different stress times under 200 mmol/L mixed salt stress; (c) Expression level of LcGAPC compared with different stress times under 200 mmol/L mixed alkali stress. The letters represent the significant differences among different salt-stress treatments, p<.05.
Plants might experience abiotic stress of various nature in their life, and salt stress is one example. Leymus chinensis mainly uses strain tolerance to adapt to the harsh conditions [Citation5,Citation6,Citation24]. There are two phases for plants to respond to salinity stress: the osmotic phase and ion-specific phase. Under salt stress, osmotic stress starts immediately. At the beginning of the osmotic stress, cell expansion is rapidly reduced in the root apex and young leaves, leading to stomatal closure. Then, when excessive amounts of salt enter the plant, it may be difficult to take in water. Thus, water stress is caused by continuous transpiration. Finally, the salt levels will increase to toxic levels in the older transpiring leaves, causing premature senescence and reducing the photosynthetic leaf area, which cannot sustain growth or may even die [Citation26]. However, L. chinensis could accumulate a large number of lower molecular weight and water-soluble macromolecules (e.g. proline) or absorb inorganic ions (e.g. Na+) to regulate osmotic adjustment (OA) at the cell level [Citation27,Citation28]. OA ability is related to plant salt and alkali resistance. The OA ability to accumulate OA substances in the gray–green type was increased compared with the yellow–green type [Citation6]. Therefore, the gray–green type exhibits increased salt and alkali tolerance compared with the yellow–green type.
To characterize the LcGAPC expression in response to single NaCl and mixed salt, mixed alkali stress, semi-quantitative RT-PCR ( and Supplemental Figure S12) and real-time RT-PCR () were used in this study, respectively. presents the LcGAPC expression in the two ecotypes under 200 and 400 mmol/L NaCl. After 24 h of stress, the expression was decreased with the increasing NaCl concentration compared with CK. However, LcGAPC expression significantly increased in the two ecotypes as the stress duration increased (p < .05). The maximum relative expression was observed in the yellow–green type following 3 d of NaCl treatment, and the levels of expression were increased compared with other groups. After 7 d of stress, the expression levels of LcGAPC in the gray–green type were significantly increased compared with the yellow–green type. LcGAPC increased with the increasing salt concentration at 3 d and 7 d in both ecotypes compared with CK, however, LcGAPC expression in the yellow–green type after 7 d of stress was reduced compared with the gray–green type at 7 d.
The real-time qRT-PCR experiment was used to evaluate the LcGAPC expression for salt and alkali stress within a short period. The expression of LcGAPC decreased gradually in the plants subjected to 200 mmol/L salt stress as time progressed in the gray–green type (). However, compared with 0 h, the LcGAPC expression in the yellow–green type was reduced at 4 h and 24 h and then increased at 48 h. This phenomenon was similar to the results obtained following 200 mmol/L NaCl stress as analyzed by semi-quantitative RT-PCR. In plants exposed to 200 mmol/L alkali stress, LcGAPC expression was gradually increased, and the maximum value (2.17) appeared in the green–green type ().
Abiotic stresses, including salt stress induce, oxidative stress and result in the formation and accumulation of reactive oxygen species (ROS). Molecular studies indicated that GAPC plays a vital role in this type of stress and the responsive redox signal transduction. GAPC was up-regulated by both osmotic and salt stress [Citation11]. The overexpression of GAPC3 in Oryza sativa affects the expression of a catalase gene OsCatA and then alleviates salt toxicity through the regulation of H2O2 levels [Citation29]. Therefore, ROS damage to cells was avoided under salt stress, and salt tolerance could improve and enhance the response. In northeast China, the alkalization is caused by NaHCO3 and Na2CO3, and soil salinization is attributed to NaCl and Na2SO4. To better understand the function of GAPC in salt stress between two ecotypes of L. chinensis, we analyzed LcGAPC cDNA levels under different treatments using RT-PCR and qRT-PCR. High salt concentrations increase gene expression to a greater extent compared with low salt concentrations. Some studies have demonstrated that concentrations greater than 200 mmol/L are common in tissue; however, the concentration might completely repress the enzyme activity [Citation30]. The glutathionylation of GAPC1 might reduce or avoid this inhibition. In addition, in Arabidopsis thaliana leaves, the GAPC1 catalytic site Cys-149 was oxidized by H2O2, which promotes the physical interaction between GAPC1 and phospholipase D-δ (PLD-δ) (for review see [Citation15]). The activity of PLD-δ increased, producing phosphatidic acid (PA) with phosphatidylethanolamine as a substrate. Synthesis of PA in plants was triggered in response to salinity [Citation14,Citation25]. In addition, several stress-responsive genes, such as DREB2A and Lip9, were up-regulated in OsGAPC3 transgenic plants under salt stress [Citation29]. It was suggested that GAPC was involved in signaling for induction of salt resistance. Under the NaCl and Na2SO4 (mol/mol = 9:1) mixed salt stress, the expression of LcGAPC exhibited a downward trend as the stress time increased in the gray–green type. However, the yellow–green type exhibited a reduction followed by an increase. Given that the salt tolerance in the yellow–green type was reduced compared with the gray–green type, the relative signal induced by LcGAPC might be a response to salt stress that appears earlier.
For short-term mixed alkali stress, the gene expression gradually increased as time increased in the two ecotypes; this result differs from that observed with mixed salt stress. In general, the damage from alkaline salt was severer than neutral salt stress to the plant [Citation28]. Alkali stress could lead to high pH in the plant growth environment and interfere with control of Na+ uptake in roots. When the intracellular Na+ concentration increased to a toxic level, damage occurred in plants. Leymus chinensis root function, chlorophyll content and membrane system could be damaged by alkali stress, thereby reducing its root activity, water content, and photosynthetic rate and increasing the electrolyte leakage rate [Citation31]. Moreover, the physiological characteristics of salt alkali resistance in the gray–green type were greater than those in the yellow–green type [Citation6]. The increased expression of LcGAPC might alter the flux through carbon metabolism and subsequently affect plant resistance to alkali stress. In this study, we hypothesized that LcGAPC may play important regulatory roles in salt and alkali stress tolerance. However, the mechanism of LcGAPC’s response to different stresses in the two ecotypes should be studied further.
Conclusions
In our research, we cloned and analyzed the cDNA of GAPC in two ecotypes of L. chinensis. LcGAPC was 1014 bp in length and encoded 337 amino acids. The predicted protein structures of the two ecotypes were slightly different. LcGAPC expression levels were up-regulated in alkali stress and down-regulated in salt stress upon short-term exposure. The LcGAPC gene exhibited high expression in the two ecotypes of L. chinensis under long-term and high-concentration NaCl stress. These results indicate that the stress led to increased GAPC activity, suggesting that the rate of carbon metabolism might switch when coping with environmental stress situations. However, whether the signals used to enhance the transcription of GAPC were utilized for salt and alkali stressors remains to be clarified.
Supplemental Material
Download PDF (1.3 MB)Disclosure statement
No potential conflict of interest was reported by the authors.
Additional information
Funding
Related Research Data
References
- Ahmadi J, Pour-Aboughadareh A, Fabriki-Ourang S, et al. Screening wild progenitors of wheat for salinity stress at early stages of plant growth: insight into potential sources of variability for salinity adaptation in wheat. Crop Pasture Sci. 2018;69(7):649–658.
- Li YF, Li QY, Guo DY, et al. Ecological stoichiometry homeostasis of Leymus chinensis in degraded grassland in western Jilin Province, NE China. Ecol Eng. 2016;90:387–391.
- Yuan S, Ma LN, Guo CY, et al. What drives phenotypic divergence in Leymus chinensis (Poaceae) on large-scale gradient, climate or genetic differentiation? Sci Rep. 2016;6(1):26288.
- Liu YJ, Zhang LR, Xu XL, et al. Effects of sampling method on foliar δ13C of Leymus chinensis at different scales. Ecol Evol. 2015;5(5):1068–1075.
- Zhou C, Yang YF, Li JD. Physiological response of two divergent Leymus chinensis types to drought stress in the Songnen plain. Ying Yong Sheng Tai Xue Bao. 2002;13(9):1109–1112.
- Zhou C, Yang YF. Physiological response to salt-alkali stress in experimental populations in two ecotypes of Leymus chinensis in the Songnen Plains of China. Chin J Appl Ecol. 2003;14(11):1842–1846.
- Zhou C, Yang YF, Wang K, et al. Effect of red and blue spectrum on photosynthesis physiological characteristics of two ecotypes of Leymus Chinensis. Spectrosc Spect Anal. 2008;28(7):1441–1444.
- Yang AJ, Anjum SA, Wang L, et al. Effect of foliar application of brassinolide on photosynthesis and chlorophyll fluorescence traits of Leymus chinensis under varying levels of shade. 2018;56(3):873–883.
- Chen L, Wang RZ. Anatomical and physiological divergences and compensatory effects in two Leymus chinensis (Poaceae) ecotypes in Northeast China. Agr Ecosyst Environ. 2009;134(1–2):46–52.
- Khanna MS, Taxak CP, Jain KP, et al. Glycolytic enzyme activities and gene expression in Cicer arietinum exposed to water-deficit stress. Appl Biochem Biotechnol. 2014;173(8):2241–2253.
- Dumont S, Rivoal J. Consequences of oxidative stress on plant glycolytic and respiratory metabolism. Front Plant Sci. 2019;10:166.
- Suarez S, McCollum GW, Jayagopal A, et al. High glucose-induced retinal pericyte apoptosis depends on association of GAPDH and Siah1. J Biol Chem. 2015;290(47):28311–28320.
- Li XX, Wei WJ, Li FF, et al. The plastidial glyceraldehyde-3-phosphate dehydrogenase is critical for abiotic stress response in wheat. Int J Mol Sci. 2019;20(5):1104–1122.
- Yang SS, Zhai QH. Cytosolic GAPDH: a key mediator in redox signal transduction in plants. Biol Plant. 2017;61(3):417–426.
- Zaffagnini M, Fermani S, Costa A, et al. Plant cytoplasmic GAPDH: redox post-translational modifications and moonlighting properties. Front Plant Sci. 2013; 450:1–18.
- Zeng LF, Deng R, Guo ZP, et al. Genome-wide identification and characterization of Glyceraldehyde-3-phosphate dehydrogenase genes family in wheat (Triticum aestivum). BMC Genom. 2016;17(1):240.
- Roth U, von Roepenack-Lahaye E, Clemens S. Proteome changes in Arabidopsis thaliana roots upon exposure to Cd2+. J Exp Bot. 2006;57(15):4003–4013.
- Yao HY, Xue HW. Phosphatidic acid plays key roles regulating plant development and stress responses. J Integr Plant Biol. 2018;60(9):851–863.
- Hoagland DR, Arnon DI. The water-culture method for growing plants without soil. Calif Agricult Exp Stat Circular. 1950;347:1–32.
- Wang H, Wu Z, Chen Y, et al. Effects of salt and alkali stresses on growth and ion balance in rice (Oryza sativa L.). Plant Soil Environ. 2011;6:286–294.
- Luo M, Gao Z, Li H, et al. Selection of reference genes for miRNA qRT-PCR under abiotic stress in grapevine. Sci Rep. 2018;8(1):4444.
- Tien YC, Chuankhayan P, Huang YC, et al. Crystal structures of rice (Oryza sativa) glyceraldehyde-3-phosphate dehydrogenase complexes with NAD and sulfate suggest involvement of Phe37 in NAD binding for catalysis. Plant Mol Biol. 2012;80(4–5):389–403.
- Rena L, Yong S. An old method facing a new challenge: re-visiting housekeeping proteins as internal reference control for neuroscience research. Life Sci. 2013;92(13):747–751.
- Zhou C, Zhang Z, Wang ZW, et al. Difference in capacity of physiological integration between two ecotypes of Leymus chinensis underlies their different performance. Plant Soil. 2014;383(1–2):191–202.
- Guo L, Devaiah SP, Narasimhan R, et al. Cytosolic glyceraldehyde-3-phosphate dehydrogenases interact with phospholipase Dδ to transduce hydrogen peroxide signals in the Arabidopsis response to stress. Plant Cell. 2012;24(5):2200–2212.
- Munns R, Tester M. Mechanisms of salinity tolerance. Annu Rev Plant Biol. 2008;59(1):651–681.
- Li JX, Peng XY, Hua XY, et al. Effects of arbuscular mycorrhizal fungi on Leymus chinensis seedlings under salt–alkali stress and nitrogen deposition conditions: from osmotic adjustment and ion balance. RSC Adv. 2018;8:14500–14509.
- Lin JX, Wang YN, Sun SN, et al. Effects of arbuscular mycorrhizal fungi on the growth, photosynthesis and photosynthetic pigments of Leymus chinensis seedlings under salt-alkali stress and nitrogen deposition. Sci Total Environ. 2017;576(15):234–241.
- Zhang XH, Rao XL, Shi HT, et al. Overexpression of a cytosolic glyceraldehyde-3-phosphate dehydrogenase gene OsGAPC3 confers salt tolerance in rice. Plant Cell Tiss Organ Cult. 2011;107(1):1–11.
- Liang WJ, Ma XL, Wan P, et al. Plant salt-tolerance mechanism: a review. Biochem Bioph Res Co. 2018;495(1):286–291.
- Wang LX, Fang C, Wang K. Physiological responses of Leymus chinensis to long-term salt, alkali and mixed salt-alkali stresses. J Plant Nutr. 2015;38(4):526–540.