
Abstract
Selection for new single-flowered amaryllis with cultivated wild species or hybrids has continued for more than 200 years. However, our basic knowledge of the extent of genetic variation within the single-flowered amaryllis is still not sufficient, which is very important for the ongoing improvement of the double-flower type in China. In this study, a total of 23 screened sequence-related amplified polymorphism (SRAP) markers were used to assess the genetic diversity and population structure of 82 cultivated accessions. It produced 244 clearly amplified fragments, of which 242 (99.2%) were polymorphic. A higher level of genetic diversity was observed, with estimates of Nei’s diversity index (H) and the Shannon information index (I) of 0.344 and 0.513, respectively. Genetic distance- and structure-based analyses mainly clustered all accessions into two or five subgroups, indicating the complexity of the hybrid pedigree of single-flowered amaryllis. To effectively explore and preserve the novel variation in these 82 genetic resources, we further established an initial core collection with 15 accessions with the goal of maximizing the SRAP alleles. This preliminary core set retained 100% of the SRAP variation with greater genetic diversity and heterogeneity (H = 0.355, and I = 0.529). Our research provided insight into the genetic structure of modern hybrids of single-flowered amaryllis, from which an easily manageable amaryllis core collection was identified, facilitating future breeding progress for double-flowered amaryllis.
Introduction
Hippeastrum spp., also referred to as amaryllis, is a well-known flowering bulb plant around the world. It originated in tropical and subtropical regions, and was estimated to be comprised of 50–60 species (2n = 2x = 22) that were entirely from the New World [Citation1]. The first successful interspecies hybrid between H. reginae and H. vittatum was reported as early as 1799. Since then, many Hippeastrum species have been crossed by commercial florists and amateur gardeners. To date, there are more than a thousand modern commercial garden hybrids (also known as Hippeastrum hybridum) on the market. Amaryllis nowadays has attracted professional and amateur breeders in China, because it is easy to cultivate, and growers can easily get returns through hybridization. The Chinese market is increasingly interested in double-flower varieties. Additional tepal-like structures in double-flowered amaryllis apparently result from transformations of both male and female reproductive structures [Citation2]. Thereafter, double-flowered amaryllis may not have any functional reproductive organs or may produce some pollen-containing anthers at the ends of some transformed, petal-like stamens, while the ovary is extremely reduced with little or no stigmatic tissue [Citation2, Citation3]. These greatly limit the potential for cross-breeding using double-flowered varieties.
Since there are very few wild-type Hippeastrum species in China, single-flowered commercial varieties have been crossed with double-flowered hybrids in hopes of obtaining double-flowered progeny. According to the American Amaryllis Society, the flower type of modern commercial hybrids can be classified into many divisions [Citation4]. The most familiar divisions are the belladonna, regina and leopoldii types, while small-flowered miniatures, trumpet-flowered, orchid-flowered and double-flowered varieties are less commonly grown [Citation4]. According to the standard of single or double petals, most current amaryllis hybrids belong to the single-flowered type. The main centers of amaryllis breeding are the Netherlands and South Africa. They have bred and produced various single-flowered amaryllis hybrids that are in the world market. Thereafter, a large number of single-flowered germplasm resources have been introduced from the Netherlands and South Africa to improve Chinese amaryllis. However, as previously concluded by Meerow [Citation5], commercial breeding efforts have largely been concentrated among the hybrids themselves, leading to a great complexity of parentage, much of it without documentation, and diffusion of many of the unique characteristics of the original component species. These voluntary or involuntary restrictions on commercial amaryllis breeding have resulted in similarities among many modern hybrids and increased breeding times and costs [Citation5]. The current situation can only be changed when we know the genetic variation and relatedness of single-flowered parental hybrids, and then new double-flowered varieties will be effectively developed through systematic and organized hybridization programs.
Molecular markers are very powerful tools for accelerating ornamental flower breeding [Citation6]. In the case of amaryllis, random amplified polymorphic DNA (RAPD), inter-simple sequence repeats (ISSRs) and simple sequence repeats (SSRs) have been successfully applied to construct DNA fingerprints and assess genetic diversity [Citation7–10]. Similar to the use of RAPD, ISSRs and SSRs, the use of sequence-related amplified polymorphisms (SRAPs) is also a developed polymerase chain reaction (PCR)-based molecular marker technique. Compared with other marker techniques, it has the advantages of simple and quick operation, abundant polymorphisms, reliable repeatability, no need for genome sequence data and low cost [Citation11], which make it an ideal and efficient marker for determining genetic diversity, hybrid identification, population genetic analysis, marker-assisted selection, etc. [Citation12]. Therefore, we used SRAP markers in this study to evaluate the genetic variation among 82-single-flowered amaryllis. Additionally, we further reduced the number of selected accessions available for conservation and identified and constructed a preliminary core collection, which is a key element in the development of conservation or evaluation projects [Citation8, Citation13]. The availability of this core collection can speed up our searches for alleles or beneficial adaptations, as well as avoid the genetic similarities between hybrid pedigrees in future genetic improvement programs, especially for double-flowered amaryllis.
Materials and methods
Plant materials
A total of 82 amaryllis accessions with a single flower type (Supporting Information ) were applied for genetic evaluation in the present research. Most of them originated in the Netherlands (65), while others came from South Africa (11), Japan (2), Chile (2) and China (2). Their flowers are complex in color, and most of them have multiple colors, including red/white, pink/white and pink/red. All accessions were planted in an experimental greenhouse at the Beijing Academy of Agriculture and Forestry Sciences, Beijing, China. They were cultivated in fertile soil under ambient conditions (10–35 °C) from March to November 2015.
Table 1. Characteristic of SRAP primers polymorphism in 82-single-flowered amaryllis.
DNA isolation and SRAP-PCR
Fresh young leaves were collected in the spring and immediately frozen in liquid nitrogen and stored at −80 °C until DNA isolation. The total genomic DNA was extracted using a modified CTAB procedure as described by Wang et al. [Citation10]. The final DNA concentration was adjusted to optimum using an Epoch microplate spectrophotometer (BioTek, Winooski, VT, USA).
To assess the diversity and analyze the population structure of the single-flowered amaryllis accessions, the SRAP technique [Citation11] was employed with 500 combinations of two primers, including 20 forward primers and 25 reverse primers (Supporting Information ). A total of 23 primers were selected for this study (). PCRs (20 μL volume) were conducted using a GeneAmp PCR System 9700 with each reaction containing 2 μL of 1× buffer, 1.25 mmol/L MgCl2, 0.26 mmol/L dNTPs, 1 U Taq DNA polymerase, 0.2 μmol/L primer and 50 ng DNA template. PCRs were conducted according to the following cycling program: an initial denaturation step of 94 °C for 4 min, 35 cycles of 94 °C for 1 min, 50 °C for 1 min and 72 °C for 10 s, with a final elongation step of 72 °C for 7 min. The PCR amplifications were repeated twice for each primer combination to ensure reproducibility. All PCR products were subjected to electrophoresis on an 8.0% nondenaturing polyacrylamide gel (PAGE) with a Tris/Borate/EDTA (TBE) buffer running at 120 V for one and a half hours. Then, the gels were silver stained as described by our team in previous publications [Citation11, Citation14, Citation15]. The SRAP markers amplified at sizes between 100 bp and 400 bp were converted into ‘0’ and ‘1’ codes denoting ‘absence’ and ‘presence’, respectively. We assume that each amplified SRAP DNA fragment is an independent genetic locus before further data analysis.
Table 2. Genetic diversity in the inferred populations of 82-single-flowered amaryllis.
Data analysis
POPGENE 3.2 [Citation16] was used to analyze the number of loci (N), the number of polymorphic loci (Np), Nei's genetic diversity (H) and Shannon's information index (I) for each marker, accession and categories (origins; K = 2 and 5 based on STRUCTURE results). A neighbor-joining (NJ) dendrogram was constructed to examine the genetic relationship among all accessions using the software packages PowerMarker version 3.25 [Citation17] and MEGA 4 [Citation18]. The population structure was analyzed to determine the group and individual distribution by Structure 2.3 [Citation19]. The K, number of assumed subpopulations, was run from 1 to 15. Ten independent runs were performed, each involving a burn-in period of 200,000 iterations, followed by 200,000 subsequent iterations. The best value of K was calculated, and the mean likelihood value, L(K), across all runs was estimated for each K-value. ΔK was used as our model choice criterion to indicate a clear peak for the most likely K-value, which was calculated using the formula ΔK = m(|L(K)|)/s[L(K)] following Evanno et al. [Citation20]. Analysis of molecular variance (AMOVA) implemented in GenAlex 6.5 [Citation21] was performed to assess population differentiation among different subgroups, with 1000 permutations to test the variance components. Pairwise FST between accessions in the different countries or categories were also calculated using GenAlEx 6.5.
Establishment of the core collection
Sampling of genotypes for the core collection was carried out using PowerCore software, as proposed by Kim et al. [Citation22]. To maximize the number of alleles at the SRAP loci, we implemented an advanced maximization strategy (M) through a modified heuristic algorithm, with a random strategy (R) as a comparison. The total number of alleles retained and the H and I variability parameters were calculated for these two sample sizes (M15 and R27) using POPGENE 3.2 [Citation16]. T-tests (p < .05) were used to detect differences between the sampled cores and whole germplasm collections in each genetic index. In general, principal coordinate analysis (PCoA) is used to display genetic divergence between the core collection and original germplasm. However, in the present study, the relationships between 15 core germplasms and 82 entire germplasms were analyzed by nonmetric multidimensional scaling (NMDS). NMDS is a powerful ordination technique that differs from nearly all other ordination methods. It can define the original data point positions in a small number of axes that are explicitly chosen. All SRAP datasets were imported into the Past 3.0 software package [Citation23], and a similarity matrix was first calculated using the Bray–Curtis coefficient. Then, the goodness-of-fit or stress was calculated using Kruskal’s stress formula. The stress value reflects how well the ordination summarizes the observed distances among the samples [Citation23]. In addition, significant differences (p < .05) between the core and original collections were assessed with analysis of similarity (ANOSIM). ANOSIM can provide a way to statistically test whether there is a significant difference between two or more groups of sampling units based on a dissimilarity matrix rather than raw data [Citation24].
Results and discussion
SRAP polymorphism in 82-single-flowered amaryllis
The genetic diversity of plant resources enables breeders to develop improved new varieties that meet various agricultural production needs. However, to date, little is known about the genetic diversity of modern commercial amaryllis hybrids. Genomic analysis tools, such as molecular markers, have greatly expanded our ability to monitor the molecular diversity of crops and their wild relatives. The SRAP marker is a simple and efficient PCR-based technique that has proven more informative for detecting genetic diversity than other DNA molecular marker systems [Citation25]. It aims to amplify the open reading frame (ORF) in the genome, which can provide a sufficiently useful genetic dataset for plants [Citation11]. Therefore, a total of 23 SRAP marker combinations that yielded a clear, high-stability polymorphic banding pattern were used here to genotype all 82-single-flowered amaryllis.
As shown in , these SRAP primer combinations revealed 244 amplified fragments, of which 242 (99.5%) were polymorphic across all accessions. The number of polymorphic bands by primer combination ranged from 2 (Me25/Em18) to 28 (Me3/Em11), with an average of 10.5 bands. Except for Me03/Em11 and Me06/Em07, all primer combinations showed 100% polymorphism across the accessions. In previous studies, RAPD, ISSRs and SSRs have been used to analyze the genetic variation in 25, 62 and 104 amaryllis hybrids [Citation7–10]. However, the percentage of polymorphic fragments found in the RAPD (72.6%), ISSRs (92.4%) and SSRs (93.9%) was lower than that in the SRAPs (99.5%) in our study. Although, the level of polymorphism is usually related to the number of germplasms and their geographical origins, this study still shows that the 82-single-flowered amaryllis we collected had high genetic diversity. This was also supported by other genetic parameters, H and I, which are used to describe the abundance and uniformity of plant resources. The lowest H (0.228) and I (0.361) values were found with the primer combination Me21/Em14, while the highest H (0.447) and I (0.638) were found with Me04/Em05. The average values of H and I for all SRAP primer combinations were 0.344 and 0.513, respectively. In the SSR study with more germplasm, the average H and I values in 104 cultivated amaryllis were 0.264 and 0.407, respectively [Citation10]. Overall, these results confirmed that SRAP markers can be powerful and effective tools for clarifying genetic diversity in cultivated amaryllis.
Genetic relatedness and population structure among 82-single-flowered amaryllis
As aforementioned, the SRAP analysis revealed extensive genetic variation among the single-flowered amaryllis. Based on those SRAP datasets, the similarity coefficient was further calculated to construct a neighbor-joining (NJ) tree using the software MEGA. The clustered NJ dendrogram () shows that the amaryllis were mainly divided into two groups, Group 1 (2 accessions) and Group 2 (80 accessions). Some cultivars and hybrids could be clustered closely together according to their geographic origins. Group 1 contained two accessions from the Netherlands. Group 2 was further separated into two subclusters: subgroup 1 (G2-1), which mainly contained 54 accessions, with 40 from the Netherlands, 8 from South Africa, 2 from Chile, 2 from China and 2 from Japan; and subgroup 2 (G2-2), which contained 27 accessions, with 24 from the Netherlands and 3 from South Africa. It also indicated that the color of flowers could be used as a criterion for dividing the genetic relatedness between accessions to a certain extent. For example, the flower color of ‘La Paz’ and ‘Papillo’ in Group 1 was red/green. Except for a few varieties, such as ‘Lemon sorbet’ (green), ‘Exotica star’ (red/green) and ‘Nagano’ (orange/white), the flower colors of most accessions in the G2-1 subgroup were red, pink or mixtures of red or pink and white. For the germplasm of the G2-2 subgroup, more than half of the flower colors were red or pink or a mixture of purple and white, while the rest were mostly green or mixtures of white or red and green.
Figure 1. NJ phylogenetic tree aligned with a structural analysis of 82-single-flowered amaryllis accessions from the Netherlands, South Africa and three other countries. (a) NJ tree based on 23 SRAP primer-derived Nei’s distances derived using Mega software; (b) Genetic clustering based on 23 SRAP primer-derived multilocus analyses derived using STRUCTURE software. The two best models (K = 2 and K = 5) are based on Evanno’s delta. Each individual accession is represented by a horizontal line divided into K colored bars.
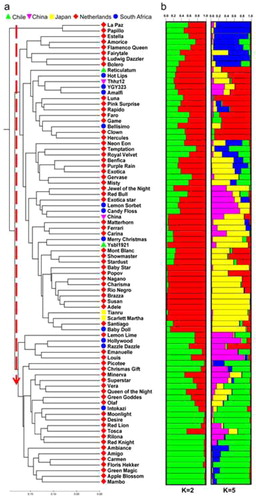
The population structure of the 82-single-flowered amaryllis accessions was also analyzed by a Bayesian-based approach. Admixture model-based simulations were carried out by varying K from 1 to 15 with 10 interactions. The results (Supporting Information , and ) show that the highest ΔK values were observed when K = 2 (ΔK = 26.42) and K = 5 (ΔK = 9.05), which suggested that the most appropriate number of subgroups were two and five in our collected single-flowered amaryllis. According to the membership coefficient (Q), the accessions with the probability of >60% were assigned to corresponding subgroups, while others were categorized as mixed subpopulations. A total of 64 and 52 accessions respectively were attributed to the subpopulations K = 2 and K = 5. It could be observed that mixed population ancestry existed in each subpopulation. Combined with the results of genetic clustering and structural analysis, we point out the complexity of the origin of our collected single-flowered amaryllis. In fact, this finding is not surprising, because in the past 200 years, private breeders and nursery companies have produced many commercial varieties through interspecific/intraspecific hybridization. Numerous parental sources and long-term continuous hybridization are the main reasons for the high diversity of single-flowered amaryllis and the complicated population structure. In addition, the introduction of wild or artificial tetraploid Hippeastrum species or hybrids into commercial breeding has also increased the genomic heterogeneity of single-flowered amaryllis. Previous reports have asserted that virtually all complex hybrid materials presently in cultivation are tetraploid [Citation2, Citation22, Citation26–28].
Table 3. Core accessions of the single-flowered amaryllis selected by random (R27) and heuristic algorithm-based M (M15) sampling strategy.
Genetic diversity comparison among countries and inferred groups of 82-single-flowered amaryllis
The Netherlands is considered the principal center of modern amaryllis hybrid production and breeding. It has cultivated many single-flowered strains, such as large-flowered Ludwig, dwarf and floriferous Gracilis strains. These strains have rapidly become the dominant genotypes among Dutch amaryllis [Citation1]. It is easy to collect more Dutch amaryllis. The number of amaryllis from the Netherlands accounts for two-thirds of the total accessions we collected, reaching 65. However, for South Africa, another important breeding center and exporter of amaryllis, we only collected 11 accessions. South Africa is well known for its Hadeco amaryllis strain, which dominates the Christmas market [Citation1, Citation29]. In addition, a total of six accessions were also collected from China, Japan and Chile. Metrics including the allele number and diversity index were calculated for the genetic diversity of each country. As shows, the Netherlands’s indicators had the highest values (Nd = 65, Np = 239, Na = 1.98, Ne = 1.60, H = 0.345 and I = 0.513), followed by South Africa and others (Nd = 11, Np = 199, Na = 1.98, Ne = 1.49, H = 0.289 and I = 0.433; Nd = 6, Np = 157, Na = 1.64, Ne = 1.44, H = 0.253 and I = 0.372). Obviously, the diversity differences between countries were mainly due to different sample sizes. However, it was not expected that most genetic variation revealed by AMOVA (Supporting Information Table S4) was maintained within countries, with weak but significant genetic differentiation detected among the Netherlands, South Africa and other countries (Fst = 0.04, p < .001).
Compared with the country groups, the relative difference in sample size in the model-based groups was low. The numbers inferred for two groups were 37 and 16, while the numbers for five groups were 16, 7, 15, 8 and 6. Of these groups, G2-1 (Nd = 27, Na = 1.91, Ne = 1.55, H = 0.319 and I = 0.475), G5-3 (Nd = 15, Na = 1.82, Ne = 1.47, H = 0.279 and I = 0.420) and G5-2 (Nd = 7, Na = 1.64, Ne = 1.42, H = 0.243 and I = 0.360) had a higher level of allelic richness and genetic diversity values despite having fewer accessions. We believe that several accessions in the same group (G2-1 and G5-2) may have had very close genetic relationships and could not be well distinguished by SRAP markers. The AMOVA analysis showed that the genetic differentiation within the inferred two and five subpopulations was also significant, with Fst values of 0.19 and 0.28, respectively. Overall, the above results indicate that in order to to choose elite accessions as the parent material for double-flower amaryllis improvement, it is better to pay more attention to the pedigree rather than the origin of the single-flowered hybrid.
Development of a preliminary core collection in 82-single-flowered amaryllis
For the utilization of single-flowered amaryllis plant materials, it is necessary to develop a core germplasm that captures as much genetic variation as possible and minimizes redundancy [Citation30]. The software PowerCore [Citation22] can select entries of core sets by the advanced M (maximization) strategy implemented through a modified heuristic algorithm. The selected core accession had the highest diversity, representing the entire coverage of the variables, and the list of entries can be 100% reproduced. Here, we used SRAP data and PowerCore to extract a preliminary core collection (), which consisted of 15 samples (M15) from 82-single-flowered amaryllis. Meanwhile, a random sampling strategy was also used to identify another set of 27 samples (R27, ) for comparison. The core germplasm constructed with the two strategies had a 100% allele retention ratio (data not shown). As shows, both M15 and R27 retained all alleles of the original germplasm and showed no significant difference from the original germplasm (whole82) for Na and Ne (). Meanwhile, the H and I values of M15 and R27 were higher than those of the whole82, indicating that two representative germplasms were highly polymorphic. The t-test also showed that M15 preserved most of the genetic diversity of the whole82 (p < .05). In addition, M15 (H = 0.355, I = 0.529) had higher heterozygosity and genetic diversity than R27 (H = 0.346, I = 0.518).
Figure 2. Comparison of descriptive statistics (Na: observed number of alleles; Ne: effective number of alleles; H: Nei’s genetic diversity; I: Shannon’s information index) of the accessions in the entire (whole82), random (R27) and M (M15) of the 82-single-flowered amaryllis (a); * indicates p < .05. Nonmetric multidimensional scaling (NMDS) based on Bray–Curtis similarities (b); and analysis of similarity (ANOSIM) based on the significance test (c) in 15 core and 82 entire collections at all SRAP loci profiles.
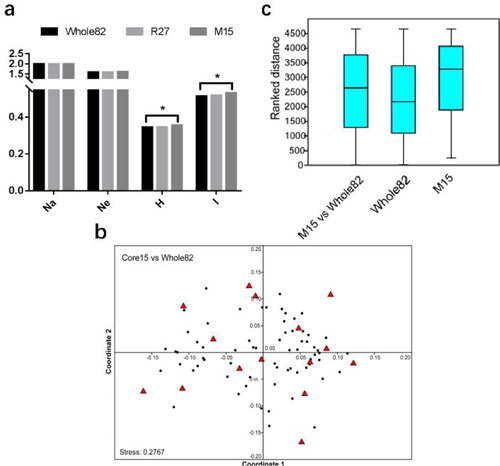
NMDS analysis was further used to compare the overall similarities and differences in the 15 core and 82 amaryllis entire collection based on the SRAP loci profiles (). Obviously, there was no distinct separation of the two collections in the NMDS ordination. Nonetheless, the distances between points in this two-dimensional picture were still at a fairly acceptable stress value (0.2767). At a minimum, this NMDS ordination plot provided more evidence on the relationship of different individuals. As shown in , the selected core samples were uniformly distributed in a scattered pattern across the main NMDS plot, ensuring a representative core set in 82-single-flowered amaryllis. Significant differences detected by ANOSIM also showed that there was no discrimination () between the 15 core and 82 entire collections. The ANOSIM statistic R for the two collections was 0.109 with p < .04. The test statistic R was constrained between the values −1 to 1, where positive numbers suggested more similarity within sites and values close to zero represented no difference between sites and within site similarities [Citation24]. Therefore, all results indicated that constituting the 15 core germplasm subset from 82-single-flowered amaryllis was an appropriate core collection based on the SRAP loci data.
The constitution of the M15 core collection included 11 accessions from the Netherlands, one from South Africa, one from China, one from Chile and one from Japan. The flower color of these core accessions ranged from solid to bicolor. The solid-colored accessions consist of Game (pink), Amigo (red), Lemon Lime (lemon), Intokazi (white) and Matterhorn (white). The bicolored accessions included Reticulatum, Thhz12, Tianru, La Paz, Minerva, Faro, Carmen, Fairytale, Green Goddess and Baby Star, most of which are red or pink/white, followed by red or white/green and other colors. The proposed core has a relatively balanced representation of both country origins and flower color. It represents 18.3% of the 82 original germplasm panels but has a 100% allelic loci retention ratio. This is a relatively higher percentage than the core sizes of the cultivated crops, which are usually in the range of 10% [Citation31]. This can be explained by the complex source of the genetic background and continuous cross breeding, which give modern single-flowered amaryllis greater allelic richness, resulting in a larger core size while ensuring 100% allele coverage. Moreover, our developed core exhibited improved genetic diversity in terms of H (0.355) and I (0.529) compared to the original collection, which had an H of 0.344 and I of 0.513. This suggests that the core set identified in the present study possesses greater diversity and can also be managed more efficiently by amaryllis breeders with respect to time and cost. However, we should keep in mind that a core is a dynamic concept whose constitution changes continuously with greater germplasm explorations, coupled with genotypic and phenotypic assays [Citation32]. Since all 82-single-flowered accessions collected here only represented a part of amaryllis germplasm marketed in the world, further exploration and introduction of greater germplasm in the future may add more new variants to novel varieties, including those with double flowers.
Conclusions
This study used SRAP markers to characterize the genetic variation of 82-single-flowered amaryllises. The results showed that the accessions collected here had relatively higher genetic diversity (Na = 1.99, Ne = 1.59, H = 0.344 and I = 0.513) and complex population structure (K = 2 or K = 5). In addition, a preliminary core collection consisting of 15 samples was further identified based on the SRAP allele maximization strategy. To our knowledge, this is the first report of a core collection developed for amaryllises and will be a working collection facilitating the improvement of flower traits, such as the double-flower type, in this ornamental plant.
Supplemental Material
Download PDF (196.7 KB)Disclosure statement
No potential conflict of interest was reported by the authors.
Additional information
Funding
References
- Meerow AW. Tilting at windmills: 20 years of Hippeastrum breeding. Israel J Plant Sci. 2009;57(4):303–313.
- Liu M, Yeh D. ‘T.S.S. No.1-Pink Pearl’: a double-flowered and fragrant amaryllis cultivar. HortScience. 2015;50(10):1588–1590.
- Meerow AW. Breeding amaryllis. In: Callaway DJ, Callaway MB, editors. Breeding ornamental plants. Portland (OR): Timber Press; 2000. p. 174–195.
- Everett TH. The New York botanical garden illustrated encyclopedia of horticulture. New York (NY): Garland Publishing; 1980.
- Meerow AW. ‘Rio’PPAF, ‘Sampa’PPAF, and ‘Bahia’PPAF, three new triploid amaryllis cultivars. HortScience. 2000;35(1):147–149.
- Nadeem MA, Nawaz MA, Shahid MQ, et al. DNA molecular markers in plant breeding: current status and recent advancements in genomic selection and genome editing. Biotechnol Biotechnol Equip. 2018; 32(2):261–285.
- Phuong PTM, Isshiki S, Miyajima I. Genetic variation of Hippeastrum accessions in Vietnam. J Fac Agr Kyushu U. 2014;59(2):235–241.
- Chakrabarty D, Gupta VN, Datta SK. Varietal identification and assessment of genetic relationships in Hippeastrum using RAPD markers. Plant Biotechnol Rep. 2007;1(4):211–217.
- Zhang L, Xu YC, Cheng HZ, et al. Genetic relationship analysis and fingerprint construction of 62 cultivars of Hippeastrum spp. based on ISSR marker. J Plant Resour Environ. 2012;21(4):48–54.
- Wang Y, Chen DF, He XF, et al. Revealing the complex genetic structure of cultivated amaryllis (Hippeastrum hybridum) using transcriptome-derived microsatellite markers. Sci Rep. 2018;8(1):10645.
- Li G, Quiros CF. Sequence-related amplified polymorphism (SRAP), a new marker system based on a simple PCR reaction: its application to mapping and gene tagging in Brassica. Theor Appl Genet. 2001;103(2/3):455–461.
- Zagorcheva T, Stanev S, Rusanov K, et al. SRAP markers for genetic diversity assessment of lavender (Lavandula angustifolia mill.) varieties and breeding lines. Biotechnol Biotechnol Equip. 2020;34(1):303–308.
- Engelmann F, Dulloo ME, Astorga C, et al., editors. Complementary strategies for ex situ conservation of coffee (Coffea arabica L.) genetic resources. A case study in CATIE, Costa Rica. Topical reviews in agricultural biodiversity. Rome, Italy: Diversity International; 2007. p. 63.
- Wei ZZ, Sun ZZ, Cui BB, et al. Transcriptome analysis of colored calla lily (Zantedeschia rehmannii Engl.) by Illumina sequencing: de novo assembly, annotation and EST-SSR marker development. PeerJ. 2016;4(1):e2378.
- Wei ZZ, Zhang HL, Wang Y, et al. Assessing genetic diversity and population differentiation of colored calla lily (Zantedeschia hybrid) for an efficient breeding program. Genes. 2017;8(6):168.
- Yeh FC, Yang RC, Boyle TJB, et al. POPGENE, the user-friendly shareware for population genetic analysis. Edmonton, Canada: Molecular Biology and Biotechnology Centre, University of Alberta; 1997. Available from: http://www.ualberta.ca/∼fyeh/index.htm
- Liu KJ, Muse SV. PowerMarker: an integrated analysis environment for genetic marker analysis. Bioinformatics. 2005;21(9):2128–2129.
- Tamura K, Dudley J, Nei M, et al. MEGA4: molecular evolutionary genetics analysis (MEGA) software version 4.0. Mol Biol Evol. 2007;24(8):1596–1599.
- Pritchard JK, Stephens M, Donnelly P. Inference of population structure using multilocus genotype data. Genetics. 2000;155(2):945–959.
- Evanno G, Regnaut S, Goudet J. Detecting the number of clusters of individuals using the software STRUCTURE: a simulation study. Mol Ecol. 2005;14(8):2611–2620.
- Peakall R, Smouse PE. GENALEX 6: genetic analysis in Excel. Population genetic software for teaching and research. Mol Ecol Notes. 2006;6(1):288–295.
- Kim KW, Chung HK, Cho GT, et al. PowerCore: a program applying the advanced M strategy with a heuristic search for establishing core sets. Bioinformatics. 2007;23(16):2155–2162.
- Hammer Ø, Harper DAT, Ryan PD. PAST: paleontological statistics software package for education and data analysis. Palaeontol Electron. 2001;4(1):9.
- Clarke KR. Non-parametric multivariate analysis of changes in community structure. Austral Ecol. 1993;18(1):117–143.
- Ferriol M, Pico B, Nuez F. Genetic diversity of a germplasm collection of Cucurbita pepo using SRAP and AFLP markers. Theor Appl Genet. 2003;107(2):271–282.
- Bell WD. New potentials in amaryllis breeding. Proc Fla State Hortic Soc. 1973;86(1):462–466.
- Bell WD. The role of triploids in Amaryllis hybridization. Plant Life. 1973;29(1–4):59–61.
- Shields JE. The ancestors of the amaryllis. Amaryllis Bull. 1979;1(1–6):2–6.
- Barnhoorn F. Cultivars of Hippeastrum: their evolution from the past and their development for the future. Herbertia. 1991;47(1/2):76–79.
- Frankel OH, Brown AHD. Plant genetic resources today: a critical appraisal. In: Holden JHW, Williams JT, editors. Crop genetic resources: conservation and evaluation. London: Allen & Unwin Ltd; 1984. p. 249–257.
- Agrama HA, Yan WG, Lee F, et al. Genetic assessment of a mini-core subset developed from the USDA Rice Genebank. Crop Sci. 2009;49(4):1336–1346.
- Rao ES, Palchamy K, Symonds RC, et al. Using SSR markers to map genetic diversity and population structure of Solanum pimpinellifolium for development of a core collection. Plant Genet Res. 2012;10(1):38–48.