
Abstract
Certain biological mechanisms of Glehnia littoralis, an endangered medicinal plant in China, may be underlying its endangered status and this has attracted extensive attention from researchers. In this study, nuclear ribosomal DNA internal transcribed spacer (nrDNA ITS) sequences and random amplified polymorphic DNA (RAPD) were investigated to determine the genetic diversity of G. littoralis. A total of 291 samples from 11 G. littoralis populations were collected from the east coast of China. The high genetic diversity and large genetic differentiation within populations were reconfirmed by both ITS (Ht = 0.576, Hs = 0.512, Gst = 0.1526) and RAPD analyses (Ht = 0.51, Hs = 0.35, Gst = 0.31). The phylogenetic trees showed consistent topologies based on ITS and RAPD; all populations were divided into two clades. Mantel tests (ITS: r = 0.3296, p = 0.067; RAPD: r = 0.036, p = 0.418) showed no significant positive correlation between the geographical distance and genetic distance for G. littoralis populations. These results showed that G. littoralis has great evolutionary potential and its status as endangered might be related to special dispersal and germination mechanisms of its seeds, as well as habitat destruction. In conclusion, we suggest that the conservation strategy for G. littoralis should be based on the protection of all the wild populations to the extent possible.
Introduction
Glehnia littoralis Fr. Schmidt ex Miq, a perennial herb belonging to a single-species genus in the Apiaceae family, has important ecological functions and medicinal properties [Citation1,Citation2]. As a beach constructive species, G. littoralis has highly developed roots and a strong ability to resist salt stress, which allow its application for sand fixation [Citation3]. The leaves of G. littoralis have been used as vegetables and health food in East Asia since ancient times. G. littoralis roots, called “Beishashen”, are used in traditional Chinese medicinal preparations for moistening lungs, removing phlegm, curing respiratory and gastrointestinal disorders, and as an anti-inflammatory agent [Citation4,Citation5]. In China, although G. littoralis is widely cultivated for its high economic value, the wild resources of this plant have been drastically reduced because of habitat destruction caused by extensive coastal excavation and development. As a result, G. littoralis is becoming endangered and has been classified as a Category II protected plant by the IUCN (International Union for Conservation of Nature) (http://rep.iplant.cn/prot/Glehnia%20littoralis). Furthermore, it is listed in the Endangered Plants Chinese Chronicle [Citation6].
In nature, the endangered status of many species can be attributed to the loss of population diversity, resulting in reduced reproductive fitness and increased extinction risk [Citation7,Citation8]. Previous studies have shown that some endangered species retain high genetic diversity, suggesting that their endangered status could be caused by other factors [Citation9–12]. Therefore, we initiated a study on the genetic diversity of wild G. littoralis to elucidate the underlying causes of its endangered status. We analysed internal transcribed spacer (ITS) sequences and random amplified polymorphic DNA (RAPD) molecular markers to obtain genetic information and reliable results regarding the genetic diversity of wild G. littoralis populations. The ITS include the ITS1, 5.8S and ITS2 regions of plants. The rapid evolution rate, high variability and bi-parental inheritance make them suitable for genetic diversity analysis at the species levels [Citation13–15]. ITS regions have been proven to be particularly effective for the study of interspecific and intraspecific variation in multiple species [Citation14–20], although ITS sequences have often shown incomplete concerted evolution and this might affect the construction of cluster trees [Citation21,Citation22]. RAPD has also been shown to be a useful tool for the assessment of the genetic structures of plant populations [Citation23–26]; its inherent technology is easy to perform, comparatively inexpensive, and has a higher level of polymorphism compared to simple sequence repeats (SSRs) [Citation27–29] and amplified fragment length polymorphisms (AFLPs) [Citation30,Citation31].
Our goals were to 1) determine the characteristics of ITS and RAPD and whether they are suitable for assessing the genetic diversity of G. littoralis populations, as well as for comparison of the similarities and differences of the genetic structure; 2) elucidate the genetic diversity of G. littoralis populations based on ITS and RAPD and suggest mechanisms contributing to the endangered status of this species; and 3) suggest an appropriate conservation strategy and feasible protection measures for G. littoralis populations based on our results.
Materials and methods
Samples collection
A total of 291 samples from 11 populations distributed in nine regions on the east coast of China were collected. Of these, 135 samples were used for ITS analysis, and 291 samples were used for RAPD analysis. The young leaves of G. littoralis were dried with silica gel before use. The collection sites are shown in and .
Figure 1. Haplotype distribution and relationships of the 11 populations of Glehnia littoralis. https://map.baidu.com/13438994,4328487,12z
Note: Circles represent sampling locations. H1, H2, and H3 represent different haplotypes detected.
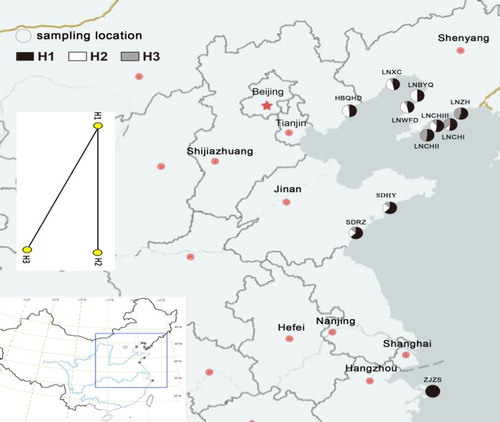
Table 1. Details of all the populations of Glehnia littoralis.
DNA extraction, polymerase chain reaction (PCR) amplification and sequencing
The genomic DNA of G. littoralis was extracted by the optimal CTAB method [Citation32]. The concentrations of DNA samples were determined by gel electrophoresis and adjusted to 20 ng/μL for subsequent PCR reactions. For the ITS analysis, the universal primers ITS1 (5′-TCCGTAGGTGAACCTGCGG-3′) and ITS4 (5′-TCCTCCGCTTATTGATATGC-3′) of the ITS sequences were used for PCR amplification [Citation33]. The PCR reaction was performed in a 25 μL reaction mixture, containing 17.85 μL sterile double-distilled water, 2.5 μL reaction buffer, 0.5 μL of 10 mmol/L dNTP mixtures, 1 μL of each primer (5 pmol), 2 μL of genomic DNA (40 ng), and 2 units of Taq DNA polymerase. The optimal PCR amplification procedure was conducted under the following conditions (Bio-Rad, USA): denaturation for 5 min at 94 °C and 37 cycles of denaturation at 94 °C for 50 s, annealing at 50 °C for 50 s, elongation for 1 min and 45 s at 72 °C, and a final elongation step at 72 °C for 10 min. PCR products were determined by agarose gel electrophoresis and were then purified using a DNA purification kit (Sangon Biotech Co., Ltd.). The purified products with bright and clear bands were selected and sent to the Beijing Genomics Institute (BGI) for sequencing. For the RAPD analysis, 10 primers were selected to detect polymorphisms in 11 populations using the primer sequences shown in . The PCR reaction was performed in a 25 μL reaction mixture, containing 19.25 μL sterile double-distilled water, 2.5 μL of 10 × Taq polymerase reaction buffer; 2 μL of 5 pmol primer, 1 unit of Taq DNA polymerase, and 1 μL plant DNA. The initial template denaturation was programmed at 94 °C for 3 min, followed by 40 cycles at 94 °C for 1 min, 37 °C for 30 s, 72 °C for 1.5 min, and a final extension of 72 °C for 8 min. PCR products were examined by electrophoresis in 1.5% w/v agarose gels in 0.5 × TBE (Tris, borate, ethylenediaminetetraacetic acid) buffer, stained with ethidium bromide, viewed under ultraviolet light, and photographed using an ultraviolet transilluminator (Bio-RAD).
Table 2. RAPD primer sequences, number of loci and number of polymorphic loci.
Data analysis
Analysis of ITS sequences
MEGA7.0 software [Citation34] was used for error correction and comparative analysis of multiple sequences to search for mutation sites, to calculate the population genetic distance and genetic consistency, and conduct cluster analysis using the UPGMA (unweighted pair group method with arithmetic mean) to establish a rootless dendrogram. Haplotype polymorphism (Hd) and nucleotide polymorphism (Pi) of populations were calculated using DnaSP 5.1 [Citation35]. The average genetic diversity index within populations (Hs) and total genetic diversity index (Ht) were calculated using PERMUT software [Citation36]. Analysis of molecular variance (AMOVA, Gst) was calculated using the Arlequin 3.1 software [Citation37], with a significance test for 1000 random samples and gene flow between populations (Nm) calculated using the equation: Nm = 0.5 (1-Gst)/Gst. The Mantel detection of the genetic distance matrix and geographic distance matrix were also performed using Arlequin 3.1 software [Citation38], with a significance test for 1000 random samples. The Median-Joining in NETWORK 4.6.1 software [Citation38] was used for haplotype network analysis, and the evolutionary relationships between haplotypes were predicted using the Coalescent theory [Citation39].
Analysis of RAPD
Clear and unambiguous bands were counted and scored as 1 for presence and 0 for the absence of a band. Data obtained were entered into a binary matrix for subsequent analyses. POPGENE 1.32 software [Citation40] was used to calculate the percentage of polymorphic loci, the effective number of alleles, Nei’s gene diversity (H) [Citation41], Shannon's Information index (I) [Citation42], the total genetic diversity index (Ht), the average genetic diversity index within populations (Hs), the genetic differentiation coefficient (Gst) and gene flow (Nm). The correlation between geographical distances and genetic distances was determined by Mantel detection using TFPGA software. The phylogenetic tree was constructed by the UPGMA method using the PHYLIP v. 3.6c software package [Citation43] based on Nei’s distances [Citation44] among populations.
Results and discussion
Sequence analysis of ITS and RAPD
The ITS sequences with a length of 628 bp were obtained and compared using the Blast tool of GenBank. The results showed that the amplified sequences included the complete ITS1, the 5.8 s rDNA and part of ITS2. After multiple sequences alignment by MEGA7.0, two nucleotide substitutions at sites 519 bp (G/T) and 535 bp (G/A) were located in ITS2 (). At site 519, in addition to the single peak of G, overlapping peaks of G and T were observed. Similarly, overlapping peaks of G and A were observed in addition to the single peak of G at site 535. Because two overlapping peaks did not coexist in the same sequence, and there was only one overlapping peak in each sequence, the haplotype of ITS of all samples with overlapping peaks could be inferred without cloning analysis. Based on the variation loci, three haplotypes (H1-H3) were located in 135 samples from 11 populations (, and ), the representative sequences of which were submitted to GenBank with the serial numbers MH822772, MH822773 and MH822774, respectively. As shown in and , haplotype H1 (GG) was the most widely distributed with the largest number of samples and was found in a total of 131 individuals (including 91 individuals with overlapping peaks) from all populations. Haplotype H2 (TG) was found in 55 individuals (all individuals with overlapping peaks) from nine populations (LNXC, LNWFD, HBQHD, LNZH, LNCHI, LNCHIII, SDHY, SDRZ and LNBYQ), excluding LNCHII and ZJZS. Haplotype H3 (GA) was found in 43 individuals (all individuals with overlapping peaks) from nine populations (LNXC, LNWFD, HBQHD, LNZH, LNCHI, LNCHIII, SDHY, SDRZ and LNCHI), excluding LNBYQ and ZJZS. Network haplotype analysis showed that three haplotypes constituted a linear genetic structure (). H1 was in the middle of the network with the highest frequency, presumably the ancestor haplotype, whereas H2 and H3 were at both ends of the network, presumably evolving from H1.
Table 3. Information of variation loci of ITS haplotypes in Glehnia littoralis.
Table 4. Haplotype distribution and haplotype diversity in 11 populations of Glehnia littoralis.
All the obtained ITS sequences had relatively little variation and some individuals presented overlapping peaks, which suggested that this species might exhibit incomplete concerted evolution. In recent years, the ITS sequences of some angiosperms have also been reported to exhibit incomplete concerted evolution, although it is not universal [Citation21,Citation45,Citation46]. More data are needed to understand the factors that lead to the incomplete concerted evolution of the ITS sequences in G. littoralis species, especially post-cloning sequencing analysis of this gene fragment in multiple samples. Nevertheless, the three haplotypes could still provide information on genetic variation for diversity analysis.
The RAPD analysis results indicated that each primer achieved a moderate amount of stable, clear and highly polymorphic bands ranging from six to 10. The selected 10 primers produced 79 loci, of which 65 loci were polymorphic, accounting for 82.3% of the total, with an average of 7.9 loci and 6.5 polymorphic loci scored by per primer (). The proportion of polymorphic loci per primer was high, varying from 66.7% to 90%. The primers S83 and S94 produced the highest rate of polymorphic loci (90%), and the primers S96 produced the lowest number of polymorphic loci (66.7%) ().
These results revealed that the ITS regions and RAPD molecular markers were useful for investigating the genetic diversity of G. littoralis populations.
Genetic structure and genetic diversity analysis revealed by ITS and RAPD
Based on the sequence analysis of ITS, the total genetic diversity index (Ht) was 0.576, and the genetic diversity index within populations (Hs) was 0.512, suggesting that 88.89% of the genetic differentiation occurred within populations. At the species level, the haplotype diversity index (Hd) was 0.582, and the nucleotide diversity index (Pi) was 0.00107. At the population level, the Hd of the 11 populations ranged from 0 to 0.670, whereas the Pi ranged from 0 to 0.00128 (). The highest levels of haplotype diversity and nucleotide diversity were both found in the population LNWFD. The ZJZS population was the only monomorphic population, whereas the other 10 populations contained two to three haplotypes (). All of the results suggested that G. littoralis had a high level of genetic diversity. AMOVA analysis revealed that the coefficient of genetic differentiation between populations (Gst) was 0.1526, suggesting that 84.74% of the genetic differentiation occurred within populations and 15.26% of the genetic differentiation occurred between populations, which also indicated that the genetic variation mainly existed within populations. The results of the Mantel test (r = 0.3296, p = 0.067) revealed that there were no significant positive correlations between geographic distance and genetic distance in G. littoralis. Gene flow (Nm) was 4.005, indicating there were frequent gene exchanges between populations.
Genetic diversity parameters for each population based on RAPD analysis are presented in . The results showed that the effective number of alleles [Citation47] per locus (Ne) varied from 1.17 to 2.07, with an average of 1.69. Estimates of gene diversity per locus (H) ranged between 0.13 and 0.50, with an average of 0.35. Shannon's information index (I) ranged between 0.22 and 0.78 and averaged 0.56 at the population level. The total gene diversity (Ht) was 0.51, indicating that 68.63% (Hs = 0.35) of the total genetic variation was attributed to within-population diversity, whereas the rest (31.37% of the total genetic variation) was from differences between populations (Gst = 0.31). The highest genetic diversity within population was detected in the LNXC (H = 0.50; I = 0.77) and the lowest was obtained in the LNCHI (H = 0.13; I = 0.22) (). The overall gene flow (Nm) was 1.10, also suggesting frequent gene exchanges between populations. Mantel test results (r = 0.036, p = 0.418) were consistent with the ITS analysis, i.e. there was no significant positive correlation between genetic distance and geographical distribution in G. littoralis.
Table 5. Genetic diversity of each population of Glehnia littoralis.
Genetic diversity analysis based on ITS (Ht = 0.576, Hs = 0.512, Gst = 0.1526) and RAPD (Ht = 0.51, Hs = 0.35, Gst = 0.31) obtained consistent results, wherein G. littoralis had higher genetic diversity and lower inter-population genetic differentiation. The genetic diversity coefficients were higher than or similar to those of other endangered species [Citation9,Citation11,Citation48–50]. This result was consistent with previous studies based on molecular markers and enzyme alleles [Citation51–55]. Genetic diversity is the essence of species evolution and our results showed that G. littoralis has great evolutionary potential, which in turn, implies the contribution of severe habitat destruction on their endangered status. This is the main factor necessitating the protection of the wild resources of G. littoralis.
Cluster analysis results revealed by ITS and RAPD
The UPGMA tree was constructed using Mega 7.0 software based on genetic distance of ITS sequences. The results showed that the 11 populations were divided into two major clades (). One clade (clade II) included the populations LNCHII, LNZH and LNCHI, in which LNCHII and LNZH clustered into one subgroup. The remaining eight populations were clustered into another clade (clade I), including ZJZS, SDRZ, SDHY, LNCHIII, LNBYQ, HBQHD, LNWFD and LNXC, among which, ZJZS, SDRZ, SDHY and LNCHIII, and LNBYQ and HBQHD clustered into two subgroups, respectively.
Figure 2. Dendrograms based on genetic distances of Glehnia littoralis populations. Phylogenetic tree based on ITS sequences (a) and RAPD (b).
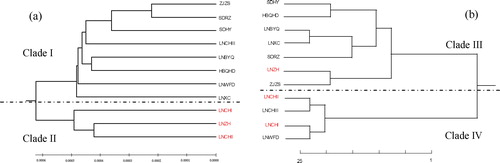
Genetic identity and genetic distance of G. littoralis populations were obtained by RAPD amplification results. The shortest genetic distance was detected between LNCHI and LNWFD (0.06), whereas the greatest genetic distance was revealed between HBQHD and LNCHI (0.94). The phylogenetic tree () based on Nei’s genetic distances also revealed that the 11 populations were separated into two main clades. The first clade (clade III) consisted of the populations SDHY, HBQHD, LNZH, LNBYQ, LNXC, ZJZS and SDRZ, wherein, SDHY and HBQHD, LNBYQ, LNXC and SDRZ, LNZH and ZJZS were divided into three subgroups. The second clade (clade IV) consisted of the populations LNCHI, LNCHII, LNCHIII and LNWFD, in which, LNCHII and LNCHIII clustered together and LNCHI and LNWFD clustered together.
Comparing the cluster trees based on ITS and RAPD, two cluster trees were found to have similar topologies and all the examined samples were distributed into two distinct clades (). As shown in , most populations were grouped into the same clades, except LNCHIII, LNZH and LNWFD. However, in the subgroups, the evolutionary relationships of most populations showed an obvious divergence. This phenomenon was similar to the common problem in evolutionary studies, known as “gene-tree conflicts”. Researchers have found several reasons for gene-tree conflict, which include sampling error; systematic error; and biological factors, including hybridization, introgression and lineage sorting [Citation56]. Additionally, the results of the Mantel test (ITS: r = 0.3296, p = 0.067; RAPD: r = 0.036, p = 0.418) revealed no significant positive correlations between geographic distance and genetic distance for G. littoralis. Some geographically distant populations, such as SDRZ and ZJZS, were clustered together in the tree based on ITS sequences, while LNZH and ZJZS were clustered together in the tree based on RAPD and some geographically close populations (LNCHI, LNCHII, LNCHIII and LNZH) were clustered into two different clades ( and Citation2). This might be related to specific narrow coastal habitats. The long geographical distances did not form effective ecological barriers, because the continuous water promoted seeds of G. littoralis to spread with the water, which increased frequent genetic exchange among populations. As a result, the high gene flow (ITS: Nm = 4.005; RAPD: Nm = 1.10) reduced the genetic diversity between populations; this suggestion was supported by the results of the AMOVA analysis (ITS: Gst = 0.1526; RAPD: Gst = 0.31).
The underlying causes of the endangered status of G. littoralis
Genetic diversity plays an important role in the ability of populations to maintain adaptive evolution. The loss of genetic diversity is usually directly related to the reduced fitness of a species. The maintenance of genetic diversity is a major objective in conservation plans for endangered species [Citation57,Citation58]. As mentioned above, the endangered status was not attributable to the loss of genetic diversity in G. littoralis. A potential reason could be related to the special dispersal and germination mechanism of G. littoralis seeds. Yang et al. [Citation3] found that seeds of wild G. littoralis need to disperse in the seawater to be more vigorous and they require more than 2.5 months of low-temperature dormancy to germinate properly. Such a sensitive germination mechanism makes its growth and reproduction susceptible to environmental factors, which are not conducive to interspecies competition. Secondly, the destruction of beach habitats by human factors, such as excessive excavation and coastal development, is another possible reason for the decline of G. littoralis, as reported previously [Citation51,Citation55,Citation59]. Human domestication and cultivation can avoid the influences of the above adverse environmental factors, but Pan et al. [Citation60] found that the cultivated G. littoralis have experienced significant declines relative to the wild ones, and human cultivation was believed to be insufficient for conserving G. littoralis. Based on the above findings, we suggest that the conservation strategy for G. littoralis should include the protection of all the original populations to the extent possible.
Conclusions
In this study, insights from the nrDNA ITS region and RAPD analyses indicated that the main factor responsible for the endangered status of G. littoralis may be recent habitat destruction and over-collection of the roots from wild populations rather than a loss of genetic diversity. Increased coastal tourism and development has led to serious destruction of wild G. littoralis habitats. Considering the high genetic diversity within the populations and the special dispersal and germination mechanism of G. littoralis seeds, it is necessary to protect all the original habitats of wild G. littoralis and establish a germplasm resource bank as soon as possible.
Disclosure statement
No potential conflict of interest was reported by the authors.
Additional information
Funding
References
- Mathias ME. Studies in the Umbelliferae I. Ann Mo Bot Gard. 1928;15(1):91–109.
- Shan RH, She ML. Flora of China. vol. 55. Beijing (China): Science Press; 1992.
- Yang HX, Chu JM, Liu XS. Natural persistence of the coastal plant Glehnia littoralis along temperate sandy coasts. Sci Rep. 2017;7(1):7.
- Yoon T, Cheon MS, Lee AY, et al. Anti-inflammatory activity of methylene chloride fraction from Glehnia littoralis extract via suppression of NF-kappa B and mitogen-activated protein kinase activity. J. Pharmacol. Sci. 2010;112(1):46–55.
- Li L, Li MM, Qi XW, et al. De novo transcriptome sequencing and analysis of genes related to salt stress response in Glehnia littoralis. PeerJ. 2018;6(9):e5681.
- Fu LG. Red book of Chinese plants - rare and endangered plants I. Beijing, China: Science Press; 1992.
- Brekke P, Bennett PM, Santure AW, et al. High genetic diversity in the remnant island population of hihi and the genetic consequences of re-introduction. Mol Ecol. 2011;20(1):29–45.
- Spielman D, Brook BW, Frankham R. Most species are not driven to extinction before genetic factors impact them. Proc Natl Acad Sci USA. 2004;101(42):15261–15264.
- Wróblewska A, Brzosko E, Czarnecka B, et al. High levels of genetic diversity in populations of Iris aphylla L. (Iridaceae), an endangered species in Poland. Bot J Linn Soc. 2003;142(1):65–72.
- Ellis JR, Pashley CH, Burke JM, et al. High genetic diversity in a rare and endangered sunflower as compared to a common congener. Mol. Ecol. 2006;15(9):2345–2355.
- Wu FQ, Shen SK, Zhang XJ, et al. Genetic diversity and population structure of an extremely endangered species: the world’s largest Rhododendron. Aob Plants. 2015;7:plu082.
- Lee SR, Choi JE, Lee BY, et al. Genetic diversity and structure of an endangered medicinal herb: implications for conservation. AoB PLANTS. 2018 ;10(2):ply021.
- Singh SK, Meghwal PR, Pathak R, et al. Genetic diversity in Punica granatum revealed by nuclear rRNA, internal transcribed spacer and RAPD polymorphism. Natl Acad Sci Lett. 2013;36(2):115–124.
- Kakani RK, Singh SK, Pancholy A, et al. Assessment of genetic diversity in Trigonella foenum-graecum based on nuclear ribosomal DNA, internal transcribed spacer and RAPD analysis. Plant Mol Biol Rep. 2011;29(2):315–323.
- Ramaiya SD, Bujang JS, Zakaria MH. Genetic diversity in Passiflora species assessed by morphological and ITS sequence analysis. Sci World J. 2014;2014:598313. [2020-04-18];
- Huang DQ, Li QQ, Zhou CJ, et al. Intraspecific differentiation of Allium wallichii (Amaryllidaceae) inferred from chloroplast DNA and internal transcribed spacer fragments. J Sytematics Evol. 2014;52(3):341–354.
- Wang P, Lu YL, Zheng MM, et al. RAPD and internal transcribed spacer sequence analyses reveal Zea nicaraguensis as a section Luxuriantes species close to Zea luxurians. PLoS One. 2011;6(4):e16728. [2020-04-18];
- Zhao LL, Feng SJ, Tian JY, et al. Internal transcribed spacer 2 (ITS2) barcodes: a useful tool for identifying Chinese Zanthoxylum. Appl Plant Sci. 2018;6(6):e01157.
- Shiran B, Kiani S, Sehgal D, et al. Internal transcribed spacer sequences of nuclear ribosomal DNA resolving complex taxonomic history in the genus Vicia L. Genet Resour Crop Evol. 2014;61(5):909–925.
- Filyushin MA, Reshetnikova NM, Kochieva EZ, et al. Intraspecific variability of ITS sequences in the parasitic plant Monotropa hypopitys L. from the European Russian populations. Russ J Genet. 2015;51(11):1149–1152.
- Xiao LQ, Zhu H. Incomplete nrDNA ITS concerted evolution in plants and its evolutionary implications. Acta Bot Bor-Occid Sin. 2009;29(8):1708–1713.
- Xiao LQ, Möller M, Zhu H. High nrDNA ITS polymorphism in the ancient extant seed plant Cycas: Incomplete concerted evolution and the origin of pseudogenes. Mol. Phylogenet. Evol. 2010;55(1):168–177.
- Williams JGK, Kubelik AR, Livak KJ, et al. DNA polymorphisms amplified by arbitrary primers are useful as genetic markers. Nucleic Acids Res. 1990;18(22):6531–6535.
- Nybom H, Bartish I. Effects of life history traits and sampling strategies on genetic diversity estimates obtained with RAPD markers in plants. Perspect Plant Ecol Evol Syst. 2000;3(2):93–114.
- Ikbal BK, Dhillon RS. Evolution of genetic diversity in Jatropha curcas L. using RAPD markers. Indian J Biotech. 2010;9:50–57.
- Nosrati H, Hosseinpour-Feizi M, Nikniazi M, et al. Genetic variation among different accessions of Lathyrus sativus (Fabaceae) revealed by RAPDs. Bot Serbica. 2012;36:41–4728.
- Cao QJ, Lu BR, Xia H, et al. Genetic diversity and origin of weedy Rice (Oryza sativa f. spontanea) populations found in northeastern China revealed by Simple Sequence Repeat (SSR) markers. Ann Bot. 2006;98:1241–1252.
- Sun Y, Liu YF, Huang HW. Isolation and characterization of polymorphic microsatellite markers in Schisandra chinensis (Turcz.) Baill. (Schisandraceae). Conserv Genet Resour. 2009;1(1):119–121.
- Matsuda J, Setoguchi H. Isolation and characterization of microsatellite loci in Asarum leucosepalum (Aristolochiaceae), an endangered plant endemic to Okunoshima Island in the Ryukyu Archipelago. Conserv Genet Resour. 2012;4(3):579–581.
- Vos P, Hogers R, Bleeker M, et al. AFLP: a new technique for DNA fingerprinting. Nucleic Acids Res. 1995;23(21):4407–4414.
- Krauss SL. Accurate gene diversity estimates from amplified fragment length polymorphism (AFLP) markers. Mol Ecol. 2000;9:1241–1245.
- Doyle JJ, Doyle JL. A rapid DNA isolation procedure for small quantities of fresh leaf material. Phytochem Bull. 1987;19:11–15.
- White TJ, Bruns T, Lee S, et al. Amplification and direct sequencing of fungal ribosomal RNA genes for phylogenetics. In: PCR protocols a guide to methods and applications. San Diego (CA): Academic Press; 1990:315–322.
- Sudhir K, Glen S, Koichiro T. MEGA7: molecular evolutionary genetics analysis version 7.0 for bigger datasets. Mol Biol Evol. 2016;33(7):msw054.
- Librado P, Rozas J. DnaSP v5: a software for comprehensive analysis of DNA polymorphism data. Bioinformatics. 2009;25(11):1451–1452.
- Pons O, Petit RJ. Measuring and testing genetic differentiation with ordered versus unordered alleles. Genetics. 1996;144:1237–1245.
- Excoffier L, Laval G, Schneider S. Arlequin (version 3.0): An integrated software package for population genetics data analysis. Evol Bioinform Online. 2005;1:117693430500100–117693430500150.
- Bandelt HJ, Forster P, Rohl L. Median-joining networks for inferring intraspecific phylogenies. Mol Biol Evol. 1999;16:37–48.
- Tavaré S. Coalescent theory. Hoboken (NJ): John Wiley & Sons, Ltd; 2006.
- Raymond M, Rousset F. GENEPOP (version 1.2): population genetics software for exact tests and ecumenicism. J Hered. 1995;86(3):248–249.
- Nei M. Analysis of gene diversity in subdivided populations. Proc Natl Acad Sci USA. 1973;70:3321–3323.
- Lewontin RC. The apportionment of human diversity. Evol Biol. 1972;6(38):1–398.
- Felsenstein J. PHYLIP (Phylogeny Inference Package) version 3.6. Seattle: Department of Genome Sciences, University of Washington. 2005.
- Nei M. Genetic distance between populations. Am Nat. 1972;106(949):283–292.
- Harpke D, Peterso NA. Non-concerted ITS evolution in Mammillaria (Cactaceae). Mol Phylogenet Evol. 2006;41(3):579–593.
- He YH. Bioinformatic analysis of the Elaeagnaceae nrDNA ITS sequences [dissertation]. Lanzhou: Northwest Normal University; 2012.
- Kimura M, Crow JF. The number of alleles that can be maintained in a finite population. Genetics. 1964;73:19–35.
- Hamrick JL, Godt MW. Effects of life history traits on genetic diversity in plant species. Phil Trans Roy Soc London Ser B Biol Sci. 1996;351:1291–1298.
- Nybom H. Comparison of different nuclear DNA markers for estimating intraspecific genetic diversity in plants. Mol Ecol. 2004;13:1143–1155.
- Feng X, Wang Y, Gong X. Genetic diversity, genetic structure and demographic history of Cycas simplicipinna (Cycadaceae) assessed by DNA sequences and SSR markers. BMC Plant Biol. 2014;14:187.
- Wang AL, Wang GL, Li WW. Genetic diversity of Glehnia littiralis populations revealed by ISSR molecular markers. Acta Bot Bor-Occid Sin. 2015;35(8):1541–1546.
- Li B, Wang AL, Zhang P, et al. Genetic diversity and population structure of endangered Glehnia littoralis (Apiaceae) in China based on AFLP analysis. Biotechnol Biotechnol Equip. 2019;33(1):331–337.
- Wang AL, Zhang P, Liu X, et al. Genetic structure and diversity of Glehnia littoralis, an endangered medicinal plant in China. Biochem Syst Ecol. 2016;66:265–271.
- Huh M, Choi J, Huh H, et al. Genetic diversity and population structure of Glehnia littoralis (umbelliferae) in Korea. J Physiol Pathol Korean Med. 2003;17:1519–1523.
- Hui H, Liu QX, Liu MH. Allozyme variation and genetic diversity of Glehnia littoralis populations at the middle of seaboard in China. J Plant Resour Environ. 2001;10:1–6.
- Zou XH, Ge S. Conflicting gene trees and phylogenomics. J Syst Evol. 2008;46(6):795–807.
- Avise JC, Hamrick JL. Conservation genetics: case histories from nature. New York (NY): Chapman & Hall; 1996.
- Chen FJ, Wang AL, Chen KM, et al. Genetic diversity and population structure of the endangered and medically important Rheum tanguticum (Polygonaceae) revealed by SSR Markers. Biochem Syst Ecol. 2009;37(5):613–621.
- Song CF, Wu BC, Hu J, et al. Existence status of Glehnia littoralis and causes of extinction in Jiangsu Province. Chin Wild Plant Resour. 2013;32(4):56–57. 69.
- Pan Y, Chu J, Yang H. Conservation choice on the rare endangered plants Glehnia littoralis. Conserv Physiol. 2018 ;6(1):coy002. [2020-04-18]