
Abstract
The animal gut has a remarkable abundance of microbes. These microbes have strong potential for biosynthesis of promising drug candidates, and these small bioactive molecules often medicate important host–microbe and microbe–microbe interactions. To understand the evolution of the animal gut microbes and their biosynthetic gene clusters, we characterized 24 faecal samples from different herbivores, carnivores and omnivores, by next-generation sequencing of the 16S rDNA V3-V4 hypervariable regions and NRPS. The results showed that the host diet and phylogeny both not only influence the bacterial communities, but also that NRPS gene clusters co-diversified with their gut microbiota. We also found that the animal gut microbiome contains abundant secondary metabolic synthesis gene clusters, which prove to be a potential gold mine of novel bioactive natural products. In conclusion, our results reveal the co-diversity of animal gut microbiota and their NRPS gene clusters, and suggest that potential NRPS natural products are hidden in the animal microbiome.
Introduction
Microorganisms can produce a diversity of small bioactive molecules. Soil and marine microorganisms have provided a rich resource pool for the discovery of novel compounds. Some secondary metabolites have been isolated from the animal microbiome, and could be recognized as a promising source of candidate drugs [Citation1]. Animals always need a characteristic diet and are either carnivorous or herbivorous/omnivorous. The diversity of host genetic background and the complexity of the animal digestive tract contribute to a rich niche of commensal microorganisms. The gut microbiota is a diverse and complex microbial community that has evolved from the host and is closely connected with the host biology [Citation2]. It has been well established that gut microbiota plays an essential role in colonization resistance, immune system modulation, synthesis of essential vitamins and nutrients and digestion of polysaccharides [Citation3–5]. Variety of secondary metabolites can be produced by gut microbes, which may mediate the reaction between host and microbe or microbe and other microbes [Citation6]. There is evidence that the mammals undergo co-evolution with their indigenous microbial communities [Citation7]; however, there is currently a limited understanding of whether secondary metabolic biosynthetic gene clusters co-diversify with their gut microbiome.
The sequencing of DNA extracted directly from environmental samples (environmental microbiome) can be used to evaluate the richness of the bacterial biosynthetic domain in a microbiome, and to determine the diversity of biosynthetic clusters in different microbiomes [Citation8]. Advances in high-throughput sequencing have enabled the characterization of complex microbiota populations. Similar to the use of 16S genes amplified from environments to describe bacterial species diversity, degradation primers for conservative genes in large natural product biosynthesis families can be used to evaluate bacterial biosynthesis diversity [Citation8]. Natural products of bacteria contain high diversity of chemical structures, while most biomedically interesting metabolites come from a few evolutionarily related biosynthetic families [Citation8]. And among these significant biomedically interesting products, one of the most common related biosynthetic gene cluster is that of the nonribosomal peptide synthetase (NRPS) [Citation9]. The aim of the present study was to investigate the evolution of gut microbiota from different herbivores, carnivores and omnivorous birds, and to investigate the NRPS domain diversity in the gut microbiome of different animals.
In this study, we used high-throughput sequencing to investigate the microbial community in the faeces of different herbivores, carnivores and omnivorous birds, and report on NRPS domain composition and diversity in different animal gut microbiome. Our results support the suggestion that host phylogeny and dieting habits shape animal microbiota, and the NRPS gene clusters co-diversified with their gut microbiome, which indicates co-evolution of animal gut microbiota and their gene clusters. We also found that the animal gut microbiome contains abundant NRPS natural products, which could be a potential gold mine of novel bioactive natural products.
Materials and methods
Ethics statement
Before sample collection, all animal works were approved by the institutional animal care and use committee of the Southwest Medical University under permit number CP-A20191004.
All experiments were performed in accordance with the approved guidelines and regulations for the care and use of animals.
Sample collection and DNA isolation
Faecal samples from captive animals were collected immediately after their natural defaecation, frozen using liquid nitrogen and sent to the laboratory in foam boxes with dry ice. All samples were obtained from the inside of the faeces using sterile equipment, in which there was no contact with soil or other pollution sources. All animal faecal samples were collected from Chongqing Animal Zoo, and 24 samples in total were collected. Based on dieting habits and natural history, we classified these animals into herbivores (A group), carnivorous (B group) and omnivores birds (C group) groups (for details, see ).
Table 1. Description of the 24 faecal samples from different herbivores, carnivores and omnivores used in this study.
According to the manufacturer’s instructions, total genomic DNA was isolated from the faecal samples with a kit (Qiagen QIAamp Fast DNA Stool Mini Kit), and the DNA concentration was determined by UV absorbance (Nano-Drop 2000 spectrophotometer).
PCR amplification and Miseq sequencing
The following degenerate primer pairs were used to PCR-amplify 16S rDNA and NRPS domains: 16S rDNA of V3–V4 regions (Primers 338F: 5′-ACTCCTACGGGAGGCAGCAG-3′ and 806R: 5′-GGACTACHVGGGTWTCTAAT-3′) and NRPS domains A3F (5′-GCSTACSYSATSTACACSTCSGG-3′) and A7R (5′-SASGTCVCCSGTSCGGTA-3′) [Citation10,Citation11]. The PCR assays were carried out in triplicate as follows: 20 μL reaction solutions with 10 ng template DNA, 4 μL PCR reaction buffer, 0.4 mmol/L of each primer, 2.5 mmol/L dNTPs, and 0.5 U TransStartFastPfu DNA polymerase (TransGen Biotech). For 16S rDNA (V3–V4 regions), the PCR conditions were as follows (GeneAmp 9700, ABI USA): 95 °C for 4 min, followed by 27 cycles of 95 °C for 30 s, 55 °C for 30 s, 72 °C for 45 s, and a final extension at 72 °C for 10 min. For NRPS domains (A3F and A7R), the PCR conditions were as follows: 95 °C for 4 min, followed by 30 cycles of 95 °C for 30 s, 59 °C for 35 s, 72 °C for 60 s and a final extension at 72 °C for 10 min.
All PCR products were loaded on agarose gels (2% in TAE buffer, ethidium bromide), and purified with a DNA gel extraction kit (Axygen, China). For the sequencing procedure, the concentration in the samples was determined by a fluorescent quantitative system (QuantiFluorTM-ST, Promega, USA), and then the samples were mixed with the appropriate proportion according to the sequencing requirements. Sequencing was performed by Majorbio Bio-Pharm Technology Co., Ltd. (Shanghai, China) using the Illumina Miseq PE300 platform.
Sequence analysis
Before analysis, sequences were demultiplexed and quality-filtered using QIIME (version 1.9.1) with the following criteria: (1) the 300 bp reads were truncated at any site receiving an average quality score <20 over a 50 bp sliding window, discarding the truncated reads that were shorter than 50 bp; (2) exact barcode matching, two nucleotide mismatches in primer matching, reads containing ambiguous characters were removed; and (3) only sequences that overlapped longer than 10 bp were assembled according to their overlap sequence. Reads that could not be assembled were discarded.
For 16S rDNA, sets of sequences with at least 97% identification were defined as an OTU (operational taxonomic unit), and chimeric sequences were identified and removed using UCHIME. The taxonomic classification based on the 16S rRNA gene sequences was done using RDP Classifer (http://rdp.cme.msu.edu/) against the SILVA ribosomal RNA gene database using a confidence threshold of 70%. Alpha-diversity metrics, including community richness parameters (Chao1, Sob, Ace, Rarefaction and Rank-Abundance curves), community diversity parameters (Shannon, Simpson, and Shannon-Wiener curves) and a sequencing depth index (Good’s coverage), were calculated using mothur (https://mothur.org/). A phylogenetic tree on the genus level using Bray-Curtis distance was constructed and network analysis based on Genus level was done using I-Sanger platform (https://www.i-sanger.com/).
For NRPS domains, sets of DNA sequences were translated in silico into amino-acid sequences and then defined as OTUs at 90% identity. Quality-controlled protein sequences were queried using Bioinformatics Research Center services (https://birc.au.dk/) for predict NRPS substrate clusters [Citation12]. NRPS domain cluster diversity measurements, including substrate cluster barplot analysis, hierarchical clustering tree and principal coordinate analyses (PCoA) based on OTU compositions were done.
Results and discussion
Taxonomic composition and community structure
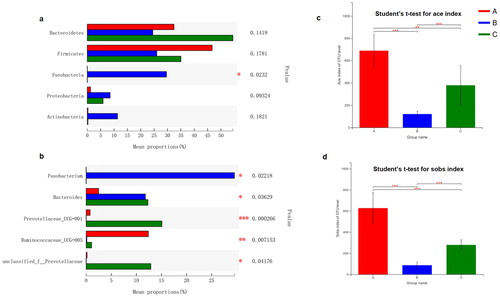
The animal gut microbiome is rich in genetic resources and is shaped by the long-term evolution of the animals, i.e. their genetic background, and their dietary characteristics. The classification of the animals into herbivore, omnivore and carnivore groups was based on dieting habits and natural history. Previous studies have shown that the gut microbiota of animals is species-specific, and dietary structure factors play an important role [Citation7, Citation13,Citation14]. In our study, high-throughput sequencing was used to characterize the species composition and community structure of the gut microbiota from different animals, and across the 24 samples, an average of 18,570 high-quality reads were obtained after denoising. The number of reads, coverage, operational taxonomic units and statistical estimates of species richness from each sample at a genetic distance of 3% is presented in . The rarefaction, Shannon–Wiener and rank-abundance curves generated using R software () were clustered at the 97% phylotype similarity level. These sequences were assigned to 1632 OTUs in total, and OTU 1057, OTU 1625 and OTU 1120 were top three abundant OTUs among all the groups (). A total of 16 prokaryotic phyla were identified from the 16S rRNA gene sequences (). In the A group, Firmicutes was predominant, presented by 11.9%–71.1% of the 16S rRNA gene sequences. The second most abundant phylum was Bacteroidetes, with 23.6%–43.9% in each sample. In the B group, the most abundant phylum was Fusobacteria in Panthera tigris Amoyensis (30.1%–70.4%), Firmicutes in Panthera leo (45.6%–53.7%), Bacteroidetes in Vulpes vulpes fulva (38.9%–65.5%), respectively. In the C group, Bacteroidetes and Firmicutes were predominant, presented by 81.7%–96.1% in each sample. At the genus level, detected OTUs were distributed among 246 different bacterial genera in total (). In the B group, 104 genera were detected, and in the C group, 183 genera were detected. In contrast, a more diverse community of 203 genera was detected in the A group. There was only Fusobacteria significant differences in the relative abundance of gut microbiota at the phylum level among the three groups (), but at the genus level, Fusobacterium, Bacteroides, Prevotellaceae_UCG-001, Ruminococcaceae_UCG-005 and unclassified_f_Prevotellaceae presented a significant difference among the three (). Bacterial community richness (measured by Sob index and Ace index of OTU level, respectively) in the A group was significantly higher than that in the B group and C group (). The results of our study are also consistent with some previous reports [Citation7, Citation13,Citation14]: gut microbiota from herbivores, carnivores and omnivorous animals have different structural characteristics, and are naturally clustered into three groups based on host phylogeny and dietary habits.
Figure 1. Faecal bacterial community at the phylum (a) and genus (b) level. (a and b) Relative abundance of bacteria in the 24 faecal samples from different herbivores, carnivores and omnivores. Phyla or genera with abundance of less than 1% abundance were merged into ‘others’. The letters A to H followed by a number indicate the samples; A–C, herbivores; D–F, carnivores; G–H, omnivores (see ).
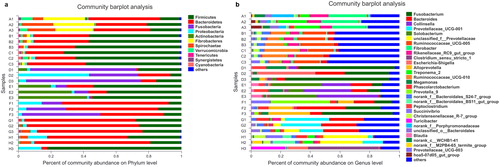
Figure 2. Statistical comparison of the relative abundance (a and b) and bacterial diversities (c and d) of gut microbiota among the three groups. (a) Comparison of dominant phyla in the A, B and C groups. (b) Comparison of dominant genera in the A, B and C groups. (c) Bacterial community richness (measured by ACE index) in the A, B and C groups. (d) Bacterial community diversity (measured by Sobs index) in the A, B and C groups. Differences were considered statistically significant at *p < 0.05; **p < 0.01; ***p < 0.001 level. Groups: A, herbivores; B, carnivores; C, omnivores.
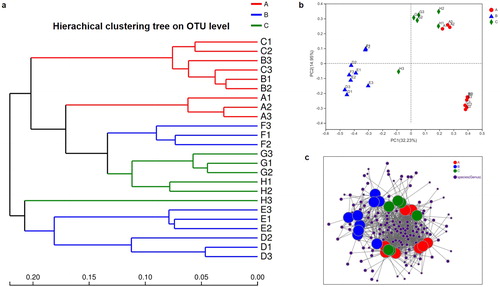
Next, we examined the relationship between the gut microbiota of the 24 faeces samples from the three groups using Bray-Curtis distances, which were represented by a dendrogram (). Each branch on the tree represented one sample of gut microbiota. The results suggested that, based on the dietary structure and phylogeny, the gut microbiota of the herbivorous mammals, carnivorous mammals and omnivorous birds clustered on different branches. Next, we used typing analysis to examine the community structure of the gut microbiotas of the three groups. In the typing analysis, each symbol represents the gut microbiota from one sample (). Similar to the cluster analysis, the bacterial communities from the A group and the C group clustered tightly and were separated from those of the B group along principal coordinate axis 1 (PC1), which explained the largest amount of variation (32.23%). Then, we used network-based analyses to map the gut microbial community composition and structure onto animal phylogeny and diet habits (). In the network-based analysis, the result was consistent with the tree-based () and typing analyses (). This indicates that the host phylogeny influenced the bacterial composition, and consistent with that, animals of similar dieting habits had more similar community structure of gut microbiota.
Figure 3. Relationship of the gut microbiota from different herbivores, carnivores and omnivores. (a) Clustering tree of the gut microbiotas in different animals from herbivores (A group), carnivores (B group) and omnivores (C group). Gut microbiota trees were generated using the UPGMA (unweighted pair group method with arithmetic mean) algorithm based on the Bray-Curtis distances generated by Mothur. (b) Principal coordinate analysis (PcoA) of community structure of the gut microbiotas of the three groups. Circular (red), triangular (blue) and diamond (green) shapes represent the gut microbiotas from herbivores (A group), carnivores (B group) and omnivores (C group), respectively. Distances between symbols on the ordination plot reflect relative dissimilarities in community structures. (c) Network-based analysis of faecal microbial communities in herbivores, carnivores and omnivores.
NRPS domain richness and gene cluster relationship
NRPS adenylation (AD) domain composition and richness could be a measure of biosynthetic richness and diversity in environmental metagenomes. In our study, the NRPS domain composition and OTU richness of each sample were evaluated using the ACE diversity metric (Supplemental Figure S5). The NRPS domain estimates ranged from below 60 to above 305 OTUs per sample. The rarefaction, Shannon-Wiener and rank-abundance curves generated using R software (Supplemental Figures S6–S8) were clustered at the 97% phylotype similarity level. Interestingly, the sob index of the AD domain on OTU level suggested that the herbivores and carnivores included in this study had more OTU diversity richness compared with the omnivores (Supplemental Figure S9). NRPS synthesis happens in a conveyor belt-like fashion where each individual NRPS module is responsible for incorporating a specific substrate (typically an amino acid) into the final product [Citation12]. The substrate of NRPS domains were predicted by SEQL-NRPS, based on occurrences of motifs in their primary structures (). ALA (apolar, aliphatic side chain), DHB-SAL (hydroxy-benzoic acid derivatives), and PRO (cyclic aliphatic chain with polar-NH2 group) were the top three predicted abundant substrates.
Figure 4. Richness and relationship of NRPS gene clusters in gut microbiome. (a) Relative abundance of predicted substrate of NRPS domains in the gut microbiome from different herbivores, carnivores and omnivores. (b) Principal coordinate analysis (PcoA) of community structure of the NRPS gene clusters in the three groups. Circular, triangular and square shapes represent the domains of NRPS in the gut microbiome from herbivores (A group), carnivores (B group) and omnivores (C group), respectively. Distances between symbols on the ordination plot reflect relative dissimilarities in community structures. (c) Bray-Curtis distances tree of the evolution of the NRPS gene domains in different herbivores (A group), carnivores (B group) and omnivores (C group).
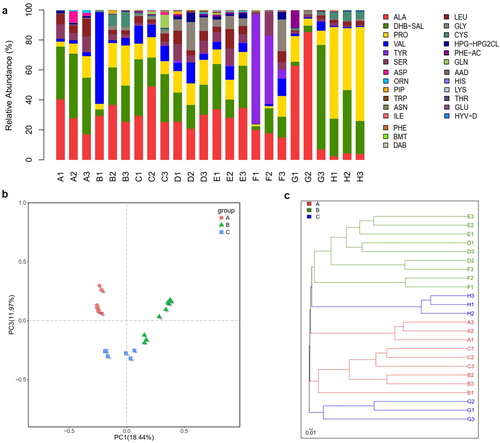
The animal gut microbiome is rich in genetic resources and is shaped by the long-term evolution of the animal’s genetic background and its dietary characteristics. The classification of the animals included in this study into herbivore, omnivore and carnivore groups was based on dieting habits and natural history. Previous studies have shown that the gut microbiota of animals is species-specific, and dietary structure factors play an important role [Citation7, Citation13]. In the analyses of NRPS gene clusters relationship between the gut microbiota of the 24 faeces samples from herbivores, carnivores and omnivores, we used principal coordinate analysis (PCoA) to examine the NRPS domain gene cluster structures. On the PCoA plot, each symbol represents an NRPS domain OTU structure in one faecal sample (). The structures of the NRPS domain in herbivores and carnivores are clustered separately along principal coordinate axis 1 (PC1), which explained the largest amount of variation (18.44%); and the NRPS domain gene cluster structure of omnivores located between the herbivores and carnivores. Then, we used Bray-Curtis distances to evaluate the revolution of NRPS gene clusters in the gut microbiome from the 24 animals, which were represented by a dendrogram (). Each branch on the tree represented one sample of NRPS gene cluster. The clustering analyses showed that overall, the evolution of the NRPS gene domains clustered on different branches according the host phylogeny and diet habits. Interestingly, the PCoA and clustering results were consistent with the bacterial community analysis, which indicated that the host phylogeny and diet habits would influence the NRPS domain gene cluster structure in their gut microbiome.
Natural products discovery and co-evolution
A large number of metabolites are produced by the gut microbiome of animals. These metabolites mediate significant interactions and physiological functions with the host [Citation15–17]. There are numerous gene clusters and distinct bioactive compounds yet to be explored [Citation18]. The human microbiome is well known for producing a diversity of bioactive natural products [Citation17, Citation19,Citation20]. The obtained sequence data of the NRPS gene clusters in the gut microbes of different species of animals can serve as a foundation to explore this fascinating resource and accelerate the discovery of natural products from the animal gut microbiome. The results show that the animal gut microbiome contains abundant secondary metabolic synthesis gene clusters which are worthy of deeper analysis.
The study of the diversity of the secondary metabolite gene clusters is not only helpful for discovering new natural products, but also useful for better understand the co-evolution of the hosts and their microbiome [Citation17]. Co-evolution of host and microbiome has been hypothesized to occur in animal species [Citation21,Citation22]. The development of the host system allows the whole gut community to be transmitted vertically, and the characteristics of the whole community endow the host with adaptive advantage [Citation23]. The results of this study showed that the host phylogeny influenced the bacterial composition, and that animals of similar dieting habits have more similar gut microbiota community structure. Consistent with the bacterial community analysis, the evolution of the NRPS gene domains clustered on different branches according to the host phylogeny and diet type. These findings open the door not only to the potential discovery of small molecules with therapeutic activity, but also may provide a clue for bettering understanding of the co-evolution of animal hosts and their microbiome. Further studies are needed to explore the full potential of the animal gut microbiome as a source of valuable bio-active compounds.
Limitations
This study has some limitations. To be more objective, the limited samples from animals with different dieting habits may not exactly show the characteristics of their gut microbiota. Future studies with a larger number samples are necessary to determine the co-revolution of host and their gut microbiome. Another point is that, as our samples were obtained from zoo animals, it could not be confirmed here whether there were any differences from the microbiomes of wild animals. Within the limitations of this study, however, our results suggested the existence of interaction between host microbiome phylogeny and dieting habits. The animal gut microbiome contains abundant NRPS gene clusters, which support the suggestion that the gut microbiome is a promising source of novel bioactive natural products.
Conclusions
Our research characterized the gut microbiota in different herbivores, carnivores and omnivores, and found that, based on the 16S rDNA sequencing analysis, the gut microbiota of these herbivores, carnivores and omnivores were clustered differently. We also investigated the potential NRPS gene cluster abundance distribution in the animal gut microbiome, and our results supported the suggestion that the secondary metabolic biosynthetic gene clusters co-diversified with their gut microbiome. Future studies into the animal gut microbiome raise hopes for the discovery of new promising sources of bioactive natural products.
Ethical approval
All applicable international, national, and/or institutional guidelines for the care and use of animals were followed.
Contributions
Conceived and designed the experiments: Can Song, Performed the experiments: Xiurong Guo, Can Song and Hui Lei, Contributed reagents/materials/analysis tools: Can Song, Kailian Zhang and Famin Ke, Wrote the paper: Can Song. All authors reviewed the manuscript.
Supplemental Material
Download PDF (1.3 MB)Disclosure statement
The authors declare no competing financial interests.
Data availability
The raw 16S rRNA sequences supporting the results of this study are available in the GenBank Database under the accession number PRJNA631813.
Additional information
Funding
References
- Wang L, Ravichandran V, Yin Y, et al. Natural products from mammalian gut microbiota. Trends Biotechnol. 2019;37(5):492–504.
- Rooks MG, Garrett WS, Gut microbiota, metabolites and host immunity. Nat Rev Immunol. 2016;16(6):341–352.
- Kau AL, Ahern PP, Griffin NW, et al. Human nutrition, the gut microbiome and the immune system. Nature. 2011;474(7351):327–336.
- Koppel N, Balskus EP, Exploring and understanding the biochemical diversity of the human microbiota. Chem Biol. 2016;23(1):18–30.
- Mousa WK, Athar B, Merwin NJ, et al. Antibiotics and specialized metabolites from the human microbiota. Nat Prod Rep. 2017;34(11):1302–1331.
- Donia MSA, Fischbach MA , Human microbiota. Small molecules from the human microbiota. Science. 2015;349(6246):1254766.
- Ley RE, Hamady M, Lozupone CA, et al. Evolution of mammals and their gut microbes. Science. 2008;320(5883):1647–1651.
- Lemetre C, Maniko J, Charlop-Powers Z, et al. Bacterial natural product biosynthetic domain composition in soil correlates with changes in latitude on a continent-wide scale. Proc Natl Acad Sci USA. 2017;114(44):11615–11620.
- Dejong CA, Chen GM, Li H, et al. Polyketide and nonribosomal peptide retro-biosynthesis and global gene cluster matching. Nat Chem Biol. 2016;12(12):1007–1014.
- Song C, Wang B, Tan J, et al. Comparative analysis of the gut microbiota of black bears in China using high-throughput sequencing. Mol Genet Genomics. 2017;292(2):407–414.
- Ayuso-Sacido A, Genilloud O, New PCR primers for the screening of NRPS and PKS-I systems in actinomycetes: detection and distribution of these biosynthetic gene sequences in major taxonomic groups. Microbial Ecol. 2005;49(1):10–24.
- Knudsen M, Søndergaard D, Tofting-Olesen C, et al. Computational discovery of specificity-conferring sites in non-ribosomal peptide synthetases. Bioinformatics. 2016;32(3):325–329.
- Gaulke CA, Arnold H, Humphreys IR, et al. Ecophylogenetics clarifies the evolutionary association between mammals and their gut microbiota. Mbio. 2018;9(5):e01348-18.
- Youngblut ND, Reischer GH, Walters W, et al. Host diet and evolutionary history explain different aspects of gut microbiome diversity among vertebrate clades. Nat Commun. 2019;10(1):1–15.
- Dornisch E, Pletz J, Glabonjat RA, et al. Biosynthesis of the enterotoxic pyrrolobenzodiazepine natural product tilivalline. Angew Chem. 2017;56(46):14753–14757.
- Guo C, Chang FY, Wyche TP, et al. Discovery of reactive microbiota-derived metabolites that inhibit host proteases. Cell. 2017;168(3):517–526.
- Milshteyn A, Colosimo DA, Brady SF, Accessing bioactive natural products from the human microbiome. Cell Host Microbe. 2018;23(6):725–736.
- Lam YC, Crawford JM, Discovering antibiotics from the global microbiome. Nat Microbiol. 2018;3(4):392–393.
- Hug JJ, Krug D, Müller R, Bacteria as genetically programmable producers of bioactive natural products. Nat Rev Chem. 2020;4(4):172–122.
- Gilbert JA, Blaser MJ, Caporaso JG, et al. Current understanding of the human microbiome. Nat Med. 2018;24(4):392–400.
- Moeller AH, Caro-Quintero A, Mjungu D, et al. Cospeciation of gut microbiota with hominids. Science. 2016;353(6297):380–382.
- Groussin M, Mazel F, Sanders JG, et al. Unraveling the processes shaping mammalian gut microbiomes over evolutionary time. Nat Commun. 2017;8(1):14319.
- Ley RE, Peterson DA, Gordon JI, Ecological and evolutionary forces shaping microbial diversity in the human intestine. Cell. 2006;124(4):837–848.