
 ?Mathematical formulae have been encoded as MathML and are displayed in this HTML version using MathJax in order to improve their display. Uncheck the box to turn MathJax off. This feature requires Javascript. Click on a formula to zoom.
Abstract
Broad bean sauce with chili (BBSC) is a traditional condiment in Guizhou province of China. In order to solve some problems especially lack of dominant strains during the fermentation of BBSC, enzyme-producing strains were screened and identified from BBSC. The counts of bacteria, yeasts and molds achieved a relative equilibrium at the later period of fermentation, with more than 2.6 × 10⁴ CFU/mL. There were 97 dominant strains obtained through isolation and purification. Besides, 16S rDNA, ITS, and 26S DNA sequences were analyzed in combination with morphological classification. The protease and peptidase activity of bacteria was significantly higher than those of yeast and molds (p < 0.05). The protease activity values of three strains were up to 137.040 U/mL, 165.560 U/mL and 103.290 U/mL, respectively. The strains could grow both in low acid and high salt environment (at pH 3 and NaCl 18%) and the number of viable bacteria could still remain more than 3.41 × 10⁷ CFU/mL. They all showed sensitivity or high sensitivity to six kinds of commonly used antibiotics (piperacillin, erythrocin, sulfamethoxazole, norfloxacin, chloramphenicol and amikacin). So they could be used as safe fermentation strains which could facilitate upgraded industrial BBSC productions and make a controlled fermentation instead of the traditional process.
Introduction
Broad bean (Vicia faba L.) paste is a traditional sauce made by fermentation of koji (which is used as a starter and made of Aspergillus oryzae) microorganisms with broad bean, wheat flour and salt as main raw materials [Citation1]. Koji mold is the filamentous fungus of Aspergillus oryzae which is widely used in some Asian countries like China and Japan for producing traditional foods (soybean paste, rice wine and soy paste) which need fermentation. The broad bean paste is famous for its bright color, moist, fragrant, fresh, spicy and mellow, thick and fluffy body. Such properties could enhance the color, aroma and tastes of the dishes. It is the essential ingredient in Sichuan–Guizhou of China especially for cuisine cooking and seasonal hotpot processing, and it is also called the soul of Sichuan cuisine [Citation2]. The fermentation of bean paste is complex, and its special flavor cannot be separated from the function of microorganisms. In the fermentation stage, enzymes such as protease, amylase, cellulase and peptidase are produced during the growth and reproduction of microorganisms to decompose proteins, starch and other present components into smaller molecules, such as polypeptides, free amino acids (FAAs) and simple sugars [Citation3,Citation4]. This plays a vital role for developing the flavor and colors of the BBSC. Research has shown that in the later stage of Douban (shelled and boiled broad bean) fermentation, the yeast, bacteria and their enzymes in the fermentation system could further decompose and synthesize amino acids, organic acids and sugars with the production of final products with various flavored substances [Citation5,Citation6].
Traditionally, microbial compositions have been isolated through different culture media which could provide various quantitative data and isolation of true cultures for expressing physiological scopes [Citation7]. This method could reveal several culturable microorganisms. Recently, some advanced technologies like ‘next generation sequencing technology’ are widely used for better sequencing of microbes composition from different fermented foods [Citation8,Citation9]. Another study has revealed that microorganisms play an important role for the formation of flavor in traditional fermented food, and some of them can promote the formation of products of quality such as Bacillus spp., Lactobacillus spp. and yeast [Citation10]. However, there are only limited reports on microbial composition and screening of enzyme-producing strains. Hence, it is very important to screen, isolate, and identify the dominant strains from BBSC.
The aim of this study was to isolate, screen, and identify the dominant strains from the traditional BBSC. The results could give insight into the process and provide excellent strains for batch production and the basic theoretical basis for industrial applications to improve the taste, flavor and quality of BBSC.
Materials and methods
Materials
The samples were sourced from Zunyi Pepper food Factory (factory identity number is 9152039021481638XL), Guizhou, China. All samples were naturally fermented. The samples were numbered and classified according to the length or sequence of fermentation time. The broad bean koji sample (broad beans had the filamentous fungus of Aspergillus oryzae) marked as ‘Cq’ whereas, ‘Ch’ was used for the fermented chilli (one month duration), ‘Bb’ was marked for fermented broad bean (broad bean koji sample was added with salt and fermented for two months duration), ‘Sf’ was the sample of semi-finished BBSC (chilli was mixed with broad bean according to 2:1 ratio and fermented for an 1-month period of time), ‘Cb’ was a sample of fermented BBSC (chilli and broad bean were mixed and fermented for 6 months). The samples were strictly prepared in accordance with GB/T 4789.22-2003 procedure [Citation11,Citation12].
Medium and reagents
Different media were used for this experiment such as PCA (plate count agar), PDA (potato dextrose agar), nutritive agar, high salt Czeslaw medium, glucose peptone medium, bacterial fermentation medium, fungal seed liquid medium and fungal fermentation medium. All of these media were made by Land Bridge (Beijing, China). Folin–phenol reagent, tyrosine, casein and soluble starch were from Sigma-Aldrich (St. Louis, MO, USA), Gram stain was made by Thermo Fisher Scientific (Waltham, MA, USA), 3,5-dinitrosalicylic acid, l-alanine, pyruvic acid, ninhydrin pyridoxa, 5-phosphate, hexadecyl trimethyl ammonium bromide, MgSO4.7H2O and other sugars, including glucose, galactose, cottonseed sugar, xylose, sucrose, maltose, mannitol and sorbitol, were used as the reagents purchased from Phygene (Fuzhou, China).
Investigation of microflora in the samples
The presence of different microorganisms (the colonies of bacteria, yeast and mold) in the samples was determined by the colonogenic assay. Colonies were counted according to the Chinese standard (GB/T4789.1-2016) [Citation13].
Isolation, purification and preservation of dominant strains
Diluted solution sample (1 mL) was poured into sterilized agar plates, then cultured medium was poured into it to be blended. The diluted samples in the medium were incubated at 37 ± 1 °C or 28 ± 1 °C for 24 or 48 h, respectively, after solidification. Then a single colony was picked for the separation and purification, and these steps were repeated 3–5 times until the purified strains were obtained. Finally, purified strains were preserved by PCA and PDA tube slants, under 4 °C to use later.
Identification of dominant strains
The purified strains were identified by morphological, ecological, physiological and biochemical tests for identification. The identification of bacterial morphology was carried out according to the eighth edition of Bergey's Manual of Systematic Bacteriology [Citation14]. The classification and identification of molds were carried out according to GB/T 4789.1-2016 [Citation13]. Molecular identification of the bacteria was done on the basis of 16S rDNA-based molecular technique [Citation15]. DNA was isolated from the bacterial cultures and its quality was evaluated in 0.8% agarose gel. Isolated DNA was amplified with 16S rDNA specific primers (7F&1540R) using Veriti® 99 well thermal cycler (Model No. 9902). Molecular identification of the yeasts and molds was done on the basis of 26S rDNA and 18S rDNA, respectively. Yeast and mold DNA was extracted with the Ezup Column Yeast Genomic DNA Purification Kit and Ezup Column Fungi Genomic DNA Purification Kit, respectively. The primers for yeast were NL-1 (GCATATCAATAAGCGGAGGAAAAG), NL-4 (GGTCCGTGTTTCAAGACGG). The primers for molds were ITS1 (GTCGTAACAAGGTTAACCTGCGG), ITS4 (TCCTCCGCTTATTGATATGC), NS1 (GTAGTCATATGCTTGTCTC) and NS6 (GCATCACAGACCTGTTATTGCCTC). Polymerase chain reaction (PCR) was conducted in reference to the literature [Citation16] with some modifications. All PCR products were sent to Sangon Biotech (Shanghai, China) Co., Ltd. for sequencing. The DNA sequences were submitted to the GenBank database and then the sequence homologies were analyzed using the BLAST retrieval system (http://www.ncbi.nlm.Gov/Blast/) of NCBI.
Screening of protease-producing strains
The protease-producing strains were screened according to the Chinese standard SB/T 10317-1999 with a slight modification.
Preparation of tyrosine standard curve
A standard curve was obtained based on measurements of 0–100 μg/mL tyrosine solutions. The absorbance was measured with an enzyme marker at the wavelength of 660 nm by a microplate reader (MoLecuLar Devices SPECTRA MAX 190 microplate reader which was made by Kunming Nairui Technology Co. LTD). The regression equation of the standard curve of tyrosine was y = 0.010x‒0.001, R2=0.9997 (see the Supplementary Appendix).
Preparation of enzyme solution
Exponential phase cultures were added as 2% inoculum (viable count reaching about 108 CFU/mL) to the fermentation medium (included soybean flour 3 g, soluble starch 1 g, glucose 0.5 g, KH2PO4 0.03 g, Na2HPO4 0.4 g, NaCl 0.5 g, distilled water 100 mL; in 50 mL/250 mL volumetric flasks) and incubated on a shaking table for 160 rpm (revolutions per minute). The bacteria were cultured for 48 h and the molds for 96 h and then were transferred to 50-mL centrifuge test tubes and centrifuged (10,000 rpm by high-speed centrifuge (TG16-WS, Changzhou Longyue Instrument Manufacturing Co. LTD, China) to collect the liquid supernatant individually called crude enzyme solution (namely extracellular (secreted) protease in the cell-free culture broth). The as-prepared solution was then stored in refrigerators for preservation at 4 °C.
Determination of protease activity
The protease activities were investigated according to the procedure described previously [Citation15–18]. As a substrate, the casein solution was preheated in a water bath at constant temperature (40士2 °C) for 5 min. Crude enzyme (1 mL) was also preheated in a water bath at 40士2 °C for 5 min, then 1 mL, 2% casein solution was added and reacted at 40士2 °C for 10 min. After that, 2 mL, 0.4 mo1/L trichloroacetic acid was added to stop the reaction which was mixed and centrifuged properly. Then, 1 mL supernatant was added into the test tube. Besides 5 mL, 0.4 mo1/L sodium carbonate solution and 1 mL diluted Folin phenol reagents were added and mixed well; the reaction was carried out in a water bath at 40士2 °C for 20 min. Finally, distilled water was added to 20 mL volume and the optical density was determined at 600 nm (OD660 nm) with a microplate reader.
Under the above conditions, enzyme activity [EquationEq. (1)(1)
(1) ] was defined under certain reaction conditions. The amount of enzyme required to produce the equivalent of 1 g tyrosine per milliliter of sample per minute.
(1)
(1)
where K is the absorption constant obtained from the standard curve of tyrosine (K = 97), OD1 is the absorbance value of the sample, OD2 is the absorbance value of the sample of ck (control check), N is the dilution ratio, V the total volume of reagents, and T is the reaction time.
Screening of amylase producing strains
Preparation of maltose standard curve
Regression analysis was applied for maltose concentration with the procedure described in different researches [Citation19–21]. Reagents were added to sterile test tubes (20 mL). Standard maltose solution in the concentration range of 0‒2 mg/mL were added to 2 mL of 3,5-dinitrosalicylic acid reagent (each concentration with 3 parallel solutions) which were mixed thoroughly to boil in a water bath for 5 min. After cooling, distilled water was added to 20 mL volume. Finally, the absorbance at 520 nm was measured. According to the absorbance, the regression equation for the content of maltose was determined.
Preparation of crude enzyme solution
The crude enzyme solution was prepared according to the procedure described above.
Determination of amylase activity
Amylase activity was determined as described in [Citation22]. First, sterile test tubes (20 mL) were prepared, through adding 1 mL crude enzyme solution, 1 mL (2% soluble starch) and 3 mL distilled water; which was preheated in a water bath at 60 °C for 5 min. After that, 1 mL (0.1 mol/L) citrate buffer solution (pH 6.0) was added and heated in another water bath at 60 °C for 30 min followed by 1.5 mL 3,5-dinitrosalicylic acid, which was added and boiled for 5 min. After that, the solution was cooled and distilled water was added to make the volume 20 mL. Finally, the absorbance was determined at 520 nm by a microplate reader.
Amylase activity was defined as the enzyme activity represented by a maltose unit (MMU), which is the amount of enzyme required to release 1 mg maltose per unit volume sample at 30 min under the above conditions.
Screening of extracellular peptidase-producing strains
Determination of leucine standard curve
Leucine standards were determined by the procedure of Zeng et al. [Citation23]. Briefly, 20 mL plug-scale test tubes were prepared to add various reagents according to reference. The reaction mixtures were mixed thoroughly and were heated in a boiling water bath at 100 °C for 15 min. After fast cooling, 5 mL (95% ethyl alcohol) was added and the tubes were shaken continuously until turning purple from a colourless state. Again, 60% ethyl alcohol was added in a volumetric flask to 20 mL. Finally, the absorbance of the solution was determined at a wavelength of 570 nm; a standard curve was drawn to obtain the linear equation.
Preparation of crude enzyme solution
The crude enzyme solution was prepared as described above.
Determination of peptidase activity
The reaction mixture contained 1 mL of the prepared peptidase solution and 1 mL of sterile soybean peptide solution with a mass concentration of 2 g/100 mL, which was reacted in 3 mL (pH 7.5) Tris–HCl buffer solution overnight. Finally, the total amount of free amino acids was determined [Citation24].
Calculation of total free amino acids
The concentration of total free amino acids was also determined [Citation23,Citation25] according to EquationEquation (2)(2)
(2) . Briefly, 1 mL of the reaction solution was put into 20 mL dry plug scale test tube and 1 mL ammonia-free distilled water was added. The other steps were the same as those described for making a standard regression curve. According to the absorbance of the chromogenic solution, the corresponding amount of amino acid was detected on the standard curve. The total amount of free amino acids in the reaction system was expressed as the content of amino acid (mg) per 100 mL of the reaction solution.
(2)
(2)
where m1 is the mass (g) of amino acid obtained from the standard curve (μg), V is the total volume of sample extract (mL), Vs is the liquid volume of the sample taken during determination (mL), m is the mass of the sample (g).
Acid and salt resistance of high enzyme-producing strains
Photoelectric turbidimetry was used for the determination of the changes in optical density (OD) value of the bacterial strain before and after culture at the corresponding pH value and NaCl according to the procedure described previously [Citation26]. The total number of bacterial colonies (CFU/mL) under the corresponding turbidity was calculated by a plate-counting method. The acid resistance of the blank tube was determined for culture at 0 h time interval.
Antibiotic sensitivity of high enzyme producing strains
Piperacillin, chloramphenicol, amikacin, erythrosin, norfloxacin and cotrimoxazole were used as antibiotics to assess the sensitivity of enzyme producing strains [Citation27–29]. A plate sheet method was used whilst the sterile operation was attached to the surface of the medium coated with the tested bacteria. After 24 h of culture, the diameter of the bacteriostatic circle was measured and recorded according to the standard.
Statistical analysis
Data are presented as average values of triplicate measurements. All the results are presented as means with standard deviation (±SD). Statistical analyses were carried out using statistical product and service solutions (SPSS) 17.0 software.
Results and discussions
Microflora of BBSC
The bacteria, yeast and mold colonies of the samples (sampling time <3 h) were counted using selective media to determine the distribution of microorganisms at different fermentation stages of traditional BBSC. In this test, five samples in different fermentation stages of traditional BBSC were selected as research materials: Cq, Ch, Bb, Sf and Cb. The results are shown in and .
Figure 1. The microbial strains from different fermentation stages of traditional BBSC.
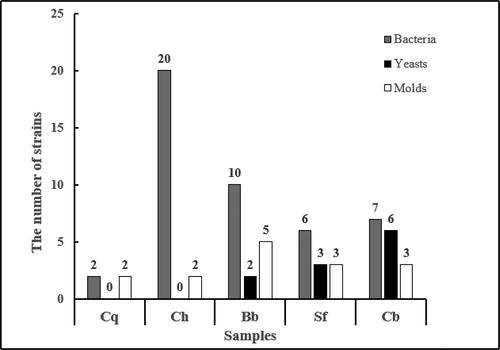
Table 1. Total change of the colony forming units from different fermentation stages of traditional BBSC (CFU/g).
Through the microbial flora investigation of traditional BBSC samples in different fermentation stages, there exist various types of microorganisms such as bacteria and molds enriched with microbial flora but the yeast population in the koji making stage is very small. It is found that in the separated fermentation period of chilli and Douban bacteria are the dominant. As the fermentation continues, when entering the post-fermentation period; the three types of microbial flora of bacteria, yeasts and molds were relatively balanced and the number of viable bacteria reached ≥ (1.5 ± 0.032)×104 CFU/g. This is consistent with the research by Xu et al. [Citation29] that in different stages of fermented bean paste, the presence of dominant microorganisms are different. In the stage of koji making, aspergillus has an absolute advantage. The high salt and water shortage environment is not conducive to the reproduction of molds and salt-tolerant bacteria and yeasts can grow and metabolize in this environment.
Isolation and identification of dominant strains
Classification and identification of bacteria
Morphological observation
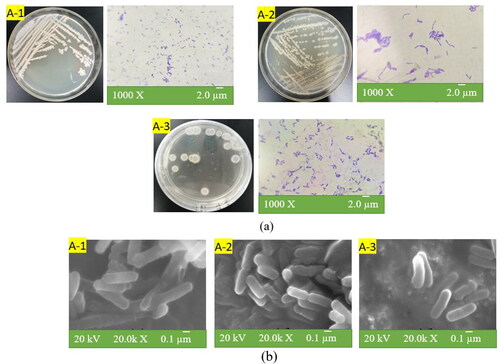
A total of 14 bacillus were isolated from five samples Cq, Ch3, Bb1, Sf3, and Cb2 of traditional BBSC at different fermentation stages (of which 5 strains were isolated from Ch and 3 were isolated from Bb, 4 strains from Sf, and 2 strains from Cb). The colony morphology and cell morphology of 14 strains on nutrient agar plates are shown in . These bacteria were gram positive. It can be inferred from scanning electron micrographs as shown in that all of them were Bacillus spp. As shown in , representative strains A-1, A-2 and A-3 are all rod-shaped. Except for the ‘Ch’ sample, these three strains with high enzyme activity (A-1, A-2, and A-3) could be isolated from another four samples (Cq, Bb, Sf, and Cb).
Figure 2. Morphological observation of bacillus: colony and cell morphology of strains (a); scanning electron microscopy of cells (b).
Physiological and biochemical characterization
The physiological and biochemical characteristics of strains A-1, A-2, and A-3 are shown in . All three strains can decompose glucose and sucrose to produce acid, but not lactose and sorbitol. The H2S test and sorbitol tests are negative. The contact enzyme, oxidase, methyl red and VP (Voges and Proskauer) reactions of strains A-1 and A-2 are positive, while strain A-3 is negative; strain A-1 can decompose urea and utilize maltose, while strains A-2 and A-3 cannot use urea and cannot decompose maltose; strains A-1 and A-2 cannot hydrolyze starch, and strain A-3 can decompose starch.
Table 2. Physiological and biochemical characteristics of each bacterial strain.
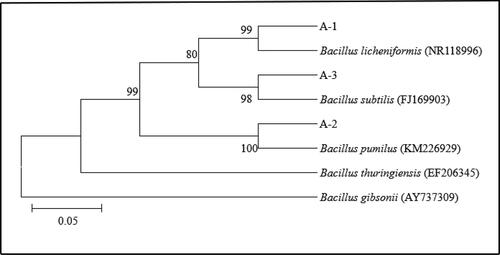
Sequence analysis of 16S rDNA
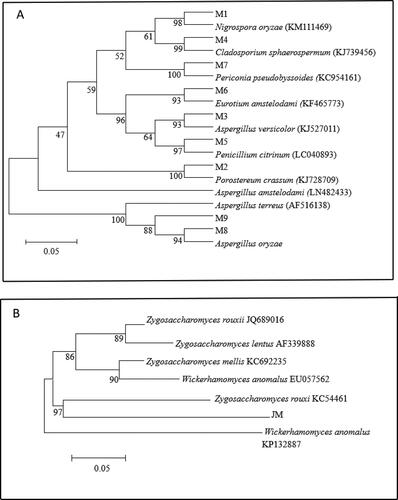
The purified strains were sequenced by 16S rDNA. The sequencing results were compared against the ribosome database [Citation30]. The 16S rDNA of strains A-1, A-2 and A-3 were amplified by PCR to obtain bands of 1483 bp, 1471 bp and 1429 bp, respectively. The sequence similarity was compared in the ribosome database and the phylogenetic tree was constructed. Based on the morphological, physiological and biochemical characteristics, and phylogenetic tree of the strains (shown in ), strain A-1, strain A-2 and strain A-3 were identified as Bacillus licheniformis, Bacillus pumilus and Bacillus subtilis, respectively.
Figure 3. The 16S rDNA phylogenetic tree of strains.
Identification of fungi
Morphological observation of yeasts
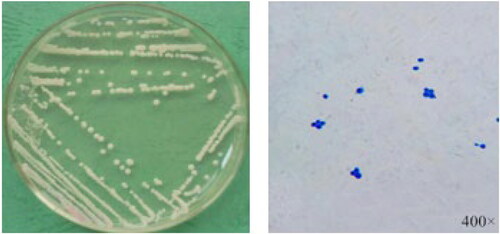
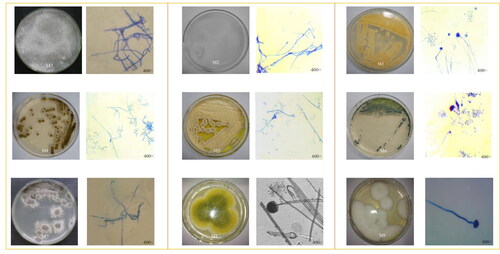
Three yeast isolates were obtained from three different samples (Bb, Sf and Cb). The three isolates belonged to one genus. These isolates were inoculated on the PDA medium and cultured at 28 °C for 2–3 days to form colonies. A colony of the isolates on the PDA was picked and stained to observe the cell morphology as shown in .
Figure 4. The colony morphology and cell morphology of some isolate.
Morphological observation of molds
The molds in the samples were separated and purified using high salt Czeslaw medium. A total of 21 mold strains were isolated: 5 in Ch, 7 in Bb, 5 in Sf and 4 in Cb. The isolated and purified strains were inoculated on high salt Czeslaw medium, and the colony morphology and hyphae morphology of molds were observed after culturing at 28 °C for 2–3 days, as shown in .
Figure 5. The colony morphology and cell morphology of molds: Nigrospora oryzae (M1); Porostereum crassum (M2); Aspergillus versicolor (M3); Cladosporium sphaerospermum (M4); Penicllium citrinum (M5); Eurotium amstelodami (M6); Periconia pseudobyssoides (M7); and Aspergillus oryzae (M8, M9).
Physiological and biochemical characterization of yeast
After the morphological observation of yeasts, they were classified according to the morphology, and the representative Bb1-2, Sf3-4 and Cb2-2 strains which were selected for physiological and biochemical tests, are listed in . These strains can completely assimilate glucose and maltose after 24 h, while they cannot decompose both xylose and raffinose. They showed a weaker absorption on another three sugars including galactose, lactose, and sucrose.
Table 3. The physiological and biochemical characteristics of yeast.
Molecular identification of yeast and molds
The purified yeast and mold species were subjected to 26S rDNA sequencing and 18S rDNA () sequencing, respectively. The strain of yeast (these three isolates belonged to one and the same genus, and were named ‘JM’) was identified as yeast genus Z. rouxii (Zygosaccharomyces rouxii), 9 strains of molds were classified as Nigrospora oryzae (M1), Porostereum crassum (M2), Aspergillus versicolor (M3), Cladosporium sphaerospermum (M4), Penicllium citrinum (M5), Eurotium amstelodami (M6), Periconia pseudobyssoides (M7) and Aspergillus oryzae (M8 and M9).
Figure 6. Phylogenetic trees: 26S rDNA phylogenetic trees of molds (a) and 18S rDNA phylogenetic trees of yeasts (b).
Screening of protease-producing strains
Preliminary screening of protease-producing strains
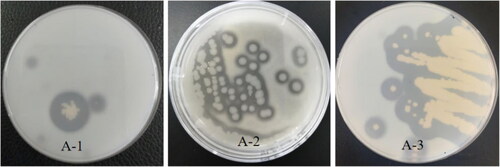
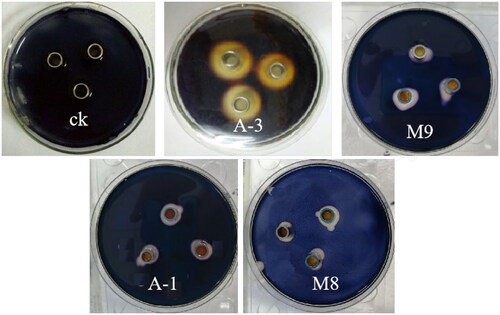
The strains were inoculated on a skim milk medium at 37 ± 1 °C or 28 ± 1 °C for 24 h or 48 h, respectively, as shown in . Some strains formed a proteolytic circle around the colonies. Three strains can produce a certain size of protein hydrolysis circle. Among them, the R value (the ratio of hydrolytic circle diameter to colony diameter) of strain A-3 was over 4. The R values of strains A-1 and A-2 were more than 1. The molds M3, M5, M6, M8 and M9 also showed ability to produce protease.
Figure 7. Parts of proteolytic hydrolysis circle diagrams of protease-producing strains. A-1, A-2, and A-3 (hydrolysis circle).
Determination of protease activity
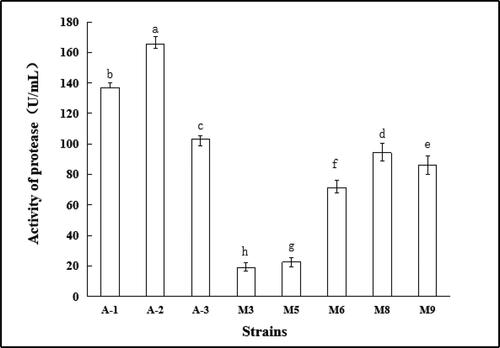
The Folin method was used to quantitatively determine the activity of the crude enzyme solution of the strains. As shown in , there was a significant difference in the activity of protease produced by each strain (p < 0.05). The protease activity of the bacterial strains was generally stronger than that of molds. The protease activity of strain A-2 was the strongest (165.56 U/mL), followed by A-1 (137.04 U/mL) and A-3 (103.29 U/mL).
Figure 8. Protease activity of strains. Note. Different letters indicate significant differences (P < 0.05).
Screening of strains producing amylase
Preliminary screening of amylase-producing strains
After placing the prepared crude enzyme solution on a soluble starch plate placed in a sterile Oxford cup for overnight cultivation, iodine solution was added dropwise. The hydrolysis circle diagram of the strain A-3 crude enzyme solution is shown in . The effect was visible. In addition to bacterial strain A-1, some molds (M8, M9, etc.) also showed a certain amylase capacity.
Figure 9. Starch hydrolysis circles of amylase-producing strains.
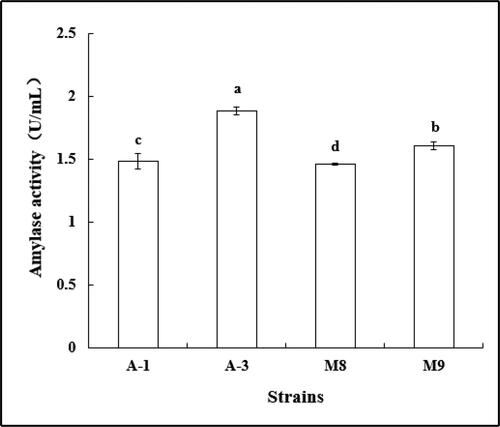
Determination of amylase activity
According to the size of the starch hydrolysis circle in the Oxford Cup initial screening, bacteria (A-1 and A-3) and fungi (M8 and M9) all produced amylase as shown in . The activity of amylase produced by strain A-3 was significantly higher than that of other strains (p < 0.05), reaching 1.887 U/mL. The activity of amylase produced by strain A-1 was not significantly different from that of strain M8, with an average of 1.498 U/mL.
Figure 10. Amylase activity of strains. Note. Different letters indicate significant differences (P < 0.05).
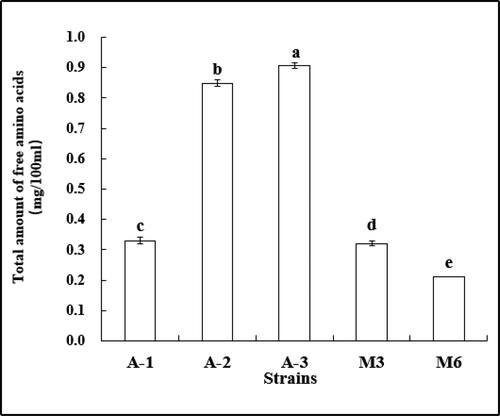
Screening of peptidase-producing strains
As shown in , bacteria (A-1, A-2 and A-3) and fungi (M3 and M6) can produce extracellular peptidase. There were statistically significant differences between the activities of peptidase produced by different strains. Strain (A-3) showed the highest peptidase activity (0.906 mg/100 mL), followed by A-2 (0.849 mg/100 mL), and A-1 0.330 mg/100 mL. Some fungal strains (M3 and M6) showed lower peptidase activity. Overall, the extracellular peptidase activity of the bacterial strains was significantly higher than that of fungi. The peptidase activity of strains A-3 and A-2 in this test was significantly higher than that of the high-peptidase yeast strain (0.669 mg/100 mL) determined by Li et al. [Citation30] in 2010.
Figure 11. Peptidase enzymatic activity of strains. Note. Different letters indicate significant differences (P < 0.05).
Qualitative and quantitative analysis of the protease, amylase and peptidase activities of the dominant strains that were isolated and identified from traditional BBSC revealed that the activity of protease and peptidase of bacterial strains (A-1, A-2 and A-3) were all higher than those of mold and the strains were rich in enzyme systems. It can be used as a high-enzyme activity aging-promoting strain in traditional BBSC of post-fermentation to explore the correlation between the formation of flavor and microorganisms and their enzyme systems, so as to achieve the rapid maturity and provide a theoretical basis for the production of BBSC.
Acid tolerance of high-enzyme-producing strains
As the pH value decreased, the number of viable bacteria of each strain also decreased to a certain extent (). But when the pH value dropped to 3, the number of viable bacteria still reached ≥ 3.41 × 10⁷ CFU/mL, indicating that all three enzyme-producing strains have acid tolerance even at pH 5 and 6 conditions. The viable cell counts of each strain were high, indicating that these enzyme-producing bacteria remain viable and can grow well in such acidic environment.
Table 4. Acid resistance of strains.
Salt tolerance of high-enzyme-producing strains
The viable cell counts decreased in a NaCl-concentration-dependent manner, with the increase in NaCl content (). The salt tolerance of the strains ranked as follows: A-2 > A-3 > A-1, and all the strains showed some salt tolerance. However, in 18% NaCl environment, the number of viable bacteria of strain A-1 decreased to 8.73 × 10⁷ CFU/mL. For analysis, it may be due to the fact that these strains are themselves derived from the high-salt environment of the bean paste hot sauce system, so they have grown in such habitats for a long time and exhibited significant salt tolerance.
Table 5. Salt tolerance of different strains.
Antibiotic susceptibility of high enzyme-producing strains
The three tested bacterial strains showed varying degrees of sensitivity to six common antibiotics ().
Table 6. Antibiotic susceptibility of strains.
They are particularly sensitive to sulfonamides, macrolides, quinolones and aminoglycoside antibiotics. This indicates that none of the three strains contains drug-resistant plasmids for commonly used antibiotics, so there is possibly no risk of passing drug-resistance genes to the intestinal flora. They were considered to be safer strains. This is consistent with the findings reported by Zeng et al. [Citation31] that drug-resistant strains have the risk of transmitting drug-resistance genes to the intestinal flora through plasmids, thereby causing important impacts on human health. Therefore, the three high-enzyme producing strains are safe to use as fermentation agents.
Conclusions
Through the investigation of the microflora of traditional BBSC, this study identified many bacteria, yeasts and molds which were involved in the fermentation. The dominant bacteria present in each stage are not consistent, different bacterial species are dominant at each stage of the fermentation. The study identified three strains of bacteria, one strain of yeast and nine strains of molds, in which the enzyme activities of bacteria (A-1, A-2 and A-3) were significantly higher than those of the yeast and mold. All three high-enzyme-producing bacterial strains can tolerate an acidic environment with a pH of 3. All three high-enzyme live strains can tolerate a concentration of 18% NaCl. All strains are sensitive against commonly used antibiotics, so they could be termed as safe fermentation strains; which could facilitate the industrial manufacturing of BBSC significantly.
Supplemental Material
Download PDF (147.2 KB)Data availability statement
All data that support the findings of this study are available from the corresponding authors upon reasonable request.
References
- Li Z, Rui J, Li X, et al. Bacterial community succession and metabolite changes during Doubanjiang–Meju fermentation, a Chinese traditional fermented broad bean (Vicia faba L.) paste. Food Chem. 2017;218:534–542.
- Li X, Zhao C, Zheng C, et al. Characteristics of microbial community and aroma compounds in traditional fermentation of Pixian broad bean paste as compared to industrial fermentation. Int J Food Prop. 2017;20(sup3):S2520–S2531.
- Liu J, Li D, Hu Y, et al. Effect of a halophilic aromatic yeast together with Aspergillus oryzae in koji making on the volatile compounds and quality of soy sauce moromi. Int J Food Sci Technol. 2015;50(6):1352–1358.
- Lee SH, Jung JY, Jeon CO. Effects of temperature on microbial succession and metabolite change during Saeu-Jeot fermentation. Food Microbiol. 2014;38:16–25.
- Liu P, Xiang Q, Sun W, et al. Correlation between microbial communities and key flavors during post-fermentation of Pixian broad bean paste. Food Res Int. 2020;137:109513–109513.
- Tang J, Chen T-t, Hu Q, et al. Improved protease activity of Pixian broad bean paste with cocultivation of Aspergillus oryzae QM-6 and Aspergillus niger QH-3. Electron J Biotechnol. 2020;44:33–40.
- Motato KE, Milani C, Ventura M, et al. Bacterial diversity of the Colombian fermented milk “Suero Costeño” assessed by culturing and high-throughput sequencing and DGGE analysis of 16S rRNA gene amplicons. Food Microbiol. 2017;68:129–136.
- Park E-J, Chun J, Cha C-J, et al. Bacterial community analysis during fermentation of ten representative kinds of kimchi with barcoded pyrosequencing. Food Microbiol. 2012;30(1):197–204.
- Lu Y, Tan X, Lv Y, et al. Physicochemical properties and microbial community dynamics during Chinese horse bean-chili-paste fermentation, revealed by culture-dependent and culture-independent approaches. Food Microbiol. 2020; 85:103308–103309.
- Lee J-Y, Kim C-J, Kunz B. Identification of lactic acid bacteria isolated from kimchi and studies on their suitability for application as starter culture in the production of fermented sausages. Meat Sci. 2006;72(3):437–445.
- Wu Q. Investigation and analysis of hygienic status of catering food in a university in Zhengzhou. J Food Saf Q. 2017;8(9):3694–3697.
- 4789.22-2003, GT. Food hygiene microbiology inspection seasoning inspection. Available from: http://down.foodmate.net/standard/sort/3/1982.html.
- 4789.1-2016, GT. General provisions for food microbiology examination of national food safety standards. Available from: http://down.foodmate.net/standard/sort/3/50366.html.
- Brenner DJ. Bergey’s manual of systematic bacteriology. Bergey’s manual trust. 2009. ISBN:9780387292984. Athens, USA: Bergey’s Manual Trust.
- Thippeswamy S, Girigowda K, Mulimani V. Isolation and identification of α-amylase producing Bacillus sp. from dhal industry waste. Indian J Biochem Biophys. 2006;43(5):295–298.
- Sugita T, Takashima M, Kodama M, et al. Description of a new yeast species, Malassezia japonica, and its detection in patients with atopic dermatitis and healthy subjects. J Clin Microbiol. 2003;41(10):4695–4699.
- Pereyra MG, et al. Aflatoxin-degrading Bacillus sp. strains degrade zearalenone and produce proteases, amylases and cellulases of agro-industrial interest. Toxicon. 2020;180:43–48.
- Pranay K, et al. Screening and identification of amylase producing strains of Bacillus. J Appl Biol Biotechnol. 2019;7(04):57–62.
- Patel AR, Mokashe NU, Chaudhari DS, et al. Production optimisation and characterisation of extracellular protease secreted by newly isolated Bacillus subtilis AU-2 strain obtained from Tribolium castaneum gut. Biocatal Agric Biotechnol. 2019;19:101122–101129.
- Darwesh OM, El-Hawary AS, El Kelany US, et al. Nematicidal activity of thermostable alkaline protease produced by Saccharomonospora viridis strain Hw G550. Biotechnol Rep (Amst). 2019; 24:e00386–e00389.
- Zhang Ying-Jiu Z, et al. Identification of a new type of amylase and mutagenesis of strain ZX99 secreting the enzyme for production of isomaltooligosaccharide. Microbiology. 2002;29(5):38–41.
- Ojha SK, Singh PK, Mishra S, et al. Response surface methodology based optimization and scale-up production of amylase from a novel bacterial strain, Bacillus aryabhattai KIIT BE-1. Biotechnol Rep (Amst). 2020; 27:e00506–e00509.
- Zeng Z, Luo J, Zuo F, et al. Screening for potential novel probiotic Lactobacillus strains based on high dipeptidyl peptidase IV and α-glucosidase inhibitory activity. J Funct Foods. 2016;20:486–495.
- Boutrou R, Sepulchre A, Gripon JC, et al. Simple tests for predicting the lytic behavior and proteolytic activity of lactococcal strains in cheese. J Dairy Sci. 1998; 81(9):2321–2328.
- López DN, Galante M, Ruggieri G, et al. Peptidase from Aspergillus niger NRRL 3: optimization of its production by solid-state fermentation, purification and characterization. LWT. 2018;98:485–491.
- Bae Y-M, Lee S-Y. Effect of salt addition on acid resistance response of Escherichia coli O157:H7 against acetic acid. Food Microbiol. 2017;65:74–82.
- Sicuro B, Pastorino P, Barbero R, et al. Prevalence and antibiotic sensitivity of bacteria isolated from imported ornamental fish in Italy: a translocation of resistant strains? Prev Vet Med. 2020;175:104880.
- Liao H-M, Chao C-C, Lei H, et al. Intraspecies comparative genomics of three strains of Orientia tsutsugamushi with different antibiotic sensitivity. Genom Data. 2017;12:84–88.
- Xu Y, Zhou T, Tang H, et al. Probiotic potential and amylolytic properties of lactic acid bacteria isolated from Chinese fermented cereal foods. Food Control. 2020;111:107057–107057.
- Li Y, Qin Zh. L. Optimization of yeast cell fragmentation conditions and screening of high-peptidase strains. Food Sci. 2010;31(17):302–304.
- Zeng HQ, Likang J. Development review on acquired antibiotic resistance in lactic acid bacteria from food. Food Sci. 2006;25(12):189–193.