
Abstract
As one of the three yield components, kernel number per spike (KNPS) plays a key role in determining wheat yield. In this study, in combination with the previously constructed genetic map for a tetraploid wheat recombinant inbred line (RIL) population developed from the cross between a durum wheat and a wild emmer wheat and phenotype data from four environments, two major and stably expressed quantitative trait loci (QTL) for KNPS were identified. The phenotypic variation explained by these two QTL, Qknps-DW-3A.1 and Qknps-DW-3A.2, was up to 12.52% and 29.52%, respectively. The positive alleles were both from the durum wheat. Pyramiding analysis suggested that the combination of these two positive alleles has the largest effect on increasing KNPS. Comparison of physical interval for these two QTL with those reported previously showed that they may be novel loci. Genetic correlations between KNPS and other agronomic traits were also evaluated. Taken together, the two major and stably expressed QTL for KNPS from tetraploid wheat reported here they should be useful in wheat breeding.
Introduction
Bread wheat (Triticum aestivum L.) provides about 20% of food energy to humans (http://www.fao.org/faostat), and thus, it is important for global food security. Wheat yield is determined by the spike number per square metre, kernel number per spike (KNPS) and 1000-grain weight. Of these, KNPS was regarded as a significant factor increasing wheat yield, as it has been steadily improved [Citation1,Citation2]. It is thus an urgent work to discover crucial QTL for KNPS for wheat breeding programs.
To date, genes or QTL associated with KNPS have been identified on all the 21 chromosomes of bread wheat [Citation3–16]. Researchers have suggested that improvement of wheat yield and quality was impeded due to its narrow genetic basis [Citation17]. It is thus essential to extend the wheat gene pool and identify novel potential genes or QTL to improve wheat breeding. Fortunately, wheat related species carry desirable genes that can be utilised for wheat improvement. For example [Citation18], detected a locus for grain number per spike from the wheat- Agropyron cristatum 6 P disomic addition line. Recently [Citation19], cloned Pm41, a powdery mildew resistance gene derived from wild emmer wheat.
Tetraploid wheat is the progenitor of hexaploid wheat. It harbours numerous favourable excellent genes associated with resistance to diseases and agronomic traits that can be used in wheat breeding [Citation20–22]. For example, yellow rust resistance genes Yr36 [Citation23] and Yr15 [Citation24] and a powdery mildew resistance gene Pm41 [Citation19] have been cloned. Powdery mildew resistance genes Pm30 [Citation25], Pm36 [Citation26], Pm42 [Citation27], and Pm64 [Citation28] have been identified from wild emmer wheat.
Recently, QTL for effective tiller number (ET) from a tetraploid wheat recombinant inbred line (RIL) population developed from the cross between a durum and a wild emmer accession were identified [Citation29]. Here, we attempt to excavate QTL for KNPS from this reported RIL population aiming at providing gene sources for wheat improvement.
Materials and methods
Population and field experiment
The RIL population used in this study developed by single seed descent from an initial F2 population was derived from a cross between a durum wheat (DU09123, Triticum turgidum L. var durum) and a wild emmer genotype (WE34021, T. turgidum subsp. dicoccoides) and it included 116 F6–F9 lines [Citation29]. The agronomic traits of the RILs and their parents were measured in four consecutive years, 2017–18 (E1) and 2018–19 (E2), 2019–20 (E3), 2020–21 (E4) at the experimental field of Southwest University of Science and Technology (MianYang, Sichuan, China). Field management followed local practices. Lines were planted in a single row at a density of 15 kernels/150 cm row, and a row spacing of 30 cm. Agronomic traits from five plants for a given line including plant height (PH), spikelet number per spike (SNS), spike length (SL) and ET, flowering date (FD), KNPS, kernel weight per spike (KWS), kernel length (KL) and width (KW) and thousand kernel weight (TKW) were evaluated according to the previous study [Citation29]. Specifically, PH was measured from the plant base to the tip of the spike (excluding awns). SNS and SL was determined from the main spike of a plant. ET indicated the effective spikes of a single plant. FD was calculated from the sowing date to that when half of the plants for a given line flowered. KNPS and KWS from five representative and well-pollinated spikes per line were counted and measured. After threshing and drying, the kernels were used for measuring kernel length (KL), width (KW) and thousand kernel weight (TKW).
Data analysis
Pearson’s correlation, frequency distribution, standard error and the Student’s t-test (p < 0.05) were used in the IBM SPSS Statistics 25 (Armonk, NY, USA). The broad-sense heritability (H2) and best linear unbiased prediction (BLUP) of agronomic traits from multiple environments were calculated using SAS version 8.0 (Cary, North Carolina).
QTL detection
The previously constructed genetic linkage map using the wheat 55 K single nucleotide polymorphism (SNP) array [Citation29] was adopted for QTL analysis. The map included 1154 bin markers mapped on 14 linkage groups with an average density of 2.13 cM/marker. QTL analysis was carried out as described previously [Citation29]. Individual environment QTL identification was carried out using the biparental populations (BIP) module in IciMaing4.1. The QTL-by-environment interactions were analysed using the function of multi-environment trial module in IciMaing4.1. QTL that were identified in at least two environments and explained more than 10% of the phenotypic variation were regarded as major ones, while those having common flanking markers were treated as a single one.
Predicted genes in the interval of QTL
We used the sequences of the SNP markers to blast against the wild emmer (accession Zavitan) [Citation30], durum wheat (accession Svevo) [Citation31] and bread wheat genotype (accession ‘Chinese Spring’, CS) (IWGSC RefSeq v2.1) [Citation32] genome sequences to identify their physical locations to determine the physical interval of the QTL. Predicted genes located between the flanking markers and their function annotations were retrieved from the Triticeae Multi-omics Centre [Citation33].
Results
Phenotype analysis
DU (65.2-89.4) showed significantly higher KNPS than WE (32.6–39.4) in all of the four environments (). The KNPS of DW RILs ranged between 14.1 and 94.9. Continuous variation and bidirectional transgressive segregation of KNPS was observed in the RIL population. H2 of KNPS was 0.80, suggesting that KNPS was mainly controlled by genetic factors. An approximately normal distribution for KNPS was observed for all of the four environments, indicating that it was polygenically inherited (). There were significant correlations for KNPS among the four environments with coefficients ranging from 0.45 to 0.98 (p < 0.01, ).
Figure 1. Phenotypic distribution of kernel number per spike (KNPS) in four environments. Different environments (E1–E4): 2017-18 (E1) and 2018-19 (E2), 2019-20 (E3), 2020-21 (E4).

Table 1. Phenotypic value of kernel number per spike (KNPS) in the DW population at different environments.
Table 2. Correlation coefficients of KNPS in different environments.
QTL detection
Using QTL mapping analysis based on the linkage map and phenotype data across four environments and the BLUP dataset, 13 QTL for KNPS were identified in the single-environment analysis. They were mapped on chromosomes 1 A, 3 A (2 loci), 6 A (4), 7 A, 1B, 5B (4) and 7B. The LOD value for these QTL ranged from 2.94 to 39.83. The phenotype variance explained (PVE) ranged from 1.51 to 29.52%. The positive alleles of these QTL were all from DU ().
Table 3. Quantiative trait loci (QTL) for KNPS detected at four environments in the DW population.
Qknps-DW-3A.1 was stably expressed in two of the four environments and the BLUP dataset, explaining 10.05 to 12.52% of the phenotypic variation. The LOD score ranged from 4.45 to 6.76. It was thus regarded as a major QTL ( and ). The positive allele of this QTL on increasing KNPS was further evaluated based on the genotypes of the flanking markers (). The lines carrying a positive allele of this QTL had significantly higher KNPS than those carrying the negative one. The increased values ranged from 11.5 to 22.1%. It was physically mapped at 658.77-669.68 Mb (∼10.91 Mb interval) on chromosome 3BL of wild emmer genome, 650.31-660.99 Mb (∼10.68 Mb interval) of durum genome, and 659.19-669.76 Mb (∼10.57 Mb interval) on 3BL of CS genome, and there were 90, 93 and 95 predicted genes in the respective intervals with 53 orthologs in the corresponding intervals (Supplemental Table S1).
Figure 2. Genetic maps of the two major QTL and their effects. *Significance level at p < 0.05, **Significance level at p < 0.01.
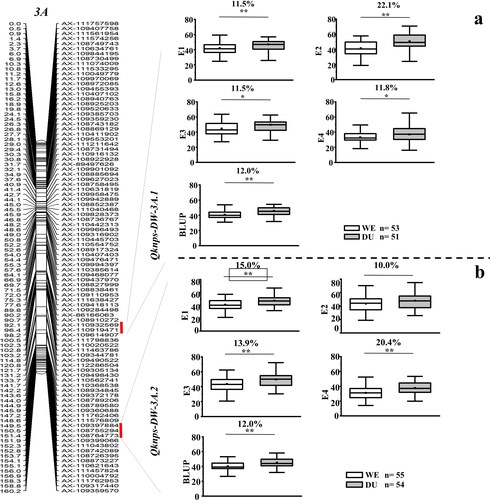
Qknps-DW-3A.2 was stably detected in three environments and the BLUP dataset, explaining 13.54 to 29.52% of the phenotypic variation. The LOD score ranged from 3.64 to 39.83. It was also regarded as a major QTL (). The effect of the positive allele of this QTL on increasing KNPS was also analysed (). The lines carrying the positive allele of this QTL had significantly higher KNPS (increased 10.0%–20.4%) than those carrying the negative one. It was physically mapped at 742.67-743.15 Mb (∼0.48 Mb interval) on chromosome 3AL of wild emmer genome and 730.75-731.23 Mb (∼0.48 Mb interval) on 3AL of CS genome. There were 1 and 6 predicted genes in the respective intervals with 1 ortholog in the corresponding intervals (Supplemental Table S2).
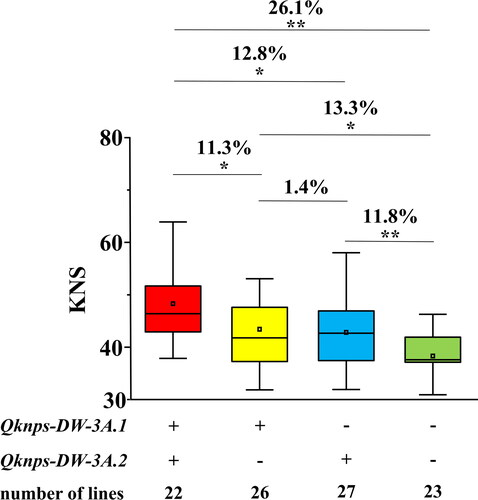
Figure 3. Effects of the two major QTL, Qknps-DW-3A.1 and Qknps-DW-3A.2, on increasing KNPS in the mapping population. ‘+’ and ‘–’ represent lines carrying the positive allele of the corresponding QTL or not, respectively. ** Significance at the 0.01 probability level, * significance at the 0.05 probability level.
In addition, Qknps-DW-6A.1 and Qknps-DW-5B.1 can be detected in two environments, with phenotypic variation explained up to 9.16 to 12.49%, respectively. We also detected Qknps-DW-6A.2, Qknps-DW-6A.4, Qknps-DW-7A and Qknps-DW-5B.3, the PVE of which was larger than 10%. However, as they were all identified in only a single environment, we think they were not stably expressed. We thus excluded them from further analysis.
A total of 21 QTL were detected using the QTL-by-environment interaction analysis (Supplemental Table S3). Of them, Qknps-DW-3A.1 and Qknps-DW-3A.2 were also detected in individual environment analysis, indicating that they were major QTL for KNPS.
Effects of the two major QTL on KNPS
The effects of the two major QTL Qknps-DW-3A.1 and Qknps-DW-3A.2 on increasing the KNPS were further evaluated in the mapping population based on the genotypes of the flanking markers (). Compared to the lines carrying the negative alleles of these two QTL, those with favourable ones had significantly increased KNPS by 11.8% for Qknps-DW-3A.2, 13.3% for Qknps-DW-3A.1, and up to 26.1% for the combination of these two QTL. No significant differences were detected between the lines carrying positive alleles of Qknps-DW-3A.2 and Qknps-DW-3A.1. As expected, the lines carrying positive alleles of both Qknps-DW-3A.2 and Qknps-DW-3A.1 had significantly increased KNPS by 11.3 and 12.8%, respectively, compared to those with that of the Qknps-DW-3A.1 only or the Qknps-DW-3A.2 only ().
Correlations between SNS and the two major QTL with other agronomic traits
The phenotypic correlations between SNS and other agronomic traits were analysed and listed in . KNPS was positively correlated to FD, SNS and KWP, and negatively correlated to KL (p < 0.01). Significant correlation was not detected between KNPS and PH, ET, SL, KW and TKW ().
Table 4. Correlation coefficients between KNPS and other agronomic traits.
To further analyse the effects of the two major QTL on other agronomic traits, the 114 lines were grouped into two classes (excluding heterozygous lines) based on the genotypes of the flanking markers. For Qknps-DW-3A.1, 53 lines carrying homozygous alleles from WE showed no significant difference with 51 ones carrying those from DU in PH, FD, ET, SL, SNS, KL, KW, TKW and KWS (Figure S1). For Qknps-DW-3A.2, 55 lines with homozygous alleles from WE also had no significant difference with 54 ones with those from DU for the measured traits (Supplemental Figure S2).
Discussion
Excavating, characterisation and mapping loci for yield-related traits from wheat related species can provide important resources for bread wheat improvement. In this study, the wheat 55 K SNP array based constructed linkage map in combination with four environments were used to map two major QTL for KNPS, the positive alleles of which were both from the durum wheat DU accession. These two QTL were not likely interacted with FD and PH. Pyramiding analysis further suggested their great potential in wheat breeding.
Although numerous QTL for KNPS have been reported on nearly 21 chromosomes of bread wheat, only several QTL were identified on chromosome 3 A and further very few stable and major QTL for KNPS were identified. For example [Citation2], detected three KNPS-associated loci on bread wheat 3 A chromosome through a genome-wide association analysis of grain number using 531 SSR markers. Of them, Xgwm2-3A (∼60.58 Mb on 3 A) was detected in two of the five environments, and Xcfa2234 (∼270.76 Mb on 3 A) and Xgwm162 (∼751.92 Mb on 3 A) were detected in only a single environment [Citation16] found that QKNPS-DH-3A-1.1 (∼488.87 Mb) and QKNPS-DH-3A-2.2 (∼184.50 Mb) were detected on bread wheat 3 A chromosome in only one of the five environments. The previously reported QTL were mainly identified in bread wheat and they were physically far away from Qknps-DW-3A.1 and Qknps-DW-3A.2 (∼ 650-740 Mbp) identified in this study. Additionally, the favourable alleles of the presently identified QTL were from durum wheat. These results suggested that Qknps-DW-3A.1 and Qknps-DW-3A.2 might be novel loci and should be focussed on in wheat breeding.
Here, no significant effects of the two QTL for KNPS on PH, FD and other agronomic traits were detected, suggesting that these two QTL may have functional roles independent of PH and FD. Previous reports have shown that pyramiding of favourable genes is a good way to improve yield [Citation34–36]. Our results showed that the combination of positive alleles of both Qknps-DW-3A.1 and Qknps-DW-3A.2 had the largest effect on KNPS. These results indicate the great potential of pyramiding both QTL to regulate KNPS and thus improve wheat yield. Further, the predicted candidate genes in the intervals where major QTL were located will be useful for future fine mapping.
Conclusions
The KNPS for the mapping population was measured in four environments. Correlations between KNPS and other agronomic traits were evaluated. Using the constructed linkage map based on the wheat 55 K SNP, two major and stably expressed QTL for KNPS were detected on chromosome arm 3AL. Their positive alleles were both from durum wheat. Physical maps analysis indicated that these two QTL may be novel loci for KNPS. Genetic analysis suggested that they were not correlated to PH and FD. Pyramiding analysis further showed the great breeding potential of these two QTL given their largest additive effect.
Supplemental Material
Download PDF (182.6 KB)Supplemental Material
Download MS Excel (20.8 KB)Disclosure statement
No potential conflict of interest was reported by the authors.
Data availability statement
All data generated or analysed during this study are included in this article and its supplementary information files; further inquiries can be directed to the corresponding author.
Supplemental data
Supplemental data can be accessed at https://doi.org/10.1080/13102818.2022.2054728.
Additional information
Funding
Related Research Data
References
- Gupta PK, Rustgi S, Kumar N. Genetic and molecular basis of grain size and grain number and its relevance to grain productivity in higher plants. Genome. 2006;49(6):565–571.
- Zhang D, Hao C, Wang L, et al. Identifying loci influencing grain number by microsatellite screening in bread wheat (Triticum aestivum L.). Planta. 2012;236(5):1507–1517.
- Börner A, Schumann E, Fürste A, et al. Mapping of quantitative trait loci determining agronomic important characters in hexaploid wheat (Triticum aestivum L.). Theor Appl Genet. 2002;105(6-7):921–936.
- Cao P, Liang X, Zhao H, et al. Identification of the quantitative trait loci controlling spike-related traits in hexaploid wheat (Triticum aestivum L.). Planta. 2019;250(6):1967–1981.
- Cui F, Zhao C, Ding A, et al. Construction of an integrative linkage map and QTL mapping of grain yield-related traits using three related wheat RIL populations. Theor Appl Genet. 2014;127(3):659–675.
- Deng S, Wu X, Wu Y, et al. Characterization and precise mapping of a QTL increasing spike number with pleiotropic effects in wheat. Theor Appl Genet. 2011;122(2):281–289.
- Huang XQ, Kempf H, Ganal MW, et al. Advanced backcross QTL analysis in progenies derived from a cross between a german elite winter wheat variety and a synthetic wheat (Triticum aestivum L.). Theor Appl Genet. 2004;109(5):933–943.
- Jia H, Wan H, Yang S, et al. Genetic dissection of yield-related traits in a recombinant inbred line population created using a key breeding parent in china’s wheat breeding. Theor Appl Genet. 2013;126(8):2123–2139.
- Kirigwi FM, Van Ginkel M, Brown-Guedira G, et al. Markers associated with a QTL for grain yield in wheat under drought. Mol Breeding. 2007;20(4):401–413.
- Kuang CH, Zhao XF, Yang K, et al. Mapping and characterization of major QTL for spike traits in common wheat. Physiol Mol Biol Plants. 2020;26(6):1295–1307.
- Lin Y, Jiang X, Hu H, et al. QTL mapping for grain number per spikelet in wheat using a high-density genetic map. The Crop Journal. 2021;9(5):1108–1114.
- Liu J, Xu Z, Fan X, et al. A genome-wide association study of wheat spike related traits in China. Front Plant Sci. 2018;9:1584.
- Narasimhamoorthy B, Gill BS, Fritz AK, et al. Advanced backcross QTL analysis of a hard winter wheat x synthetic wheat population. Theor Appl Genet. 2006;112(5):787–796.
- Onyemaobi I, Ayalew H, Liu H, et al. Identification and validation of a major chromosome region for high grain number per spike under meiotic stage water stress in wheat (Triticum aestivum L.). PLoS One. 2018;13(3):e0194075.
- Shi W, Hao C, Zhang Y, et al. A combined association mapping and linkage analysis of kernel number per spike in common wheat (Triticum aestivum L.). Front Plant Sci. 2017;8:1412.
- Zhang H, Chen J, Li R, et al. Conditional QTL mapping of three yield components in common wheat (Triticum aestivum L.). The Crop Journal. 2016;4(3):220–228.
- Dubcovsky J, Dvorak J. Genome plasticity a key factor in the success of polyploid wheat under domestication. Science. 2007;316(5833):1862–1866.
- Zhang Z, Han H, Liu W, et al. Deletion mapping and verification of an enhanced-grain number per spike locus from the 6PL chromosome arm of agropyron cristatum in common wheat. Theor Appl Genet. 2019b;132(10):2815–2827.
- Li M, Dong L, Li B, et al. A CNL protein in wild emmer wheat confers powdery mildew resistance. New Phytol. 2020;228(3):1027–1037.
- Xie W, Nevo E. Wild emmer: genetic resources, gene mapping and potential for wheat improvement. Euphytica. 2008;164(3):603–614.
- Yin H, Fang X, Li P, et al. Genetic mapping of a novel powdery mildew resistance gene in wild emmer wheat from “Evolution Canyon” in Mt. Carmel Israel. Theor Appl Genet. 2021;134(3):909–921.
- Yu J, Zhao Y, Ding M, et al. Wild emmer chromosome arm substitution lines: useful resources for wheat genetic study and breeding. Crop Sci. 2020;60(4):1761–1769.
- Fu D, Uauy C, Distelfeld A, et al. A kinase-START gene confers temperature-dependent resistance to wheat stripe rust. Science. 2009;323(5919):1357–1360.
- Klymiuk V, Yaniv E, Huang L, et al. Cloning of the wheat Yr15 resistance gene sheds light on the plant tandem kinase-pseudokinase family. Nat Commun. 2018;9(1):3735.
- Liu Z, Sun Q, Ni Z, et al. Molecular characterization of a novel powdery mildew resistance gene Pm30 in wheat originating from wild emmer. Euphytica. 2002;123(1):21–29.
- Blanco A, Gadaleta A, Cenci A, et al. Molecular mapping of the novel powdery mildew resistance gene Pm36 introgressed from triticum turgidum var. dicoccoides in durum wheat. Theor Appl Genet. 2008;117(1):135–142.
- Hua W, Liu Z, Zhu J, et al. Identification and genetic mapping of pm42, a new recessive wheat powdery mildew resistance gene derived from wild emmer (Triticum turgidum var. dicoccoides). Theor Appl Genet. 2009;119(2):223–230.
- Zhang D, Zhu K, Dong L, et al. Wheat powdery mildew resistance gene Pm64 derived from wild emmer (Triticum turgidum var. dicoccoides) is tightly linked in repulsion with stripe rust resistance gene Yr5. The Crop Journal. 2019a;7(6):761–770.
- Chen L, Li H, Liu Y, et al. Genetic identification of a major, novel and stably expressed QTL for effective tiller number from tetraploid wheat. Biotechnol Biotechnol Equip. 2021;35(1):1538–1545.
- Zhu T, Wang L, Rodriguez JC, et al. Improved genome sequence of wild emmer wheat zavitan with the aid of optical maps. G3. G3 (Bethesda). 2019;9(3):619–624.
- Maccaferri M, Harris NS, Twardziok SO, et al. Durum wheat genome highlights past domestication signatures and future improvement targets. Nat Genet. 2019;51(5):885–895.
- Zhu T, Wang L, Rimbert H, et al. Optical maps refine the bread wheat Triticum aestivum cv chinese spring genome assembly. Plant J. 2021;107(1):303–314.
- Ma S, Wang M, Wu J, et al. WheatOmics: a platform combining multiple omics data to accelerate functional genomics studies in wheat. Mol Plant. 2021;14(12):1965–1968.
- Fan X, Cui F, Zhao C, et al. QTLs for flag leaf size and their influence on yield-related traits in wheat. Triticum aestivum L.). Mol Breed. 2015;35:24.
- Ma J, Tu Y, Zhu J, et al. Flag leaf size and posture of bread wheat: genetic dissection, QTL validation and their relationships with yield-related traits. Theor Appl Genet. 2020;133(1):297–315.
- Tu Y, Liu H, Liu J, et al. QTL mapping and validation of bread wheat flag leaf morphology across multiple environments in different genetic backgrounds. Theor Appl Genet. 2021;134(1):261–278.