
Abstract
Dicer is an RNaseIII in microRNA processing that modulates multiple biological processes including tumorigenesis. We have shown that Dicer could inhibit the growth of hepatocellular carcinoma (HCC) previously [Zhang L, Wang C, Liu S, Zhao Y, et al. Oncol Lett 2016;11:3961-3966]. Here, we evaluated the relationships between Dicer and reactive oxygen species (ROS) as well as their modulation for HCC. We found Dicer expression was positively associated with ROS generation in HCC tissue at borderline statistical levels (p = .065); functional analysis showed Dicer could both induce the ROS generation (p < .01) and reduce the activity of Cytochrome c Oxidase (COX) (p < .05) by comparing the Dicer transfected and control HCC cells. The COX inhibitor ADDA-5 hydrochloride could increase the ROS generation, whereas the ROS scavenger N-acetylcysteine (NAC) could decrease the COX activity. Further analysis also demonstrated that one kind of ROS, H2O2, could repress the proliferation and migration as well as increase the apoptosis of HCC cells. Our data indicated that Dicer could inhibit the HCC growth by promoting ROS generation; ROS and COX interacted with each other to modify this process.
Introduction
Hepatocellular carcinoma (HCC) is one of the most common malignant tumors threatening human health with high morbidity and mortality. In 2020, there are an estimated 905,677 new cases and 830,180 cancer related death world-widely [Citation1]. Despite the improvement in clinical testing methods and treatment, the prognosis of patients with HCC is still poor due to the high recurrence rate [Citation2]. Owing to that, identifying genes contributing to the hepatocarcinogenesis and the progression of HCC thereby and understanding its mechanism are important.
Reactive oxygen species (ROS), a series of oxygen derived free radicals or non-free radicals, are important in multiple biological processes including tumorigenesis and tumor progression [Citation3,Citation4]. The increased ROS levels will accumulate irreversible damage to DNA, RNA, lipids and proteins, thus initiating the formation of liver cancer [Citation5]. In addition, evidence has found elevated ROS in both non-alcoholic fatty liver disease and alcoholic liver disease to induce the development of liver cancer [Citation6,Citation7]. However, further elevated ROS could induce apoptosis in HCC cells [Citation8]. COX is a terminal enzyme in the electron transport chain (ETC) which could reduce the production of ROS by augmenting the electron flux capacity of ETC [Citation9,Citation10]. Although acting as a rate-limiting enzyme in ETC, the role of COX in tumorigenesis and tumor progression has been rarely studied.
Dicer is an RNaseIII which plays a critical role in microRNA processing via cleaving microRNA precursor molecules (pre-miRNA) into functional miRNA with ∼22 nucleotides in the cytoplasm [Citation11]. The mature miRNA can degrade the mRNA or inhibit the translation of protein-coding genes by binding to a specific sequence site of the mRNA, and can finally modulate multiple biological processes such as cell cycle, cell differentiation, development, apoptosis and tumorigenesis [Citation12]. As the processor of miRNA, Dicer is also associated with the progress of carcinoma but with controversial results. Previous studies showed that Dicer mutation is highly related to liver cancer and nonepithelial ovarian cancers [Citation13,Citation14]. Except for sequence variation, the expression level of Dicer can also contribute to tumor-genesis and tumor progression. In laryngeal, bladder or colon cancer cell lines, Dicer functioned as a tumor suppressor and its expression level was regulated by miR892a, miR200a and miR-186, respectively [Citation15–17]. Oppositely, Dicer as appeared to be an oncogene in prostate adenocarcinoma, ovarian serous carcinoma and colorectal cancer [Citation18–21]. We have shown that the expression level of Dicer was associated with the survival time of HCC patients, and Dicer could suppress tumor progression through inhibiting proliferation and metastasis as well as promoting apoptosis of HCC cells [Citation22]. However, the physiological and pathological mechanism of Dicer in modulating the progression of HCC remain poorly reported. The disturbed protein synthesis and reduced efficiency of DNA repair changed the process of tumor progression after enhancing or reducing Dicer expression [Citation23,Citation24].
The crosstalk between miRNA and ROS during tumor progression have also received attention. ROS can induce or suppress some miRNAs which act as tumor suppressors or oncogenes via genetic or epigenetic pathways to modulate tumor progression [Citation25,Citation26]. While ROS can regulate the expression of miRNA, in turn, miRNAs can also modulate the expression of ROS scavengers or activators [Citation27,Citation28]. All the above implied that ROS might act in the process of Dicer caused HCC inhibition. In the present study, we evaluated the relationship between Dicer and ROS as well as the possibility for their modulation in HCC.
Materials and methods
Tissue specimens and cell lines
Liver cancer tumor tissues were collected from 39 patients in the Fourth Hospital of Hebei Medical University. All the patients had not received chemotherapy before surgery. The liver cancer tumor tissues were either frozen for ROS detection, or embedded in paraffin to measure the expression level of Dicer. The HCC cell line SMMC-7721 was provided by the Shanghai Institute of Biological Sciences and Cell Biology, Chinese Academy of Sciences (Shanghai, China). This cell line was confirmed to be free from cross-contamination of human cells via short tandem repeats (STR) analysis (Shanghai Biowing Biotechnology Co. LTD, 23rd August 2021). The cells were grown in Dulbecco’s Modified Eagle Medium (DMEM) high-glucose medium (Gibco Life Technologies) with 10% fetal bovine serum (FBS) (Gibco Life Technologies) at 37 °C in a humidified incubator containing 5% CO2. For NAC (MedChemExperss, Newark, NJ), ADDA 5 hydrochloride (MedChemExperss, Newark, NJ) and H2O2 (Sigma-Aldrich, Louis, MO) treatment, NAC and ADDA 5 hydrochloride and H2O2 were added to the culture medium at a concentration of 5 mmol/L, 20 μmol/L and 150 nmol/L, respectively. The final concentrations of NAC [Citation29] and ADDA 5 hydrochloride [Citation30] were selected according to previous reports [Citation29,Citation30], and the final concentration of H2O2 was determined according to a concentration gradient experiment.
Immunohistochemistry
Immunohistochemical analysis for Dicer was performed using the streptavidin-peroxidase (SP) method. Collected liver cancer tumor tissues were fixed in 10% formalin, dehydrated in ethanol gradient, treated with xylene and finally embedded in paraffin [Citation22]. The paraffin-embedded tumor tissue was sliced into 4-μm-thick sections, and they were stained with anti-Dicer primary antibody (diluted 1:100, Catalog No: ab280957, Abcam, Cambridge, UK) at 4 °C overnight, and then incubated for 1 h at room temperature with biotinylated anti-mouse secondary IgG antibody. Thereafter, these sections were subsequently incubated with horseradish peroxidase (HRP)-bound streptavidin and developed using 3,3′-diaminobenzidine (DAB). Two pathologists with knowledge of the clinical data of patients were employed to score all samples, using the HSCORE as described previously [Citation22,Citation31]. HSCORE represents the sum of each percentage multiplied by the weighted staining intensity, as shown below: HSCORE = Pi (i + 1). The weighted staining intensity was scored as follows: 0 represented no staining, 1 represented weak staining (light-yellow), 2 represented moderate-weak staining (yellow brown), 3 represented moderate-strong staining (brown) and 4 represented strong staining (dark brown). Piwas the percentage of positively stained cells of each intensity. In the equation, i = 1, 2, 3 and 4, and Pi ranges from 0% to 100%. A score of >100% was defined as high expression and ≤100% as low expression [Citation22,Citation31].
Transfections and Western blotting
The pEZ-Lv201 vector (Catalog No: EZ006, GeneCopoeia, https://www.genecopoeia.com/product/cloning_products/ezshuttle-recombination-cloning-system/) and Dicer in this vector (Catalog No: EX-H0470-Lv201, GeneCopoeia, https://www.genecopoeia.com/product/search/detail.php?prt=1&cid=&key=H0470&type=orf%20cdna&choose=EX-H0470-Lv201) were used for transfection. Since the former vector only has a CMV promoter, and the later vector has a CMV promoter driven Dicer Open Reading Frame (ORF), the two vectors were labeled as pCMV-control and pCMV-Dicer. For transfection, SMMC-7721 cells in the logarithmic growth phase were seeded into 6-well plates. Then, the two vectors were transfected into SMMC-7721 cells using Invitrogen™ Lipofectamine™ 3000 Transfection Reagent (Catalog No: L3000001, Invitrogen), respectively.
For western blotting, β-actin protein was used as a reference. Proteins were extracted from the pCMV and pCMV-Dicer transfected SMMC-7721 cells using radioimmunoprecipitation assay (RIPA) lysis buffer and freshly added protease inhibitors (Roche, Basel, Switzerland). The concentration of extracted proteins was quantified by a BCA assay. Five minute boiling was used to denature the proteins, and sodium dodecyl sulfate-polyacrylamide gel electrophoresis was performed to separate the protein bands. Then, the separated proteins were transferred onto a polyvinylidene difuoride membrane. After 2 h of blocking with 5% skim milk, the membrane was incubated with anti-Dicer antibody (diluted 1:1000, Catalog No: ab280957, Abcam, UK) or anti-β-actin antibody (diluted 1:1000, Catalog No: sc-47778, Santa Cruz, https://www.scbt.com/p/beta-actin-antibody-c4) at 4 °C overnight. Next, the membrane was incubated with HRP-conjugated anti-rabbit IgG antibody (diluted 1:10000, Catalog No: 5220-0336, SeraCare, https://www.seracare.com/AntiRabbit-IgG-HL-Antibody-PeroxidaseLabeled-5220-0336/) at 37 °C for 30 min. Then, the membrane was washed using phosphate-buffered saline (PBS) with Tween 20. Finally, The FluorChem M system (ProteinSimple, http://www.proteinsimple.com/fluorchem_m.html) was used to visualize proteins with PierceTM ECL Western Blotting Substrate (Catalog No: 32106, Thermo Fisher).
Mitochondrial isolation
The mitochondrial fraction was isolated using MinuteTM Mithochondrial Isolation Kit for Mammalian Cells and Tissues (Catalog No: MP-007, Invent, https://www.inventchina.cn/pro_view.asp?id=91&class=2) according to the manufacture’s instructions. In brief, cell lines were collected by low speed centrifugation (500–600 g), washed by cold PBS, and resuspended in buffer A. After vigorous vortexing, the suspension was transferred to a filter cartridge, followed by high speed centrifugation (16,000 g). Then the filter was discarded, the pellet was resuspended, and a low speed centrifugation (700 g) was performed. The supernatant was transferred to a new tube, and mixed with Buffer B. After a high speed centrifugation (16,000 g), the pellet was resuspended in Buffer B. Subsequently, the suspension was centrifuged (8000 g), and the supernatant was transferred to a new tube, and mixed with cold PBS. After centrifugation at 16,000 g, the pellet contained the isolated mitochondrial fraction. All of the centrifugation steps were performed at 4 °C. The isolated mitochondrial fraction were further used to detect COX activity and ROS level.
COX activity
A quantitative colorimetric method was used to evaluate the activity of COX in SMMC-7721 cells, pCMV-control or pCMV-Dicer transfected SMMC-7721 cells using a COX determination kit (Catalog No: GMS10014.2, GenMed, http://www.sh-genmed.com/#xb04) according to the manufacturer’s instruction, which was similar to a previous study [Citation32]. Briefly, 2 μg mitochondrial proteins were incubated with reduced cytochrome c. During this process, COX can oxidize reduced cytochrome c into oxidized cytochrome c, resulting in the decrease of absorbance at 550 nm. In our experiment, a BioTek Synergy2 Microplate Reader (BioTek, USA) was used to detect the absorbance at 550 nm, and the amount of oxidized cytochrome c per minute per unit weight of protein was used to measure the COX activity.
ROS detection
A fluorometric method was adopted to evaluate the activity level of ROS in SMMC-7721 cells, pCMV-control or pCMV-Dicer transfected SMMC-7721 cells and frozen liver cancer tumor tissues, using a ROS determination kit (Catalog No: GMS10104.2, http://www.sh-genmed.com/#xb04, GenMed) according to the manufacturer’s instructions. Briefly, 50 μg mitochondrial proteins were incubated with 2′,7′-dichlorofluorescein diacetate (DCFH-DA). During this process, ROS can oxidize DCFH-DA, and generate fluorescence. In our experiment, a BioTek Synergy2 Microplate Reader (BioTek, USA) was used to detect the relative fluorescence unit (RFU). The emission wavelength was set at 530 nm, and the excitation wavelength was set at 490 nm. The difference between sample (mitochondrial proteins for detecting) RFU and background control (a reagent provided in the kit) RFU was used as the quantitative ROS level.
Cell proliferation assays
According to the manufacturer’s instructions, Cell Counting Kit 8 (CCK 8; Dojindo, Kumamoto City, Japan) was used to assess cell proliferation. Briefly, the harvested SMMC-7721 cells grown in the logarithmic phase were digested into a single cell suspension and seeded in 96-well plates with a density of 1 × 10⁴ cells per well. Six duplicate wells were set up for each group. At each time point (0, 24, 48 and 72 h), 10 μL diluted CCK8 was added into each well and incubated at 37 °C for another 2 h. The absorbance of each well was read on a BioTek Synergy2 Microplate Reader (BioTek, USA) at 490 nm.
Wound healing assay
Cells were cultured in 6-well plates. A straight wound was drawn with a 200 μL pipette tip on the monolayer when cells reached 100% confluence. Subsequently, the cells were washed twice with PBS. Images of each group of cells were captured at 0 and 24 h after scratching. Migration rates were expressed by dividing the width of the scratch by the percentage of the initial width of the same scratch.
Cell apoptosis assays
Cell apoptosis was examined by flow cytometry analysis. The SMMC-7721 cells were collected and washed twice with cold PBS and once with binding buffer. Then, the cells were incubated with PE Annexin V and 7-amino-actinomycin D in the dark at room temperature for 15 min, and then 400 μL of binding buffer was added to each sample. The percentage of apoptotic cells was analyzed by flow cytometry using a FACS Aria II flow cytometer (BD Biosciences) within 1 h.
Statistical analysis
Data are expressed as mean values with standard deviation (±SD). The relationship between ROS level and Dicer expression was analyzed by chi-square test. Statistical analysis between three groups or more groups was performed with One-way analysis of variance (ANOVA). Differences were considered statistically significant at the p < .05 level. Data were obtained from at least three independent experiments with a similar pattern. All statistical analyses were carried out using SPSS statistical software, version 19.0 (IBM Corporation, Armonk, NY).
Results
Dicer promotes the generation of ROS
We had shown that Dicer was associated with the outcome of HCC by Dicer immunostaining in HCC tissue [Citation22]; here we assessed the relationship between Dicer and ROS with frozen sample available. As shown in , the ROS levels were positively associated with Dicer expression at a borderline statistical level by chi-test analysis (p = .065). These data implied that Dicer could promote the generation of ROS in HCC tissue. We transfected Dicer into SMMC-7721 HCC cells to evaluate this association in vitro. Stable Dicer transfected SMMC-7721 cells were established (). The ROS levels were dramatically increased upon Dicer overexpression by comparing the blank control, empty vector transfected and Dicer transfected SMMC-7721 cells (, pCMV-Dicer VS pCMV-control p < .01, pCMV-Dicer VS Blank-control p < .01). These data indicated that Dicer could promote ROS generation in vitro and in vivo.
Figure 1. Dicer promoted the generation of ROS. (A) Identification of Dicer expression in pCMV-control and pCMV-Dicer transfected SMMC-7721 cells. (B) The COX activity of pCMV-Dicer cells was repressed compared with those of blank control or pCMV-control cells, *p < .05. (C) The ROS level of pCMV-Dicer cells was increased compared with those of blank control or pCMV-control.**p < .01.
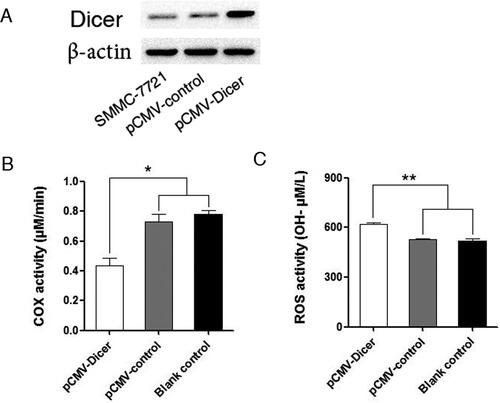
Table 1. The ROS levels were positively associated with Dicer expression at borderline statistical level by chi-test analysis in HCC tissue.
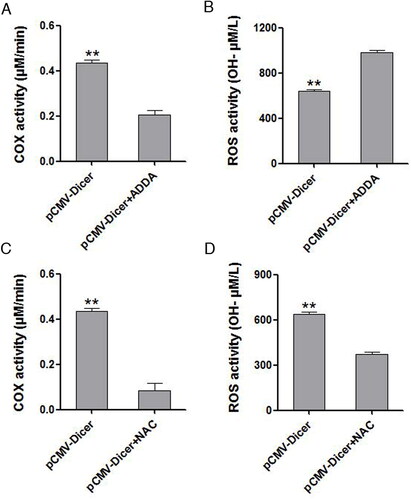
Since COX interacted with ROS, we measured COX to determine whether it is associated with ROS. The COX levels were significantly decreased upon Dicer overexpression (, p < .05). A partially non-competitive cytochrome c oxidase inhibitor, ADDA 5 hydrochloride, which showed effective inhibition for COX, increased the ROS significantly in pCMC-Dicer transfected cells (, p < .01). Simultaneously, the ROS scavenger N-acetylcysteine (NAC) also decreased the activity of COX based on our measurement (, p < 0.01). These data implied that Dicer might increase the ROS generation via inhibiting the activity of COX enzyme and that ROS also act on COX to reduce its activity.
Figure 2. The influence of ADDA-5 hydrochloride or NAC treatment on COX activity and ROS production, respectively. (A) The COX activity of Dicer overexpressing cells was decreased after ADDA-5 hydrochloride intervention, **p < .01. (B) The ROS level of Dicer overexpressing cells was increased after ADDA-5 hydrochloride intervention, **p < .01. (C) The COX activity of Dicer overexpressing cells was decreased after NAC intervention, **p < .01. (D) The ROS level of Dicer overexpressing cells was decreased after NAC intervention, **p < .01.
Dicer inhibits SMMC-7721 cells by increasing ROS generation in SMMC-7721 cell line
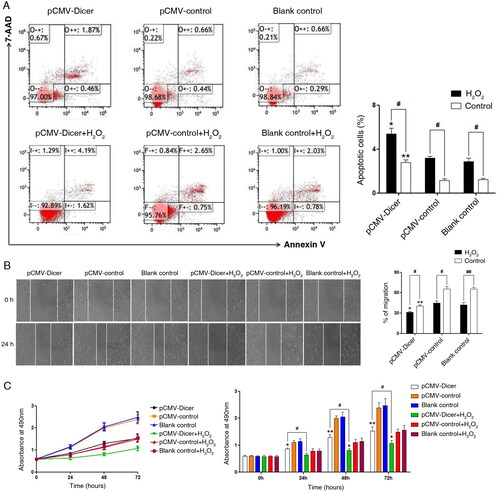
We had demonstrated that Dicer suppressed HCC through inhibiting proliferation, invasion and migration as well as increasing apoptosis in the HepG2 cell line [Citation22]. We checked whether Dicer caused suppression in the HCC cell line of SMMC-7721. As shown in , Annexin V/7-amino-actinomycin D flow cytometry displayed that apoptosis was dramatically increased in the Dicer transfected cell line compared with blank vector transfected SMMC-7721 cells. Meanwhile, a significant decrease in cell viability was observed in the Dicer transfected cell lines. The results of the wound healing assay showed that the cell migration was dramatically repressed when Dicer was overexpressed (). These data indicated that Dicer could suppress HCC referring to inducing apoptosis, decreasing cell viability and suppressing cell migration. Since the ROS level was significantly increased in Dicer overexpressing lines, to further illustrate whether the change in cell apoptosis, cell viability and cell migration depended on elevated ROS level, all of these characters were investigated when H2O2 (150 nmol/L) was added into the culture of all of these three cell lines. As shown, the apoptosis was elevated, cell viability was decreased and cell migration was repressed using H2O2 treatment in all of the three groups of cells: pCMV-Dicer, pCMV-control and blank control (). These data suggested that overexpression of Dicer induces apoptosis, decreases cell viability and suppresses cell migration by increasing ROS in SMMC-7721 cells.
Figure 3. Elevated ROS level promoted cell apoptosis, inhibited cell proliferation and migration of HCC cells in all groups of pCMV-Dicer or pCMV-control transfected cells and blank control. (A) H2O2 treatment elevated the cell apoptotic rate. *p < .05, vs. pCMV-control transfected cells; #p < .05 vs. cells without H2O2 intervention. (B) H2O2 treatment suppressed cell migration. *p < .05, vs. pCMV-control transfected cells; #p < .05 vs. cells without H2O2 intervention. (C) H2O2 treatment suppressed cell viability. *p < .05, vs. pCMV-control transfected cells; #p < .05 vs. cells without H2O2 intervention.
Discussion
As a key processor in microRNA processing, Dicer has long been considered to have functions in tumorigenesis, tumor progression and postoperative prognosis of cancer patients [Citation15–22]. In our previous research, we found that Dicer acted as a tumor suppressor gene in HCC [Citation22], but the true mechanism of how Dicer suppresses HCC growth was poorly known. We extended our research to explore the interaction of ROS and COX in Dicer induced suppression. Overexpression of Dicer in the HCC cell line SMMC-7721 can repress COX activity, followed by the elevation of the ROS level, and could finally promote cell apoptosis, repress cell viability and cell migration. Our data indicated that Dicer could inhibit HCC growth via promoting ROS generation. ROS and COX interacted with each other to modify this process.
It was reported that Dicer knockdown can repress the expression of NADPH Oxidase 4 (NOX4), which encodes the gp91 catalytic subunit of NADPH oxidase, leading to a decrease in ROS production [Citation33]. In microvascular endothelial cells, Dicer can regulate the expression of Neutrophil Cytosolic Factor 1 (NCF1/p47phox), a gene encoding another subunit of NADPH oxidase, via HMG-box Transcription Factor 1 (HBP1) gene [Citation34]. We speculated that Dicer may have a conserved function in regulating the expression of NOX4 and NCF1/p47phox in HCC and endothelial cells, and overexpressing Dicer in HCC can increase ROS production by elevating the expression of NOX4 and NCF1/p47phox. Indeed, it was predicted that NOX4 was one of the target genes of miR210 by in silico prediction [Citation35]. The variation of resistance to oxidative stress of different tumor cells may explain why Dicer was a suppressor in HCC, but an oncogene in endothelial cell tumor [Citation15–21].
COX is an enzyme complex composed by multiple subunits which are encoded by different genes. According to previous studies, some of these subunit encoding genes are also regulated by microRNAs. For instance, the expression of Cytochrome C Oxidase subunit I (COX1) was regulated by miR181c in heart cells and the mRNA level of COX4 was regulated by miRNA338 in axons of sympathetic neurons [Citation36,Citation37]. Since Dicer is the key processor for biosynthesis of all microRNAs [Citation20], the change in COX activity in Dicer transfected cells was probably due to the expressional alteration of microRNAs targeted genes encoding COX subunits.
The redox balance, which was deeply influenced by COX and ROS, plays a pivotal role in tumor progression and metastasis [Citation3]. COX is the terminal enzyme in rate-limiting step in ETC [Citation38,Citation39], whereas ROS refers to a series of highly reactive derivatives of oxygen whose content can disrupt the redox homeostasis [Citation4]. Previous studies that investigated the relationship between COX activity and ROS level showed that increased COX activity could reduce the production of ROS in HeLa cells and gliomas [Citation9,Citation10]. Consistent with previous reports, we found that the decreased COX activity by ADDA 5 hydrochloride can elevate the ROS level in HCC cells. NADPH oxidase may also act as an important linker between COX and ROS, as it was reported that reduced COX activity promoted ROS not in mitochondria but via endoplasmic reticulum located NADPH oxidase Yno1p in yeast [Citation40]. Surprisingly, a decreased COX activity was found in cells treated with NAC, which can repress the ROS level. This result implied that COX negatively modulated the ROS generation, while ROS also interacted with COX to reduce the activity of this enzyme.
Conclusions
Our study showed that the overexpression of Dicer in liver cancer cells induced apoptosis by up-regulating oxidative stress levels. It could both induce the ROS generation and reduce COX activity to up-regulate oxidative stress levels. ROS and COX interacted with each other to modify this process. Our data indicate that Dicer may serve as a gene marker for the diagnosis of HCC and a potential target of gene therapy of HCC.
Author contributions
L.H. and J.W. performed the experiment, N.X and Y.Z. collected data and performed statistical analysis, L.H. wrote the manuscript, Z.G. and F.W. contributed to project design, data collection and manuscript writing. All authors read and approved the final manuscript.
Ethics approval and consent to participate
All procedures were supervised and approved by the Human Tissue Research Committee of the Fourth hospital of Hebei Medical University. Written consent was obtained from all patients enrolled in this study.
Disclosure statement
The authors declare no competing interests.
Data availability statement
The data supporting the findings of this study are available from the corresponding author upon reasonable request.
Additional information
Funding
References
- Sung H, Ferlay J, Siegel RL. Global cancer statistics 2020: GLOBOCAN estimates of incidence and mortality worldwide for 36 cancers in 185 countries. 2021.
- Liu S, An J, Lin J, et al. Single nucleotide polymorphisms of microRNA processing machinery genes and outcome of hepatocellular carcinoma. PLoS One. 2014;9(3):e92791.
- Saikolappan S, Kumar B, Shishodia G, et al. Reactive oxygen species and cancer: a complex interaction. Cancer Lett. 2019;452:132–143.
- Aggarwal V, Tuli HS, Varol A, et al. Role of reactive oxygen species in cancer progression: Molecular mechanisms and recent advancements. Biomolecules. 2019;9(11):735.
- Kuo MT, Savaraj N. Roles of reactive oxygen species in hepatocarcinogenesis and drug resistance gene expression in liver cancers. Mol Carcinog. 2006;45(9):701–709.
- Gentric G, Maillet V, Paradis V, et al. Oxidative stress promotes pathologic polyploidization in nonalcoholic fatty liver disease. J Clin Invest. 2015;125(3):981–992.
- Wang F, Yang JL, Yu KK, et al. Activation of the NF-κB pathway as a mechanism of alcohol enhanced progression and metastasis of human hepatocellular carcinoma. Mol Cancer. 2015;14:10.
- Dai X, Wang L, Deivasigamni A, et al. A novel benzimidazole derivative, MBIC inhibits tumor growth and promotes apoptosis via activation of ROS-dependent JNK signaling pathway in hepatocellular carcinoma. Oncotarget. 2017;8(8):12831–12842.
- Campian JL, Gao X, Qian M, et al. Cytochrome c oxidase activity and oxygen tolerance. J Biol Chem. 2007;282(17):12430–12438.
- Oliva CR, Nozell SE, Diers A, III, et al. Acquisition of temozolomide chemoresistance in gliomas leads to remodeling of mitochondrial electron transport chain. J Biol Chem. 2010;285(51):39759–39767.
- Foulkes WD, Priest JR, Duchaine TF. DICER1: mutations, microRNAs and mechanisms. Nat Rev Cancer. 2014;14(10):662–672.
- Ventura A, Jacks T. MicroRNAs and cancer: short RNAs go a long way. Cell. 2009;136(4):586–591.
- Caruso S, Calderaro J, Letouzé E, et al. Germline and somatic DICER1 mutations in familial and sporadic liver tumors. J Hepatol. 2017;66(4):734–742.
- Heravi-Moussavi A, Anglesio MS, Cheng SW, et al. Recurrent somatic DICER1 mutations in nonepithelial ovarian cancers. N Engl J Med. 2012;366(3):234–242.
- Yang R, Xu J, Hua X, et al. Overexpressed miR-200a promotes bladder cancer invasion through direct regulating dicer/miR-16/JNK2/MMP-2 axis. Oncogene. 2020;39(9):1983–1996.
- Minghu F, Baohua C, Helong C, et al. miR-186 mediated up-regulation of Dicer1 inhibits Colon cancer invasion and metastasis. Current Immunology. 2020;40:177–186.
- Dong J, Wang J, Shan C, et al. MicroRNA-892a regulates laryngocarcinoma cell proliferation via dicer. Exp Biol Med (Maywood). 2020;245(14):1222–1232.
- Gao C, Li X, Tong B, et al. Up-regulated expression of dicer reveals poor prognosis in laryngeal squamous cell carcinoma. Acta Otolaryngol. 2014;134(9):959–963.
- Bian XJ, Zhang GM, Gu CY, et al. Down-regulation of dicer and Ago2 is associated with cell proliferation and apoptosis in prostate cancer. Tumour Biol. 2014;35(11):11571–11578.
- Faber C, Horst D, Hlubek F, et al. Overexpression of dicer predicts poor survival in colorectal cancer. Eur J Cancer. 2011;47(9):1414–1419.
- Faggad A, Budczies J, Tchernitsa O, et al. Prognostic significance of dicer expression in ovarian cancer-link to global microRNA changes and oestrogen receptor expression. J Pathol. 2010;220(3):382–391.
- Zhang L, Wang C, Liu S, et al. Prognostic significance of dicer expression in hepatocellular carcinoma. Oncol Lett. 2016;11(6):3961–3966.
- Wu X, Chen X, Liu H, et al. Rescuing dicer expression in inflamed Colon tissues alleviates colitis and prevents colitis-associated tumorigenesis. Theranostics. 2020;10(13):5749–5762.
- Chen X, Li WF, Wu X, et al. Dicer regulates non-homologous end joining and is associated with chemosensitivity in Colon cancer patients. Carcinogenesis. 2017;38(9):873–882.
- Yang Y, Ishak Gabra MB, Hanse EA, et al. MiR-135 suppresses glycolysis and promotes pancreatic cancer cell adaptation to metabolic stress by targeting phosphofructokinase-1. Nat Commun. 2019;10(1):809.
- Li Q, Liu X, Yin Y, et al. Insulin regulates glucose consumption and lactate production through reactive oxygen species and pyruvate kinase M2. Oxid Med Cell Longev. 2014;2014:504953.
- Zhang K, Wu L, Zhang P, et al. miR-9 regulates ferroptosis by targeting glutamic-oxaloacetic transaminase GOT1 in melanoma. Mol Carcinog. 2018;57(11):1566–1576.
- Li SZ, Hu YY, Zhao J, et al. MicroRNA-34a induces apoptosis in the human glioma cell line, A172, through enhanced ROS production and NOX2 expression. Biochem Biophys Res Commun. 2014;444(1):6–12.
- Akan I, Akan S, Akca H, et al. Multidrug resistance-associated protein 1 (MRP1) mediated vincristine resistance: effects of N-acetylcysteine and buthionine sulfoximine. Cancer Cell Int. 2005;5(1):22.
- Oliva CR, Markert T, Ross LJ, et al. Identification of small molecule inhibitors of human cytochrome c oxidase that target chemoresistant glioma cells. J Biol Chem. 2016;291(46):24188–24199.
- Zhang S, Guo Z, Xu J, et al. miR-502-mediated histone methyltransferase SET8 expression is associated with clear cell renal cell carcinoma risk. Oncol Lett. 2017;14(6):7131–7138.
- Jia Y, Li R, Cong R, et al. Maternal low-protein diet affects epigenetic regulation of hepatic mitochondrial DNA transcription in a sex-specific manner in newborn piglets associated with GR binding to its promoter. PLoS One. 2013;8(5):e63855.
- Gordillo GM, Biswas A, Khanna S, et al. Dicer knockdown inhibits endothelial cell tumor growth via microRNA 21a-3p targeting of nox-4. J Biol Chem. 2014;289(13):9027–9038.
- Shilo S, Roy S, Khanna S, et al. Evidence for the involvement of miRNA in redox regulated angiogenic response of human microvascular endothelial cells. Arterioscler Thromb Vasc Biol. 2008;28(3):471–477.
- Chen Z, Li Y, Zhang H, et al. Hypoxia-regulated microRNA-210 modulates mitochondrial function and decreases ISCU and COX10 expression. Oncogene. 2010;29(30):4362–4368.
- Das S, Ferlito M, Kent OA, et al. Nuclear miRNA regulates the mitochondrial genome in the heart. Circ Res. 2012;110(12):1596–1603.
- Aschrafi A, Schwechter AD, Mameza MG, et al. MicroRNA-338 regulates local cytochrome c oxidase IV mRNA levels and oxidative phosphorylation in the axons of sympathetic neurons. J Neurosci. 2008;28(47):12581–12590.
- Chesney J, Telang S. Regulation of glycolytic and mitochondrial metabolism by ras. Curr Pharm Biotechnol. 2013;14(3):251–260.
- Kadenbach B, Hüttemann M, Arnold S, et al. Mitochondrial energy metabolism is regulated via nuclear-coded subunits of cytochrome c oxidase. Free Radic Biol Med. 2000;29(3-4):211–221.
- Leadsham JE, Sanders G, Giannaki S, et al. Loss of cytochrome c oxidase promotes RAS-Dependent ROS production from the ER resident NADPH oxidase, Yno1p, in yeast. Cell Metab. 2013;18(2):279–286.