
Abstract
Myriocin, isolated from Bacillus amyloliquefaciens LZN01, can inhibit the growth of Fusarium oxysporum f. sp. niveum (Fon) by inducing membrane damage and targeting intracellular molecules. In the present study, the mechanism of myriocin entry into Fon cells was investigated. Fluorescence images demonstrated that internalization of myriocin was decreased by low temperature, NaN3 and Brefeldin A. The mechanism of myriocin entry into Fon cells was revealed by analyses of transcriptome and proteome. A total of 422 common differentially expressed genes (DEGs) were identified. Most of DEGs were assigned to transport and catabolism, folding, sorting and degradation, and enrichment analysis of some DEGs was closely related to transmembrane transport and vesicle transport. The combined analysis between the transcriptome and proteome showed that the expression levels of some related genes and proteins, mainly those related to oxidative phosphorylation, ABC transporters, micro chromosome maintenance protein, adaptor proteins etc., were affected. The DEGs were further verified by reverse transcription quantitative polymerase chain reaction (RT-qPCR). In conclusion, myriocin’s entry into Fon cells depended partially on energy and involved endocytosis, and the expression of certain genes and proteins was affected.
Introduction
Fusarium wilt in watermelon is a world-wide soil-borne disease caused by Fusarium oxysporum f. sp. niveum (Fon) [Citation1]. The symptoms of Fusarium wilt include vascular tissue browning, foliar wilting, root rot and plant death [Citation2]. Fon can survive for a long period in soil, and can cause infection in the whole growth period of watermelon, which seriously limits the production of watermelon [Citation3]. Therefore, control of Fusarium oxysporum f. sp. niveum is crucial to improve the quality and yield of watermelon.
Biological control is one of effective methods for controlling Fusarium wilt in watermelon. Bacillus amyloliquefaciens LZN01, a potential biocontrol agent, was isolated from wheat rhizosphere in the watermelon/wheat companion system [Citation4]. A number of biocontrol agents have been found to produce antifungal compounds, which play important roles in controlling the growth of phytopathogens. Many antimicrobial peptides are considered to kill microbes by permeabilizing cell membranes. Bacillomycin L enters the cells by membrane permeabilization and interacts with intracellular targets, which exhibit antifungal activities against Rhizoctonia solani kühn [Citation5]. Some antimicrobial peptides are able to penetrate biological membranes without membrane permeabilization [Citation6]. Protegrins attack bacteria by associating with the bacterial membrane and forming transmembrane pores that facilitate the unrestricted transport of ions [Citation7]. May et al. [Citation8] confirmed that novobiocin did not bind the ATP binding site but rather the interface between the ATPase subunits and the transmembrane subunits of the lipopolysaccharide transporter, which alters the permeability of Escherichia coli membrane. Gramicidin A is a peptide antibiotic that disrupts the transmembrane ion concentration gradient by forming an ion channel in a lipid bilayer [Citation9]. Myriocin, which is produced by Myriococcum albomyces, Melanconis flavovirens, Isaria sinclairii, Paecilomyces variotii ATCC 74097 and B. amyloliquefaciens LZN01 [Citation4, Citation10,Citation11], is a sphingosine analogue with antifungal properties [Citation12]. Myriocin exhibited activity against Fon by inducing membrane damage and targeting intracellular molecules [Citation13,Citation14]. However, it remains unclear how myriocin enters Fon cells. Therefore, studies on the mechanism of myriocin’s entry into Fon cells are very necessary.
In this study, MIC (1.25 μg/mL) and 8MIC (10 μg/mL) of myriocin were employed to investigate the mechanism of myriocin’s entry into Fon cells, which may provide new insights into myriocin killing of Fon cells.
Materials and methods
Experimental preparation
The Fon conidia used in this study were provided by the Microbial Ecology Laboratory of Qiqihar University [Citation4]. Fon conidia suspension was prepared according to the method described by Wang et al. [Citation13]. Myriocin was dissolved in dimethyl sulfoxide (DMSO) and diluted into final concentrations (MIC, 1.25 μg/mL and 8MIC, 10 μg/mL) with DMSO at concentrations less than or equal to 1% [Citation10]. Latranculin A (LatA), Filipin and Cytochalasin D (CytoD) were purchased from Yingxin (Shanghai, China). Brefeldin A (BFA) was purchased from Meilunbio (Dalian, China). Tetramethyl rhodamine (TMR) and NaN3 were obtained from Sigma (Sigma-Aldrich, USA). The inhibitors and NaN3 were used at the following concentrations: 50 mmol/L Brefeldin A, 10 mmol/L Cytochalasin D, 10 mmol/L Latrunculin A, 10 mg/mL Filipin and 3 mmol/L NaN3.
Determination of ATP dependence of myriocin
The Fon conidia were pretreated with low temperature 4 °C and NaN3, respectively. Myriocin solutions were labelled with an appropriate amount of tetramethyl rhodamine (TMR). The Fon conidial suspensions were mixed with myriocin-TMR at final concentrations of MIC (1.25 μg/mL) and 8MIC (10 μg/mL) [Citation13], and the mixtures were incubated for 3 h or 12 h. In the control (CK), the Fon conidia were not pretreated with low temperature 4 °C or NaN3, and Fon conidia suspensions were mixed with myriocin-TMR at final concentrations of MIC and 8MIC and incubated for 3 h or 12 h. Then, the mixtures were centrifuged. The fluorescence intensity and distribution of myriocin-TMR in cells were visualized by a confocal laser scanning microscope (TCS SP8, Leica, Germany) at 63× magnification and excitation wavelengths of 507 nm and emission wavelength of 529 nm.
Effect of four endocytosis inhibitors on internalization of myriocin
The experimental procedure to test the effect of four endocytosis inhibitors on the internalization of myriocin followed the method described by El-Mounadi et al. [Citation15] with some modifications. Briefly, Fon conidia were pretreated with 50 mmol/L brefeldin A, 10 mg/mL of filipin, 10 mmol/L Cytochalasin D and 10 mmol/L Latrunculin A at 25 °C for 30 min. Then, we challenged the treated conidia and the untreated conidia (CK) with myriocin-TMR at final concentrations of MIC and 8MIC for 12 h. The number of conidia that internalized the fluorescently labelled myriocin following each treatment was counted and compared to the untreated control. The number of conidia that internalized myriocin-TMR was counted by confocal laser scanning microscope according to the methods described above. Each treatment was repeated three times.
RNA-Seq
According to the above results, Fon conidia treated with MIC (1.25 μg/mL) and 8MIC (10 μg/mL) myriocin for 12 h were selected for omics analysis. Fon conidia treated with 0 μg/mL myriocin for 12 h was used as the control (CK). The mixtures were centrifuged at 8000 ×g for 10 min and immediately frozen in liquid nitrogen for RNA extraction and RNA sequencing. Three biological replicates were performed in treatment groups and the control, respectively.
A uniq-10 column TRIzol® total RNA extraction kit (Invitrogen, USA) was used to extract total RNA from the different samples, and DNase I was used to remove the DNA. Each treatment was carried out in three replicates. Integrity and concentration of RNA were evaluated using 2100 Bioanalyzer (Agilent, USA) and a NanoDrop spectrophotometer (ND-2000, Thermo, USA). High-quality total RNA samples (OD260/230 ≥ 2.0, OD260/280 = 1.8 ∼ 2.2, RIN ≥ 6.5, 28S: 18S ≥ 1.0, > 2 μg) was select to construct RNA sequencing library. RNA sequencing libraries were built using Illumina’s TruSeqTM RNA library preparation kit according to the manufacturer’s instructions, and index codes were added. The first strand cDNA was synthesized using hexamer random primers and M-MuLV reverse transcriptase, and the double strand cDNA was generated using Superscript Double-Strand cDNA synthesis kit (Invitrogen, CA, USA). Phusion® High-Fidelity DNA polymerase was used to perform polymerase chain reaction (PCR) amplification for 15 PCR cycles, and then the PCR amplification products were quantified using TBS380 (PicoGreen). Next, the paired-end RNA sequencing library was sequenced on the Illumina HiSeq 4000 platform with 2 × 150 bp reads, and the raw paired-end reads were trimmed according to methods described by Liu et al. [Citation16].
The raw RNA sequencing data were uploaded to Short Reads Archive in NCBI (https://www.ncbi.nlm.nih.gov/). The accession number was PRJNA 643229. The sequence reads were aligned to the Fusarium oxysporum reference genome using TopHat software, and then the mapped results were searched in the database (ftp://ftp.ncbi.nlm.nih.gov/blast/executables/blast+/2.9.0/) by blast. Differences in gene expression among samples were compared using the FPKM value. Fold changes of transcripts and DEGs were determined and screened using the edger software package. The criteria of significant differential expression were performed as described by Wang et al. [Citation14]. Gene Ontology (GO), Clusters of Orthologous Groups (COG) and Kyoto Encyclopedia of Genes and Genomes (KEGG) were used for annotation. Go and KEGG enrichment analyses of DEGs were performed. Network interaction analysis of DEG-DEG was explored.
Protein extraction and liquid chromatography with tandem mass spectrometry (LC-MS/MS) analysis
The samples were prepared according to the methods described in RNA-Seq. Proteins from the samples were extracted using extraction buffer (50 mmol/L Tris-HCl, 200 mmol/L dithiothreitol, 1% sodium dodecyl sulfate (SDS), and 1% protease inhibitor, pH 8.8). After centrifugation at 12000 ×g at 4 °C for 20 min, the obtained supernatants were precipitated with precooled acetone at −20 °C overnight, and then the obtained precipitate was washed twice with 90% precooled acetone. Then, the protein precipitate was re-dissolved with lysis buffer (8 M urea, 1% SDS and 1% protease inhibitor) and the lysates were centrifuged. Next, the protein content in the supernatants was evaluated by bicinchoninic acid (BCA) assay. Protein digestion was performed according to the standard procedure described by Morein et al. [Citation17]. In brief, an appropriate amount of trichloroethyl phosphate was mixed with 150 μg protein in each sample tube, and then the mixtures were incubated at 37 °C for 60 min. Next, the sample was resuspended in 150 μL buffer (100 mmol/L tetraethyl-ammonium bromide, TEAB). For each sample, trypsin and about 150 μg protein were mixed in a mass ratio of 1:50 and digested overnight at 37 °C. After trypsin digestion, the obtained peptides were desalted OASIS® HLB μElution plates and vacuum dried, and the peptide concentrations were determined by a peptide quantification kit (Thermo, Cat. 23275).
LC-MS/MS analysis was performed according to the methods described by Zhong et al. [Citation18]. The peptide was loaded onto a C18 reversed-phase column with buffer A composed of 2% acetonitrile and 0.1% formic acid, and separated with linear gradient of buffer B (80% acetonitrile and 0.1% formic acid) at a flow rate of 300 μL/min. The peptides underwent nanoelectrospray ionization and were analyzed using Ultra Performance Liquid Chromatography (UPLC) coupled with tandem mass spectrometry on the Q Exactive mass spectrometer. The intact peptides were discerned in Orbitrap at 70000 resolution. Peptide dissociation was induced by high energy collision dissociation (HCD), and ion fragments were identified in Orbitrap at a resolution of 17500.
Proteomics data processing
The mass spectrometry proteomics data were deposited to ProteomeXchange Consortium (http://proteomiccentral.proteomexchange.org) via the iProXs partner repository with the dataset identifier number PXD020176. The acquired MS/MS spectra were searched using ProteomeDiscoverTM 2.2 against the Fusarium oxysporum database (27347 s, 20190328). Trypsin digestion was selected with cleavage specificity allowing up to two missing cleavages. Carbamidomethyl of cysteine was assigned as fixed modification, and oxidation of methionine and N-terminal acetylation of protein were designated as variable modification. Fold change > 1.2 or < 0.83 and p-value < 0.05 were considered as the criteria for screening differentially expressed proteins (DEPs) between the two samples. Go pathway enrichment analysis of DEPs was performed. The network interactions of DEP-DEP were analyzed.
RT-qPCR
RT-qPCR was employed to verify RNA-Seq results, 6 DEGs from the RNA-Seq analysis were selected. Total RNA from samples was quantified at OD260 and OD280 using a SMA400 micro- spectrophotometer. Single stranded cDNA of total RNA was generated by reverse transcriptase, and cDNA samples were stored at −20 °C for later use. RT-qPCR was performed on StepOne Plus Real-time PCR system (ABI, Waltham, MA, USA). The primer sequences used for RT-qPCR are shown in Supplemental Table S1, and 18S rRNA gene was used as internal control with which normalization of the mRNA abundance between samples was performed. The PCR reaction system and circulation conditions are shown in Supplemental Tables S2 and S3. The specificity of amplification was detected according to the generated unwinding curve. Relative quantification of genes was done by the 2-ΔΔ CT method. Each measurement was repeated three times.
Statistical analysis
Statistical analysis of data was performed by SPSS 26.0 software. The data were expressed as mean values with standard error (±SEM) from three biological replicates. Venn diagram was constructed by using Funrich 3.0. T-test was used for statistical analysis. Differences were considered statistically significant at the level of p ≤ 0.05 and p ≤ 0.01.
Results
In Fon cells, internalization of myriocin involved energy-dependent and independent mechanisms
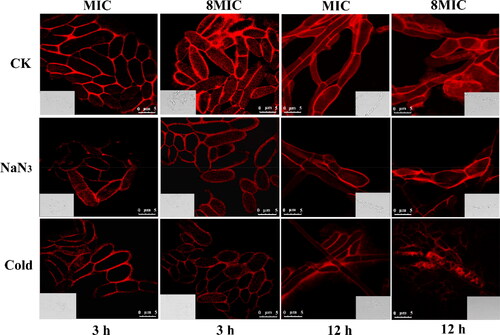
We have previously reported that myriocin targeted intracellular molecules and resulted in disordered metabolism of Fon cells [Citation14]. The question arises as to how myriocin enters the cells of Fon. By analogy to the approach applied by El-Mounadi et al. [Citation15], to answer this question, Fon conidia were treated with MIC and 8MIC tetramethyl rhodamine (TMR)-labeled myriocin and images were captured over a period of 3 h and 12 h using confocal microscopy. As shown in , the fluorescence inside Fon cells increased with time and TMR-myriocin concentration. The mechanisms by which myriocin enters Fon cells remain poorly understood. Endocytosis and direct penetration via an energy-independent pathway have been proposed as the two major internalization mechanisms [Citation19]. To test which of these two mechanisms is involved in the uptake of myriocin by Fon cells, we incubated Fon conidia at 4 °C for 30 min before challenging them with MIC and 8MIC TMR-myriocin, respectively. The challenged conidia were then kept at 4 °C for 3 h and 12 h, respectively, before being imaged. Fon conidia were also pre-treated for 30 min with 3 mmol/L NaN3, and subsequently exposed to TMR-myriocin for 3 h and 12 h, respectively. The fluorescence intensity of condia that internalized TMR-myriocin in each treatment was compared to the control (CK). Low temperature (4 °C) and NaN3 treatments inhibit ATP production, thus energy-dependent processes such as endocytosis should be restrained [Citation20]. The results showed that the fluorescence intensity of internalization of myriocin in cold and NaN3 treatments was decreased compared to the control. It suggested that both energy dependent and independent mechanisms are involved in the internalization of myriocin.
Figure 1. The internalization of fluorescently labeled myriocin in Fon is inhibited following treatment with the metabolic inhibitor NaN3 and incubation at 4 °C. Fluorescence intensity of cells that internalized TMR-Myriocin in untreated conidia (CK), conidia pre-treated with NaN3 and conidia pre-incubated at 4 °C. Fon conidia were pre-treated with 3 mM NaN3 or pre-incubated at 4 °C for 30 min before exposure to 1 MIC and 8MIC of rhodamine-labeled myriocin respectively. Images were captured after 3 h and 12 h of exposure to myriocin. Bar = 5 μm.
Internalization of myriocin in Fon is inhibited by Brefeldin A (BFA)
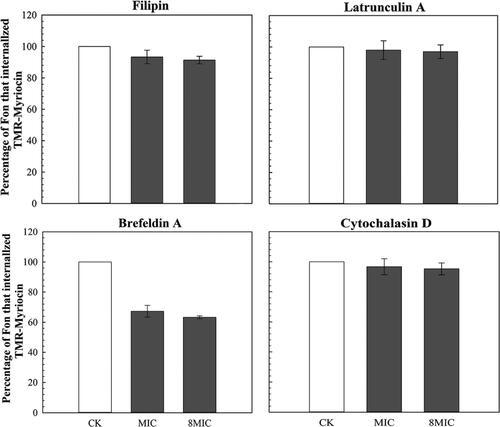
To study the effects of various endocytosis inhibitors, in this study, we studied the effects of various endocytosis inhibitors, including filipin, Cytochalasin D, Latrunculin A and Brefeldin A (BFA) on myriocin entering Fon conidia and we followed the procedure used by El-Mounadi et al. [Citation15]. The number of conidia that internalized the fluorescently labelled myriocin in each treatment was counted and compared to control (CK). The results showed that internalization of TMR-myriocin was not affected by filipin, Cytochalasin D and Latrunculin A. However, Brefeldin A significantly inhibited the internalization of TMR-myriocin ().
Figure 2. The effect of four endocytosis inhibitors on internalization of TMR-myriocin.
Note: Cells whose fluorescence intensity exceeds 50% of the cell area are regarded as a completely internalized cells.
GO function annotation, GO and KEGG enrichment analysis and expression analysis of ATP-related DEGs and DEPs
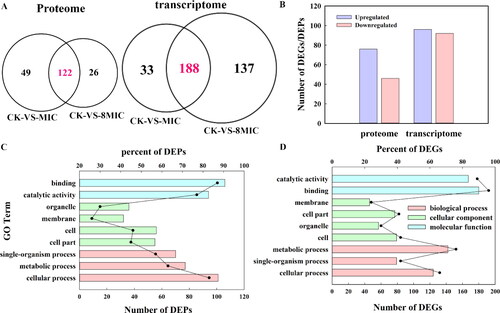
In our previous study, we focused on membrane-related DEGs and DEPs [Citation13]. Myriocin affected the expression of some membrane-related DEGs and DEPs and targeted intracellular molecules. To demonstrate how myriocin gets into Fon cells, in this study, we focused on ATP-related DEGs and DEPs. At the protein level, 197 DEPs were identified by statistical criteria (fold changes ≥ 1.2 or ≤ 0.83, P-value < 0.05). CK-VS-MIC and CK-VS- 8MIC included 171 DEPs and 148 DEPs, respectively; And 122 common DEPs in CK-VS-MIC and CK-VS-8MIC were discovered (). Of the 122 common DEPs, 76 and 46 proteins were significantly upregulated and downregulated under myriocin treatment, respectively (). At the mRNA level, a total of 358 DEGs was identified (fold changes ≥ 2 or ≤ 0.5, P-value ≤ 0.05). And 188 common DEGs were found in CK-VS-MIC and CK-VS-8MIC (), of which 96 genes were significantly upregulated and 92 genes were significantly downregulated in myriocin treatments (). Common DEPs and DEGs were summarized with GO function annotation. DEPs and DEGs were mainly concentrated in binding, catalytic activity, metabolic process and cellular process. DEPs were mainly distributed in binding (87%) and cellular processes (83%), and DEGs were mainly distributed in binding (96%) and catalytic activity (89%) (). As shown in , a large proportion of DEPs and DEGs were involved in binding and catalytic activities.
Figure 3. Venn diagram, number and GO functional annotations of the DEGs and DEPs (p < 0.05). CK, 0 μg/mL myriocin; MIC, 1.25 μg/mL myriocin; 8MIC, 10 μg/mL myriocin. (A) Venn diagram of the DEGs and DEPs in CK-VS-MIC and CK-VS-8MIC. This figure was performed by using Funrich 3.0. (B) The number of common DEGs or DEPs in both CK-VS-MIC and CK-VS-8MIC. (C) GO functional annotation of DEPs and DEGs. GO categories significantly enriched (P < 0.05) are shown in the figure. The ordinate represents the GO term, the lower abscissa represents the number of DEPs or DEGs (column) and the upper abscissa represents the per-cent (dot). The biological process, cellular component and molecular function are represented by red, green and blue, respectively.
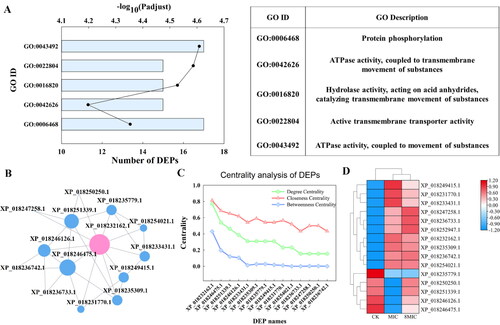
Go pathway enrichment analysis was performed. As shown in , common DEPs were enriched in the first five pathways: ATPase activity, coupled to movement of substances, active transmembrane transporter activity, hydrolase activity, acting on acid anhydrides, catalyzing transmembrane movement of substances, protein phosphorylation and ATPase activity, coupled to transmembrane movement of substances, which is involved in ATPase activity and transmembrane movement. The common DEPs, enriched in the first three pathways, were used to perform analysis of network interaction. In the PPI network, there were 15 DEPs interactions, and XP_ 018232162.1 (ATP synthase, F-type H+-transporting ATPase subunit alpha) is involved in the first three enrichment pathways (). The degree centrality, closeness centrality and betweenness centrality of XP_018232162.1 were 0.7, 0.8 and 0.4, respectively (), and these values of XP_018232162.1 were higher than for the other proteins. The results showed that ATP synthase (XP_018232162.1) was a core protein, which suggested that it plays an important role in interacting with the protein network. The XP_ 018232162.1(F-type H+-transporting ATPase subunit alpha) interacted not only with 10 DEPs in ATP and transmembrane transport, but also with XP_ 018233431.1(F-type H+-transporting ATPase subunit G), XP_ 018249415.1(plasma membrane ATPase), XP_ 018235309.1 (ATP binding cassette, subfamily B), etc. (Supplemental Table S4). Of the 15 DEPs, 10 proteins were significantly upregulated and 5 proteins were downregulated under myriocin treatments (). Most of the upregulated proteins are related to ATP synthase, plasma membrane ATPase, Ca2+ transport ATPase and other ATPases. The results showed that the expression level of proteins involved in the above transmembrane ATP related pathway was affected by myriocin, which may help myriocin enter Fon cells.
Figure 4. Go enrichment pathway, interaction networks, distribution of network center coefficient and clustering heatmap of DEPs.
(A) Go enrichment pathway of DEPs. The ordinate represents GO ID, the lower abscissa represents the number of DEPs (columns), and the upper abscissa represents the significance level (points) of enrichment.
(B) Diagram of interaction network among DEPs; each node represents a DEP, and the connection represents the correlation of DEP. The size of the node indicates the correlation with other DEPs. The bigger the node, the more important it is in the network.
(C) Distribution of the network center coefficient, abscissa represents protein ID, and ordinate represents centrality, including degree centrality, closeness centrality and betweenness centrality. The higher these three values are, the more important the node in maintaining the connection of the whole network, the larger the degree centrality of the node is, and the closer it is to the network center.
(D) Clustering heatmap of DEPs. The color represents the protein expression level, and the tree diagram of protein clustering is displayed on the left. The protein ID is displayed on the right.
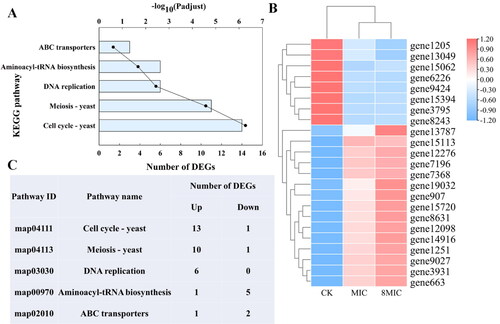
As shown in , the first five KEGG enriched pathways were related to cell cycle, meiosis, DNA replication, aminoacyl tRNA biosynthesis and ABC transporter. Of the 23 DEGs, 15 and 8 DEGs were significantly upregulated and downregulated, respectively (). The upregulated DEGs were mainly distributed in cell cycle, meiosis and DNA replication (). Six DEGs co-existed in the three enriched pathways (DNA replication, cell cycle and meiosis), which were significantly upregulated (Supplemental Figure S1 and Table S5). The six DEGs are relevant to micro chromosome maintenance protein (MCM). MCM is related to ATPase and can promote hydrolysis of ATP [Citation21]. The results showed that ATP-related genes were affected by myriocin, which may induce myriocin to enter Fon cells.
Figure 5. KEGG pathway enrichment, clustering heatmap of DEGs, and the number of upregulated and downregulated DEGs in the five pathways. (A) The KEGG pathway enrichment of DEGs. The ordinate represents the KEGG pathway, the nether abscissa represents the number of DEGs (columns), and the upper abscissa (dot) represents the significance level of enrichment. (B) Clustering heatmap of DEGs. The color shows the expression level of gene, and the tree diagram of gene clustering is displayed on the left. The gene ID is displayed on the right. (C) The number of upregulated and downregulated DEGs in the five pathways, which are cell cycle, meiosis, DNA replication, aminoacyl tRNA biosynthesis and ABC transporter.
Functional annotation and enrichment analysis of common DEGs
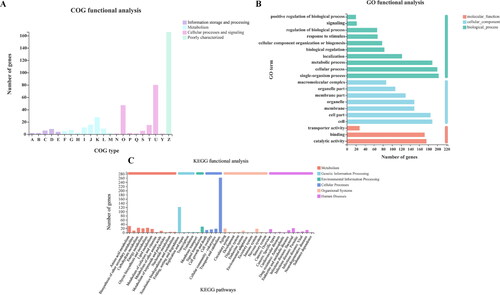
The COG annotation showed that 422 common DEGs were classified into 22 categories ( and Supplemental Table S6). Most common DEGs were distributed in the first five categories involving intracellular trafficking, secretion and vesicular transport (U), posttranslational modification, protein turnover, chaperones (O), energy production and conversion (K), amino acid transport and metabolism (J), and signal transduction mechanisms (T). Among these categories, two (J, K) belong to metabolism and three (O, T, U) belong to cellular processes and signals. The common DEGs were classified according to GO functional annotation (). Most common DEGs were assigned to biological process (Bp) and cellular component (Cc), which were mainly concentrated in single biological process, cellular processes, metabolic process, cells and cell part. As shown in , the assigned functions of DEGs included 6 categories and involved 41 pathways. Regarding DEG number, most DEGs were assigned to transport and catabolism, folding, sorting and degradation.
Figure 6. Functional annotation (A, B, C) of common DEGs. The functional descriptions of the COG types are shown in Supplemental Table S4. GO categories and KEGG pathways significantly enriched (p < 0.05) are shown in the figure.
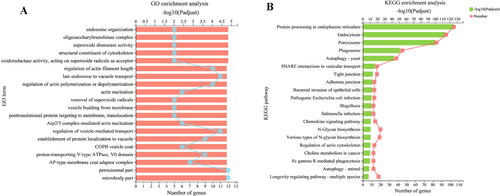
As shown in , the first 20 GO enrichment items involved 328 DEGs that are mainly related to transmembrane transport and Golgi vesicle transport. shows that 371 DEGs were enriched in the top 20 KEGG pathways. Among these pathways, DEGs were mainly distributed to protein processing in endoplasmic reticulum, endocytosis, peroxisome, phagosome, autophagy and vesicle transport, which are closely related to vesicle transport. The results indicated that the expression of genes related to vesicle transport was affected by myriocin.
Figure 7. Enrichment analysis (A, B) of common DEGs. GO categories and KEGG pathways significantly enriched (p < 0.05) are shown in the figure.
Myriocin affected the expression of genes and proteins in the endocytosis pathway
Expression analyses of DEGs in the endocytosis pathway were performed. As shown in , of the 9 common DEGs, 4 and 5 genes were significantly upregulated and downregulated, respectively. Among them, the upregulated 4 genes are related to the formation of clathrin vesicles and Rab protein family, and most of the downregulated genes are relevant to late endocytosis, multivesicular body and ADP-ribosylation factor (ARF) protein [Citation22]. To further study the relationship between different DEGs in the endocytosis pathway, correlation network analyses of DEGs-DEGs were carried out. The results showed that 9 DEGs in the endocytosis pathway were correlated, and 7 DEGs had strong correlation except for gene16751 and gene15959 (). The results indicated that the genes in the endocytosis pathway, including those involved in vesicles transport, responded to myriocin and were associated with each other.
Figure 8. Heatmap (A,C) and network interaction analysis (B,D) of DEPs and DEGs related to endocytosis.
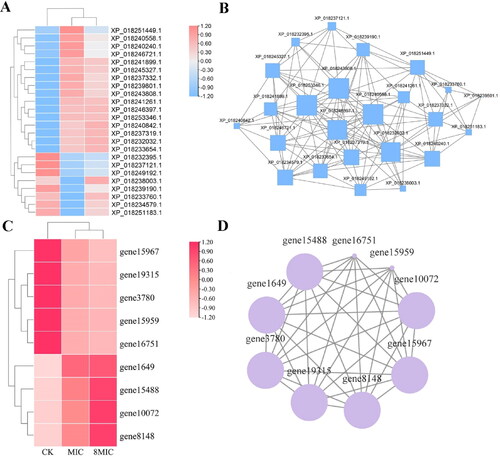
Of the 24 common DEPs in the endocytic pathway, 16 and 8 proteins were significantly upregulated and downregulated, respectively (). In the PPI networks, there were 24 DEPs interactions. AMPH (XP_018240558.1) and EPS15 (XP_018243808.1) were most closely related to the expression level of 17 DEPs (). AMPH and EPS15 were associated with some proteins before vesicle formation and transport [Citation23,Citation24]. The results indicated that myriocin affected the expression of proteins in the endocytic pathway.
RT-qPCR analysis
To confirm the RNA-Seq data, the expression levels of 4 typical genes were analysed by using RT-qPCR. The expression levels of gene17023, gene1649, gene12276 and gene9027 in myriocin treated cells were significantly increased with reference to those in the control (Supplemental Figure S2). The trend of expression of these 4 genes was consistent with the transcriptome analysis results.
Discussion
Myriocin was found to be a metabolite from Myriococcum albomyces, Melanconis flavovirens, Isaria sinclairii, Paedilomyces variotii 74907 and Bacillus amyloliquefaciens LZN01 [Citation4, Citation11], which can inhibit pathogenic fungi by reducing the synthesis of sphingolipid compounds [Citation10]. Our previous study indicated that myriocin induced membrane damage and targeted intracellular molecules in Fon cells [Citation13,Citation14]. In this study, we combined transcriptomic and proteomic analyses to explore the mechanism of internalization of myriocin in Fon cells.
As previously discussed [Citation15], low temperature and NaN3 treatments inhibit ATP production, thus energy-dependent processes such as endocytosis should be inhibited [Citation20, Citation25]. showed that the fluorescence intensity of internalization of myriocin in cold and NaN3 treatments was decreased. The results suggested that myriocin entrance into Fon cells may partly involve energy. Then, the effects of various endocytosis inhibitors on myriocin entering Fon cells were studied. Filipin is an inhibitor of lipid raft-mediated endocytosis, Cytochalasin D is an inhibitor actin polymerization, BFA is an inhibitor of the ER-to-Golgi secretory pathway and Latrunculin A (Lat A) is a more potent inhibitor of actin polymerization than Cytochalasin D [Citation15]. The results confirmed that only BFA inhibited the internalization of TMR-myriocin among the four inhibitors mentioned above. As mentioned before [Citation15], BFA is a drug that inhibits vesicle formation at the level of the Golgi apparatus, resulting in the disruption of vesicular trafficking and formation during endocytosis [Citation26]. This suggested that the entry of myriocin into Fon conidia cells involved vesicular trafficking. Yi et al. [Citation27] found that 14C fluoranthene was actively transported into Rhodococcus sp. BAP-1 through transmembrane transport in the presence of ATP inhibitor NaN3. It may be that the entry of myriocin into Fon conidia cells involved transmembrane transport.
The transmembrane transport of secondary metabolites is mediated by transporters, which involves ATP-binding cassette transporter and ATPase in plasma membrane and pyrophosphatase in vacuolar membrane [Citation28]. The genes (gene12911, gene17023) that encode hypothetical proteins (XP_018247258.1, XP_018236733.1) which are related to ABC transporters, ATP binding cassette (XP_018235309.1, XP_018236742.1), V-type ATPase (XP_018254021.1), plasma membrane ATPase (XP_018249415.1), Ca2+ transport ATPase (XP_018231770.1), F-type H+-transporting ATPase (XP_018233431.1) and ATP synthase (XP_018232162.1), which are involved in plasma membrane ATP related enzymes, were all significantly upregulated at the protein levels in myriocin-treated cells (). ATP is catalytically hydrolyzed by Ca2+ transporting ATPase and H+ transporting ATPase to release energy, and the energy is provided by ATP-binding cassette to various molecules, which is responsible for transmembrane transport. Plasma membrane ATPase has the same structure and reaction mechanism as other ATPases involved in Na+, K+, Ca2+ transport. Like most ATPases, they also act as electric proton pumps [Citation29]. Myriocin might affect transmembrane transport and energy metabolism by increasing the expression level of these proteins, and then enter Fon cells.
Micro chromosome maintenance protein (MCM) is an ATP-dependent DNA helicase in eukaryotes and is necessary for DNA replication [Citation30]. MCMs contain a conserved region of approx. 200–250 amino acids and have a nearly conserved Walker A motif, Walker B motif and Zinc finger motif, in which Walker B has the function of promoting ATP hydrolysis [Citation21, Citation31]. In this study, the six genes (gene8631, gene12098, gene1251, gene9027, gene12276 and gene7368), which are related to micro chromosome maintenance protein (MCM), were significantly upregulated in myriocin-treated cells ( and Supplemental Figure S1). It was suggested that myriocin promoted ATP hydrolysis by upregulating the expression of these six genes, and then used the energy.
One of the most distinctive characteristics in eukaryotic cells is the highly organized internal transport process, especially vesicle mediated cell transport [Citation32]. It was reported that the diameter of intracellular transport vesicles is between 20 and 100 nm [Citation33]. In this study, most of DEGs are closely related to vesicle transport ( and ). The results suggested that myriocin was transported into Fon cells through vesicles transport, as evidenced through various endocytosis inhibitors ().
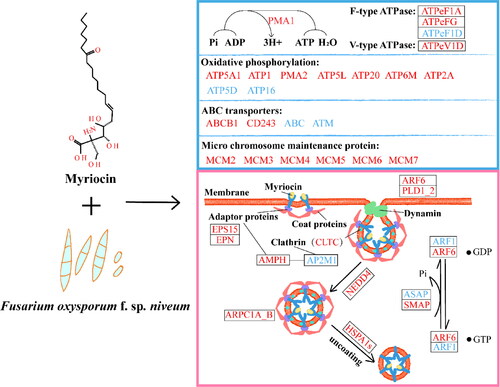
Vesicles participate in clathrin-dependent endocytosis. As shown in , most DEPs, which are related to endocytosis, synthesis of clathrin, motor protein and adaptor protein and the formation of vesicles, were significantly upregulated at the protein level in myriocin-treated cells. AMPH (Amphiphysin, XP_018240558.1) was the most important endocytosis regulatory protein and played an important role in the PPI network (). AMPH participates in receptor-mediated endocytosis, in part, by recruiting of GTPase dynamin to newborn endosomes [Citation23]. In the endocytosis pathway, AMPH, which is related to the synthesis of adaptor and clathrin protein and is involved in clathrin dependent endocytosis. CLTC (XP_018246397.1), which is one of clathrins and is essential in clathrin-dependent endocytosis, was also very relevant to other proteins in the PPI network. EPS15 (XP_018243808.1), which is an important adaptive protein in the process of clathrin-mediated endocytosis [Citation24], had a strong correlation with other proteins in the PPI network (). Interaction of AP2M1 (XP_018239190.1), which is a plasma membrane adaptor complex, with EPS 15 is necessary for effective receptor-mediated endocytosis [Citation34]. The ADP-ribosylation factor (ARF) family regulate vesicle budding [Citation22], and ARF can regulate the polymerization, assembly and vesicle transport of integrin complexes [Citation35]. As shown in Supplemental Table S7, three DEGs belong to ARF family, of which ARF6 (gene15488) regulates the transport of actin skeleton on the cell surface and plays an important role in endocytosis [Citation36]. The above-mentioned proteins and genes were affected in myriocin-treated cells, which might be important to the internalization of myriocin. The mode of myriocin entry into the Fon cells and its effect on the expression of related genes and proteins are described in .
Figure 9. Conceptual model of myriocin entry into Fon cells. The expression of genes and proteins related to ATP and endocytosis at the mRNA and protein levels was affected. The blue box displays ATP related proteins and genes, mainly including those related to conversion of ADP to ATP, oxidative phosphorylation, ABC transporter and micro chromosome maintenance proteins. The pink box shows the expression of genes and proteins in the endocytosis pathway. Red and blue represent upregulated and downregulated genes and proteins, respectively. Ko names of DEPs and DEGs are listed in Supplemental Tables S7 and S8.
Conclusions
Internalization of myriocin in Fon cells was partially energy-dependent, and the expression of genes and proteins related to ATP and transmembrane transport was changed at the mRNA and protein levels. These genes and proteins were mainly related to oxidative phosphorylation and ABC transporter. Internalization of myriocin was affected by BFA, and the expression of genes and proteins related to vesicle transport was also affected by myriocin. In conclusion, myriocin entry into Fon cells partially depended on energy and involved endocytosis, in which the expression of some related genes and proteins was affected.
Supplemental Material
Download MS Word (82.2 KB)Data availability
The raw data of RNA-Seq and proteomics were deposited to NCBI (number PRJNA643229) and ProteomeX-change Consortium (PXD020176), respectively.
Disclosure statement
No potential conflict of interest was reported by the authors.
Additional information
Funding
References
- Zhang Y, Tian C, Xiao J, et al. Soil inoculation of Trichoderma asperellum M45a regulates rhizosphere microbes and triggers watermelon resistance to Fusarium wilt. AMB Express. 2020;10(1):189. http://dx.doi.org/10.1186/s13568-020-01126-z
- Zhu F, Xiao J, Zhang Y, et al. Dazomet application suppressed watermelon wilt by the altered soil microbial community. Sci Rep. 2020;10(1):21668. http://dx.doi.org/10.1038/s41598-020-78839-5
- Xu L, Nicolaisen M, Larsen J, et al. Pathogen infection and host-resistance interactively affect root-associated fungal communities in watermelon. Front Microbiol. 2020;11:605622. http://dx.doi.org/10.3389/fmicb.2020.605622
- Xu W, Wang H, Lv Z, et al. Antifungal activity and functional components of cell-free supernatant from Bacillus amyloliquefaciens LZN01 inhibit Fusarium oxysporum f. sp. niveum growth. Biotechnol Biotechnol Equip. 2019;33(1):1042–1052. http://dx.doi.org/10.1080/13102818.2019.1637279
- Zhang B, Dong C, Shang Q, et al. New insights into membrane-active action in plasma membrane of fungal hyphae by the lipopeptide antibiotic bacillomycin L. Biochim Biophys Acta. 2013;1828(9):2230–2237. http://dx.doi.org/10.1016/j.bbamem.2013.05.033
- Henriques ST, Melo MN, Castanho MA. Cell-penetrating peptides and antimicrobial peptides: how different are they? Biochem J. 2006;399(1):1–7. http://dx.doi.org/10.1042/BJ20061100
- Bolintineanu DS, Vivcharuk V, Kaznessis YN. Multiscale models of the antimicrobial peptide protegrin-1 on gram-negative bacteria membranes. Int J Mol Sci. 2012;13(9):11000–11011. http://dx.doi.org/10.3390/ijms130911000
- May JM, Owens TW, Mandler MD, et al. The antibiotic novobiocin binds and activates the ATPase that powers lipopolysaccharide transport. J Am Chem Soc. 2017;139(48):17221–17224. http://dx.doi.org/10.1021/jacs.7b07736
- Takada Y, Itoh H, Paudel A, et al. Discovery of gramicidin a analogues with altered activities by multidimensional screening of a one-bead-one-compound library. Nat Commun. 2020;11(1):4935. http://dx.doi.org/10.1038/s41467-020-18711-2
- Wadsworth JM, Clarke DJ, Mcmahon SA, et al. The chemical basis of serine palmitoyltransferase inhibition by myriocin. J Am Chem Soc. 2013;135(38):14276–14285. http://dx.doi.org/10.1021/ja4059876
- Pereira CB, Oliveira DD, Hughes AF, et al. Endophytic fungal compounds active against Cryptococcus neoformans and C. gattii. J Antibiot (Tokyo). 2015;68(7):436–444. http://dx.doi.org/10.1038/ja.2015.11
- Melo N, Abdrahman A, Greig C, et al. Myriocin significantly increases the mortality of a non-mammalian model host during candida pathogenesis. PLoS One. 2013;8(11):e78905. http://dx.doi.org/10.1371/journal.pone.0078905
- Wang H, Wang Z, Liu Z, et al. Membrane disruption of Fusarium oxysporum f. sp. niveum induced by myriocin from Bacillus amyloliquefaciens LZN01. Microb Biotechnol. 2021a;14(2):517–534. http://dx.doi.org/10.1111/1751-7915.13659
- Wang H, Wang Z, Xu W, et al. Comprehensive transcriptomic and proteomic analyses identify intracellular targets for myriocin to induce Fusarium oxysporum f. sp. niveum cell death. Microb Cell Fact. 2021b;20(1):69. http://dx.doi.org/10.1186/s12934-021-01560-z
- Liu X, Xu J, Zhu J, et al. Combined transcriptome and proteome analysis of RpoS regulon reveals its role in spoilage potential of Pseudomonas fluorescens. Front Microbiol. 2019;10:94. http://dx.doi.org/10.3389/fmicb.2019.00094
- Morrin ST, Owens RA, Le Berre M, et al. Interrogation of milk-driven changes to the proteome of intestinal epithelial cells by integrated proteomics and glycomics. J Agric Food Chem. 2019;67(7):1902–1917. http://dx.doi.org/10.1021/acs.jafc.8b06484
- Zhong Y, Chen B, Li J, et al. Analysis of fatty acids and metabolites in plasma by LC-MS/MS. J Chin Mass Spectrom Soc. 2018;39:310–315.
- Madani F, Lindberg S, Langel U, et al. Mechanisms of cellular uptake of cell-penetrating peptides. J Biophys. 2011;2011:414729. http://dx.doi.org/10.1155/2011/414729
- MuñOz A, Marcos JF, Read ND. Concentration-dependent mechanisms of cell penetration and killing by the de novo designed antifungal hexapeptide PAF26. Mol Microbiol. 2012;85(1):89–106. http://dx.doi.org/10.1111/j.1365-2958.2012.08091.x
- Atanassova N, Grainge I. Biochemical characterization of the minichromosome maintenance (MCM) protein of the crenarchaeote Aeropyrum pernix and its interactions with the origin recognition complex (ORC) proteins. Biochemistry. 2008;47(50):13362–13370. http://dx.doi.org/10.1021/bi801479s
- Oscarsson T, Walther A, Lengeler K, et al. An Arf-GAP promotes endocytosis and hyphal growth of Ashbya gossypii. FEMS Microbiol Lett. 2017;364(24):fnx240. http://dx.doi.org/10.1093/femsle/fnx240
- Gold ES, Morrissette NS, Underhill DM, et al. Amphiphysin IIm, a novel amphiphysin II isoform, is required for macrophage phagocytosis. Immunity. 2000;12(3):285–292. http://dx.doi.org/10.1016/S1074-7613(00)80181-8
- Lu R, Drubin DG. Selection and stabilization of endocytic sites by Ede1, a yeast functional homolog of the human Eps15. Mol Biol Cell. 2017;28(5):567–575. http://dx.doi.org/10.1091/mbc.E16-06-0391
- Atkinson HA, Daniels A, Read ND. Live-cell imaging of endocytosis during conidial germination in the rice blast fungus, Magnaporthe grisea. Fungal Genet Biol. 2002;37(3):233–244. http://dx.doi.org/10.1016/S1087-1845(02)00535-2
- El-Mounadi K, Islam KT, Hernandez-Ortiz P, et al. Antifungal mechanisms of a plant defensin MtDef4 are not conserved between the ascomycete fungi Neurospora crassa and Fusarium graminearum. Mol Microbiol. 2016; 100(3): 542-559. http://dx.doi.org/10.1111/mmi.13333
- Kitchens KM, Kolhatkar RB, Swaan PW, et al. Endocytosis inhibitors prevent poly(amidoamine) dendrimer internalization and permeability across caco-2 cells. Mol Pharm. 2008;5(2):364–369.
- Yi L, Wang H, Fei H, et al. Trans-membrane transport of fluoranthene by rhodococcus sp. BAP-1 and optimization of uptake process. Bioresour Technol. 2014;155:213–219. http://dx.doi.org/10.1016/j.biortech.2013.12.117
- Gaxiola RA, Palmgren MG, Schumacher K. Plant proton pumps. FEBS Lett. 2007;581(12):2204–2214. http://dx.doi.org/10.1016/j.febslet.2007.03.05
- Chen W, Si GY, Zhao G, et al. Genomic comparison of the P-ATPase gene family in four cotton species and their expression patterns in Gossypium hirsutum. Molecules. 2018;23(5):1092. http://dx.doi.org/10.3390/molecules23051092
- Hesketh EL. The functional assembly of the mammalian minichromosome maintenance complex. PhD thesis, University of York, York, 2014.
- Chong JP, Hayashi MK, Simon MN, et al. A double-hexamer archaeal minichromosome maintenance protein is an ATP-dependent DNA helicase. Proc Natl Acad Sci U S A. 2000;97(4):1530–1535. http://dx.doi.org/10.1073/pnas.030539597
- Haspinger D, Klinge S, Holzapfel G. Numerical analysis of the impact of cytoskeletal actin filament density alterations onto the diffusive vesicle-mediated cell transport. PLoS Comput Biol. 2021;17(5):e1008784. http://dx.doi.org/10.1371/journal.pcbi.1008784
- Larocque G, La-Borde P, Clarke N, et al. Tumor protein D54 defines a new class of intracellular transport vesicles. J Cell Biol. 2020;219(1):201812044. http://dx.doi.org/10.1083/jcb.201812044
- Benmerah A, Lamaze C, Bègue B, et al. AP-2/Eps15 interaction is required for receptor-mediated endocytosis. J Cell Biol. 1998;140(5):1055–1062. http://dx.doi.org/10.1083/jcb.140.5.1055
- Ming B, Gad H, Turacchio G, et al. ARFGAP1 promotes endocytosis regulated by AP-2. Nat Cell Biol. 2011;13(5):559–567. http://dx.doi.org/10.1038/ncb2221
- Zhu X, Zhou T, Chen L, et al. Arf6 controls endocytosis and polarity during asexual development of Magnaporthe oryzae. FEMS Microbiol Lett. 2016;363(22):fnw248. http://dx.doi.org/10.1093/femsle/fnw248