
 ?Mathematical formulae have been encoded as MathML and are displayed in this HTML version using MathJax in order to improve their display. Uncheck the box to turn MathJax off. This feature requires Javascript. Click on a formula to zoom.
Abstract
In the present work, the fermentation of molasses using Saccharomyces cerevisiae was optimized in terms of denitrification efficiency, using the relative total nitrogen (TN) removal ratio and the C/N consumption ratio as the indicators. The denitrification efficiency in different wastewater was also measured in the presence of different carbon sources for denitrification, that is, fermentation broth, unfermented molasses, sodium acetate, ethanol and methanol. The results indicated that the optimal fermentation conditions were as follows: pH = 4.0; temperature, 33 °C; dilution rate, 0.15 h−1; sugar concentration, 13%; ammonium chloride concentration, 0.5 g/L; and air-flow rate in the reactor, 0.1 vvm for 30 min every 12 h. The relative TN removal ratio with the fermentation broth was 39% higher than that with unfermented molasses. However, the denitrification efficiency of the fermentation broth varied between landfill leachate, herbicide wastewater and brewing wastewater. The relative TN removal ratio was significantly higher only in the brewing wastewater, and the C/N consumption ratio was also significantly lower than that with methanol, ethanol and molasses. These results showed that the use of molasses fermentation broth as the carbon source for denitrification has advantages for specific sewage regarding effectiveness. The raw material cost of the fermentation broth was ca. 30% lower than sodium acetate. The results also suggested that the bacterial community structure had a significant impact on the denitrification efficiency of the fermentation broth.
Introduction
Nitrogen is one of the key factors for eutrophication [Citation1]. Currently, most sewage plants in China suffer from low denitrification efficiency, which is caused by the low concentration of organic carbon in the influent water. Therefore, external organic carbon should be supplied for denitrification. Generally, the ratio of chemical oxygen demand (COD, g) and total nitrogen (TN, g), that is, COD/N, required for complete denitrification is in the range of 3-15 [Citation2, Citation3].
Currently, methanol, ethanol, and sodium acetate are widely used as carbon sources for denitrification [Citation2] and their comparisons are shown in . According to the overall evaluation based on denitrification ability, sludge yield, adaptation time, reaction time, and cost, PENG et al. suggested that ethanol was the most suitable carbon source for denitrification [Citation2]. In addition, the United States Environmental Protection Agency recommended ethanol as a preferred carbon source in this context [Citation16].
Table 1. Characteristics of methanol, ethanol and sodium acetate as carbon sources.
Molasses is the by-product in the sugar industry, thus it is abundant and cheap [Citation17,Citation18]. It contains 45% total reducing sugars and can be fermented to ethanol [Citation19–20]. Saccharomyces cerevisiae is a facultative anaerobe that exhibits high growth rates and has the ability to ferment different sugars, including glucose, fructose and sucrose [Citation21]. In the recent years, a number of studies have focused on optimizing the yield of ethanol from molasses using S. cerevisiae: for S. cerevisiae CAT-1, ITV-01 and YGM1, the optimal pH was in the range of 3.2 ∼ 5.0 and the optimal temperature was 28–40 °C [Citation22–24]; for S. cerevisiae Saf-Instant and PTCC 5010, the optimal dilution was in the range of 0.1–0.25 h−1 and the optimal sugar concentration was in the range of 10–15% [Citation25–27]; for S. cerevisiae Lalvin EC1118 and DMKU3-S087, the optimal ammonia concentration was 0 ∼ 2 g/L and the optimal ventilation volume was 0.06–0.2vvm [Citation25, Citation28–30].
Molasses fermentation broth contains a large amount of easily degradable organic materials [Citation31], which may act as carbon sources for denitrification. However, many previous studies on ethanol fermentation aimed to promote ethanol yield, but there is a lack of research on the denitrification ability in molasses fermentation broths. Therefore, in this study, a low-cost ethanol fermentation process was optimized using the denitrification efficiency as the index, and the denitrification abilities of the fermentation broth in different sewages were compared. The results of this investigation will contribute to the reduction of the cost of denitrification in several sewages.
Materials and methods
Strain and media
The Saccharomyces cerevisiae CICC 1051 strain was obtained from the China Center of Industrial Culture Collection (CICC) and cultured in seed medium containing the following components: yeast extract, 5 g/L; peptone, 5 g/L; glucose, 200 g/L; sodium thioglycolate, 0.2 g/L; NH4Cl2, 2 g/L; KH2PO4, 1 g/L; and MgSO4·5H2O, 0.3 g/L [Citation32].
The industrial by-product of cane molasses obtained from the Guangxi Guiping Sugarcane Sugar Factory was used as the fermentation medium. The molasses had a sugar content of 47% and total soluble solids of 87° Bx. The fermentation medium [Citation33] was prepared by adding 4 L of cane molasses and 40 g of ammonium chloride to 16 L of non-sterile tap water with an initial pH of 4.5. A concentrated H2SO4 solution (96.1%) was added until the pH of the solution reached 4.0. The mixture was then heated to 100 °C for 10 min and kept overnight. Finally, H2SO4 was added to the supernatant of the molasses medium until the pH of the medium reached the desired pH.
The carbon-free denitrifying medium [Citation34] contained the following components: KH2PO4, 1 g/L; K2HPO4, 1 g/L and MgSO4·5H2O, 0.2 g/L; and was then sterilized at 120 °C for 20 min and its pH was adjusted to 5.0 with 2 mol/L HCl.
Preparation of the seed culture
The S. cerevisiae CICC 1051 cells were inoculated into the seed medium (pH 4.0) and incubated at 30 °C for 1–2 days at 140 r/min. When the optical density (OD600) of the seed culture reached 14.0 (ca. 4 × 10⁸ cells/mL) [Citation35], it was used for inoculation.
Experimental setup
The experimental setup () contained two steps using several continuous culture devices (). In Step 1, the relative total nitrogen (TN) removal efficiency (RTRE) and the ratio between consumed COD and removed TN (C/N) were measured as indexes for the gradual optimization of six parameters (pH; temperature; dilution rate; sugar concentration; ammonium chloride concentration and aeration (air-flow rate in the reactor). Meanwhile, the content of volatile substances in the fermentation broth was measured by gas chromatography–mass spectrometry (GC-MS).
Figure 1. Schematic overview of the experimental setup.
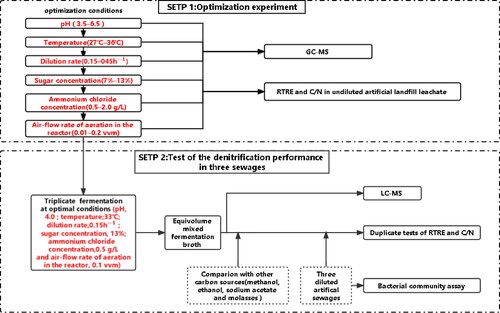
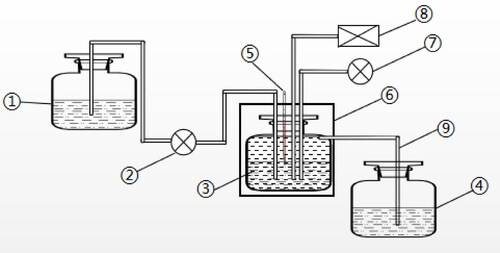
Figure 2. Flow chart of the continuous fermentation system. 1: Culture medium tank. 2: peristaltic pump; 3: fermenter; 4: collection tank; 5: thermometer; 6: air bath temperature control box; 7: air pump and 8: pH control. Notes: The fermenter was a 200 mL Erlenmeyer flask and was completely closed except for the intermittent aeration (30 min every 12h). The temperature and pH of the fermentation broth were automatically controlled.
In Step 2, the fermentation was carried out in the optimal conditions in triplicate using continuous culture devices. Then, the fermentation broth, methanol, ethanol, sodium acetate and molasses were applied in artificial brewery wastewater, herbicide wastewater and landfill leachate, respectively, and RTRE and C/N was determined within 12 h. Meanwhile, the non-volatile components of the fermentation broth were determined by liquid chromatography–mass spectrometry (LC-MS), and the bacterial community structure of three artificial sewages was determined by 16S rRNA gene sequencing.
Optimization experiment
In this experiment, we used 4 self-made continuous culture devices (). The inoculation amount of the seed medium was 10%(V/V). Parameters were optimized in a stepwise manner as follows: pH, 3.5, 4.5, 5.5 and 6.5; temperature, 27 °C, 30 °C, 33 °C and 36 °C; dilution rate, 0.15 h−1, 0.25, 0.35 and 0.45 h−1; sugar concentration, 7%, 10%, 13% and 16%; ammonium chloride concentration, 0.5, 1.0 1.5 and 2.0 g/L; and aeration in the reactor with an air-flow rate of 0.01, 0.05, 0.1 and 0.5 vvm for 30 min every 12 h. Then, the TN removal ability in the devices with fermentation broths and unfermented molasses (as control) were determined by measuring the RTRE and C/N in undiluted artificial landfill leachate. The undiluted artificial landfill leachate was made by adding 300 mg/L potassium nitrate to landfill leachate, which was with background COD 1700 mg/L, TN 350 mg/L, salinity 4.0 g/L and SV30 60%. Finally, the volatile components in the fermentation broth with the highest RTRE for each optimized parameter were determined by GC-MS.
Denitrification performance in three sewages
Three sewages, that is, landfill leachate, herbicide wastewater and brewing wastewater, were diluted with an adequate amount of carbon-free denitrifying medium to yield a final SV30 of 40%. Subsequently, 300 mg/L of nitrate-N in the form of potassium nitrate was added, to yield a final concentration of total nitrogen about 500 mg/L. The description of the artificial sewages is shown in .
Table 2. Characteristics of three artificial diluted sewages.a
The optimized parameters were used in triplicate continuous culture systems, and the total soluble solids content of the fermentation broth was monitored every 12 h using a hydrometer [Citation36]. After 60 h of fermentation, the triplicate fermentation broth was mixed equivalently. Subsequently, the mixed fermentation broth, methanol, ethanol, sodium acetate and molasses (as control) were applied to three artificial sewages for duplicate assay of RTRE and C/N. Moreover, LC-MS was applied to measure the differences in non-volatile ingredients between the fermentation broth and the unfermented medium, and 16S rRNA gene sequencing was applied to determine the bacterial community structure of the three artificial sewages [Citation37]
Measurement of the denitrification efficiency
To remove the yeast cells, 1 mL of fermentation broth was centrifuged at 12,000g for 1 min at room temperature using a 5415 D centrifuge (Eppendorf, Germany), and 500 µL of supernatant was collected to measure the RTRE and the C/N ratios. The RTRE and the C/N ratios were determined as follows: for the tested treatment, 180 µL of cell-free fermentation broth, or a varying amount of methanol, ethanol or sodium acetate, was added to 70 mL of artificial sewage to obtain a COD concentration of 3000 mg/L so that the ratio of COD to TN was 6 ∼ 10 [Citation38]; for the control treatment, molasses with the same amounts of COD was added to 70 mL of artificial sewage. The mixtures were then cultured at 38 °C and 150 r/min for 12 h. The RTRE and C/N were calculated according to the amount of TN and COD that was removed within 12 h, as follows:
where COD was determined using the potassium dichromate method (Appendix 1, supplementary material) [Citation39] and TN was determined via ultraviolet spectrophotometry with alkaline potassium persulfate digestion (Appendix 2, supplementary material) [Citation39].
Other analytical assays
GC-MS was performed on a DB-1 elastic quartz capillary column (30 × 0.25 mm) with a flow rate of 1.0 mL/min using a GC-MS-QP5000 instrument (Shimadzu, Japan) with the following conditions: column pressure, 50 kPa; injector temperature, 250 °C; split injection, a split ratio of 1:8; sampling time, 0.2 min; and column temperature, 50 °C (1 min), 15 °C/min to 110 °C (1 min).
LC-MS was conducted using a Vanquish Flex liquid chromatography Q Exactive quadrupole-electrostatic field track trap high-resolution mass spectrometer (Thermo Fisher Scientific, Germany) with an Xbridge BEH Amide column (2.1 × 100 mm, 2.6 m) at a temperature of 40 °C using gradient elution (Appendix 3, supplementary material) with a flow rate of 0.3 mL/min.
Bacterial community assay
DNA was extracted using the HiPure Soil DNA Kit B extraction kit. Polymerase chain reaction (PCR) amplification of the V3 and V4 regions of the 16S rRNA gene sequence was performed using 20–30 ng of DNA as the template and the following upstream/downstream primers [Citation40]: CCTACGGRRBGCASCAGKVRVGAAT and GGACTACNVGGGTWTCTAATCC, respectively; in a reaction system of 25 µL, including the Takara Taq enzyme (15 U/µL), 0.5 µL; buffer, 2.5 µL of dNTP solution; dNTP mixture (2.5 mmol/L), 2 µL; template, 20 ng; upstream and downstream primers, 1 µL; and ultrapure water, 18 µL. The reaction conditions were as follows: pre-denaturation at 94 °C for 3 min; followed by 24 cycles of denaturation at 94 °C for 5 s, and extension at 72 °C for 10 s; and a final extension at 72 °C for 5 min. The PCR products were sequenced using 16S rRNA metagenomic sequencing based on an Illumina platform (Suzhou, China), and the final sequences were clustered using the R language (4.1). Representative sequences of OTUs were subjected to taxonomic statistics (classification into genus).
Data analysis
Origin 7.5 (Northampton, MA, USA) was used for plotting, and the error bars indicate the standard deviation (±SD). The correlation analysis was performed using the SPSS 26.0 (SPSS, Chicago, USA).
Results
Stepwise optimization experiment
The RTRE at pH 3.5–4.5 was 45.9% higher on average than that at pH 5.5–6.5 (), and the C/N at pH 3.5–4.5 was 26.4% lower on average than that at pH 5.5–6.5, which indicated that the optimal pH should be 3.5–4.5. Therefore, we set the fermentation pH to 4.0 in the subsequent tests. However, the RTRE of each tested treatment was at least 27.5% lower than that of the control treatment, which implied that the fermentation conditions required further optimization.
Figure 3. RTRE and C/N at different pH values (a); temperatures (b); dilution rates (c); sugar concentrations (d); ammonium chloride concentrations (e) and air-flow rates (f). Note: The fermentation parameters were stepwise optimized in the order of pH, temperature, dilution rate, sugar concentration, ammonium chloride concentration and aeration in the reactor. When pH was optimized, the other parameters were temperature, 30 °C; dilution rate, 0.25 h−1; sugar concentration, 10%; ammonium chloride concentration, 2 g/L and air-flow rate in the bioreactor, 0.2 vvm for 30 min every 12 h. When temperature was optimized, the other parameters were pH, 4.0; dilution rate, 0.25 h−1; sugar concentration, 10%; ammonium chloride concentration, 2 g/L and air-flow rate, 0.2 vvm for 30 min every 12 h. When the dilution rate was optimized, the other parameters were pH, 4.0; temperature, 33 °C; sugar concentration, 10%; ammonium chloride concentration, 2 g/L and air-flow rate, 0.2 vvm for 30 min every 12 h. When the sugar concentration was optimized, the other parameters were pH, 4.0; temperature, 33 °C; dilution rate, 0.15 h−1; ammonium chloride concentration, 2 g/L and air-flow rate, 0.2 vvm for 30 min every 12 h. When the ammonium chloride concentration was optimized, the other parameters were pH, 4.0; temperature, 33 °C; dilution rate, 0.15 h−1; sugar concentration, 13% and air-flow rate, 0.2 vvm for 30 min every 12 h. When the air-flow rate (aeration) was optimized, the other parameters were pH, 4.0; temperature, 33 °C; dilution rate, 0.15 h−1; sugar concentration, 13% and ammonium chloride concentration, 0.5 g/L. After 60 h of fermentation, the cell-free fermentation broths, as the carbon sources for denitrification, were collected to measure the RTRE and the C/N in the undiluted artificial landfill leachate. In the control treatment, the unfermented molasses were used as the carbon source for denitrification.
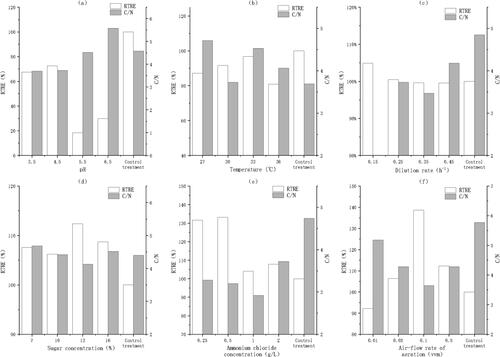
The RTRE at 33 °C was 5.0–16% higher than that recorded at other temperatures (). Therefore, we set the fermentation temperature to 33 °C in the subsequent tests. However, the RTRE of each tested treatment was still lower than that of the control treatment, which indicated that the fermentation conditions required further optimization.
The RTRE at a dilution rate of 0.15 h−1 was at least 5.1% higher than that recorded at other dilution rates (), which indicated that the optimal dilution rate should be 0.15 h−1. Therefore, we set the fermentation dilution rate to 0.15 h−1 in the subsequent tests. Moreover, the RTRE at a dilution rate of 0.15 h−1 was also higher than that of the control treatment, which implied that the fermentation condition was satisfactorily optimized.
The RTRE at a sugar concentration of 13% was the highest among all treatments (), and the C/N was the lowest at a sugar concentration of 13%. Therefore, we set the fermentation sugar concentration to 13% in the subsequent tests.
The RTRE at an ammonium chloride concentration of 0.25∼0.5 g/L was 18.7% higher than that recorded for other treatments on average (), and the C/N at an ammonium chloride concentration of 0.5–1.0 g/L was 12.5% lower than that recorded for other treatments on average, which indicated that the optimal ammonium chloride concentration should be 0.5 g/L. Therefore, we set the ammonium chloride concentration to 0.5 g/L in the subsequent tests. Furthermore, the RTRE of each tested treatment was, on average, 19.2% higher than that of the control treatment, and the C/N of each tested treatment was lower than that of the control treatment, which implied that the fermentation conditions were further optimized.
The RTRE at an air-flow rate of 0.1 vvm was 12.3% higher on average than that recorded for other treatments (the RTRE was 38.7% higher than that of the unfermented molasses medium, ), and the C/N at an air-flow rate of 0.1 vvm was the lowest, which indicated that the optimal air-flow rate should be 0.1 vvm. Overall, the stepwise optimization experiment suggested that the optimal parameters were pH, 4.0; temperature, 33 °C; dilution rate, 0.15 h−1; sugar concentration, 13%; ammonium chloride concentration, 0.5 g/L and air-flow rate, 0.1 vvm for 30 min every 12 h.
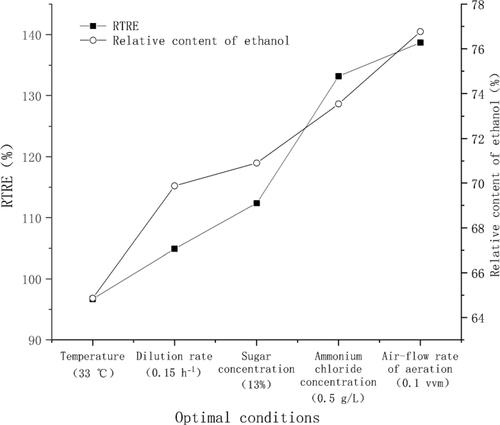
Moreover, according to the results of GC-MS, the relative contents of volatile substances, such as ethanol, acetate, 2-butanone and glycerol, increased in the fermentation of molasses, and there was a significant correlation between the relative content of ethanol and the maximum RTRE in the optimization experiment (, p <0.05). These results indicated that ethanol may play an important role in the denitrification process.
Figure 4. Maximum RTRE and relative content of ethanol in the optimization experiment. The optimal conditions were 33 °C, 0.15 h−1, 13%, 0.5 g/L and 0.1 vvm in the step to optimize temperature, dilution rate, sugar concentration, ammonium chloride concentration and air-flow rate, respectively.
Comparison of the denitrification efficiency of the fermentation product in different sewages
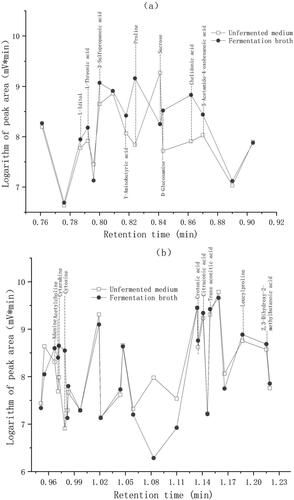
The LC-MS results () showed that some substances, i.e. l-threonine, l-iditol, 3-sulfomalonic acid, γ-aminobutyric acid, d-glucosamine, chelic acid, 5-acetylamino-4-oxohexanoic acid, adenine, cytosine, cytarabine, acetylcholine, crotonic acid, citric acid, trans-aconitic acid and several types of amino acids, were increased in the fermentation broth compared with the unfermented medium, whereas the peak area of sucrose decreased by more than 90% in the fermentation broth compared with the unfermented medium (). This indicated that most of the sucrose was converted to other organic materials at the optimized fermentation conditions.
Figure 5. LC-MS results for the fermentation broth and unfermented medium.
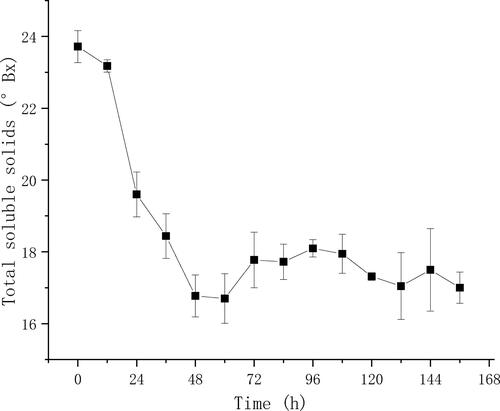
The variance of the total soluble solids () was small between triplicate fermentation broths, suggesting that the fermentation in triplicate systems was relatively synchronous. Moreover, the total soluble solids decreased gradually within the first 48 h and fluctuated slightly after that, suggesting that the continuous fermentation reached a steady state after 48 h.
Figure 6. Kinetics of the total soluble solids content in triplicate fermentations.
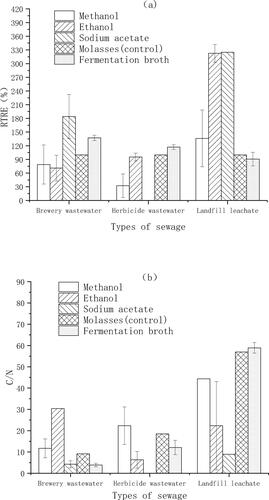
The RTRE and C/N with five carbon sources (including the optimized fermentation broth) in three types of artificial wastewater were different (). In brewing wastewater, the RTRE when fermentation broth was used as a carbon source was 37.3% higher than the RTRE when molasses was used as a carbon source (). Accordingly, the C/N of the treatment in which fermentation broth was used as carbon source (3.8) was 54.5% lower than the C/N of the treatment in which molasses was used as carbon source (8.6) in brewing wastewater (). However, the C/N when fermentation broth was used as carbon source was much higher than 10 both in the herbicide wastewater and in the landfill leachate, which implied that the carbon sources in the fermentation broth were not efficient for the removal of TN in these two sewages. Moreover, in the herbicide wastewater, the RTRE when methanol was used as a carbon source was ca. 25–40% lower than other two sewages, which implied that the denitrification efficiency with methanol was relatively low in herbicide wastewater. When ethanol and sodium acetate was used as a carbon source respectively, the RTRE in the landfill leachate was 1.7–4.5 fold higher than that of the other two sewages, which implied that the denitrification efficiency with ethanol and sodium acetate was relatively high in landfill leachate.
Figure 7. RTRE (a) and C/N (b) of five types of carbon source in three sewages.
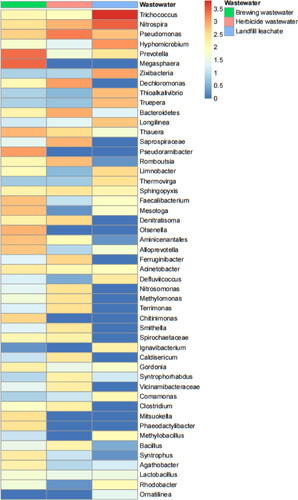
The cluster analysis of the bacterial community structures () in brewing wastewater, herbicide wastewater and landfill leachate showed significant differences from each other. The operational taxonomic unit (OTU) abundance analysis () showed that the dominant bacterial genera in the brewery wastewater were Megasphaera, Prevotella, Pseudoramibacter, Pseudomonas, Olsenella, Thauera, Acinetobacter, etc.; whereas the dominant bacterial genera in the herbicide wastewater and landfill leachate were Pseudomonas, Dechloromonas, Bacteroidetes, Saprospiraceae, Nitrospira, Romboutsia, Ferruginibacter; and Trichococcus, Nitrospira, Hyphomicrobium, Zixibacteria, Methylobacillus, Rhodobacter, Comamonas, etc., respectively.
Figure 8. UPGMA (unweighted pair method with arithmetic mean) tree of three sewages.
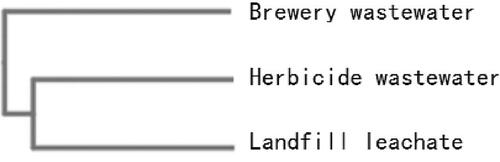
Figure 9. OTU abundance clustering heat maps of the three sewages at the genus level. The distribution of the top 50 genera (in abundance) was plotted for each sample, and the abundance values corresponding to different colours of each square were the relative abundance values of the genus.
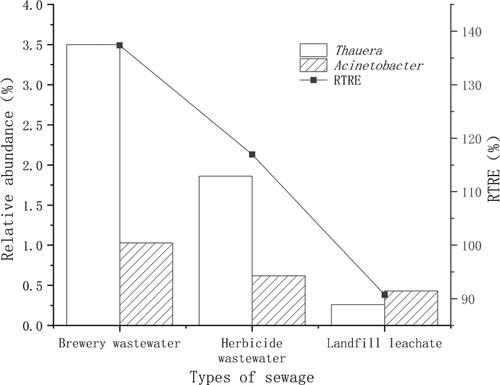
The correlation analysis indicated that the relative abundances of Thauera and Acinetobacter were positively correlated with the RTRE in the fermentation broth treatment (, p <0.05).
Figure 10. Relative abundance of Thauera and Acinetobacter in landfill leachate, herbicide wastewater and brewing wastewater and the RTRE when fermentation broth was used as the carbon source for denitrification.
Discussion
Effects of fermentation conditions on nitrogen removal
In this study, the RTRE was significantly correlated with the relative content of ethanol in the fermentation broth (), which suggests that the conversion efficiency of molasses to ethanol is the key factor affecting the efficiency of the denitrification process. We also showed that the fermentation conditions of pH 4.0, a temperature of 33 °C, a dilution rate of 0.15 h−1, a sugar concentration of 13%, an ammonium chloride concentration of 0.5 g/L, and an air-flow rate of 0.1 vvm yielded the best denitrification effect. Similarly, Darvishi et al. [Citation41] reported that Saccharomyces cerevisiae was most suitable for ethanol production at pH 4.0–4.2. Muzna [Citation42] and Shanmugam [Citation43] found that the ethanol yield of yeast was highest at 33°C–35 °C. Triantafyllos [Citation44] reported that the concentration of ethanol was highest when the dilution rate was 0.1–0.2 h−1. Chandrika [Citation45] showed that ethanol accumulation was most favourable when the initial sugar concentration was 12%. Muzna [Citation42] and HODA [Citation46] reported that the best ethanol yield was obtained when the ammonium chloride concentration was 1.0 and 1.5 g/L, respectively; and Seo [Citation47] showed that moderate ventilation might protect yeast cells from a high concentration of ethanol.
Relationship between bacterial community structure in sewage and the denitrification efficiency
In this study, we found that the denitrification efficiency of the fermentation broth in three sewages was significantly different, and only the abundance of Thauera and Acinetobacter exhibited positive correlations with the RTRE (). To the best of our knowledge, both Thauera [Citation48] and Acinetobacter [Citation49, Citation50] are common in sewage treatment systems. Moreover, in the systems using ethanol as the carbon source for denitrification, the abundance of Thauera increased from 12.7% to 21.0% within 15 days [Citation51], with its highest abundance reaching 49% [Citation52]. Similar to Thauera [Citation53], Acinetobacter could also use ethanol as the carbon source for denitrification [Citation54], and even low concentrations of ethanol stimulated the growth of Acinetobacter [Citation55]. The denitrification efficiency with methanol as the carbon source was relatively low in herbicide wastewater comparing to the other two sewages, indicating that the abundance of the bacteria that could use methanol as a carbon source for denitrification was relatively low in herbicide wastewater. In denitrification systems using methanol as a carbon source, Hyphomrobium and Methylobacillus were generally considered as the major denitrifiers [Citation56, Citation57], and their abundance could be as high as 7% and 3.63% [Citation58, Citation59]. Similarly, in this study, the abundance levels of Hyphomrobium and Methylobacillus were at least 1.5 fold higher in the landfill leachate (6.7% and 0.54%, respectively) and brewing sewage (0.28% and 0.06%, respectively) as compared to the herbicide sewage (0.11% and 0%, respectively). Thus, our results supported the finding that Hyphomrobium and Methylobacillus could be considered as suitable targets for monitoring the denitrifiers using methanol as the carbon source for denitrification [Citation60].
The denitrification efficiency with ethanol and sodium acetate as the carbon source were relatively high in landfill leachate comparing to the other two sewages, suggesting that the abundance of bacteria that were in favour of using ethanol or sodium acetate as the carbon source for denitrification was relatively high in landfill leachate. Rhodobacter and Comamonas were commonly found in denitrification systems [Citation61,Citation62], and their growth and denitrification efficiency could be promoted by sodium acetate [Citation63] or ethanol [Citation54]. Similarly, in this study, the abundances of Rhodobacter and Comamonas (0.53% and 0.58%, respectively) were at least 1.4-fold higher in landfill leachate when comparing to brewing sewage (0.22% and 0.03%, respectively) and herbicide sewage (0.01% and 0.07%, respectively). However, because the bacterial preference of different carbon sources for denitrification was far from systemically studied, the relationship between the denitrification effects of different carbon sources and the bacterial community of different real sewages needs to be carefully studied in the future.
Denitrification efficiency of the fermentation broth
In the brewing wastewater, the denitrification efficiency with the fermentation broth was not only better than that of molasses, but also better than that of ethanol (), which suggests that the non-ethanolic organic materials produced by fermentation also contribute to denitrification. In fact, the content of many small-molecule organic materials was increased by fermentation (), and there is evidence that amino acids (such as proline) and organic acids (such as citric acid) were suitable for denitrification [Citation64–66].
In this study, we found that the C/N of the fermentation broth, sodium acetate and molasses in brewing wastewater was 3.8, 4.2 and 9.3, respectively (), which indicated that the TN removal capacity per unit COD in the fermentation broth was much higher. Moreover, the price of cane molasses (with a sugar content of 50%) and sodium acetate in 2014 was 1000 yuan/t [Citation67] and 2,850 yuan/t [Citation68], respectively. Thus, the raw material costs of the molasses fermentation broth, sodium acetate and molasses for the denitrification of brewing wastewater, as tested in this study, were calculated as 1.64, 2.43 and 2.83 USD/kg TN, respectively. This demonstrated that the raw material cost of molasses fermentation broth was ca. 30% lower than the costs for sodium acetate. Given that the average TN in brewery wastewater is ca. 120 mg/L [Citation69] and the cost of sodium acetate was ca. 0.35 USD for 100 mg/L TN/ton water [Citation70], ca. 0.13 USD could be saved for the denitrification of 1 ton of brewery wastewater if the fermentation broth was used as the carbon source.
Conclusions
In the optimized fermentation conditions, that is, pH 4.0, temperature of 33 °C, dilution rate of 0.15 h−1, sugar concentration of 13%, ammonium chloride concentration of 0.5 g/L, and aeration in the reactor with an air-flow rate of 0.1 vvm for 30 min every 12 h, the TN removal increased by 38.7% compared with the unfermented molasses medium. Moreover, the denitrification efficiency of the fermentation broth varied according to the bacterial community structures of the different sewages, and the raw material cost of the fermentation broth could be ca. 30% lower than sodium acetate.
Supplemental Material
Download Zip (46.6 KB)Disclosure statement
No potential conflict of interest was reported by the authors.
Data availability statement
The data that support the findings of this study (including the supplemental appendices) can be accessed at: https://data.mendeley.com/datasets/mp33mf9vz2
Additional information
Funding
Related Research Data
References
- Shi Y, Wu G, Nan W, et al. Denitrification and biofilm growth in a pilot-scale biofilter packed with suspended carriers for biological nitrogen removal from secondary effluent. Environ Sci. 2015;32(6):35–41.
- Peng YZ, Yong M, Wang SY. Denitrification potential enhancement by addition of external carbon sources in a pre-denitrification process. Environ Sci. 2007;19(3):284–289.
- Bernat K, Kulikowska D, Kordel A. Nitrogen removal effectiveness in denitrification and shortcut denitrification using molasses as an organic carbon source. Ochrona Srodowiska. 2016;38(2):9–15.
- Badia A, Kim M, Dagnew M. Nitrite denitrification using biomass acclimatized with methanol as complementary carbon source: long-term performance and kinetics study. Environ Sci: Water Res Technol. 2021;7(1):93–106.
- Hallin S, Throback IN, Dicksved J, et al. Metabolic profiles and genetic diversity of denitrifying communities in activated sludge after addition of methanol or ethanol. Appl Environ Microbiol. 2006;72(8):5445–5452.
- Christensson M, Lie E, Welander T. A comparison between ethanol and methanol as carbon sources for denitrification. Water Sci Technol. 1994;30(6):83–90.
- Kazasi A, Boardman GD, Bott CB. Evaluation of gasoline-denatured ethanol as a carbon source for denitrification. Water Environ Res. 2013;85(6):549–557.
- AdAv SS, Lee DJ, Lai JY. Enhanced biological denitrification of high concentration of nitrite with supplementary carbon source. Appl Microbiol Biotechnol. 2010;85(3):773–778.
- Le T, Peng B, Su C, et al. Impact of carbon source and COD/N on the concurrent operation of partial denitrification and anammox. Water Environ Res. 2019;91(3):185–197.
- Ginige MP, Hugenholtz P, Daims H, et al. Use of stable-isotope probing, full-cycle rRNA analysis, and fluorescence in situ hybridization-microautoradiography to study a methanol-fed denitrifying microbial community. Appl Environ Microbiol. 2004;70(1):588–596.
- Cherchi C, Onnis-Hayden A, El-Shawabkeh I, et al. Implication of using different carbon sources for denitrification in wastewater treatments. Water Environ Res. 2009;81(8):788–799.
- Shen Z, Zhang Z, Wang Y, et al. Biological denitrification for nitrate removal from groundwater using mixed carbon sources. Acta Sci Circumst. 2011;31(6):1263–1269.
- Gao C, Hao K, Li H, et al. Nitrite accumulation and elimination in anoxic zone of the a/o process in a state of limited filamentous bulking. Fresenius Environ Bullet. 2012;21(12 B):3937–3944.
- Nalcaci OO, Boke N, Ovez B. Potential of the bacterial strain Acidovorax avenae Sub sp. avenae LMG 17238 and macro algae gracilaria verrucosa for denitrification. Desalination. 2011;274(1-3):44–53.
- Yang X, Wang S, Zhou L. Effect of carbon source, C/N ratio, nitrate and dissolved oxygen concentration on nitrite and ammonium production from denitrification process by Pseudomonas stutzeri D6. Bioresour Technol. 2012;104:65–72.
- United States Environmental Protection Agency (EPA). Wastewater treatment fact sheet: external carbon sources for nitrogen removal. Washington, DC: Environmental Protection Agency Office of Wastewater Management, 2013. EPA 832-F-13-016 (in USA)
- Wattanagonniyom T, Lee WC, Tolieng V, et al. Co-fermentation of cassava waste pulp hydrolysate with molasses to ethanol for economic optimization. Ann Microbiol. 2017;67(2):157–163.
- Pazouki M, Zakeri A, Vosoughi M. Use of response surface methodology analysis for xanthan biopolymer production by Xanthomonas campestris: focus on agitation rate, carbon source and temperature. Iran J Chem Chem Eng–Int English Ed. 2017;36(1):173–183.
- Yu N, Tan L, Sun ZY, et al. Production of bio-ethanol by integrating microwave-assisted dilute sulfuric acid pretreated sugarcane bagasse slurry with molasses. Appl Biochem Biotechnol. 2018;185(1):191–206.
- Phomikhet P, Lorliam W, Thaniyavarn S, et al. Supplementation of sugarcane molasses for maximization of ethanol production by Saccharomyces cerevisiae using response surface method. SciAsia. 2019;45(3):229.
- Ghorbani F, Younesi H. The kinetics of ethanol production from cane molasses by Saccharomyces cerevisiae in a batch bioreactor. Energy Sourc. 2013;35(11):1073–1083.
- Alcantara GU, Nogueira LC, Stringaci LDA, et al. Brazilian "flex mills": ethanol from sugarcane molasses and corn mash. Bioenerg. Res. 2020;13(1):229–236.
- Gutierrez-Rivera B, Ortiz-Muniz B, Gomez-Rodriguez J, et al. Bioethanol production from hydrolyzed sugarcane bagasse supplemented with molasses “B” in a mixed yeast culture. Renew Energy. 2015;74:399–405.
- Kumar G, Sahgal M, Bharti MK, et al. Optimization of various parameters for utilization of apple pomace amended with molasses by indigenous yeast isolates. Natl. Acad. Sci. Lett. 2014;37(6):529–533.
- Bouallagui H, Touhami Y, Hanafi N, et al. Performances comparison between three technologies for continuous ethanol production from molasses. Biomass Bioenergy. 2013;48:25–32.
- Mukhtar K, Asgher M, Afghan S, et al. Comparative study on two commercial strains of Saccharomyces cerevisiae for optimum ethanol production on industrial scale. Biomed Biotechnol. 2010;2010:1–5.
- Ghorbani F, Younesi H, Sari AE, et al. Cane molasses fermentation for continuous ethanol production in an immobilized cells reactor by Saccharomyces cerevisiae. Renew Energy. 2011;36(2):503–509.
- Rollero S, Bloem A, Camarasa C, et al. Combined effects of nutrients and temperature on the production of fermentative aromas by Saccharomyces cerevisiae during wine fermentation. Appl Microbiol Biotechnol. 2015;99(5):2291–2304.
- Liu J, Yan D, Zhao S. Expression of monellin in a food-grade delivery system in Saccharomyces cerevisiae. J Sci Food Agric. 2015;95(13):2646–2651.
- Pattanakittivorakul S, Lertwattanasakul N, Yamada M, et al. Selection of thermotolerant Saccharomyces cerevisiae for high temperature ethanol production from molasses and increasing ethanol production by strain improvement. Antonie Van Leeuwenhoek. 2019;112(7):975–990.
- Chen SW, Chang YY, Huang HY, et al. Application of condensed molasses fermentation solubles and lactic acid bacteria in corn silage production. J Sci Food Agric. 2020;100(6):2722–2731.
- Ozmihci S, Kargi F. Kinetics of batch ethanol fermentation of cheese-whey powder (CWP) solution as function of substrate and yeast concentrations. Bioresour Technol. 2007;98(16):2978–2984.
- Mariam I, Manzoor K, Ali S. Enhanced production of ethanol from free and immobilized Saccharomyces cerevisiae under stationary culture. Pak J Bot. 2009;41(2):821–833.
- Jun-Ling LU, Chen HP, Xiao L. Characterization of a newly isolated strain Pseudomonas sp. N3 for denitrification at low temperature. Environ Sci. 2018;39(12):5612–5619.
- Diao L, Liu Y, Qian F, et al. Construction of fast xylose-fermenting yeast based on industrial ethanol-producing diploid Saccharomyces cerevisiae by rational design and adaptive evolution. BMC Biotechnol. 2013;13(1):110–110.
- El-Geddawy MA, Omar MB, Seleim MM, et al. Composition and properties of egyptian beet molasses. J Food Dairy Sci. 2012;3(12):669–679.
- Xiong Y, Xiang S, Cheng K. The contribution of Nitrosomonas europaea/nitrosococcus mobilis lineage to the deamination in full-scale landfill leachate treatment systems. China Environ Sci. 2021;41(6):2602–2609.
- Shao M, Guo L, She Z, et al. Enhancing denitrification efficiency for nitrogen removal using waste sludge alkaline fermentation liquid as external carbon source[J]. Environ Sci Pollut Res. 2019;26(5):4633–4644.
- State Environment Protection Administration of China (SEPA). Methods for water and wastewater monitoring and analysis [M]. 4th ed. Beijing: China Environmental Science Press, 2002. 200–220.
- Guo RB, Fu SF, Wang F, et al. Impacts of microaeration on the anaerobic digestion of corn straw and the microbial community structure. Chem Eng J. 2016;287:523–528.
- Darvishi F, Abolhasan Moghaddami N. Optimization of an industrial medium from molasses for bioethanol production using the taguchi statistical experimental-design method. Fermentation. 2019;5(1):14.
- Muzna H, Kamal KT, Waqas K, et al. Comparison between a newly isolated yeast strain and lalvin EC-1118 for enhanced ethanol yield from sugarcane molasses employing batch and modified fed-batch fermentation. Biobased Mater Bioenergy. 2018;12(1):134–142.
- Shanmugam P, Sivakumar V, Sridhar R, et al. Production of bio-ethanol from sugar molasses using Saccharomyces cerevisiae. Modern Appl Sci. 2009;3(8):32–37.
- Triantafyllos R. Continuous ethanol production from carob pod extract by immobilized Saccharomyces cerevisiae in a packed-bed reactor. Chem Technol Biotechnol. 1994;59(4):387–393.
- Chandrika K, Choragudi SF, Srimukhi R, et al. Characterization and continuous production of ethanol using immobilized yeast cells. Biosci. Biotech. Res. Comm. 2018;11(4):571–576.
- Shafaghat H, Najafpour GD, Rezaei PS, et al. Optimal growth of Saccharomyces cerevisiae (PTCC 24860) on pretreated molasses for the ethanol production: the application of the response surface methodology. CI&CEQ. 2010;16(2):199–206.
- Seo HB, Yeon JH, Jeong MH, et al. Ventilation alleviates ethanol inhibition and glycerol production during fed-batch ethanol fermentation. Biotechnol Bioproc E. 2009;14(5):599–605.
- Zhang Z, Zhang Y, Chen Y. Recent advances in partial denitrification in biological nitrogen removal: from enrichment to application. Bioresour Technol. 2020;298:122444.
- Holmes DE, Dang Y, Smith JA. Nitrogen cycling during wastewater treatment. Adv Appl Microbiol. 2019;106:113–192.
- Laurraine H L. The role of bacterial phosphate metabolism in enhanced phosphorus removal from the activated sludge process. Water Sci Technol. 1985;17(11-12):127–138.
- Gao S, Li Z, Hou Y, et al. Effects of different carbon sources on the efficiency of sulfur-oxidizing denitrifying microorganisms. Environ Res. 2022;204(Pt A):111946.
- Zhang LL, Zhang C, Hu C, et al. Sulfur-based mixotrophic denitrification corresponding to different electron donors and microbial profiling in anoxic fluidized-bed membrane bioreactors. Water Res. 2015;85:422–431.
- Anders HJ, Kaetzke A, Kämpfer P, et al. Taxonomic position of aromatic-degrading denitrifying pseudomonad strains K 172 and KB 740 and their description as new members of the genera thauera, as Thauera aromatica sp. nov. and azoarcus, as Azoarcus evansii sp. nov. respectively, members of the beta subclass of the proteobacteria. Int J Syst Bacteriol. 1995;45(2):327–333.
- Maintinguer SI, Sakamoto IK, Adorno M, et al. Evaluation of the microbial diversity of denitrifying bacteria in batch reactor. Braz J Chem Eng. 2013;30(3):457–465.
- Smith MG, Etages SD, Snyder M. Microbial synergy via an ethanol-triggered pathway. Mol Cell Biol. 2004;24(9):3874–3884.
- Martineau C, Mauffrey F, Villemur R. Comparative analysis of denitrifying activities of hyphomicrobium nitrativorans, Hyphomicrobium denitrificans, and Hyphomicrobium zavarzinii. Appl Environ Microbiol. 2015;81(15):5003–5014.
- Baytshtok V, Lu H, Park H, et al. Impact of varying electron donors on the molecular microbial ecology and biokinetics of methylotrophic denitrifying bacteria. Biotechnol Bioeng. 2009;102(6):1527–1536.
- Rissanen AJ, Ojala A, Fred T, et al. Methylophilaceae and hyphomicrobium as target taxonomic groups in monitoring the function of methanol fed denitrification biofilters in municipal wastewater treatment plants. Industrial Microbiology & Biotechnology. 2016;44(1):1–13.
- Xu X, Zhu J, Thies JE, et al. Methanol linked synergy between aerobic methanotrophs and denitrifiers enhanced nitrate removal efficiency in a membrane biofilm reactor under a low O2:CH4 ratio. Water Res. 2020;174:115595.
- Lu H, Chandran K, Stensel D. Microbial ecology of denitrification in biological wastewater treatment. Water Res. 2014;64(v.1):237–254.
- Idi A, Ibrahim Z, Mohamad SE, et al. Biokinetics of nitrogen removal at high concentrations by Rhodobacter sphaeroides ADZ101. Int Biodeterior Biodegrad. 2015;105:245–251.
- Etchebehere C, Errazquin MI, Dabert P, et al. Comamonas nitrativorans sp. nov. a novel denitrifier isolated from a denitrifying reactor treating landfill leachate. Int J Syst Evol Microbiol. 2001;51(Pt 3):977–983.
- Chen J, Lu J, Chen S, et al. Synchronous bio-reduction of uranium (VI) and vanadium (V) in aquifer: Performance and mechanisms. Chemosphere. 2022;288(Pt 2):132539.
- Arahal DR, Lucena T, Rodrigo-Torres L, et al. Ruegeria denitrificans sp. nov. a marine bacterium in the family rhodobacteraceae with the potential ability for cyanophycin synthesis. Int J Syst Evol Microbiol. 2018;68(8):2515–2522.
- Morley NJ, Richardson DJ, Baggs EM. Substrate induced denitrification over or under estimates shifts in soil N2/N2O ratios. PLoS One. 2014;9(9):e108144.
- Jing L, Sun Y, Wang H, et al. Denitrification in simulated groundwater using lignite as a solid-phase organic carbon source. Tecnol. cienc. agua. 2019;10(4):238–255.
- Yan D, Lu Y, Chen YF, et al. Waste molasses alone displaces glucose-based medium for microalgal fermentation towards cost-saving biodiesel production. Bioresour Technol. 2011;102(11):6487–6493.
- Yang M, Sun Y l, Zhen XC, et al. Denitrification efficiency and techno-economic analysis of different exotic additional carbon source. Water Wastewater Eng. 2010;36(11):125–128.
- Skornia K, Safferman SI, Rodriguez-Gonzalez L, et al. Treatment of winery wastewater using bench-scale columns simulating vertical flow constructed wetlands with adsorption media[J]. Applied Sciences. 2020;10(3):1063.
- Hong X, Jiaojiao W, Hong P, et al. Mixed carbon source improves deep denitrification performance in up-flow anaerobic sludge bed reactor. Water Sci Technol. 2020;81(4):763–772.