
Abstract
Exploring the genetic basis of adaptive divergence at fine spatial scales can broaden our basic understanding of evolution and how organisms may adapt to changing environments in the future. Cave-associated microhabitats provide a unique opportunity to gain insight into microgeographic adaptation. We studied the genetic architecture of microhabitat-related divergence in flower phenology and leaf traits between two sister species of Primulina, P. depressa and P. danxiaensis, which live in sympatry but occupy contrasting microhabitats. We identified 40 significant quantitative trait loci (QTLs) associated with the interspecific differences in these microhabitat adaptation traits. Flowering time was controlled by one major-effect and six minor-effect QTLs, while leaf traits were influenced by 9–12 QTLs of small to moderate effect. The genetic architecture of the flowering time and the specific leaf area was genetically independent of other traits. Our results suggest that microhabitat adaptation in sympatric populations of Primulina differs according to different traits, with leaf traits diverging with the accumulation of many small changes and flowering phenology being driven by major effect variance.
Introduction
Adaptive divergence at fine spatial scales (i.e. microgeographic adaptation) has broad ecological and evolutionary implications [Citation1]. In the face of local environmental conditions, plants cannot escape to a favorable habitat but cope with environmental factors directly. This is particularly relevant for flowering plants confined to terrestrial habitat islands, such as inselbergs, granite outcrops and caves, where species occur in small, restricted landmasses and are generally isolated from a surrounding community [Citation2]. This phenomenon is apparent in southern China, where both karst and Danxia landforms (a red terrigenous landform named after Danxia Mountain in Guangdong, China) have generated abundant cave and cave-associated habitats [Citation3, Citation4]. These microhabitats support a remarkably high level of species endemism in flowering plants, as observed for Begonia, Pilea, and Primulina. Although the species diversity of individual caves is usually low, the plant composition shows considerable variation from one cave to another and, hence, low α diversity but high β diversity across the fragmented landscape [Citation5]. This has led to the recognition of southern China as one of the world’s centers of plant diversity [Citation6]. Both ‘South China Karst’ and ‘China Danxia’ are special landforms and are rich in biodiversity, and they have been listed as World Natural Heritage sites by UNESCO and are in great need of protection. The ability of plants to adapt to cave and cave-associated habitats may have important consequences for the generation, maintenance, and distribution of species diversity.
As highlighted previously [Citation7], cave and cave-associated habitats often provide abiotic and biotic selection agents for a wide range of plant traits. These include pollinator limitation, shallow soil with low-water holding capacity, and reduced availability of essential plant nutrients. Flowering phenology is a key ecological trait that has been shown to be under both biotic and abiotic selection [Citation8, Citation9]. It is a critical life history trait that ensures the seed production required for the survival of species [Citation10]. In plants that depend on animal pollinators for reproduction, the flowering times have evolved alongside the emergence period of pollinators [Citation11, Citation12]. In terms of abiotic factors, water deficiency results in earlier flowering to escape drought [Citation13, Citation14]. Temperature is also an important selection factor for flowering time, with warmer climates resulting in earlier flowering [Citation15].
Leaf traits are important adaptive traits that experience numerous selective pressures. In addition to their major role in photosynthesis, leaves are involved in nutrient storage, defense and stress responses. Small leaves are associated with harsh conditions such as nutrient deficiency, aridity, high light, or a combination of these factors [Citation16]. Even though leaf shape varies less predictably across environments or biomes than size [Citation17], it has often been reported to be strongly influenced by leaf water relations (reviewed by Nicotra et al. [Citation16]). Moreover, the specific leaf area (SLA) is one of the most predictive traits for plant physiological strategies because of its close relationship with leaf life span, growth rate, photosynthetic rate, nutrient availability and water availability [Citation18]. Thus, the diversity of both flower and leaf traits contributes to microhabitat adaptation. Lambrecht and Dawson (2007) demonstrated that leaf morphology and physiology influence flower traits (pollination system) through moisture availability and water usage in five plant species [Citation19].
Although many studies have explored the ecological and evolutionary significance of flower and leaf traits in various natural systems, their genetic architecture has received less attention. Quantitative trait locus (QTL) mapping is effective in detecting genetic architecture, and it has been used widely for genetic analyses in crop species [Citation20–22]. Crops are not suitable for the study of the genetic basis of adaptation to natural environments because their traits are often shaped from artificial selection. The genetic architecture of flower and leaf traits in wild populations provides us a candidate method to detect the evolutionary processes of plant traits in nature [Citation23, Citation24].
Primulina depressa and P. danxiaensis are sister species that are narrowly endemic to northern Guangdong, south China. These two species have a sympatric distribution (<100 m) in Danxia Mountain, a National Park and UNESCO World Heritage site in Guangdong, south China. However, these two species differ in their microhabitats, with P. danxiaensis tending to occupy the twilight zone of caves and P. depressa tending to grow on outcrops (Figure S1 of Feng et al. [Citation25]). Despite their contrasting morphological differences, phylogenetic analysis of individuals from multiple sites indicates that the P. danxiaensis population sympatric with P. depressa shows greater similarity to P. depressa than to conspecific populations [Citation26]. Field investigations have revealed that the two have partially overlapping flowering times for about one month, and their pollinators are partially identical [Citation27]. In a greenhouse, fertile hybrids can be generated by using P. depressa as the pollen donor. We hypothesized that phenotypic differentiation in these species in sympatry is maintained by local adaptation to local microhabitats. Identification of the number, size and distribution of genomic regions underlying phenotypic differentiation is a key step in the analysis of the genetic basis of microgeographic adaptation.
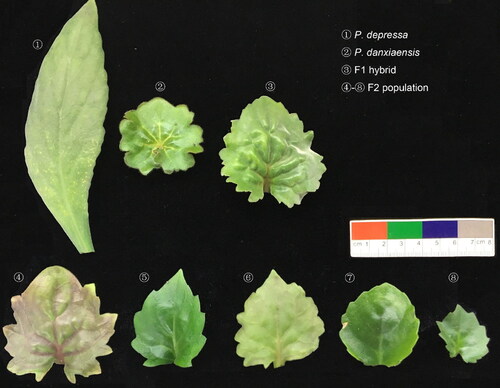
Figure 1. Fully expanded leaves of P. depressa (1), P. danxiaensis (2), the F1 hybrid (3) and some individuals of the F2 population (4–8).
In our previous studies of this species pair, we detected the genetic architecture of some flower and leaf traits and hybrid male fertility with QTL methods based on an F2-interspecific cross between P. depressa and P. danxiaensis [Citation25, Citation27]. For this report, we conducted QTL mapping for leaf size and shape traits (maximum leaf area and leaf length-width ratio), a leaf physiology trait (SLA), and a phenology trait (flowering time). We characterized the number, mode of action, digenic interactions, and phenotypic effects of loci. We then detected whether QTLs underlying these microhabitat adaptation traits were coincident with other flower and leaf or post-zygotic isolation trait QTLs. Our primary objective was to dissect the genetic architecture of these traits that play important roles in microhabitat adaptation in this system.
Materials and methods
Plant materials and sequencing
As previously described [Citation27], we collected parental lines (P. depressa and P. danxiaensis) at the sympatric site of Danxia Mountain National Park. The voucher specimens were deposited at the South China Botanical Garden Herbarium (IBSC; the serial numbers for P. depressa and P. danxiaensis are DXS02 and DXS04, respectively). The parents exhibited differences in leaf morphology, leaf physiology and flowering time traits [Citation25] (; ). The F2 mapping population of 201 individuals was derived by self-fertilizing one F1 plant that was descended from a cross between a paternal DXS02 individual and a maternal DXS04 individual. We propagated these plants by leaf cuttage, and planted them in a greenhouse in the South China Botanical Garden under fluorescent light to provide a 14-h day length, with a temperature of ∼26 °C. Plants were sub-irrigated as needed and fertilized weekly. F1 hybrids, male and female parents, and 201 F2 individuals (the mapping population) were genotyped by restriction site-associated DNA sequencing (RAD-seq). The linkage map was constructed with 195 individuals and it was of high-density with 2,484 markers spaced across 18 linkage groups. For further details, see Feng et al. [Citation25, Citation27].
Table 1. Means and standard deviations for the four studied traits in P. depressa and P. danxiaensis and F1 hybrids, and phenotypic values range of F2 population.
Trait measurements
Four traits were measured, including two leaf morphological traits (leaf area, and leaf length-width ratio), one leaf physiology trait (SLA) and one phenology trait (flowering time). Plants for leaf trait measuring were consistent with our previous work [Citation25], which include 10 P. depressa individuals, nine P. danxiaensis individuals, three F1 hybrids, and 201 F2 individuals. The genotypes of each individual were unique.
We scanned three mature and fully expanded leaves collected from each individual (). We used the ImageJ v.1.49 [Citation28] software to quantify leaf area, leaf length and leaf width. The largest mature leaf of each individual was sampled to measure the maximum leaf area (LA; cm2), length (LL; cm), and width (LW; cm). A derived trait, leaf length-width ratio (LWR) = LL LW−1, was calculated. Following this measurement, the leaves were then placed in an air oven to dry for a minimum of 72 h at 80 °C, following which the final dry mass (MD; g) was recorded. The SLA (in units of cm2g−1) of each leaf was calculated as: SLA = LA MD−1. The flowering time was scored as the number of days between seedling transplantation and the day the first corolla was fully expanded. Traits data for analysis are available at the FIGSHARE repository: https://doi.org/10.6084/m9.figshare.7270715.v3.
We assessed whether parental trait values differed significantly using two-sided tests in the R statistical environment [Citation29]. We calculated Spearman’s correlations between all pairwise combinations of traits in the F2 population using R [Citation29]. In the phenotypic correlation analysis, we assessed the four traits mentioned above together with 13 previously reported traits [Citation25, Citation27]. Statistical significance was evaluated using the sequential Bonferroni correction to adjust significance levels for multiple comparisons [Citation30].
QTL mapping
A linkage map containing 2,484 markers with an average marker distance of 0.96 cM was developed in our previous work [Citation25]. We mapped the QTLs on the linkage map by using MapQTL v.6.0 software [Citation31], as described by Feng et al. [Citation27]. In brief, we determined the logarithm of the odds (LOD) score threshold by permutation testing. Multiple QTL Model (MQM) analysis was repeated to characterize loci with LOD scores higher than the threshold. The QTLs were finally estimated as 1.5-LOD support intervals for each MQM cofactor. The QTL maps were drawn using MapChart v.2.2 software [Citation32].
Locus analysis
To evaluate the significance of the correspondence between QTLs in different traits, a previously described statistical test based on the hypergeometric probability distribution [Citation33] was used to calculate the probability of obtaining the observed number of matching QTL by chance alone [Citation34]. The equation is as presented in Wu and Davis (1993) [Citation35]. In this analysis, we evaluated the QTLs underlying traits in this study as well as other traits that we studied previously [Citation25, Citation27].
A QTL was considered as minor or major depending on the phenotypic variance it expressed. A QTL expressing a phenotypic variance of more than 15% was considered as a major QTL [Citation36]. We further analyzed the pairwise interactions between QTLs for each trait with markers closer to QTL peaks using R/qtl [Citation37].
Results
Analysis of phenotypic variance and correlations
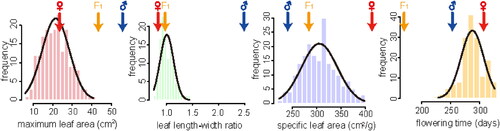
We found significant phenotypic differentiation between all four measured traits (). The leaf size of the paternal lines (P. depressa) was larger than that of the maternal lines (P. danxiaensis) ( and ). The paternal individual leaves were long and narrow, and thus had much larger LWR values than that of the maternal individuals ( and ). The SLA of P. depressa was lower than that of P. danxiaensis (), which may indicate that P. depressa has higher water-use efficiency. The F1 plants showed intermediate phenotype between the two parental phenotypes, except for flowering time ().
Figure 2. Histograms of the four analyzed traits in the F2 population. Phenotypic means for P. depressa, P. danxiaensis and F1 hybrids are indicated with blue, red and orange arrows, respectively.
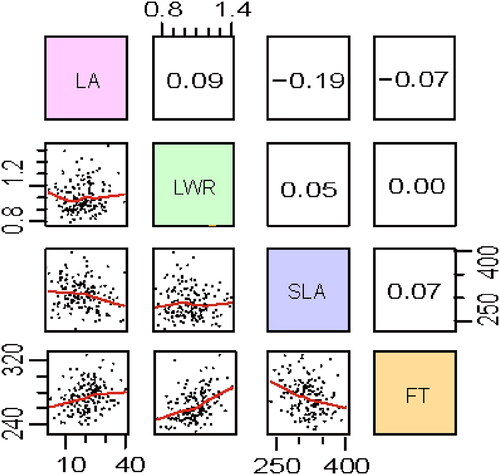
The four traits were weakly correlated with each other (). However, leaf area was positively significantly correlated with maximum leaf length and width (Supplemental Figure S1). Strong significant correlations were also observed among leaf physiological traits, with a negative correlation between SLA and leaf pigment concentrations (Supplemental Figure S1). These strong pairwise correlations may indicate that the trait divergence between P. depressa and P. danxiaensis is controlled by pleiotropic and/or tightly linked loci.
Figure 3. Correlations between and within the four traits (LA: maximum leaf area; LWR: leaf length-width ratio; SLA: specific leaf area; FT: flowering time) in the F2 population. Scatterplots of all traits are given below the diagonal and Spearman’s correlation coefficients and associated significance are given above the diagonal.
QTL mapping analyses
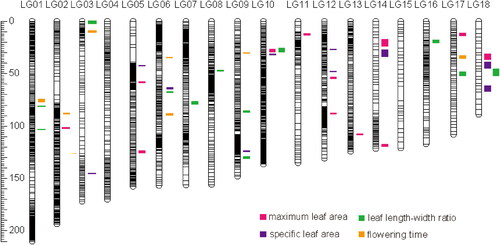
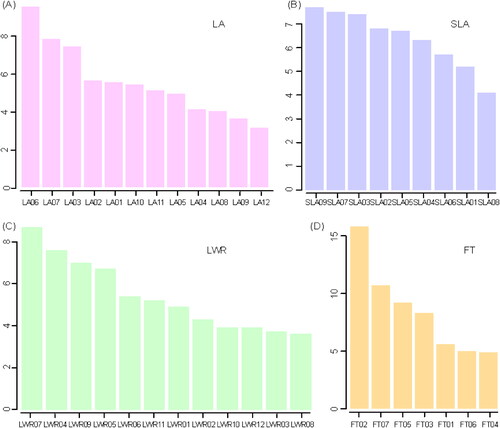
A total of 40 QTLs were identified for the four phenotypic traits examined in this study (), with the number of QTLs detected per trait ranging from seven for flowering time to 12 for either maximum leaf area or leaf length-width ratio (Supplemental Table S1). The phenotypic variance explained (PVE) for the identified QTLs ranged from 3.1% to 15.8%, with the majority (95%) of the QTLs having small effects (PVE < 10%; Supplemental Table S1). These QTLs accounted for 57.4–66.0% of the total proportion of the trait variation. The QTL for maximum leaf area explained the highest proportion of F2 variation, whereas the QTL for SLA had the lowest explanatory power (Supplemental Table S1).
Figure 4. Genome location of significant QTLs for four traits. Confidence intervals of the QTLs are illustrated on the right side of the linkage groups.
Each QTL for three leaf traits (maximum leaf area, leaf length-width ratio, and SLA) explained their corresponding trait variance of less than 15% (; Supplemental Table S1). This suggests that these leaf traits were controlled by some minor-effect loci. For flowering time, FT02 on LG02 is a major-effect locus with a LOD value of 9.44 and a variance explained of 15.8% (; Supplemental Table S1). The P. depressa allele at FT02 was associated with earlier flowering by 17.89 d (Supplemental Table S1). These results suggest that the genetic architecture of flowering time includes a major-effect QTL and many minor-effect QTLs.
Figure 5. The phenotypic variance explained value of QTLs for four traits. LA: maximum leaf area; LWR: leaf length-width ratio; SLA: specific leaf area; FT: flowering time.
In these 40 QTLs, LA04 for the maximum leaf area and LWR09 for leaf length-width ratio on LG10 were overlapped (). We calculated the significance of the correspondence between the overlapping QTLs and found that this QTL pair did not show significantly more overlap than expected by chance (p > 0.05) (Supplemental Table S2). This is consistent with the low phenotypic correlations among these traits. This indicated that these traits were controlled by a different genetic basis. Compared with previous QTLs for 12 flower and leaf traits and one reproductive isolation trait (hybrid pollen fertility) for the same population [Citation25, Citation27], we found that both the maximum leaf area and leaf length-width ratio harbored some QTLs (LA01, LA05, LA07, LA12, and LWR03, LWR04, LWR10, and LWR11) that overlapped with those for other leaf size traits (maximum leaf length and maximum leaf width) (Supplemental Figure S2). Additionally, they exhibited significantly more overlap than expected by chance (Supplemental Table S2). These results were consistent with the strong correlations of the phenotypic values. However, the overlap between SLA09 for SLA and Cc11 for leaf carotenoid concentration on LG18 was more likely to be by chance. In addition, we did not find any QTL for flowering time that overlapped with other traits ().
Table 2. Summary of significant epistatic interaction between QTLs.
Loci interaction
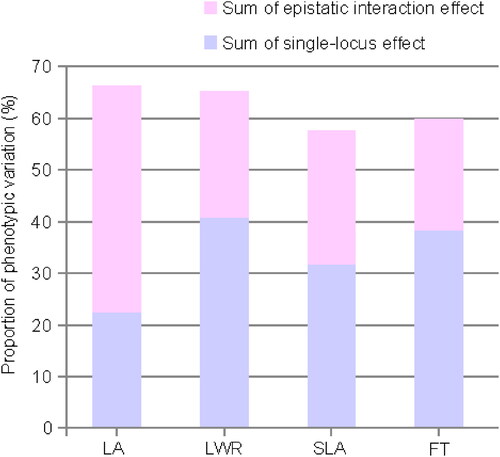
There was evidence of epistasis for all four traits analyzed (). A significant pairwise epistatic interaction (p < 0.05) was found for 45% (18 of 40) of QTLs. Genetic epistasis could partly explain the phenotypic variation for these measured traits ( and ). The fraction of the phenotypic variation explained by epistasis for each trait ranged from 24.3% to 66.4% (). There were seven loci for the maximum leaf area and three for the leaf length-width ratio involved in digenic interaction (Supplemental Figure S3). The effect of LA03 in the background of LA04 with the homozygous male parent genotype (AA) was evident from the fact that the maximum leaf area of all genotypes was the same. For LA08, the maximum leaf area of the heterozygote (AB) was high under the background of homozygous LA10 (BB) (Supplemental Figure S3). The phenotypic values were similar between LA10 heterozygotes (AB) and homozygotes (AA), which is consistent with the high degree of dominance of this locus. For SLA, five out of nine loci were involved in three pairs of digenic interactions: SLA02/SLA08, SLA03/SLA09 and SLA04/SLA08 (Supplemental Figure S3; ). Genetic conflicts were obvious in all epistatic loci pairs; in other words, paired loci that inherit alleles from different parents will result in low phenotypic values. For flowering time, digenic interactions were identified between two QTL pairs involving three loci: FT01/FT06 and FT01/FT07 (Supplemental Figure S4; ).
Figure 6. Proportion of phenotypic variation explained by all of the single QTLs and epistatic interactions. LA: maximum leaf area; LWR: leaf length-width ratio; SLA: specific leaf area; FT: flowering time.
Discussion
The genetic architecture of microgeographic adaptation
We detected 40 QTL for the four microhabitat adaptation traits, with each trait influenced by at least seven loci. These results indicate a highly polygenic genetic architecture involved in microhabitat adaptation in P. depressa and P. danxiaensis in sympatry. For leaf morphological and physiological traits, each QTL explained small to moderate effects (3.1%–9.5%) of the phenotypic variance. In our previous research, we found that differences in leaf size and pigment contents were also dominated by substantial QTLs with small to moderate effects in these two sympatric species [Citation25].
We found four pairs of digenic interactions among leaf size QTLs, which indicated that the genetic architecture of leaf size was more complex than the other traits. Furthermore, this was consistent with the leaf size traits (leaf length and leaf width) we studied previously by our group [Citation25]. The polygenic genetic basis of leaf shape (leaf length-width ratio) is in agreement with that observed in other plant species. For example, Zhang et al. (2015) identified seven QTLs, each of which explained up to 10% of the variance for the leaf length-width ratio in rice [Citation38]. In poplar, nine leaf-shape traits were controlled by QTLs with small to moderate effects [Citation39]. The small-to-moderate effect size of the leaf shape QTLs in these studies is also consistent with our research. However, the leaflet width-length ratio in tomato is controlled by two large-effect QTLs, each explaining more than 19% of the variance [Citation40]. This suggests that the genetic architectures of leaf shape in plants are lineage-specific. SLA is an important indicator for water usage efficiency in plants [Citation38, Citation41]. Although the ecological significance of SLA has received attention in many crops, there has been less research into the genetic architecture of SLA in natural systems. Our results indicated that the differences in SLA between P. depressa and P. danxiaensis were dominated by some QTLs with small effects, consistent with the observation in soybean [Citation42] but in contrast to that in maize [Citation43] and rice [Citation44].
For flowering time, our analysis identified one major-effect QTL, which explained 15.8% of the trait variation. Six minor-effect individual QTLs jointly explained 4.9–10.7% of the flowering time variance. These findings are consistent with Ferris et al. (2017), who reported that few QTLs of large effect underlie interspecific divergence in the phenotypic traits of sympatric species of the Mimulus guttatus complex [Citation45]. Similarly, Dittmar et al. (2016) identified two candidate genes associated with local adaptation, underlying a major flowering time QTL in Arabidopsis thaliana [Citation46]. In addition, we tried to search the SNP locus underling the 1.5-LOD peak region of this major-effect flowering time QTL (FT02 on LG02) on the P. huaijiensis reference genome [Citation7]. We found a compelling candidate gene copy, FRIGIDA-LIKE PROTEIN (gene number of Phu03062 located on Chr06 in the reference genome), at 0.9 Mb downstream of this SNP locus. FRIGIDA regulates the floral repressor FLC in Arabidopsis [Citation47, Citation48]. This gene may be an important adaptive gene for the divergence of this pair of sister species (P. depressa and P. danxiaensis). However, this hypothesis should be further explored experimentally, as the reference genome we used was not of the parental species.
Reproductive asynchrony (e.g. different flowering times) is a prevalent isolation barrier between closely-related sympatric species [Citation45, Citation49, Citation50]. In this study, P. depressa and P. danxiaensis had partially overlapping flowering times for about one month [Citation25], and the mean flowering time of P. depressa was much earlier than that of P. danxiaensis (). We identified a large-effect QTL underlying flowering time divergence in the present study. Theoretically, the local adaptation of closely related populations in sympatry should be due to few loci of large effect because of the homogenizing effects of gene flow [Citation51]. In other words, large-effect loci may maintain the purity of species. These results indicated that flowering time may play an important role in the microhabitat adaptation and maintenance of species identity in the sympatric pair of P. depressa and P. danxiaensis.
We demonstrated that leaf traits and flowering phenology had contrasting patterns of genetic architecture and were relatively independently genetically controlled in this species pair. This genetic independence will result in independent selection on those traits. This is consistent with that found in Arabidopsis [Citation52], but differs from the results in maize [Citation21] and turnip [Citation53]. Different patterns of genetic architecture also indicated that microhabitat adaptation in the sympatric Primulina was unequable for different traits, with leaf traits diverging via the accumulation of many small changes, and flowering phenology divergence being driven by major-effect variance.
Microhabitat adaptation and reproductive barriers in sympatric Primulina species
Sympatric sister species, particularly those connected by some degree of gene flow, provide an ideal system to investigate microhabitat adaptation and reproductive barriers. The overlapping flowering period provides an opportunity for the gene flow between P. depressa and P. danxiaensis in Danxia Mountain. This was supported by the phylogenetic results that show that the P. danxiaensis population sympatric with P. depressa shows greater genetic similarity to P. depressa than it is to conspecific populations [Citation26].
The divergence of species with gene flow requires more barriers to accelerate or maintain speciation. In our previous work, we found that flower size significantly diverged between these two species and might be due to natural selection [Citation25]. Hybrid sterility contributes to the post-zygotic barriers [Citation27]. In this study, we found that flowering phenology may also play an important role in reproductive barriers. Both flowering phenology and hybrid fertility were controlled by similar genetic architecture patterns, with one major effect locus plus multiple small-to-medium effect loci. Two QTLs for hybrid fertility overlapped with QTLs for flower size; however, no overlapping QTL was identified between flowering phenology and other traits. This indicated that the genetic architecture of flowering phenology was independent of the other traits. Using the current data, it was not possible to distinguish if the divergence of flowering phenology was caused by independent selection or genetic drift.
Traits contributing to reproductive isolation include pre-zygotic barriers such as ecogeographic isolation [Citation54–56], pollinator-mediated isolation [Citation57–59], and post-zygotic barriers such as hybrid inviability and sterility [Citation60–62]. In the sympatric sister species of Primulina, we previously identified the genetic architecture of pollinator-mediated isolation (flower size) [Citation25] and post-zygotic isolation (hybrid sterility) [Citation27]. In this study, both flowering phenology and leaf traits were associated with ecogeographic isolation. Our work improved the understanding of the genetic architecture of reproductive isolation and microhabitat adaptation in sympatric Primulina species.
Conclusions
Primulina species are cave-associated organisms that are an excellent model for research into microgeographic adaptation. In this study, we investigated the genetic architecture of flowering phenology and leaf morphology and physiology between a pair of sympatric sister species of Primulina. We found that flowering time was controlled by one major- and six minor-effect QTLs, while leaf traits were influenced by nine to 12 QTLs of small to moderate effect. The genetic architecture of flowering time and SLA was genetically independent of other traits. The different genetic architecture patterns of microhabitat adaptation traits also indicated that leaf traits diverged with the accumulation of many small changes, while the divergence of flowering phenology was driven by major-effect variance.
Authors’ contributions
CF designed this project, conducted the experiments and wrote the manuscript. CF, SZ and JZ analyzed the data. SZ and JZ revised the manuscript.
Acknowledgments
We are sincerely grateful to Prof. Ming Kang and Dr. Lihua Yang (South China Botanical Garden, CAS) for plant collection and advise for project designing.
Data availability statement
All the data and plant material are available from the first author (CF) upon reasonable request. Traits data for analysis are available at the FIGSHARE repository: Feng C, Feng C, Yang L, Kang M, Rausher M. qtlST script and phenotypic data. figshare. Dataset; 2019. https://doi.org/10.6084/m9.figshare.7270715.v3
Disclosure statement
No potential conflict of interest was reported by the authors.
Additional information
Funding
References
- Richardson JL, Urban MC, Bolnick DI, et al. Microgeographic adaptation and the spatial scale of evolution. Trends Ecol Evol. 2014;29(3):165–176.
- Gao Y, Ai B, Kong HH, et al. Geographical pattern of isolation and diversification in karst habitat islands: a case study in the Primulina eburnean complex. J Biogeogr. 2015;42(11):2131–2144.
- Peng H. A survey of the Danxia landform research in China. Sci Geogr Sin. 2000;20:203–211.
- Yuan D. World correlation of karst ecosystem: objectives and implementation plan. Adv Earth Sci. 2001;16:461–466.
- Krishnadas M, Osuri AM. Environment shapes the spatial organization of tree diversity in fragmented forests across a human-modified landscape. Ecol Appl. 2021;31(2):e02244.
- Davis SD, Heywood VH, Hamilton AC. Centres of plant diversity. Vol. 2: Asia, Australasia and the Pacific. Gland: WWF/IUCN; 1995.
- Feng C, Wang J, Wu L, et al. The genome of a cave plant, Primulina huaijiensis, provides insights into adaptation to limestone karst habitats. New Phytol. 2020;227(4):1249–1263.
- Elzinga JA, Atlan A, Biere A, et al. Time after time: flowering phenology and biotic interactions. Trends Ecol Evol. 2007;22(8):432–439.
- Galloway LF, Burgess KS. Artificial selection on flowering time: influence on reproductive phenology across natural light environments. J Ecol. 2012;100(4):852–861.
- Kazan K, Lyons R. The link between flowering time and stress tolerance. J Exp Bot. 2016;67(1):47–60.
- Johnston MO. Natural selection on floral traits in two species of Lobelia with different pollinators. Evolution. 1991;45(6):1468–1479.
- Muchhala N, Thomson JD. Going to great lengths: selection for long corolla tubes in an extremely specialized bat-flower mutualism. Proc R Soc B-Biol Sci. 2009;276:2147–2152.
- Bernal M, Estiarte M, Peñuelas J. Drought advances spring growth phenology of the Mediterranean shrub Erica multiflora. Plant Biol (Stuttg). 2011;13(2):252–257.
- Franks SJ. Plasticity and evolution in drought avoidance and escape in the annual plant Brassica rapa. New Phytol. 2011;190(1):249–257.
- Haggerty BP, Galloway LF. Response of individual components of reproductive phenology to growing season length in a monocarpic herb. J Ecol. 2011;99(1):242–253.
- Nicotra AB, Leigh A, Boyce CK, et al. The evolution and functional significance of leaf shape in the angiosperms. Funct Plant Biol. 2011;38(7):535–552.
- McDonald PG, Fonseca CR, Overton JM, et al. Leaf-size divergence along rainfall and soil-nutrient gradients: is the method of size reduction common among clades? Funct Ecol. 2003;17:50–57.
- Poorter H, Niinemets Ü, Poorter L, et al. Causes and consequences of variation in leaf mass per area (LMA): a meta-analysis. New Phytol. 2009;182(3):565–588.
- Lambrecht SC, Dawson TE. Correlated variation of floral and leaf traits along a moisture availability gradient. Oecologia. 2007;151(4):574–583.
- Díaz A, MartínHernández AM, DolcetSanjuan R, et al. Quantitative trait loci analysis of melon (Cucumis melo L.) domestication‑related traits. Theor Appl Genet. 2017;130(9):1837–1856.
- Li D, Wang X, Zhang X, et al. The genetic architecture of leaf number and its genetic relationship to flowering time in maize. New Phytol. 2016;210(1):256–268.
- Muir CD, Pease JB, Moyle LC. Quantitative genetic analysis indicates natural selection on leaf phenotypes across wild tomato species (Solanum sect. Lycopersicon; Solanaceae). Genetics. 2014;198(4):1629–1643.
- Goodwillie C, Ritland C, Ritland K. The genetic basis of floral traits associated with mating system evolution in Leptosiphon (Polemoniaceae): an analysis of quantitative trait loci. Evolution. 2006;60(3):491–504.
- Remington DL, Purugganan MD. Candidate genes, quantitative trait loci, and functional trait evolution in plants. Int J Plant Sci. 2003;164:7–20.
- Feng C, Feng C, Yang L, et al. Genetic architecture of quantitative flower and leaf traits in a pair of sympatric sister species of Primulina. Heredity. 2019;122(6):864–876.
- Kong H, Condamine FL, Harris AJ, et al. Both temperature fluctuations and East Asian monsoons have driven plant diversification in the karst ecosystems from Southern China. Mol Ecol. 2017;26(22):6414–6429.
- Feng C, Yi H, Yang L, et al. The genetic basis of hybrid male sterility in sympatric Primulina species. BMC Evol Biol. 2020;20(1):49.
- Abràmoff MD, Magalhães PJ, Ram SJ. Image processing with ImageJ. Biophotonics Int. 2004;11:36–42.
- R Development Core Team. R: a language and environment for statistical computing. Vienna: R Foundation for Statistical Computing; 2012.
- Rice WR. Analyzing tables of statistical tests. Evolution. 1989;43(1):223–225.
- van Ooijen JW. MapQTL® 5 software for the mapping of quatitative trait loci in experimental populations. Wageningen, The Netherlands: Kyazma BV; 2004.
- Voorrips R. MapChart: software for the graphical presentation of linkage maps and QTLs. J Hered. 2002;93(1):77–78.
- Larsen R, Marx M. An introduction to probability and its applications. Englewood Cliffs: Prentice Hall Inc.; 1985.
- Lin YR, Schertz KF, Paterson AH. Comparative analysis of QTLs affecting plant height and maturity corss the Poaceae, in reference to an interspecific sorghum population. Genetics. 1995;14:391–411.
- Wu C-I, Davis AW. Evolution of postmating reproductive isolation–the composite nature of Haldane’s rule and its genetic bases. Am Nat. 1993;142(2):187–212.
- Salvi S, Tuberosa R. To clone or not to clone plant QTLs: present and future challenges. Trends Plant Sci. 2005;10(6):297–304.
- Broman KW, Sen Ś. Fit and exploration of multiple–QTL models. In A guide to QTL mapping with R/qtl. Statistics for biology and health. New York: Springer; 2009. p. 241–282.
- Zhang B, Ye W, Ren D, et al. Genetic analysis of flag leaf size and candidate genes determination of a major QTL for flag leaf width in rice. Rice. 2015;8(1):2.
- Xia W, Xiao Z, Cao P, et al. Construction of a high-density genetic map and its application for leaf shape QTL mapping in poplar. Planta. 2018;248(5):1173–1185.
- Frary A, Fritz LA, Tanksley SD. A comparative study of the genetic bases of natural variation in tomato leaf, sepal, and petal morphology. Theor Appl Genet. 2004;109(3):523–533.
- Field C, Merino J, Mooney HA. Compromises between water-use efficiency and nitrogen-use efficiency in five species of California evergreens. Oecologia. 1983;60(3):384–389.
- Jun T, Freewalt K, Michel AP, et al. Identification of novel QTL for leaf traits in soybean. Plant Breed. 2014;133(1):61–66.
- Hund A, Frascaroli E, Leipner J, et al. Cold tolerance of the photosynthetic apparatus: pleiotropic relationship between photosynthetic performance and specific leaf area of maize seedlings. Mol Breed. 2005;16(4):321–331.
- Laza MR, Kondo M, Ideta O, et al. Identification of quantitative trait loci for Delta C-13 and productivity in irrigated lowland rice. Crop Sci. 2006;46(2):763–773.
- Ferris KG, Barnett LL, Blackman BK, et al. The genetic architecture of local adaptation and reproductive isolation in sympatry within the Mimulus guttatus species complex. Mol Ecol. 2017;26(1):208–224.
- Dittmar EL, Oakley CG, Conner JK, et al. Factors influencing the effect size distribution of adaptive substitutions. Proc R Soc London B Biol Sci. 2016;283:20153065.
- Shindo C, Aranzana MJ, Lister C, et al. Role of FRIGIDA and FLOWERING LOCUS C in determining variation in flowering time of Arabidopsis. Plant Physiol. 2005;138(2):1163–1173.
- Deng W, Ying H, Helliwell CA, et al. FLOWERING LOCUS C (FLC) regulates development pathways throughout the life cycle of Arabidopsis. Proc Natl Acad Sci USA. 2011;108(16):6680–6685.
- Matsumoto T, Yasumoto AA, Nitta K, et al. Difference in flowering time can initiate speciation of nocturnally flowering species. J Theor Boil. 2015;370:61–71.
- Michalski SG, Durka W. Separation in flowering time contributes to the maintenance of sympatric cryptic plant lineages. Ecol Evol. 2015;5(11):2172–2184.
- Yeaman S, Whitlock MC. The genetic architecture of adaptation under migration–selection balance. Evolution. 2011;65(7):1897–1911.
- Juenger T, Pérez-Pérez JM, Bernal S, et al. Quantitative trait loci mapping of floral and leaf morphology traits in Arabidopsis thaliana: evidence for modular genetic architecture. Evol Devel. 2005;7(3):259–271.
- Lou P, Zhao J, Kim JS, et al. Quantitative trait loci for flowering time and morphological traits in multiple populations of Brassica rapa. J Exp Bot. 2007;58(14):4005–4016.
- Nagy ES, Rice KJ. Local adaptation in two subspecies of an annual plant: implications for migration and gene flow. Evolution. 1997;51(4):1079–1089.
- Ramsey J, Bradshaw HD, Schemske DW. Components of reproductive isolation between the monkeyflowers Mimulus lewisii and M. cardinalis (Phrymaceae). Evolution. 2003;57:1520–1534.
- Glennon KL, Rissler LJ, Church SA. Ecogeographic isolation: a reproductive barrier between species and between cytotypes in Houstonia (Rubiaceae). Evol Ecol. 2012;26(4):909–926.
- Grant V. Pollination systems as isolating mechanisms in angiosperms. Evolution. 1949;3(1):82–97.
- Segraves KA, Thompson JN. Plant polyploidy and pollination: floral traits and insect visits to diploid Heuchera grossularifolia. Evolution. 1999;53(4):1114–1127.
- Moe AM, Weiblen GD. Pollinator-mediated reproductive isolation among dioecious fig species (Ficus, Moraceae). Evolution. 2012;66(12):3710–3721.
- Burton TL, Husband BC. Fitness differences among diploids, tetraploids, and their triploid progeny in Chamerion angustifolium: mechanisms of inviability and implications for polyploid evolution. Evolution. 2000;54(4):1182–1191.
- Grundt HH, Kjølner S, Borgen L, et al. High biological species diversity in the arctic flora. Proc Natl Acad Sci USA. 2006;103(4):972–975.
- Borges LA, Souza LGR, Guerra M, et al. Reproductive isolation between diploid and tetraploid cytotypes of Libidibia ferrea (Caesalpinia ferrea) (Leguminosae): ecological and taxonomic implications. Plant Syst Evol. 2012;98:1371–1381.