
Abstract
Boron (B) deficiency is detrimental to Glycine max (L.) Merr., which is one of the leading oil crops. In this study, physiological analysis of soybean seedlings under B deficiency and control after 12 h, 24 h, 72 h and 8 days was carried out, and the roots were subjected to transcriptome sequencing analysis. The results showed that under B deficiency, the plant height, SPAD and chlorophyll fluorescence value of soybean seedlings decreased significantly, indicating that B stress significantly inhibited plant growth and photosynthesis. RNA-seq revealed a total of 5126 DEGs (Differentially Expressed Genes), and nine DEGs co-existed at the four-time points, among which GLYMA_03G130600 regulates transcription factor ORG3, which is related to plant growth. GO analysis revealed a total of annotated 4018 DEGs, among which the terms plasma membrane, extracellular, enzyme activity, ion transport metabolic process and oxidoreductase activity were significantly enriched at the four time points, which might hinder the growth of soybean and accelerate senescence. KEGG analysis showed that at level 1, the DEGs were mainly enriched in photosynthesis-related, phenylpropanoid biosynthesis, nitrogen metabolism and plant hormone signal transduction. At level 2 of secondary metabolism, the DEGs were mainly enriched in energy metabolism and amino acid metabolism pathways, which indicates that B stresses mainly affect photosynthesis, hormone regulation and amino acid metabolism of soybean, thus affecting plant growth. The above results give deeper insight into the soybean response to B deficiency and lay the foundation for further studies of the molecular mechanism of soybean response to boron deficiency.
Introduction
Soybean [Glycine max (L.) Merr.] is a legume species, which originated in China and has been cultivated for more than 3,000 years. It is one of the major crops in the world. Soybeans are rich in protein and oil and can be used in animal feed and non-fermented soybean products. Edible soybeans are rich in micronutrients and phytochemicals (such as isoflavones), which are beneficial to human health [Citation1]. Due to its important role in agriculture and human nutrition, soybean production has expanded rapidly in recent years [Citation2].
Crop yields often deteriorate owing to micronutrient deficiency. This is particularly true of boron (B) deficiency, since boron is necessary in cell wall synthesis, sugar transportation, cell division, differentiation, membrane function, root elongation, plant hormone regulation, photoassimilate synthesis and transportation and nucleic acids and protein synthesis [Citation3]. The sensitive periods of soybean to boron deficiency are the seedling stage V2 and flowering stage R2 [Citation4]. The root system is the first part of the soybean plant to perceive boron deficiency, then the plants exhibit abnormal and retarded growth of apical growing points. The root nodules are few, and the leaves are thick, rough and shriveled, with purple patches, abnormal flowering and fruiting. Boron is needed in small quantities by soybean, but it is especially important for soybean growing, flower retaining and fruit setting [Citation5].
The lack of boron in cultivated land in China is very widespread. B stresses have become the main limiting factor for improving soybean yield and quality, seriously hindering the development of soybean production in main producing areas [Citation6]. With the developments of sequencing technology, high throughput technologies, such as RNA-seq, can facilitate the study of gene expression in various environments. In this study, we used RNA-seq to investigate the changes in gene expression and metabolic pathways in soybean roots under B deficiency. In addition, we measured the related physiological indexes at four different time points. Understanding the molecular basis of plant response under B deficiency will enhance the biotechnological efforts to breed crop plants with low B needs.
Materials and methods
Plant materials and growth conditions
In this study, soybean [Glycine max (L.) Merr.] Mengkedou 9 was selected as the test material. Seeds were washed and soaked in distilled water for 4 h after sterilization in 10% NaClO solution for 10 min and then were incubated at room temperature in dark between two layers of moistened filter paper [Citation7]. Four days later, seedlings were grown hydroponically in a 16-L tank filled with half-strength-modified Hoagland nutrient solution containing 2.5 mmol L−1 Ca(NO3)2, 2.5 mmol L−1 KNO3, 0.5 mmol L−1 KH2PO4, 1 mmol L−1 MgSO4, 0.045 mmol L−1 H3BO3, 0.005 mmol L−1 MnCl2·4H2O, 0.01 μmol L−1 Fe·H2O, 0.15 μmol L−1 CuSO4·5H2O, 0.4 μmol L−1 ZnSO4·H2O, 0.2 μmol L−1 Na2MoO4·2H2O, 0.01 μmol L−1 EDTA-Na2 [Citation8]. The nutrient solution was changed every 2 days. Plants were grown in a growth chamber with a photoperiod of 16/8 h light/dark at 26/22 °C and light intensity of 150 μmol m−2 s−1. After 8 days of cultivation, soybean seedlings were transferred into the control solution (with H3BO3) and B deficient solution (without H3BO3). Roots of soybean seedlings were separately sampled after 12 h, 24 h, 72 h and 8 days of incubation, then frozen in liquid nitrogen and stored at −80 °C refrigerator until RNA preparation. The controls after 12 h, 24 h, 72 h and 8 days were labelled CK1, CK2, CK3 and CK4, respectively; the B deficiency treatments after 12 h, 24 h, 72 h and 8 days were labelled T1, T2, T3 and T4, respectively. The experiment adopted a completely random design in three replicates.
Plant height, SPAD and chlorophyll fluorescence
After the soybean seedlings were treated with B deficiency stress for 12 h, 24 h, 48 h and 8 days, the plant height was measured with a ruler, respectively. The SPAD values of leaves were measured via a SPAD-502 Chlorophyll Meter (Konica Minolta, Tokyo, Japan). Chlorophyll fluorescence was measured by Handy PEA (Hansatech Instruments Pvt. Ltd, UK). The minimum chlorophyll fluorescence (Fo) and the maximum fluorescence (Fm) were obtained in the dark-adapted state, and the maximum quantum yield of PSII (Fv/Fm, where Fv = Fm-Fo) was calculated.
cDNA library construction and Illumina RNA-sequencing
Soybean roots were harvested at 12 h, 24 h, 72 h and 8 days after B deficiency or control treatment for mRNA library construction and sequencing. Total RNA was isolated using the Trizol Reagent (Invitrogen Life Technologies), after which the concentration, quality and integrity were determined using a NanoDrop spectrophotometer (Thermo Scientific). Three micrograms of RNA were used for the RNA sample preparations. Then the Sequencing libraries were generated and sequenced on NovaSeq 6000 platform (Illumina) by Shanghai Personal Biotechnology Cp. Ltd. The data are available from the NCBI database under the Accession number PRJNA881271 (https://www.ncbi.nlm.nih.gov/).
Quality control and differential expression analysis
Samples were sequenced on the platform to get image files, which were transformed by the software of the sequencing platform, and the original data in FASTQ format (Raw Data) was generated. The reference genome was Glycine_max.Glycine_max_v2.1.dna.toplevel.fa.
HTSeq (0.9.1) statistics were used to compare the Read Count values on each gene as the original expression of the gene and then used FPKM to standardize the expression. Then the differences in the expression levels of genes were analysed by DESeq (1.30.0) (|log2FoldChange| > 1, P-value <0.05).
GO and KEGG enrichment analysis
All the genes were mapped to terms in the Gene Ontology database and the numbers of differentially enriched genes were calculated in each Term. Using topGO to perform GO enrichment analysis on the differential genes, we calculated the P-value by the hypergeometric distribution method (the standard of significant enrichment was P-value <0.05), and we identified the GO term with significantly enriched DEGs to determine the main biological functions performed by DEGs. The ClusterProfiler (3.4.4) software was used to carry out the enrichment analysis of the KEGG pathway of differential genes, focusing on the significant enrichment pathway with a P-value <0.05
qRT-PCR analysis
Quantified total RNA of sufficient quality was reverse transcribed into cDNA (PrimeScript TM 1st stand cDNA Synthesis Kit) and the reaction mixture (Total RNA: 1 μg, Oligo(dT) (50 μmol L−1): 1 μg, dNTP Mix(10 mmol L−1):1 μL) was added to an ice-bath tube. Then, RNase-free dH2O was added to 10 μL, mixed well, incubated at 65 °C for 5 min and quickly cooled on an ice bath after completion. Then we added 10 μL template RNA Primer Mixture, 4 μL 5 × Reaction Buffer, 0.5 μL RNase Inhibitor (40 U μL−1), 1 μL MMLV RT (200 U μL−1) and 20 μL of the Rnase-free dH2O to a tube in an ice bath. Reactions were run at 42 °C for 30-60 min, with heating at 95 °C for 5 min to complete the reaction and store in ice.
For each target gene and housekeeping gene (Supplementary Table S1), we selected the cDNA template of the gene for the PCR reaction. The qPCR reaction system included 10 μL 2 × SYBR real-time PCR premixture, 0.4 μL PCR specific primer F, 0.4 μL PCR specific primer R, 1 μL cDNA and 20 μL Rnase-free dH2O. We prepared the PCR solution according to the qPCR reaction system and carried out the PCR reaction on the Real-time PCR machine (Supplementary Table S2). The relative gene expression level was determined using the 2−ΔΔCt method and GAPDH was used as the internal reference.
Table 1. Number of reads sequenced and mapped to soybean genome.
Data analysis
Data are mean values from three independent experiments. Statistical analysis was done in Microsoft Excel 2016. Duncan’s multiple test and analysis of variance (ANOVA) were done using SAS 9.0. The RNA-seq data were processed using the ClusterProfiler (3.4.4) software for enrichment analysis of the KEGG pathway of DEGs. Differences were considered statistically significant at the p < 0.05 level.
Results
Time-dependent physiological response of soybean to B deficiency
In order to assess the physiological responses of soybean to B deficiency, the plants were subjected to a hydroponic culture system. The results showed that the growth of soybean roots under B deficiency was slow, and the growth rate of seedlings was significantly slower than that under control conditions. At 72 h, B deficiency seedlings showed obvious development defects ().
Figure 1. Soybean seedlings under B-deficiency (without 0.045 mmol L−1 H3BO3) and B-sufficiency (with 0.045 mmol L−1 H3BO3) conditions. The seedlings were cultivated for 12 h, 24 h, 72 h and 8 days in hydroponic culture systems.
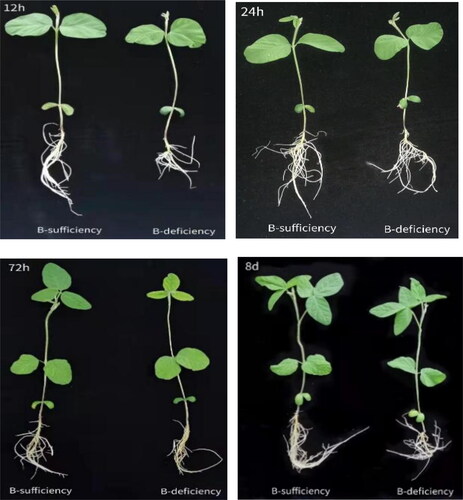
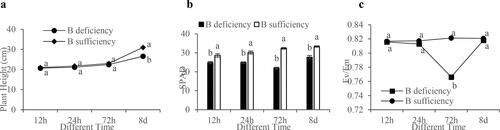
After measurement, the plant height of the seedlings with B deficiency was always lower than that of the control plants and was significantly lower at 8 days (). With the growth of seedlings, the SPAD value presented an increasing trend under the control, and the SPAD value of B deficiency plants was significantly lower than that under control conditions. The SPAD value of B deficiency plants reached the lowest level at 72 h (). The chlorophyll fluorescence measurements showed that the Fv/Fm decreased significantly at 72 h under B deficiency. Combined with the SPAD trend, this suggested that soybean at 72 h was extremely sensitive to B stresses, which significantly inhibited the photosynthesis of seedlings. The Fv/Fm increased at 8 days, which might be due to the self-regulation of plants under B deficiency, but Fv/Fm was lower than the value in the respective control at four-time points (). The results showed that the plant growth and photosynthesis of soybean seedlings would be seriously inhibited after being subjected to B stresses.
Figure 2. Physiological responses of soybean seedlings to B deficiency. (a) Plant height of soybean (cm). (b) SPAD values. (c) The Fv/Fm values of chlorophyll fluorescence. Different letters indicate significant differences at p < 0.05 according to Duncan’s multiple comparison tests.
Quality of RNA-Seq and mapping of reads
In this study, the transcriptomes of soybean seedlings under B stress at different times were sequenced using the NovaSeq 6000 platform (Illumina). By RNA-seq, after the removal of adaptor sequences and low-quality reads, on average 38354456, 42844032, 39373021 and 40975200 clean reads of CK1, CK2, CK3, CK4 and 38032058, 42031437, 41393567 and 39936916 clean reads of T1, T2, T3 and T4 were obtained respectively. For each sample, above 90% of the clean reads were mapped to the soybean reference transcriptome sequence and the Q30 percentage (sequencing error rate < 1%) was over 90.6%. These results indicated that the sequencing library was of good quality and contained sufficient information for gene expression analysis ().
Differentially expressed genes (DEGs) of soybean under B deficiency
The DEGs were filtered via DESeq with p value <0.05. The results showed that a total of 5126 DEGs were obtained, among which at 12 h, 784 DEGs were upregulated and 169 DEGs were downregulated; the number of upregulated genes was significantly higher than that of the downregulated genes. At 24 h, 376 DEGs were upregulated and 384 DEGs were downregulated; at 72 h, 352 DEGs were upregulated and 1593 DEGs were downregulated, and the number of downregulated genes was significantly higher than the upregulated genes. At 8 days, 858 DEGs were upregulated and 610 DEGs were downregulated (). Overall, at 72 h, DEGs were most frequently identified and with the most downregulated genes, indicating that most genes were inhibited at 72 h under B stress and, therefore, inhibited the growth of seedlings.
Figure 3. DEGs in soybean under B deficiency. (a) Number of DEGs at each time point. (b) Venn diagram showing the distribution of DEGs at each time point (p value <0.05). CK, control; T, B deficiency treatment; numbers 1–4 represent the four sampling time points, 12 h, 24 h, 72 h and 8 days, respectively.
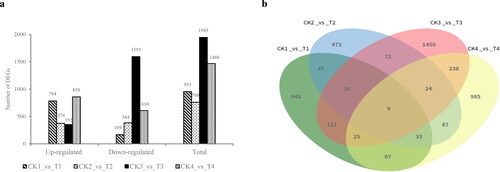
Among these DEGs, 9 DEGs were detected in common at all four-time points (). Among these 9 DEGs at the four-time points, 3 DEGs (GLYMA_03G130600, GLYMA_16G174900, GLYMA_19G132500) were related to molecular function. We speculate that B deficiency might inhibit the molecular synthesis processes in soybean plants, thus affecting the growth and development of soybean plants and the inhibition increased in a time-dependent manner.
Gene ontology (GO) annotation analysis of the DEGs
To investigate the functions of the DEGs between controls and treatments, GO enrichment analysis was conducted. According to GO function terms, a total of 4018 DEGs were annotated into the Cellular Component (CC), Molecular Functions (MF) and Biological Process (BP) terms, among which DEGs accounted for 18.64% (749/4018) DEGs in CK1_vs_T1 (12 h), 14.76% (593/4018) DEGs in CK2_vs_T2 (24 h), 38.03% (1528/4018) DEGs in CK3_vs_T3 (72 h) and 28.57% (1148/4018) DEGs in CK4_vs_T4 (8 days), respectively.
After soybean seedlings were subjected to B stresses, within Cellular Component, the DEGs at the four-time points were significantly enriched in the plasma membrane and extracellular term, which indicated that the boron deficiency had an impact on the extracellular environment and membrane stability. At different time points, DEGs were significantly enriched in the integral component of the membrane and other terms at 12 h and 72 h (). At 24 h, there was significant enrichment in photosystem, thylakoid and other terms, which indicated that B deficiency might affect the photosynthesis of plants (). At 8 days, there was significant enrichment in terms such as cell wall, apoplast and other terms ().
Figure 4. Gene ontology (GO) classifications of DEGs at 12 h (a), 24 h (b), 72 h (c) and 8 days (d), respectively, after B stresses. All GO terms shown were significant at p value <0.05.
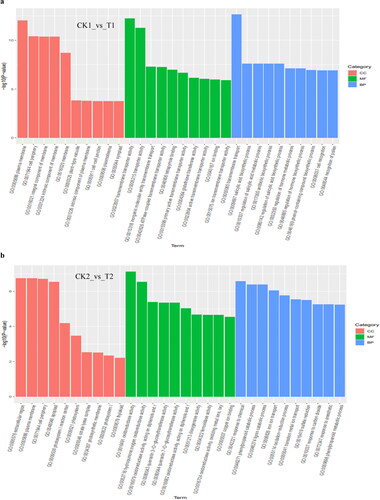
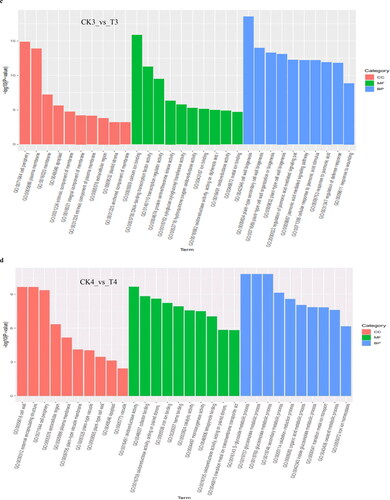
Among the Molecular Functions, at 12 h, the DEGs were significantly enriched in terms of transporter activity, glutathione transferase activity, ion binding and others (); at 24 h, DEGs were significantly enriched in oxidoreductase activity, dioxygenase activity, copper ion binding and other terms (); at 72 h, DEGs were significantly enriched in calcium ion binding, protein serine/threonine kinase activity, metal ion binding and other terms (); at 8 days, DEGs were significantly enriched in oxidoreductase activity, iron ion binding and others (). At the four time points, the DEGs were significantly enriched in enzyme activity and ion transport terms, which indicated that B stresses had an impact on plant metabolism, which might accelerate plant senescence. Boron deficiency might also have an impact on the transportation and combination of other ions.
Among the biological process, at 12 h, the DEGs were significantly enriched in the regulation of the hormone metabolic process, salicylic acid biosynthesis process, antibiotic biosynthetic process, recognition of pollen and other terms. Hormones are very important to the growth and development of plants, and salicylic acid can regulate plant stress-resistance genes (). At 24 h, DEGs were enriched in the lignin catabolism process, iron ion transport, oxidation-reduction process, response to carbon dioxide and other terms, among which lignin is closely related to plant resistance, and carbon dioxide is related to plant photosynthesis, indicating that B deficiency might affect plant photosynthesis (). At 72 h, DEGs were significantly enriched in cell wall biogenesis, regulation of jasmonic acid mediated signalling pathway, regulation of defence response, response to wounding and other terms. Jasmonic acid and its derivatives are plant growth substances closely related to resistance (). At 8 days, DEGs were significantly enriched in the S-glycoside metabolism process, oxidation-reduction process, organic acid metabolism process, secondary metabolism process, transition metal ion transport, iron ion homeostasis and other terms. Secondary metabolites played an important role in the relationship between plants and ecological environment, among which glycosides also belong to secondary metabolites (). Among them, DEGs involved in the metabolic process were characterized by a high ratio at the four time points, which indicated that plants suffer from B deficiency, and this would affect the metabolic processes and might hinder the growth and development of plants and their response to the abiotic stress in the environment.
Pathway analysis of the DEGs
Pathway-based analysis was performed using the Kyoto Encyclopedia of Genes and Genomes (KEGG) pathway database. The results showed that 177, 157, 377 and 337 DEGs from the total 1048 annotated DEGs were classified into 66, 63, 88 and 80 KEGG pathways at 12 h, 24 h, 72 h and 8 days, respectively. The top 20 KEGG pathways at four-time points were depicted as shown in . In the KEGG pathway analysis, the DEGs at 12 h were mainly enriched in the pathways of ABC transporters, photosynthesis-antenna proteins, carotenoid biosynthesis and flavonoid biosynthesis pathway (). The DEGs at 24 h were mainly enriched in photosynthesis, plant hormone signal transduction, glycine, serine and threonine metabolism and carbon fixation in photosynthetic organizations (). The DEGs at 72 h were mainly enriched in carbon fixation in photosynthetic organizations, MAPK signalling pathway-plant, plant hormone signal transduction, phenylalanine, tyrosinase and tryptophan biosynthesis and photosynthesis (). At 8 days, the DEGs were mainly enriched in the pathway of glycine, serine and threonine metabolism, isoflavonoid biosynthesis, carbon fixation in photosynthetic organisms, ascorbate and aldarate metabolism ().
Figure 5. Top 20 KEGG pathway enrichment analysis of annotated DEGs after B deficiency at 12 h (a), 24 h (b), 72 h (c) and 8 days (d) in soybean. Solid circles show the number of expressed genes.
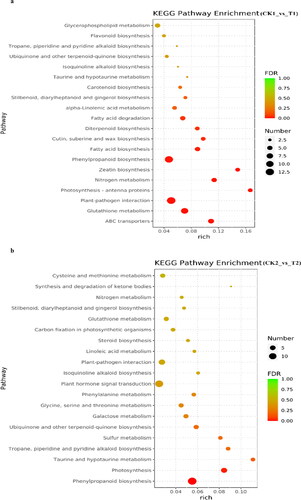
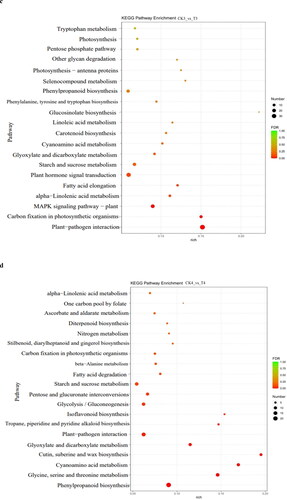
In the top 20 KEGG level 1, photosynthesis-related pathways were significantly enriched in four time points. Among them, at 24 h, 72 h and 8 days, the DEGs of the pathway of carbon fixation in photosynthetic organisms were significantly downregulated, including that regulating phosphoenolpyruvate carboxylase (PEPCase). PEPCase is related to plant carbon fixation in the dark reaction of photosynthesis. The pathways of phenylpropanoid biosynthesis, nitrogen metabolism and alpha-linolenic acid metabolism were significantly enriched at three time points, at 12 h, 24 h and 8 days. The pathway of plant hormone signal transduction was significantly enriched at 24 h and 72 h. The secondary metabolism of top 20 KEGG level 2 at the four time points included energy metabolism and amino acid metabolism. It showed that B deficiency in soybean mainly affected photosynthesis and the synthesis and metabolism of some amino acids. And then, phenylpropane biosynthesis, nitrogen metabolism, alpha-linolenic acid metabolism and plant hormone signal transduction were also the main enrichment pathways.
Analysis of DEGs by qRT-PCR
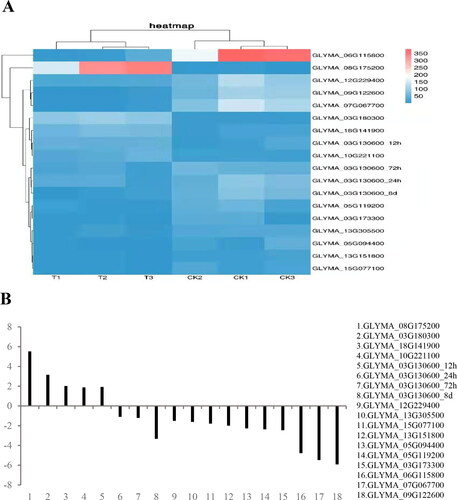
The quantitative real-time-PCR (qRT-PCR) technology was used to verify the credibility of the RNA-Seq. A total of 18 DEGs selected from the four time points were verified by qRT-PCR. In the heat map, 5 DEGs were significantly upregulated, and 13 DEGs were significantly downregulated (); the qRT-PCR expression patterns of the 18 DEGs were all consistent with the RNA-Seq results (), which indicated that the RNA-Seq results were reliable in this study.
Figure 6. ( A) Performance of FPKM values of 15 DEGs determined from the RNA-seq; (B) Expression of 18 DEGs in qRT-PCR.
Discussion
Soybean is an important grain and oil crop in the world. In recent years, boron stress has seriously hindered the growth of soybean plants. However, the adaptive mechanism of soybean boron deficiency has not been studied. Therefore, it is of great significance to explore the DEGs related to boron deficiency and to further reveal the adaptive mechanism of plants to boron deficiency.
In this study, 24 root samples of soybean with control and B deficiency at four time points were used for RNA-seq analysis to explore the DEGs and related metabolic pathways in soybean roots in response to B deficiency. The Q30 of 24 samples was higher than 90.6%, which was highly referential. Among them, 953, 760, 1945 and 1468 DEGs were obtained at 12 h, 24 h, 72 h and 8 days, respectively, and the DEGs increased significantly at 72 h, which indicated that soybean was most sensitive to B deficiency in this period. According to Venn analysis, there were 9 common DEGs at four-time points. GLYMA_03G130600 regulated transcription factor ORG3, which was significantly upregulated at 12 h, and significantly downregulated at 24 h, 72 h and 8 days. A similar gene was reported to negatively regulate Arabidopsis leaf growth by controlling ORG3 [Citation9], which indicated that this transcription factor was related to plant growth. In this study, the plant height of seedlings under B deficiency was significantly lower than that under control conditions at the four time points. The study of boron and zinc deficiency in soybean roots, leaves and seeds also showed that plant growth was often reduced at the high and low doses of B and Zn. Without B, plants stopped growing and died within a month after sowing [Citation10]. Our study was consistent with these results, indicating that B stresses would affect the growth of plants, and the TF ORG3 in soybean should be further studied in the future.
The morphological and physio-biochemical disorders caused by B stresses could result from oxidative damages [Citation11–14]. In this study, the GO analysis at 24 h, 72 h and 8 days after B deficiency, there were DEGs enriched in some terms that related to the oxidation-reduction process, similar to the results of previous experiments. Some plant genotypes might respond differentially to deficiency or excess of B. In potato plants, for example, increased B levels were associated with reduced Ca levels in plantlets in one but not another cultivar [Citation15, Citation16]. A study on boron deficiencies and their interactions with other nutrients in soybean roots, leaves and seeds showed that B stresses in soybean had little effect on Fe transport [Citation10]. However, the results of this study showed that B deficiency would affect the transport of metal ions, especially the transport of Fe. At 24 h and 8 days, the enrichment analysis revealed different genes involved in metal ion transport, and there were DEGs related to Fe transport at the four time points, for example, GLYMA_09G122600 (12 h and 8 days), GLYMA_02G262500 (24 h) and GLYMA_02G082500 (72 h). This might be attributed to different soybean varieties having different responses to B stresses.
It is common for an imbalance in one nutrient to affect other nutrients in the plant. NRT (nitrate transporters) play an important role in the absorption of nitrogen by roots [Citation17], and boron deficiency can reduce nitrate transporter activity, thus reducing the N levels in leaves of rape, sunflower [Citation18], tobacco [Citation19] and tomato [Citation20]. The studies of boron deficiencies and their interactions with other nutrients in soybean roots, leaves and seeds suggested that lower N levels occurred in leaf tissues of B-deficient plants. In this study, different genes in nitrogen metabolism pathway were significantly enriched at 12 h, 72 h and 8 days, NRT was significantly upregulated at 12 h and 8 days, and significantly downregulated at 72 h, which indicated that in the early and late stage of B deficiency, plants might alleviate boron deficiency by absorbing nitrogen to maintain plant growth, while at 72 h, B deficiency had the greatest influence on plants, possibly inhibiting nitrogen absorption. Consistent with the previous study, B stresses would affect nitrogen absorption, but different crops, stress times and positions cause different responses to B stresses.
Plant hormones play key roles in plant growth and abiotic and biotic stresses. Genes related to plant hormone signal transduction were reported in adaptation to environmental stress, such as maize (Zea mays) ZmPIF3 under drought stress [Citation21], OsJAZ8 under salt stress [Citation22], Arabidopsis TGA2/5/6 in antioxidant or detoxifying response to abiotic stress [Citation23], wheat (Triticum aestivum) TaERF3 under salt and drought stresses [Citation24]. In this study, at 12 h and 72 h, the DEGs were significantly enriched in the plant hormone signal transduction pathway, and at 8 days, the ethylene response transcription factor was significantly upregulated. Transcriptome profiles of soybean leaves and roots in response to zinc deficiency showed that the hormones such as auxin, cytokinin, ethylene, gibberellin and polyamine might participate in the reaction of zinc deficiency in soybean and ethylene response transcription factors were also mentioned [Citation25]. In addition, the NPR1 and TGA family genes were identified at 12 h in this study; EBF, ERF and JAZ family genes were identified at 24 h; JAR, JAZ, MYC and ERF family genes were identified at 72 h and ERF, JAZ family genes were identified at 8 days, indicating that the above gene families were involved in plant hormone signal transduction pathways in response to B stress, especially the JAZ family.
Studies in rape seedlings [Citation26], Arabidopsis thaliana [Citation13] and Citrus reticulata blanco [Citation12] showed that photosynthetic pigments decreased significantly under B deficiency, and the transcriptomics study of rape response to different boron availability found that boron stress would increase the specific leaf weight of rape, which might be caused by the inhibition of photosynthesis. Hao et al. [Citation27] showed that spraying KHCO3 on soybean leaves could increase the PEPCase activity and promote the photosynthetic rate and photosynthetic product accumulation. The research of Siqin et al. [Citation28] showed that spraying NaHSO3 and KHCO3 on beet leaves could significantly improve the PEPCase activity and net photosynthetic rate. In this study, at 72 h, compared with the control, the seedlings under B deficiency withered obviously. In GO analysis, at 24 h, the DEGs were significantly enriched in the response to carbon dioxide, and the DEGs in this term were all significantly downregulated. Excessive accumulation of carbohydrates would reduce the photosynthetic capacity of leaves. In KEGG, the DEGs were significantly enriched in the photosynthesis-related pathways at four-time points, among which, the pathway of carbon fixation in photosynthetic organisms, the DEGs regulating PEPCase were significantly downregulated at 24 h, 72 h and 8 days, indicating that long-term boron deficiency would inhibit the plant photosynthesis. In the future, research can focus on the downregulation mechanism of PEPCase.
Conclusions
The results showed that the plant height, SPAD and chlorophyll fluorescence (Fv/Fm) of soybean seedlings after 12 h, 24 h, 72 h and 8 days under B deficiency were significantly lower than those of their respective controls, and at 72 h, the seedlings were the most sensitive. B stresses significantly inhibited plant growth and photosynthesis. According to RNA-seq, among the four-time points, the most DEGs appeared at 72 h, reaching the number of 1945, followed by 1468 DEGs at 8 days. GLYMA_03G130600 was significantly expressed at the four time points, regulating transcription factor ORG3, which can be further studied. In GO analysis, DEGs were mainly concentrated in enzyme activity, ion transport metabolic process and oxidoreductase activity, and boron deficiency would affect Fe transport. In KEGG analysis, at level 1, DEGs were mainly concentrated in photosynthesis-related, nitrogen metabolism, plant hormone signal transduction terms, while at level 2 of secondary metabolism, the genes were mainly concentrated in the energy metabolism and amino acid metabolism pathways. In the pathway of carbon fixation in photosynthetic organisms, the DEGs regulating PEPCase activity were significantly downregulated at 24 h, 72 h and 8 days, which hindered CO2 fixation, thereby reducing the photosynthetic rate of soybean leaves. In the plant hormone signal transduction, the JAZ family was differentially expressed at four-time points. Our results would provide comprehensive insights into the mRNA transcriptome of B stresses in soybean and enrich our understanding of the molecular mechanisms of plant responses to B deficiency.
Supplemental Material
Download MS Word (30.9 KB)Data availability statement
The data that support the findings of this study are available from the corresponding authors, Li, Q., Su, E. H. and Fan, L., upon reasonable request.
Disclosure statement
The authors declare that they have no conflict of interest.
Additional information
Funding
References
- Lin H, Rao J, Shi J, et al. Seed metabolomic study reveals significant metabolite variations and correlations among different soybean cultivars. J Integr Plant Biol. 2014;56(9):1–14.
- Li Y, Guan R, Liu Z, et al. Genetic structure and diversity of cultivated soybean (Glycine max (L.) merr.) landraces in China. Theor Appl Genet. 2008;117(6):857–871.
- Batista MA, Inoue TT, Esper Neto M, et al. 2018. Princípios de fertilidade do solo, adubação e nutrição mineral. In Brandão filho JUT, freitas PSL, berian LOS, goto R, editors. Maringá, Brazil: PR. Eduem. p. 113–161.
- Ross JR, Slaton NA, Kristofor R, et al. Boron fertilization influences on soybean yield and leaf and seed boron concentrations. Agron J. 2006;98(1):198–205.
- Zhang L. Effects of foliar applications of boron and dimilin on soybean yield. Mississippi agricultural and forestry experiment station. Res Rep. 2001;22(16):1–5.
- Li YY, Liu SQ, et al. Study on effect of balanced fertilization of soybean in different agricultural ecological regions of Heilongjiang province. Soybean Sci. 2015;06:1029–1038.
- Zeng HQ, Zhu YY, Huang SQ, et al. Analysis of phosphorus-deficient responsive miRNAs and cis-elements from soybean (Glycine max L.). J Plant Physiol. 2010;167(15):1289–1297.
- Zeng HQ, Wang GP, Zhang YQ, et al. Genome-wide identification of phosphate-deficiency-responsive genes in soybean roots by high-throughput sequencing. Plant Soil. 2016;398(1-2):207–227.
- Omidbakhshfard MA, Fujikura U, Jadwiga Olas J, et al. Growth-regulating factor 9 negatively regulates arabidopsis leaf growth by controlling ORG3 and restricting cell proliferation in leaf primordia. PLoS Genet. 2018;14(7):e1007484.
- Pawlowski ML, Helfenstein J, Frossard E, et al. Boron and zinc deficiencies and toxicities and their interactions with other nutrients in soybean roots, leaves, and seeds. J Plant Nutr. 2019;42(6):634–649.
- Camacho-Cristóbal JJ, Martín-Rejano EM, Herrera-Rodríguez MB, et al. Boron deficiency inhibits root cell elongation via an ethylene/auxin/ROS-dependent pathway in arabidopsis seedlings. J Exp Bot. 2015;66(13):3831–3840.
- Han S, Chen LS, Jiang HX, et al. Boron deficiency decreases growth and photosynthesis, and increases starch and hexoses in leaves of citrus seedlings. J Plant Physiol. 2008;165(13):1331–1341.
- Kayıhan DS, Kayıhan C, Çiftçi YÖ. Excess boron responsive regulations of antioxidative mechanism at physiobiochemical and molecular levels in Arabidopsis thaliana. Plant Physiol Biochem. 2016;109:337–345.
- Oiwa Y, Kitayama K, Kobayashi M, et al. Boron deprivation immediately causes cell death in growing roots of Arabidopsis thaliana (L). Soil Sci Plant Nutr. 2013;59(4):621–627.)
- Abdulnour JE, Donnelly DJ, Barthakur NN. The effect of boron on calcium uptake and growth in micropropagated potato plantlets. Potato Res. 2000;43(3):287–295.
- Wang H, Wang Y, Du C, et al. Effects of boron and calcium supply on calcium fractionation in plants and suspension cells of rape cultivars with different boron efficiency. J Plant Nutr. 2003;26(4):789–806.
- Bo W, Xing M, Yuchen G, et al. Research advance of NRTgene on nitrogen use efficiency. Northern Hortic. 2014;(20):198–202. 1001-0009 (2014) 20-0198-05.
- Kastori R, Petrovic N. Effect of boron on nitrate reductase activity in young sunflower plants. J Plant Nutr. 1989;12(5):621–632.
- Camacho-Cristobal JJ, Gonzalez-Fontes A. Boron deficiency decreases plasmalemma Hþ-ATPase expression and nitrate uptake, and promotes ammonium assimilation into asparagine in tobacco roots. Planta. 2007;226(2):443–451.
- Ramon AM, Ruiz ROC, Garate A. In vitro stabilization and distribution of nitrate reductase in tomato plants. Incidence of boron deficiency. J Plant Physiol. 1989;135(1):126–128.
- Gao Y, Wu M, Zhang M, et al. Roles of a maize phytochrome-interacting factors protein ZmPIF3 in regulation of drought stress responses by controlling stomatal closure in transgenic rice without yield penalty. Plant Mol Biol. 2018;97(4-5):311–323.
- Peethambaran PK, Glenz R, Höninger S, et al. Salt-inducible expression of OsJAZ8 improves resilience against salt-stress. BMC Plant Biol. 2018;18(1):311.
- Herrera-Vásquez A, Fonseca A, Ugalde JM, et al. TGA class II transcription factors are essential to restrict oxidative stress in response to UV-B stress in arabidopsis. J Exp Bot. 2021;72(5):1891–1905.
- Rong W, Qi L, Wang A, et al. The ERF transcription factor TaERF3 promotes tolerance to salt and drought stresses in wheat. Plant Biotechnol J. 2014;12(4):468–479.
- Zeng H, Zhang X, Ding M, et al. Transcriptome profiles of soybean leaves and roots in response to zinc deficiency. Physiol Plant. 2019;167(3):330–351.
- Hua Y, Feng Y, Ting Z, et al. Genome-scale mRNA transcriptomic insights into the responses of oilseed rape (Brassica napus L.) to varying boron availabilities. Plant Soil. 2017;416(1-2):205–225.
- Jianjun H, Changhai Y, Han W, et al. Effect of KHCO3 on photosynthesis of soybean seedlings. Plant Physiol J. 2008;44(4):723–725.
- Qin S, Lei W, Zihua T, et al. The effects of sodium bisulfite and potassium bicarbonate on the photosynthesis yield and sugar content of sugar beet (Beta vulgaris L.). Acta Agric Bor-Sin. 2010;25(3):212–216.