
 ?Mathematical formulae have been encoded as MathML and are displayed in this HTML version using MathJax in order to improve their display. Uncheck the box to turn MathJax off. This feature requires Javascript. Click on a formula to zoom.
Abstract
This study aimed to enhance the production of the intracellular L-asparaginase bacterial enzyme, which is known to impede the growth of cancer cells, by optimizing the culture conditions. In the present study, we exploited the ability of a new Actinomycete strain isolated from a food byproduct, wheat bran, to produce the desired enzyme. Streptomyces paulus CA01 was identified following morphological, biochemical, and molecular testing, and its total L-asparaginase activity was evaluated using ADS agar. Intracellular L-asparaginase activity was measured on the same medium using the well-diffusion method and was quantified by Nesslerization. A Box-Behnken design was employed to optimize the production of the enzyme by analyzing the effect of three factors: temperature, L-Asparagine concentration and glucose concentration. The ADS base medium, which was previously optimized and consisted of starch, K2HPO4, and MgSO4, was also included in the analysis. The optimal conditions for intracellular L-asparaginase production were temperature of 27.5 °C, L-Asparagine concentration of 1.19%, glucose concentration of 0.26% and ADS base medium composition, with which we achieved an incrase in enzymatic activity from 3.20 IU/mL to 8.39 IU/mL. This study indicates that Algerian wheat bran is a potential source of Streptomyces paulus CA01, which produces the bacterial intracellular L-asparaginase enzyme and also opens up prospects for the exploitation of agricultural by-products as sources of interesting micro-organisms. Despite the complex process of cell lysis required for its production, intracellular L-asparaginase is important and depends on culture conditions, making its optimization and increased yield feasible.
Introduction
L-Asparaginase (LA), an enzyme also known as L-Asparagine amidohydrolase (EC.3.5.1.1), has been proven to be effective in treating acute lymphoid leukemia. Cancerous lymphocytes require L-Asparagine for their growth and protein synthesis, which is usually obtained from the blood plasma, as they are unable to produce their own L-Asparagine. L-Asparaginase acts on the depletion of L-Asparagine from the medium, leading to its decrease in peripheral blood and bone marrow [Citation1], which thus causes the inhibition of cancerous lymphocyte proliferation [Citation2]. In contrast to healthy cells, cancerous lymphocytes are more sensitive to the depletion of L-Asparagine, because of their inability to synthetize the enzyme L-Asparagine synthetase [Citation1]. Besides its application in the medical field, L-Asparaginase is also used in the agri-food industry to prevent the formation of acrylamide, a carcinogenic compound formed at high-temperature in the food industry [Citation3].
The increasing use of L-asparaginase in leukemia treatment has led to the search for more efficient molecules to reduce side effects [Citation4]. This has made L-Asparaginase an essential compound in microbial biotechnology [Citation5]. Currently, most researchers are interested in the microbial sources of this enzyme because of its specific activity and easy production. Bacteria are the most widely studied and applied source of L-asparaginase, with better production yields due to their ease of cultivation [Citation6]. Actinomycetes are an excellent source of L-Asparaginase due to their ability to degrade biological compounds [Citation7]. However, the physicochemical conditions of a bacterial culture strongly influence the production of L-Asparaginase. To optimize the production of the enzyme, a statistical procedure based on the response surface methodology can be applied, considering the effect of different factors and their interaction on the enzyme production [Citation8].
Usually, researchers realize the screening of enzyme activity by using crude extract such as a supernatant of culture. For the same strain studied in the present work, we previously focused on the extracellular L-asparaginase activity, for which we optimized its production using the same procedures [Citation9]. Here, we focused on the intracellular LA enzyme and applied the same optimization approach, using the intracellular protein fraction after cell lysis of the newly isolated and identified strain Streptomyces paulus CA01.
Materials and methods
Isolation of the bacterial strain
The CA01 actinomycete strain used in the study was isolated from tender wheat bran collected from Algeria [Citation9], using the decimal dilution method up to 10−3 [Citation7]. The isolation was carried out on ISP2 agar supplemented with Nalidixic acid (Sigma Aldreich) (100 µg/mL) and Nystatin (Fluka) (50 µg/mL) to prevent the growth of Gram-negative bacteria and fungi, respectively [Citation10]. The culture was incubated at 28 °C for 7 days [Citation11,Citation12], and the colonies were identified based on their morphological (micromorphology was observed by CETI optical microscope equipped with a camera at G100) and biochemical characteristics using a mini biochemical gallery, prior to molecular analysis.
Molecular study
To identify our strain, molecular identification was performed by sequencing the 16S rRNA gene (BIOFIDAL laboratory, Lyon, France) using the Sanger method [Citation13]. RNA was extracted using the Omega Biotech Mag-Bind Universal Pathogen Kit, followed by PCR amplification of the 16S rRNA gene using the universal primers 16S-27f and 16S-1492r. The following primers were used for sequencing the PCR products: 16S-27f, 16S-515f, 16S-805r, and 16S-1492r. The sequences were analyzed and aligned to create a 1460 bp contig corresponding to the complete 16S rDNA sequence. To identify the strain, we used the PBIL (BiBi) database of UCBL1 and performed a BLAST search (Biofidal laboratory, Lyon, France). The amplification products were purified with ExoSap-lt and then sequenced using the BigDyeV3.1 Dye Terminator Kit (Thermo Fisher Scientific). Analysis was performed in a sequencer of 96 capillaries (ABI3730XL). Finally, we aligned the sequences with CHROMAS Pro software to create the contig of the complete 16S rRNA gene.
Detection of total L-asparaginase activity
The production of LA by the bacterial strain was demonstrated by culturing it on Asparagine Dextrose Salt agar (ADS) [Citation14]. ADS agar contains L-Asparagine as the sole source of nitrogen [Citation15], and its chemical composition in g/L is as follows: L-Asparagine (Biochem-Chemopharma) 10; D-Glucose 2; K2HPO4 0.5; MgSO4, 7H2O 0.1; Phenol Red 0.09 [Citation16]. The culture was incubated at 28 °C for 7 days, and the presence of phenol red in the medium allowed the observation of areas of yellow to pink agar color around the bacterial colonies [Citation17]. This color change indicated the alkalinization of the medium, which resulted from the ammonia produced by the hydrolysis of L-Asparagine.
Cell lysis and recovery of the intracellular protein fraction
After culturing the selected strain (100 μL of inoculum at 107 CFU/mL) in 100 mL of modified ADS broth prepared in a flask of 250 mL, at 28 °C, for 10 days using the shake-flask mode of culture [Citation10], cell lysis was performed using a modified protocol of Anderson and McKay [Citation18] to recover the active enzyme fraction. The bacterial culture was first centrifuged at 10000 g (Sigma 4–16K) for 30 min at +4 °C, and the cell pellet was washed three times with physiological water before resuspending in 200 µL of solution 1, which contained 6.7% sucrose, 50 mmol/L Tris, and 1 mmol/L EDTA at pH 8. The suspension was heated (MEMMERT) to 37 °C for 1 h, and then 100 µL of solution 2 containing 25 mg of lysozyme per mL of Tris 25 mmol/L at pH 8 was added, and the whole mixture was incubated at 37 °C for 20 min. Subsequently, solutions 3 (40 µL of EDTA 0.25 mol/L in Tris 50 mmol/L, pH 8) and 4 (20 µL of SDS 20% (m/v) in Tris 50 mmol/L, pH 8) were added. The mixture was immediately vortexed (BIOBLOCK SCIENTIFIC TOP-MIX 94323) and incubated for 20 min at 37 °C to complete the lysis. However, cell lysis was optimized according to the principle of Aly et al. [Citation11] by a 50 Hz sonication process (JP031S. 50 Hz) for 1 h. The crude intracellular fraction recovered in the supernatant after centrifugation at 15000 g for 30 min at +4 °C [Citation18] was filtered (VIVASCIENCE MWCO 10.000) through a 10 kDa filter, aliquoted, and frozen at −80 °C. This fraction was used as a crude enzyme extract for the rest of the work.
Detection of intracellular L-Asparaginase activity
The intracellular LA activity was detected using modified protocol of the well-diffusion method, as described by Jain et al. [Citation19]. For this, the crude enzyme extract was neutralized to pH 7 and 70 µL was added to a well in an ADS agar medium containing phenol red as a pH indicator. A negative control well was also included, filled with 70 µL of unseeded ADS broth [Citation20,Citation21]. A positive result was observed if the area around the well filled with the enzyme extract turned from yellow to pink, indicating LA activity, whereas the negative control showed no color change.
Quantification of L-asparaginase activity
To determine LA activity, the Nessler reagent-based detection method was used. In this method, 0.2 mL of the crude enzyme extract was mixed with 0.9 mL of substrate solution (L-Asparagine, 0.04 mol/L in Tris/HCl 0.5 mol/L, pH 7.2), and incubated at 37 °C for 30 min. The reaction was stopped by adding 1.5 mol/L trichloroacetic acids, and 0.2 mL of the mixture was added to 1 mL of distilled water. Next, 0.5 mL of Nessler’s reagent A (Merck- 1.09011) was added, and the reaction mixture is incubated at room temperature for 15 min. The absorbance was measured at 450 nm using spectrophotometry (Medline MD-1105 U.K.). For the negative control, the same reaction mixture was used, but the crude extract was replaced with unseeded ADS broth (Asparagin Dextrose Broth). The enzyme activity is expressed in IU, where 1 IU is the amount of enzyme that releases 1 µmol of ammonia per milliliter per minute. The enzyme activity was calculated using a calibration curve plotted using known ammonium sulfate solutions as a source of ammonia. The protocol used for this method is based on the procedures described by Meena [Citation16] and Deshpande et al. [Citation22].
Optimization of L-Asparaginase production
The Box-Behnken Design was used to study the effects of temperature (T), substrate concentration ((L-Asparagine, 0.04 mol/L in Tris/HCl 0.5 mol/L, pH 7.2: SC) and glucose concentration (GC), and the response measured was the intracellular LA activity produced. The design involved creating a matrix of 15 experiments, with 12 combinations of limit points and 3 points at the center. The limit points were −1 and +1, representing the low and high levels of each variable, and the center point was 0.0, representing the average level of each variable.
The intervals used for the variables were T (25, 30 °C), SC (0.75, 1.25%), and GC (0.1, 0.3%). The software Minitab 17 deduced the points in the center based on these intervals, resulting in T (27.5 °C), SC (1%), and GC (0.2%). The matrix of experiments is shown below, in .
Table 1. Matrix of experimental design.
After conducting the experiments and measuring the response, the results were compared to the results predicted by the model obtained using ANOVA (analysis of variance) in Minitab 17, including Student’s test and Fischer’s test. The purpose of the ANOVA was to determine if there were any significant effects of the variables on the response and to identify any interactions between the variables. The results of the ANOVA can be used to optimize the culture conditions and to maximize the intracellular LA activity produced.
Results
Identification of the bacterial strain
The CA01 strain was isolated from a wheat bran sample that had been air-dried and ground, using ISP2 selective medium. Its identification was partially based on morphological features observed under a CETI optical microscope equipped with a camera at G100, as shown in . The observations revealed bilateral branching of the filamentous hyphae () and the shape of the colonies (), which appeared powdery with masses of filaments encrusted on the agar. Based on these observations, the strain was assumed to belong to genus Streptomyces, a type of actinomycete. More physiological and morphological characteristics are described in .
Figure 1. Morphology of CA01 strain observed by CETI optical microscope equipped with a camera at G100. (A) Micromorphology (B) Macromorphology.
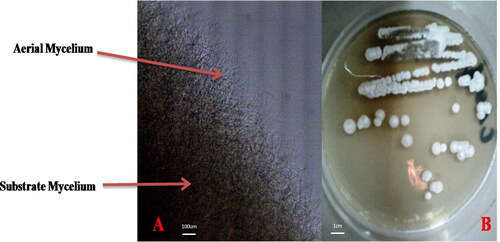
Table 2. Biochemical, physiological and morphological characteristics of the isolated CA01 strain [Citation9].
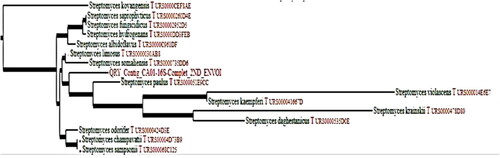
To confirm the identification, we used a molecular approach by complete sequencing of the 16S rRNA gene. After aligning the nucleotide sequence with the GenBank NBCI databases, we obtained a 100% degree of similarity with the Streptomyces genus and 100% coverage with Streptomyces paulus species. We concluded that our strain is Streptomyces paulus CA01, as shown in (accession number: SUB5247581 Contig MK574832: https://www.ncbi.nlm.nih.gov/nuccore/MK574832) [Citation9].
Figure 2. Phylogenetic tree of molecular identification after sequencing of 16s rDNAgene using Sanger method of sequencing and alignment by CHROMAS Pro software. QRY_Contig_CA01-16S-Complet_2ND_ENVOI: our studied strain.
Demonstration of total L-Asparaginase activity
The growth of strain Streptomyces paulus CA01 on ADS medium resulted in a color shift from yellow to pink around the bacterial colonies, indicating the degradation of L-Asparagine, which is the sole nitrogen source available. This color change is due to the alkalization of the medium resulting from the production of ammonia after the hydrolysis of L-Asparagine, catalyzed by the biological catalyst LA [Citation23,Citation24]. It is likely that our strain CA01 produced LA intracellularly under the experimental conditions of this study, as indicated by the color shift observed. This approach was also used by Bakeer et al. [Citation25] who characterized the L-asparaginase from marine bacteria.
Highlighting intracellular L-Asparaginase activity on solid media
In the previous step, we identified the potential production of L-asparaginase (LA) by our strain. This can occur through two scenarios: either the enzyme is secreted into the extracellular medium, where it degrades L-Asparagine to produce ammonia, or the bacterial cell absorbs L-Asparagine, which is degraded by an intracellular ammonia-releasing LA that is subsequently secreted into the culture medium. In both cases, ammonia is produced, leading to the alkalinization of the medium and a pink shift. However, we were particularly interested in intracellular LA in our study, as it is rarely studied. To investigate this, we utilized the well diffusion method following the protocol established by Anderson and McKay [Citation18] to bring the intracellular protein fraction into contact with L-Asparagine substrate.
Our results, shown in , revealed the appearance of a pink shift in the agar well where we deposited the extract corresponding to the intracellular protein fraction, unlike the negative control. This approach of well diffusion has also been employed by Jain et al. [Citation19] to screening and highlight the production of intracellular LA by E. coli VRY-14. To determine the enzymatic activity of LA in the intracellular protein fraction, we used the Nessler reagent, which assays ammonia in the reaction medium [Citation26]. The appearance of an orange-yellow precipitate in the tube containing the intracellular protein extract, unlike the control tube (C), indicates the formation of an ammoniobasic mercuric iodide chemical complex between the Nessler reagent (composed of potassium iodide KI and mercuric iodide HgI2 in a basic medium containing NaOH) and NH3 ammonia.
(1)
(1)
Figure 3. Illustration of the L-Asparaginase activity of intracellular protein fraction of Streptomyces paulus CA01 strain, demonstrated by the diffusion on wells approach. C: Negative control: sterile ADS medium; I: intracellular protein fraction of Streptomyces paulus CA01strain.
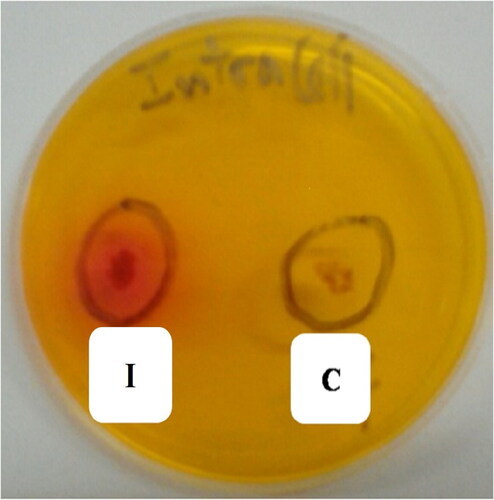
The source of ammonia in the experiment is the hydrolysis of L-Asparagine by LA. Therefore, we can assume that the presence of intracellular LA, which is our target enzyme, in the protein fraction obtained from lysed CA01 cells supports our initial hypothesis.
Optimization of intracellular L-Asparaginase production
The results obtained from the experiment based on the matrix generated by the Minitab 17 software are shown in . The table presents the average LA activity values associated with the three selected factors.
In this study, each effect in the analysis of variance is represented by a factor and a quadratic model was analyzed. This model includes the effects, the squares of the effects, and the quadratic interaction (two-by-two) of the effects. The equation of the quadratic model represents the relationship between these variables and the response (LA activity).
(2)
(2)
The equation of the quadratic model represents the relationship between the coded factor (x) and the predicted response in actual value (Y), with a0 being the intercept term, ai representing the linear effect, aii the squared effect, and aij the interaction effect. presents the effects of coded factors and their combinations, on the response variation after ANOVA test.
Table 3. Coded coefficients for transformed response.
The significance of our model, which represents the LA activity in response to the chosen variables, was evaluated by R2. An adjusted R2 (Adj-R2) of 0.9850 indicates that our model was highly representative and with high level of precision, while an R2 value of 0.9947 indicates a strong correlation between the experimental and predicted values. This means that 99.47% of the variability in the response is explained by the selected factors, with only 0.53% of the variation influenced by unstudied factors. The coefficients of the model determine the significance of the variables, with a P-value of less than 0.05 indicating significance. Based on and , the following factors and combinations of factors had significant effects on LA activity: T, SC, GC, T2, SC2, GC2 and T × SC, as determined by the Student’s t-test. This was in accordance with the findings of Akhnazarova and Kafarov [Citation27].
Table 4. Analysis of variance for transformed response.
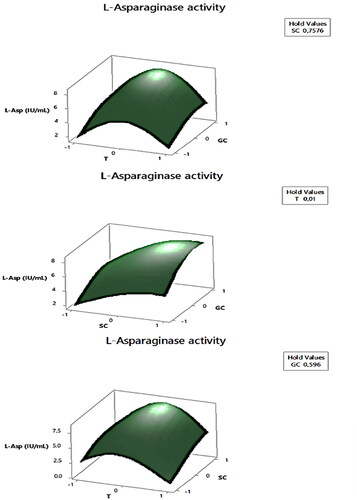
The results of the Fischer test and effects indicate that the substrate concentration (SC) was the most significant factor in the production of LA (F-value of 200.76 and effect of 1.031), followed by the glucose concentration (GC) (F-value of 149.60 and effect of 1.13). Temperature had a negative influence (F-value of 17.08 and effect of −0.38), but the temperature square (T × T) had a significant positive effect (F-value of 482.20). These results suggest that increasing the levels of substrate and glucose within the studied ranges led to a significant increase in LA production, while increasing temperature resulted in a decrease. The interaction between temperature and substrate concentration (T and SC) also had a significant effect on enzyme production (F-value of 19.22 and effect of 0.57), indicating that the influence of L-Asparagine concentration on LA production is temperature-dependent. shows the graphic variations of the studied factors and their influence on the response, demonstrating the surface response of enzyme production. Based on the linear effects, we can conclude that high concentrations of L-Asparagine induce high production of LA at low temperatures within the studied range.
Figure 4. Surface plot illustration of the effect of interaction of the selected factors (T, temperature; SC, substrate concentration; GC, glucose concentration) on the L-asparaginase production by Streptomyces paulus CA01 using Minitab 17 software.
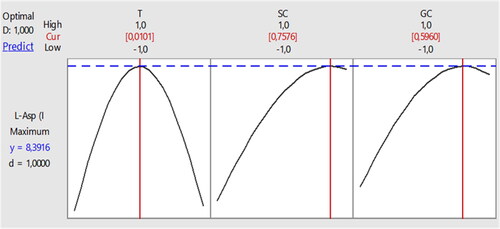
On the other hand, illustrates the optimal values for the studied factors.
Figure 5. Optimization of the intracellular L-Asparaginase production by the Streptomyces paulus CA01 strain.
T: temperature; SC: Substrate concentration; GC: Glucose concentration.
Note: The equation of the coded values of the model is:
(3)
(3)
Verification (validation) of the model
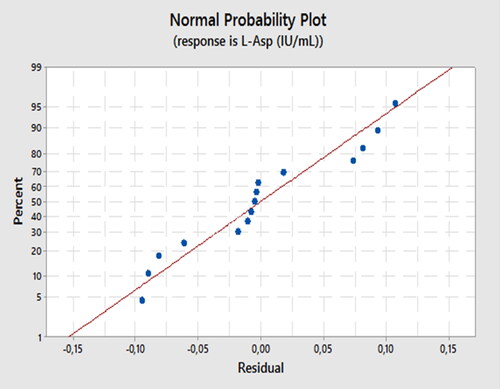
Experimental verification confirmed the validity of our model. When utilizing the optimal conditions predicted by our model, we were able to achieve an LA activity of 8.21 IU/mL, which closely aligns with the maximum LA activity value (as presented in ), with a validation factor of 97.85%. This outcome further strengthens the importance of our model. Additionally, showcases the linearity of our modeling methodology, as all response points are situated within the linear plot of the model.
Figure 6. Normal plot for the experimental response.
Discussion
Optimization of L-asparaginase production by microbial strains is used for the purpose of increasing the yield of enzymatic activity which is very important in its applications as a chemotherapeutic agent for treatment of a variety of lymphoproliferative disorders and lymphomas [Citation28], different forms of leukemia: acute myelocytic leukemia; acute myelomonocytic leukemia and acute lymphocytic leukemia [Citation4]. After culture under the optimal conditions, we obtained a higher enzymatic activity than with the start culture conditions, achieving an increase from 3.20 IU/mL to 8.39 IU/mL. In this context, Ghosh et al. [Citation29] reported an optimization procedure for L-asparaginase production by Serratia marcescens, after which they obtained 5.86 IU/g. This same research team specified that optimization procedure focuses on the study of fermentation process conditions including temperature, carbon and nitrogen sources.
It is evident from the literature that the optimal production temperature of LA varies greatly depending on the producing strain. In the case of the CA01 strain, the maximum enzymatic activity was obtained at 27.5 °C, which is close to its growth temperature optimum. This result is in line with the findings of Li et al. [Citation30], who reported that actinomycetes often exhibit a growth optimum at around 28 °C. However, it is important to note that this temperature may not be optimal for LA production in other bacterial strains.
Muneer et al. [Citation31] reported a microbial L-asparaginase with an optimum temperature of production ranging between 37 °C and 85 °C. Narayana et al. [Citation32] reported that Streptomyces paulus strain produces large amounts of LA at 35 °C, while Amena et al. [Citation33] obtained maximum LA activity at 40 °C in Streptomyces gulbargensis. Alrumman et al. [Citation34] obtained best LA yield using growth temperature of 37 °C for Bacillus licheniformis isolated from the Red Sea, indicating that certain growth conditions are generally optimal for enzyme production.
Therefore, it is essential to optimize the production temperature for each individual strain to maximize LA production. It is important to note that the optimal production temperature may differ from the growth temperature of the strain and may be influenced by several factors such as the type of substrate, pH and the aeration rate. Hence, it is necessary to carry out detailed optimization studies for each individual strain to achieve maximum LA production.
In our study, temperature had a negative impact on the production of the LA enzyme, with an effect of −0.38, a coefficient of −0.19 and a t-value of −4.13. This suggests that low temperatures within the studied range (25–30 °C) promote significant LA production, which is advantageous for industrial applications, as it reduces the risk of thermal denaturation of the enzyme [Citation28]. Gosh et al. [Citation29] reported also that temperature has a direct effect of increasing the LA enzyme production in the interval of optimal values, with 3.42 IU/g at 30 °C, but with an increase in temperature above this range, they obtained an opposite effect, with a decrease in the activity.
On the other hand, glucose has a significant impact on the production of LA by actinomycetes, as indicated by the high F-value of 146.60 obtained in the statistical analysis. The positive coefficient of +1.13 for glucose in the effects analysis table also indicates a favorable effect on the production of intracellular L-Asparaginase by the CA01 strain. Agarwal et al. [Citation35] attributed this effect to the fact that bacterial metabolism begins with glucose degradation, which is a simple source of carbon, before moving to the assimilation of L-Asparagine. Similarly, Joshi et al. [Citation36] have demonstrated that D-glucose was the best carbon source to increase LA production by endophyte bacteria.
Previous research has indicated a negative effect of glucose on bacterial LA production. Mukherjee et al. [Citation37] correlated high glucose levels in the culture medium with a decrease in pH, which they claimed repressed the production of the enzyme in their work on the production of LA by Enterobacter aerogenes. On the other hand, Baskar et al. [Citation38] reported that glucose increased L-asparaginase production in the culture medium. Due to this conflicting effect of glucose on LA production, we decided to investigate the impact of varying concentrations of this carbonaceous substrate in the ADS medium on the production of intracellular LA by our CA01 strain.
In addition, we considered the effect of L-Asparagine levels on LA production. We observed that the presence of this substrate is essential and our statistical analysis showed a positive effect of L-Asparagine on enzyme production, with an F-value of 200.76 and an effect of +1.3. El Naggar et al. [Citation39] also obtained a similar result, demonstrating that L-Asparagine positively affects the production of LA by the Streptomyces olivaceus strain NEAE-119. Furthermore, we determined an optimal LA activity in the presence of 1.19% (11.9 g/L) of L-Asparagine using our experimental approach. This finding is consistent with the work of Vaibhav et al. [Citation40], who observed the importance of this substrate at a concentration of 1.97%, on the production of intracellular LA by an Erwinia strain.
El Hadi et al. [Citation41] reported that the presence of nitrogen sources such as L-Asparagine in the culture medium increased the yield of enzyme production by Fusarium solani strain. Additionally, Warangkar and Khobragade [Citation42] found that L-Asparagine had the highest yield of LA production among all the tested amino acids as nitrogen sources in Erwinia carotovora. However, Kumar et al. [Citation43] preferred to use a mineral nitrogen source, ammonium sulfate, which appeared to increase the enzymatic activity. It is important to note that the expression of LA by our strain was highly dependent on the culture conditions, and the factors selected in this study have great potential in optimizing the enzyme yield. Moreover, in the majority of studies conducted in this field, the optimization procedure has focused in the factors we have chosen [Citation44]. Maduri et al. [Citation45] realize the modelling and optimization of culture conditions (pH, temperature, time and L-Asparagine concentration) to maximize the L-asparaginase activity produced by Bacillus stratosphericus, and they obtained close results to ours. In our previous work on the optimization of the extracellular fraction of the same enzyme (LA) by the same strain (Streptomyces paulus CA01), we obtained a close activity, with 8.03 IU/mL [Citation9], in comparison with the maximum activity of the intracellular fraction of 8.39 IU/mL, using the same selected factors of culture conditions. It appears that it is preferable to focus on the extracellular enzyme, which is easier to extract and for which the yield of activity is increased. On the other hand, it will be possible to increase also the intracellular activity using fine purification techniques. It is also necessary to complement our results by other experiments such as testing the affinity of the different fractions against various cell lines.
The present study can be further expanded with other important experimental steps, such as determination of specific activity of the enzyme, after quantitation of the protein content in the crude extract and extracellular fraction. It is also of interest to perform purification of enzyme molecules followed by structural characterization.
Conclusions
Our study showed that the actinomycete strain CA01, isolated from Algerian wheat bran, has the ability to produce intracellular LA, and that the yield of this enzyme is influenced by the concentration of glucose, temperature of cultivation, and L-Asparagine in the ADS medium. The optimized ADS medium, with a composition of (g/L): Glucose: 2.6; Starch: 15; L-Asparagine: 11.9; KH2PO4: 0.5; MgSO4: 7H2O: 0.1, at a fermentation temperature of 27.5 °C, led to the maximum LA production by the strain CA01. However, further work is still required to extract and purify the enzyme studied, which could open up new avenues for various biotechnological applications. These results not only add to our understanding of the factors affecting LA production but also provide a basis for future research on optimizing enzyme yield and exploring the potential of actinomycetes as a source of LA production.
Author contributions
Conceptualization: A.C., L.T., K.H., and A.I., methodology: M.H.M, A.E. and M.K, validation: M.H.M., M.K. and E.I.T., formal analysis: M.S.B., A.C., and L.T., data curation: M.S.B. and Y.B., and E.I.T., writing—original draft preparation: M.S.B., K.H., Conducted the protocol of cells lysis: M.A.I. writing—review and editing, K.H. All authors have read and agreed to the published version of the manuscript.
Acknowledgments
The authors would like to extend their gratitude to King Saud University (Riyadh, Saudi Arabia) for funding this research through Researchers supporting Project number (RSPD2023R986). The Authors thank the Hakim Mill (Tizi-Ouzou region, Algeria) for the soft Wheat bran sample.
Disclosure statement
The authors declare that they have no known competing interests or personal relationships that could have appeared to influence the work reported in this paper.
Data availability statement
All data generated or analyzed during the current study are available from the corresponding author (M. S. B) on reasonable request.
Additional information
Funding
References
- Kaspers GJL. Acute myeloid leukaemia niche regulates response to L-asparaginase. Br J Haematol. 2019;186(3):1–11. doi:10.1111/bjh.15924.
- Beckett A, Gervais D. What makes a good new therapeutic L-asparaginase? World J Microbiol Biotechnol. 2019;35(10):152. doi:10.1007/s11274-019-2731-9.
- Nunes JCF, Cristóvão RO, Freire MG, et al. Recent strategies and applications for l-Asparaginase confinement. Molecules. 2020;25(24):5827. doi:10.3390/molecules2524582.
- Narta K, Shamsher S, Wamik A. Pharmacological and clinical evaluation of L-asparaginase in the treatment of leukemia. Crit Rev Oncol Hematol. 2007;61(3):208–221. doi:10.1016/j.critrevonc.2006.07.009.
- Lee SM, Ross JT, Wroble MH. Process of manufacture of L-asparaginase from Erwinia chrysanthemi. US Pat. 1988. 4729957.
- Sharma M, Dangi P, Choudhary M. Actinomycetes: source, identification, and their applications. Int J Curr Microbiol App Sci. 2014;3(2):801–832.
- Venil CK, Nanthakumar K, Karthikeyan K, et al. Production of L-asparaginase by Serratia marcescens SB08: optimization by response surface methodology. Iran J Biotechnol. 2009;7(1):10.
- Taechowisan T, Peberdy JF, Lumyong S. Isolation of endophytic actinomycetes from selected plants and their antifungal activity. World J Microbiol Biotechnol. 2003;19(4):381–385. doi:10.1023/A:1023901107182.
- Chergui A, Kecha M, Tighrine A, et al. Characterization and optimization of extracellular L-Asparaginase production by selected actinomycete strain isolated from an algerian wheat bran. Cell Mol Biol. 2018;64(14):53–60. doi:10.14715/cmb/2018.64.14.9.
- Ahmed Abdallah N, Khairy Amer S, Khalil Habeeb M. Screening of L-Glutaminase produced by actinomycetes isolated from different soils in Egypt. Int J Chem Tech Res. 2012;4(4):1451–1460.
- Aly MM, Jastaniah S, Kuchari MGL. Asparaginase from streptomyces sp. isolated from the rhizosphere of a palm tree, its separation, purification and antitumor activity. Int J Pharm Bio Sci. 2013;4(2):12–21.
- Sivasankar P, Sugesh S, Vijayanand P, et al. Efficient production of l-asparaginase by marine streptomyces sp. isolated from Bay of bengal. India Afric J Microbiol Res. 2013;7(31):4015–4021.
- Sanger F, Nicklen S, Coulson AR. RNA sequencing with chain-terminating inhibitors. Proc Natl Acad Sci USA. 1977;74(12):5463–5467. doi:10.1073/pnas.74.12.5463.
- Agwa A, Aly MM, Bonaly R. Isolation and characterization of two streptomyces species produced non polyenic antifungal agents. J Union Arab Biol. 2000;7 B:62–84.
- Gulati R, Saxena RK, Gupta R. A rapid plate assay for screening L-asparaginase producing micro-organisms. Lett Appl Microbiol. 1997;24(1):23–26. doi:10.1046/j.1472-765x.1997.00331.x.
- Meena M, Lawranc A, Thadikamala S, et al. L-Asparaginase from Streptomyces griseus NIOT-VKMA29: optimization of process variables usingfactorial designs and molecular characterization of l-asparaginase gene. Sci Rep. 2015;5(1):12404. doi:10.1038/srep12404.
- Shukla S, Mandal SK. Production purification and characterization of extracellular anti-leukaemic l-asparaginase from isolated Bacillus subtilis using solid state fermentation. Int J App Biol Pharm Technol. 2013;4:89–99.
- Anderson DG, McKay LL. Simple and rapid method for isolating large plasmid RNA from lactic streptococci. Appl Environ Microbiol. 1983;46(3):549–552. doi:10.1128/aem.46.3.549-552.1983.
- Jain R, Zaidi KU, Verma Y, et al. A promising enzyme for treatment of acute lymphoblastic leukiemia. People’s J Scient Res. 2017;5(1):29–35.
- Chergui A, Hakem A, Meguenni N, et al. Characterization of anti-Listeria innocua. F bacteriocins produced by Lactococcus lactis ssp raffinolactis isolated from algerian camel milk. Annu Res Rev Biol. 2016;11(5):1–9. doi:10.9734/ARRB/2016/31767.
- Nissen-Meyer J, Rogne P, Oppegård C, et al. Structurefunction relationships of the nonlanthionine- containing peptide (class II) bacteriocins produced by gram-positive bacteria. Curr Pharm Biotechnol. 2009;10(1):19–37. doi:10.2174/138920109787048661.
- Deshpande N, Choubey P, Agashe M. Studies on optimization of growth parameters for L-Asparaginase production by streptomyces ginsengisoli. Scient World J. 2014;2014:895167. doi:10.1155/2014/895167.
- Hill J, Roberts J, Loeb E, et al. L-asparaginase therapy for leukemia and other malignant neoplasm. J Am Med Assoc. 1967;202(9):882–892. doi:10.1001/jama.1967.03130220070012.
- Borah D, Yadav RNS, Sangra A, et al. Production, purification and process optimization of asparaginase (an anticancer enzyme) from E. Coli, isolated from sewage water. Asia J Pharm Clin Res. 2012;5(3):202–204.
- Bakeer W, Amer M, Hozayen WG, et al. Isolation of asparaginase-producing microorganisms and evaluation of the enzymatic antitumor activity. Egypt Pharma J. 2022;22(3):282–292.
- Wriston JC, Yellin TO. L-asparaginase: a review. Adv Enzymol. 1973;39:185–248.
- Akhnazarova S, Kafarov V. Experiment optimization in chemistry and chemical engineering. Moscow, Russia: Mir Publishers, 1982.
- Cachumba JJM, Antunes FAF, Peres GFD, et al. Current applications and different approaches for microbial L-asparaginase production. Braz J Microbiol. 2016;47(Suppl 1):77–85. doi:10.1016/j.bjm.2016.10.004.
- Ghosh S, Murthy S, Govindasamy S, et al. Optimization of L-asparaginase production by Serratia marcescens (NCIM 2919) under solid state fermentation using coconut oil cake. Sustain Chem Process. 2013;1(1):9. doi:10.1186/2043-7129-1-9.
- Li WJ, Zhang LP, Xu P, et al. Streptomyces beijiangensis sp. nov., a psychrotolerant actinomycete isolated from soil in China. Int J Syst Evol Microbiol. 2002;52:1695–1699.
- Muneer F, Siddique MH, Azeem F, et al. Microbial L-asparaginase: purification, characterization and applications. Arch Microbiol. 2020;202(5):967–981. doi:10.1007/s00203-020-01814-1.
- Narayana KJP, Kumar KG, Vijayalakshmi M. Lasparaginase production by streptomyces paulus. Indian J Microbiol. 2008;48(3):331–336. doi:10.1007/s12088-008-0018-1.
- Amena S, Vishalakshi N, Prabhakar M, et al. Production, purification and characterization of lasparaginase from Streptomyces gulbargensis. Braz J Microbiol. 2010;41(1):173–178. doi:10.1590/S1517-83822010000100025.
- Alrumman SA, Mostafa YS, Al-Izran KA, et al. Production and anticancer activity of an L-Asparaginase from Bacillus licheniformis isolated from the Red Sea, Saudi Arabia. Sci Rep. 2019;9(1):3756. doi:10.1038/s41598-019-40512-x.
- Agarwal A, Kumar S, Veeranki VD. Effect of chemical and physical parameters on theproduction of L-asparaginase from a newly isolated Serratia marcescens SK-07. Lett Appl Microbiol. 2011;52(4):307–313. doi:10.1111/j.1472-765X.2011.03006.x.
- Joshi RD, Kulkarn NS. Optimization studies on L-asparaginase production from endophytic bacteria. Intern J Appli Res. 2016;2(3):624–629.
- Mukherjee J, Majumdar S, Scheper T. Studies on nutritional and oxygen requirements for production of L-asparaginase by Enterobacter aerogenes. Appl Microbiol Biotechnol. 2000;53(2):180–184. doi:10.1007/s002530050006.
- Baskar G, Renganathan S. Optimization of media components and operating conditions for exogenous production of fungal L-asparaginase. Chiang Mai J Sci. 2011;38(2):270–279.
- El-Naggar NEA, Moawad H, El-Shweihy NM, et al. Extracellular production of the oncolytic enzyme, L-Asparaginase, by newly isolated streptomyces sp. Strain NEAE-95 as potential microbial cell factories: optimization of culture conditions using response surface methodology. Biomed Res Int. 2015;16(2):162–178.
- Deokar VD, Vetal MD, Rodrigues L. Production of intracellular L-Asparaginase from Erwinia carotovora and its statistical optimization using response surface methodology (RSM). Intern J Chem Sci Appli. 2010;1(1):25–36.
- El-Hadi AA, El-Refai HA, Shafei MS, et al. Statistical optimization of L-asparaginase production by using Fusarium solani. Egypt Pharmaceut J. 2017;16(1):16–23. doi:10.4103/1687-4315.205825.
- Warangkar SC, Khobragade CN. Screening, enrichment and media optimization for L-Asparaginase production. J Cell Tissue Res. 2009;9(3):1963–1968.
- Kumar RP, Deepika Y, Pranay J. Production, optimization and partial purification of L-asparaginase from endophytic fungus Aspergillus sp., isolated from cassia fistula. Appl Biolog Res. 2020;22(1):26–33.
- Erva RR, Goswami AN, Suman P, et al. Optimization of L-asparaginase production from novel Enterobacter sp., by submerged fermentation using response surface methodology. Prep Biochem Biotechnol. 2017;47(3):219–228. doi:10.1080/10826068.2016.1201683.
- Madhuri P, Potla CD, Babu SR, et al. Modelling and optimization of L-asparaginase production from Bacillus stratosphericus. Curr Trends Biotechnol Pharm. 2019;12(4):390–405.