
Abstract
Prostate cancer (PCa) stands as one of the most prevalent malignancies in men, ranking as the fifth leading cancer-associated mortality. Castration-resistance metastatic phenotype acquisition is substantiated by reprogramming of cellular responses to oxidative stress damage, involving evading apoptosis by losing p53 and modulating canonical mitophagy. Understanding the molecular underpinnings of mitochondria-related PCa, dysregulated miR-141 and autophagy-modulating MAPK1/ERK2 in canonical mitophagy altered context of PCa cell line model (LNCaP (p53+/+) and PC3 (p53−/−)) can provide insights into potential therapeutic strategies. Utilising nanopore transcriptome sequencing, differential gene expression was analysed post miR-141 mimic/inhibitor modulation. MiR-141 upregulation enriched pathways associated with TAK1-JNK-c-Jun and MAPK activation. However, its inhibition prioritized non-immune pathways, emphasising lysosome biogenesis. Using DAPGreen (a microtubule-associated protein 1A/1B-light chain 3 (LC3) marker analogue), flow cytometry and live imaging demonstrated that miR-141 rescue amplified macroautophagy in p53+/+ cells, which diminished under starvation; conversely, in p53−/− cells, the rescue initially suppressed macroautophagy but enhanced it when combined with starvation. MAPK1 silencing revealed that MAPK1 had suppressive effect in p53+/+ cells, which was lost in p53−/− cells. Combined with starvation it resulted in macroautophagy upregulation in both cell lines. Mitophagy flux detected by MtPhagy and Lyso dyes demonstrated that miR-141 rescue amplified mitophagy under normal and starved conditions in p53+/+ cells, while in p53−/− cells, amplification only occurred during starvation. In both cell lines, starvation alone supressed mitophagy. MAPK1 had suppressive effect on mitophagy only during starvation, regardless of p53 status. Modifying miR-141 and MAPK1/ERK2 dynamic duality axis could present a potential therapeutic strategy.
Introduction
Prostate cancer (PCa) stands as one of the most prevalent malignancies in men and ranks as the fifth leading cause of cancer-associated mortalities [Citation1]. Although reactive oxygen species (ROS) promote cell damaging oxidative stress, they have also been associated with tumour formation, possibly acting as secondary messengers in various signalling cascades [Citation2]. ROS generation is increased in PCa cells compared to normal epithelial cells. This is more prevalent in the p53-null, hormone-refractory, bone marrow metastatic PCa cells (PC3 cell line), compared to less malignant lymph node PCa metastatic cells (LNCaP cell line) [Citation2,Citation3]. In these PCa cell lines, invasiveness was intricately tied to extramitochondrial ROS production, which, in turn, influenced their mitochondrial potential. Crucially, this ROS production interacted with and regulated several autophagy-modulating growth signalling pathways, including mitogen-activated protein kinase 1/extracellular signal-regulated kinase 2 (MAPK1/ERK2) [Citation4], p38 mitogen-activated protein kinase (p38 MAPK) and AKT protein kinase B (PKB). Blocking ROS production led to the downregulation of these pathways and compromised mitochondrial potential [Citation2].
Canonical mitophagy is a process by which damaged or dysfunctional mitochondria are selectively degraded by autophagy, a dynamic catabolic process that provides nutrients during lower nutrient availability [Citation5]. Mitophagy is activated by the Parkin–PINK1 pathway, which involves the phosphorylation of Parkin by PINK1. Parkin then recruits the Beclin-1 protein, which together with ULK1, is required for the formation of the autophagosome [Citation6–8]. This process is initiated with the synthesis of a membrane complex in the ribosomes of the endoplasmic reticulum, leading to the formation of the omegasome and a protein complex that includes ATG13, ULK1, ATG101 and Fib200 [Citation9]. As the autophagosome matures, it elongates around the structure targeted for degradation, and a lipidated form of the key protein LC3 is recruited from the cytosol into the autophagosome membrane. Ultimately, to enable content degradation, the autophagosome merges with the lysosome [Citation10]. By degrading damaged organelles, autophagy protects cells, but it also could deliver nutrients to the cancer cells in their low nutrient (starvation), hypoxic, environment, thus playing a dualistic role in PCa progression and treatment resistance [Citation11]. In this context, the role of mitophagy is crucial for regulating the excessive oxidative stress especially in cancer cells.
Autophagy supports the metabolic plasticity of cancer cells, by providing virtually all essential components of carbon metabolism through cell components degradation, as both glucose-dependent metabolic pathways and mitochondria metabolism are pivotal in tumorigenesis [Citation5]. Depending on the cancer mutagenic genotype, mitophagy is supressed to promote an increase in ROS and an inflammasome proinflammatory cytokine environment to further enhance cell metastatic potential. These events are similar to breast cancer, where MAPK1/3 reduces mitophagy via targeting the canonical mitophagy pathway by ULK1 phosphorylation and degradation in proteosome [Citation12]. In other tumour types silencing MAPK1/ERK2 efficiently inhibited mitophagy during starvation and hypoxia, but not macroautophagy [Citation13], establishing MAPK1/ERK2 importance for cancer important metabolic plasticity and survival.
In PCa context, PTEN is often deleted, hampering the canonical Parkin–PINK–Beclin-1–ULK1 pathway. In this context, it is possible that instigating mitophagy under hypoxic conditions, cells would diminish the mitochondrial mass thereby reducing the overall oxygen consumption of the cell, promoting their survival under low oxygen conditions [Citation5]. There is no sufficient information on the role of MAPK1/ERK2 activity in this context on mitophagy pathway regulation.
Similar to MAPK1 behaviour towards mitophagy, a mitochondrion-related micro-RNA [Citation14,Citation15], hsa-miR-141, has dualistic and opposing roles in different cancer types. In MAPK1 supressed mitophagy breast cancer context, hypoxia suppressed miR-141, while miR-141 overexpression reduced autophagy to increase cell proliferation, migration and invasion [Citation15]. In a metabolic syndrome mice model, under high glucose conditions, miR-141-3p was found highly upregulated. In human hepatocellular carcinoma HepG2 cells, it upregulated oxidative phosphorylation genes and mitochondrial activity, simultaneously supressing major antioxidant enzymes, potentially inducing oxidative stress. It also upregulated proinflammatory cytokines as IL-6. miR-141 was found to directly silence PTEN and other genes of the p53 pathway, resulting in PTEN-dependent antioxidant suppression [Citation14]. These findings would suggest potential mitophagy suppression via canonical pathway. In HepG2 cells, the same study found that miR-141 is downregulated in mitochondria dysfunctional manner, opening an avenue for canonical mitophagy upregulation induced by hypoxia. In metastatic LNCaP and PC3 PCa cell lines microRNA-141 (miR-141) was found significantly downregulated. Its rescue (increase) resulted in suppression of cell proliferation, migration, stem cells phenotype, metastasis and invasion. miR-141 was found to target a cohort of pro-metastasis genes, including RUNX1 [Citation16,Citation17]. Surprisingly, miR-141 was found upregulated in some PCa tissue expression studies [Citation18–20] and in PCa patients this micro-RNA was upregulated [Citation21].
A meta-analysis study on miR-141 diagnostic value in PCa suggested high value, with heterogeneity stemming mostly from patients age [Citation22], suggesting putative role of the castration-resistant phenotype development, associated with age. This phenotype is highly metastatic and associated with metastatic disease. The contrasting roles of miR-141 in metastasis versus tissue expression, which mirror the dualistic function of MAPK1 in autophagy/mitophagy regulation, underscores the profound dependence of the tumour metabolic profile, linking the specific dysregulation patterns of autophagy-regulating genes to distinct cancer genotypes. While many autophagy-related genes are mutated in PCa [Citation23–25] to shield it from pro-apoptotic stimuli [Citation26], autophagy induction is a very strong defence strategy, when tumour cells are exposed to radiation or treated with chemotherapy, promoting cancer stage-dependent therapeutic resistance [Citation27–30].
In this study we investigated the effects of both MAPK1 and hsa-miR-141 on autophagy and mitophagy induction in a cancel cell line model with varying degrees of anti-apoptotic control.
Materials and methods
Cell culture
Two metastatic PCa cell lines were obtained from the American Type Culture Collection (ATCC). The lymph node metastasis-derived cell line, CRL-1740-LNCaP (p53+/+), was cultured in RPMI-1640 medium (Sigma-Aldrich®) containing L-glutamine and sodium bicarbonate. This medium was supplemented with D-(+)-glucose at 4.5 g/L (Sigma-Aldrich®), 10% FBS (Sigma-Aldrich®) and 1% Ab/Am (Sigma-Aldrich®). Ab/Am contains 10,000 units penicillin, 10 mg streptomycin and 25 μg amphotericin B per millilitre. The bone metastasis-derived CRL-1435-PC3 (p53−/−) cell line was cultured in DMEM medium with high glucose (4.5 g/L), L-glutamine, sodium bicarbonate (1.5 g/L), and 1 mmol/L sodium pyruvate. This medium was also supplemented with 10% FBS (Sigma-Aldrich®) and 1% Ab/Am (Sigma-Aldrich®). To induce cell starvation, RPMI and DMEM were used with a low glucose concentration (1 g/L) and without the addition of FBS. Both cell lines were cultured in an incubator with 5% CO2 at 37 °C and were routinely passaged. LNCaP and PC3 cell lines were transfected for 24/48 h with hsa-miR-141-3p mimic (5 nmol) with the sequence UAACACUGUCUGGUAAAGAUGG, hsa-miR-141-3p inhibitor (Qiagen) and siMAPK1 (5 nmol) with the target sequence AATGCT GACTCCAAAGCTCTG (Qiagen) using the PureFection™ Transfection Reagent (System Bioscience, Palo Alto, CA; Cat. No. LV750A-1-SBI). The detailed protocol was described elsewhere [Citation31]. Two hours prior to transfection, the culture medium was replaced. Cells were cultured for at least 24 h before transfection. The macrolide antibiotic bafilomycin A1 (Invivogen), diluted to a final concentration of 0.1 mg/mL in dimethyl sulphoxide, was used to inhibit the fusion of the autophagosome with the lysosome.
Oxford nanopore 1D cDNA sequencing
RNA extraction and cDNA synthesis
PC3 cells were transfected with hsa-miR-141-3p mimic or inhibitor using Lipofectamine™ RNAiMAX Transfection Reagent (Invitrogen, Cat. No. 13778150) according to the manufacturer’s instructions. After 24 h, total RNA was extracted from the cells using GenElute™ Mammalian Total RNA Miniprep Kit (Sigma-Aldrich®, Cat. No. RTN10) following the protocol for cells. The concentration and purity of RNA were measured using a Qubit 2.0 Fluorometer and Qubit RNA BR Assay Kit (Thermo Fisher, Cat. No. Q10210). Poly(A)+ mRNA was isolated from 1 µg of total RNA using NEBNext® Poly(A) mRNA Magnetic Isolation Module (NEB, Cat. No. E7490) as described in the user manual. Fraction of the eluted mRNA (100 ng) was reverse transcribed to cDNA using iScript™ cDNA Synthesis Kit (Bio Rad, Cat. No. 1708890) in a GeneAmp® PCR System 9700 thermal cycler (Applied Biosystems, Model No. N8050200) with the following conditions: 25 °C for 5 min, 42 °C for 30 min and 85 °C for 5 min.
Library preparation and sequencing
Nanopore sequencing was performed using R9.4 MinION Flow Cells (Oxford Nanopore Technologies, FLO-MIN106) on a MinION device with R9.4 chemistry. cDNA libraries were prepared using the Ligation Sequencing Kit 1D (Oxford Nanopore Technologies, SQK-LSK108), following a PCR-cDNA similar strategy (the PCR-cDNA kit was not available at the time). mRNA was reverse transcribed, a second strand was synthesized, followed by end-repair, dA-tailing and sequencing adapter ligation. The library was PCR amplified for 40 cycles, following LSK108 kit library amplification protocol. At all steps, cDNA purification and size selection were done using AMPure XP beads (Beckman Coulter, Cat. No. A63881), according to Oxford Nanopore Technologies guidelines described in the LSK108 kit protocol. Three flow cells were used for 48-h sequencing runs of three cDNA samples each.
Comparative transcriptomics analysis pipeline
For the comparative analysis of mRNA transcripts sequenced via cDNA using the Oxford Nanopore platform, a comprehensive bioinformatics pipeline was established. Initially, raw nanopore reads underwent basecalling using the Guppy basecaller (command line version, Oxford Nanopore Technologies, UK) to convert raw signal data into nucleotide sequences. Following basecalling, quality control (QC) steps were implemented using the NanoPlot tool [Citation32] to assess read length distribution and quality scores. High-quality long-reads were then aligned to human reference genome GRCh38 using Minimap2 version 2.22 implemented in Galaxy bioinformatics pipeline [Citation33]. The alignment results were output in BAM format and used to compare mRNA abundance across samples, where the aligned reads were qualified using FastQC (https://www.bioinformatics.babraham.ac.uk/projects/fastqc/) and quantified and analysed using the SeqMonk package (https://www.bioinformatics.babraham.ac.uk/projects/seqmonk/; https://github.com/s-andrews/SeqMonk; under GPL v3. license). This package facilitated visualisation and comparative analysis of transcript abundance, enabling the identification of differentially expressed genes and providing insights into the underlying transcriptional landscape. Probes were defined using transcriptomics differential expression pipeline and quantitative comparison and statistical analysis were performed within the SeqMonk package. The differential expression data were used for comparative pathway enrichment in Panter and Reactome databases (G:profiler—g:GOSt tool for functional enrichment analysis (gene set enrichment analysis) mapping genes to known functional information sources, detecting statistically significantly enriched terms; https://biit.cs.ut.ee/gprofiler/gost).
RT-qPCR analysis of ATG16L and LC3-I transcripts
LNCAP and PC3 cells were transfected with 5 nmol of hsa-miR-141-3p mimic (Active Motif, Cat. No. MIM0174) or hsa-miR-141-3p inhibitor (Active Motif, Cat. No. INH0174; https://www.activemotif.com/catalog/1021/mir-100_mir-199) or 5 nmol of siMAPK1 (Qiagen, Cat. No. SI02654810; https://geneglobe.qiagen.com/kr/product-groups/flexitube-sirna?q=mapk1) using PureFection™ transfection reagent (System Biosciences, Cat. No. LV750A-1-SBI) according to the manufacturer’s instructions. After 24 h for miR-141-3p mimic or inhibitor or 48 h for siMAPK1, total RNA was extracted from the cells using Quick-RNATM Mini Prep kit (Zymo Research, Cat. No. R1054) following the protocol for cells. The concentration and purity of RNA were measured using Qubit 2.0 Fluorometer and Qubit RNA HS Assay Kit (Thermo Fisher, Cat. No. Q10210). Total RNA was reverse transcribed to cDNA using iScript™ cDNA Synthesis Kit (Bio Rad, Cat. No. 1708891) in a GeneAmp® PCR System 9700 thermal cycler (Applied Biosystems, Model No. N8050200) with the following conditions: 25 °C for 5 min, 42 °C for 30 min and 85 °C for 5 min. The expression levels of autophagy-related 16 like 1 (ATG16L1) and microtubule associated protein 1 light chain 3 alpha (MAP1LC3A) transcripts were assessed using RT-qPCR on a Stratagene Mx3005P qPCR System (Agilent Technologies). For each reaction, 9 ng of the synthesized cDNA was mixed with iTaqTM Universal SYBR® Green Supermix (BioRad, Cat. No. 1725120) and gene-specific primers from Sigma-Aldrich® (ATG16L and MAP1LC3A) and Qiagen (GAPDH; ) in a final volume of 20 µL. The thermal cycling protocol consisted of denaturation at 95 °C for 30 s, annealing at 50 °C for 1 min, and extension at 72 °C for 30 s, repeated for 45 cycles. Relative gene expression levels were quantified using the ΔΔCt method, with glyceraldehyde 3-phosphate dehydrogenase (GAPDH) serving as the internal reference.
Table 1. Gene-specific primers for ATG16L1, MAP1LC3A and GAPDH.
Flow cytometry assessment of autophagy-related proteins and cellular processes
Cell culture and treatment
Metastatic cell lines were cultured in 12-well plates and, prior to experimentation, were treated with 5 nmol hsa-miR-141-3p mimic for 24 h and 5 nmol siMAPK1 (Qiagen, Cat. No. SI02654810) for 48 h.
Flow cytometry analysis of protein expression
Protein expression levels of ATG16L and LC3 were assessed using flow cytometry. Cells were stained with Atg16 (clone C-20; Santa Cruz Biotechnology, sc-70133) goat polyclonal antibody specific for peptides proximal to the C-terminal end of human ATG16L and MAP LC-3β (N-20; Santa Cruz Biotechnology, sc-16755) goat polyclonal antibody targeting peptides adjacent to the N-terminal end of human MAP LC-3β. Both antibodies were used at a final concentration of 0.5 mg per 106 cells. The incubation conditions were for 30 min at 4 °C.
Evaluation of macroautophagy, mitophagy and lysosomes
Macroautophagy was monitored using 5 nmol/L DAPGreen (Dojindo Molecular Technologies, D676-10; Ex. 488 nm/Em. 500–563 nm), mitophagy was tracked with 100 nmol/L MtPhagy dye (Dojindo Molecular Technologies, MD01.5; Ex. 561 nm/Em. 650 nm), and lysosomes were detected using 1 µmol/L Lyso dye (Dojindo Molecular Technologies, MD01; Ex. 488 nm/Em. 502–554 nm). All dyes fluorescence is pH-dependent [Citation34,Citation35]. Cells were evaluated under three conditions: 12-h starvation, normal conditions, and post-treatment with 161 µmol/L bafilomycin A1 (InvivoGen, Cat. No. tlrl-baf1) for 18 h.
Data acquisition and analysis
Flow cytometry measurements were conducted using the BD FACSCalibur flow cytometer (Becton Dickinson). The median fluorescent index (MFI) was determined using Flowing Software v.2.5.1 (Turku Bioscience, Finland; https://flowingsoftware.com/).
Fluorescence microscopy of autophagy-related processes
Cell lines were cultured in eight-well chambers with glass bottoms, each containing a final medium volume of 100 µL. The transfection and dye treatment protocols were optimized for this specific cell concentration. For visualisation, the same Dojindo pH-dependent dyes utilized in the flow cytometry experiments were employed. Observations were made using an inverted fluorescence microscope (Etaluma Inc., CA, USA). Acquired images were subsequently superimposed and analysed using the Java-based ImageJ software (National Institutes of Health).
Statistical analysis
Data were analysed using GraphPad Prism (GraphPad Software, Boston, MA, USA, www.graphpad.com). Depending on the experiment, either one-way or two-way analysis of variance (ANOVA) was performed, followed by a pair-wise non-parametric post hoc test.
Results
Transcriptional changes in pc3 cells following miR-141 modulation
To elucidate the transcriptional alterations in PC3 cells post miR-141 modulation, we employed a microRNA mimic for miR-141 rescue and a selective hybridisation-based microRNA inhibitor for its downregulation. Utilising nanopore transcriptome sequencing with an mRNA-cDNA-library strategy, individual flow cells were allocated for control PC3 cells, miR-141 mimic, and miR-141 inhibitor transfected cells. Given the flow-cell capacity of 20–30 GB, we projected coverage of 1.5–2× of the entire full-length transcriptome. Sequencing data revealed transcripts ranging from 3–7 kb, extending up to 10 kb, indicating comprehensive full-length mRNA sequencing of satisfactory quality (). Despite the prior chemistry and flow-cell model, transcript identification remained consistent using standard bioinformatics pipelines for mRNA alignment and differential expression comparison. Notably, post miR-141 mimic rescue, the most enriched pathways were associated with TAK1 mediated activations (TAK1-JNK-c-Jun, TAK1-NF-κB and TAK1-p38MAPK1) and NF-κB related downstream MAPK activation. Conversely, miR-141 inhibition primarily enriched non-immune pathways, with a notable emphasis on lysosome biogenesis (–). Our findings underscore that miR-141 has a potentially central role in TAK1-based JNK and p38MAPK1 pathway induction.
Figure 1. Nanopore-based sequencing bulk transcriptome profiles of hsa-miR-141 mimic and hsa-miR-141 inhibitor transfected ATCC PC3 cells line, compared to intact PC3 cells transcriptome. (A) Library generation strategy, using ligation sequencing kit 1D (LSK108). (B) Quality score vs. base reads. Inset: Long-read counts distribution across experiments. Right: Corresponding reads mapped across GRCh38 human reference genome by SeqMonk. Differential expression analysis was done within SeqMonk. (C) Violin and bar-chart plots of reads distribution within experimental condition(s), before and after normalization in SeqMonk. (D) FastQC reads qualification. (E). G:profiler (g:GOSt) gene set enrichment analysis of SeqMonk differential expression data with pathway enrichments using reactome database.
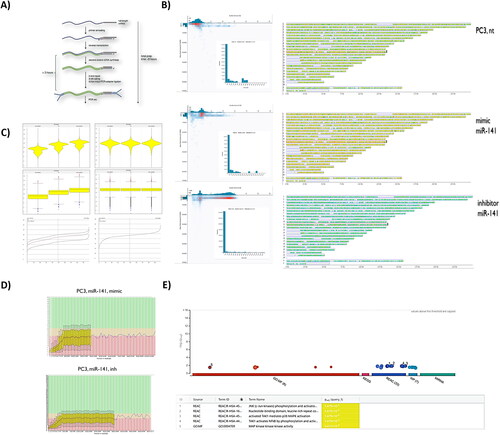
Table 2. Enriched pathways after miR-141 mimic and inhibitor transfection, compared to non-transfected PC3 cells.
Table 3. Significantly changed differential expression of transcripts after miR-141 mimic transfection (‘tumour suppressed phenotype’).
Table 4. Significantly changed differential expression of transcripts after miR-141 inhibitor transfection (‘tumour enrichment phenotype’).
Autophagy gene expression in PCa cell lines with distinct p53 phenotypes
Given the established relationship between p53 and cellular responses like apoptosis and autophagy [Citation36,Citation37], we explored two ATCC PCa cell lines: LNCaP cells, which display a lymph node wild type (wt) p53 metastatic phenotype, and PC3 cells, which resemble a bone marrow p53 null PCa phenotype. Our focus was on the expression levels of the autophagy initiation and autophagosome maturation markers, ATG16L and LC3, in the context of miR-141 mimic-mediated rescue and MAPK1/ERK2 siRNA silencing ().
Figure 2. Effect of miR-141 mimic and siMAPK1 on ATG16L and LC3 autophagy markers expression in LNCaP and PC3 cell lines. (A) Relative expression of ATG16L and LC3-I transcripts after 24 h transfection with miR-141 in PC3 cell line compared to non-treated cells (nt) and (B) after 48 h transfection with siMAPK1 in LNCaP and PC3 cell lines compared to non-treated cells (nt). (C) Flow cytometry analysis of ATG16L and LC3 protein expression after transfection of miR-141 mimic or inhibitor for 24 h in LNCaP and PC3 cell lines compared to non-treated cells (nt). MiR-141 suppressed ATG16L and increased LC3 expression at the protein level in LNCaP cells, while in PC3 miR-141 slightly increased the protein expression of both markers. (D) Flow cytometry analysis of ATG16L and LC3 protein expression after gene silencing of MAPK1 in LNCaP and PC3 cell lines compared to non-treated cells (nt). MAPK1 silencing slightly suppressed the protein expression of ATG16L and LC3 autophagy markers in the LNCaP cell line, while the reverse was observed in PC3 cells. The protein abundance of ATG16L and LC3 was detected using intracellular flow cytometry with ATG16 (C-20) and MAP LC-3β (N-20) goat polyclonal antibodies. Expression was assessed using the MFI parameter from FCS histograms, with values normalized to a control value of 1. Asterisks above bars denote statistically significant differences as determined by ANOVA (**p < 0.01).
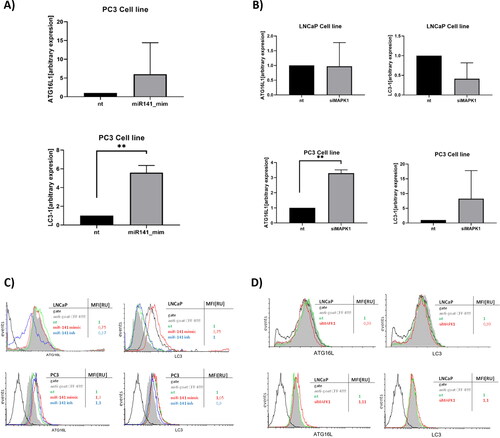
Post miR-141 mimic rescue, ATG16L mRNA () and protein expression were significantly upregulated in p53(−/−) PC3 cells, while downregulated in p53(+/+) LNCaP cells. LC3 mRNA expression was elevated in p53(−/−) PC3 cells post miR-141 rescue (), but protein levels remained largely unchanged. LC3 protein expression was upregulated in p53(+/+) LNCaP cells (). This differential response to miR-141 mimic in PC3 cells is likely attributed to the compromised p53-mediated autophagy induction in these cells.
Given the unresponsiveness of hormone-resistant p53(−/−) PC3 cells and their high basal ROS production [Citation2,Citation3], we explored autophagy markers in a MAPK1/ERK2 silenced context. This was driven by the known oxidative stress links to ERK, p38 and Akt, and the interplay with redox-sensitive transcription factors like NF-kB, HIF-1, AP-1 and p53. Our experiments with MAPK1/ERK2 silencing revealed its pivotal role in autophagy processes. In p53(+/+) LNCaP cells, MAPK1/ERK2 was essential for LC3 expression at both mRNA and protein levels. Conversely, in p53(−/−) PC3 cells, the absence of MAPK1/ERK2 led to an upregulation of both ATG16L and LC3 at mRNA and protein levels, suggesting a compensatory increase in non-selective macroautophagy repression by MAPK1/ERK2 in the absence of p53 autophagy induction ().
Antagonistic effects of miR-141 and MAPK1/ERK2 on macroautophagy flux are dependent on the p53 status
In high ROS-producing cancer cells, such as PC3, there is a potential for increased mitochondrial damage and elevated mitophagy-activating stimuli. Given miR-141’s activation of the JNK/c-Jun and NK-kB pathways—with JNK/c-Jun directly involved in non-canonical mitophagy—it became pertinent to explore its role. The varied response to MAPK1/ERK2 expression based on the p53 genotype hinted at a possible differential macroautophagy/mitophagy response in these cells. To understand the effects of these molecular shifts on autophagy dynamics, we utilized Dojindo fluorescent markers for flow cytometry and live imaging. These novel markers, developed by the Japanese company Dojindo, detect autophagosome formation (DAPGreen) and mitophagy activation (Mtphagy). Additionally, we employed the Lyso dye (also from Dojindo) to monitor lysosome formation.
We induced non-specific autophagy using a cell starvation model, which also mimics the low-nutrient glycolytic environment typical of high ROS-producing cancer cells. DAPGreen, a small fluorescent molecule, identifies both autophagosomes and autolysosomes. Its structural properties are believed to facilitate integration during autophagosome double membrane biogenesis, with fluorescence emission likely triggered in hydrophobic settings [Citation35]. Autophagosome formation, as indicated by DAPGreen, is enhanced in p53(+/+) LNCaP cells but reduced in p53(−/−) PC3 cells following miR-141 mimic treatment. In LNCaP cells, starvation diminished autophagy when combined with miR-141 rescue, whereas in PC3 cells, it amplified autophagy beyond the effects of starvation alone (). The potential activation of JNK/c-Jun by the miR-141 mimic in p53(+/+) LNCaP cells intensified autophagy more than the mTOR-suppressing starvation-induced autophagy. The absence of autophagy activation in p53-null PC3 cells implies a deficiency in p53-dependent Atg genes. This scenario might have influenced the pathways activated by the miR-141 rescue. Furthermore, starvation-induced autophagosome formation was less pronounced in p53-null cells compared to p53 wt cells, given that p53 promotes autophagy through mTOR suppression. These interactions are very complex, as transcription factor c-Jun, part of the AP-1 protein family, could also potentially inhibit starvation-induced autophagy through an mTOR-independent mechanism, while starvation itself later diminishes its expression due to a regulatory feedback loop [Citation38]. Consequently, while starvation inherently induces macroautophagy, miR-141 might partially suppress it, potentially via c-Jun.
Figure 3. Effect of miR-141 mimic and siMAPK1 on macroautophagy under intact and starved conditions was evaluated using LC3 analogue dye DAPGreen (Dojindo). (A) flow cytometry histogram (left) analysis of DAPGreen intensity in LNCaP cells in non-treated (nt; purple), starvation (green), miR-141 mimic transfected in high glucose (blue) and miR-141 mimic transfected in low glucose (starvation) conditions (yellow). and flow cytometry histogram (right) analysis of DAPGreen intensity in PC3 cells in non-treated (nt; purple), starvation (green), miR-141 mimic transfected in high glucose (yellow) and miR-141 mimic transfected in low glucose (starvation) conditions (red). (B) Median with error bars plot of the MFI data obtained from non-treated (nt), starved (nt_starvation), miR-141 mimic transfected under starvation (miR-141_starvation) and miR-141 mimic transfected in normal (high glucose) conditions. (C) Selected representative FITC filtered fluorescent images from Etaluma LS620 live inverted fluorescent imaging of LNCaP and PC3 cells treated under same conditions as in (B), and (D) White (bright) field images merged with FITC filtered fluorescent channel of PC3 cells treated under same conditions as in (B). (E) Flow cytometry histogram analysis of DAPGreen intensity in LNCaP cells in non-treated (nt; black), starvation (green), siMAPK transfected in high glucose (yellow) and miR-141 mimic transfected in low glucose (starvation) conditions (purple). and flow cytometry histogram analysis of DAPGreen intensity in PC3 cells in non-treated (nt; black), starvation (red), siMAPK transfected in high glucose (yellow) and miR-141 mimic transfected in low glucose (starvation) conditions (blue). (F) Median with error bars plot of the MFI data obtained from non-treated (nt), starved (nt_starvation), siMAPK1 transfected under starvation (siMAPK1 _starvation) and siMAPK1 transfected in normal (high glucose) conditions. (G) Selected representative FITC filtered fluorescent images from Etaluma LS620 live inverted fluorescent imaging of PC3 cells treated under same conditions as in (F) and (H) White (bright) field images merged with FITC filtered fluorescent channel of PC3 cells treated under same conditions as in (F). All microscopy images have scale bar of 50 µm. Expression in (B) and (F) is assessed using the MFI parameter from FCS histograms, with values normalized to a control value of 1.
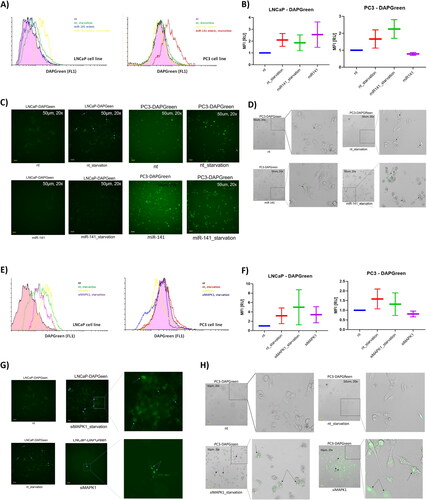
In experiments where MAPK1/ERK2 was silenced, we noted a similar pattern of starvation-induced autophagy between p53(+/+) LNCaP and p53(−/−) PC3 cells. The absence of MAPK1 influenced autophagosome formation: there was an increase in p53(+/+) LNCaP cells and a marginal decrease in p53(−/−) PC3 cells compared to their respective controls (). Moreover, when MAPK1 was silenced, starvation led to enhanced autophagosome formation in both cell lines. However, these differences were not statistically significant due to considerable variability between experiments (). These findings imply that MAPK1 plays a pivotal role in regulating autophagosome formation. Its effects on autophagy may vary based on p53 status, and these effects appear to be independent of the mTOR pathway, as its suppression by starvation consistently elevates autophagy, irrespective of p53 signalling.
Rescuing miR-141 opposes the inhibitory effect of MAPK1/ERK2 on starvation-induced mitophagy in a p53 status dependent way
We subsequently employed the Dojindo fluorescent dye, Mtphagy, to discern potential alterations in mitophagy activation between starvation and miR-141 mimic rescue conditions. The Mtphagy dye accumulates in intact mitochondria, binding to them through a chemical bond. Initially, the dye exhibits weak fluorescence, which intensifies upon mitophagy induction, particularly when the autophagosome containing damaged mitochondria fuses with the lysosome [Citation34]. Starvation of both p53(+/+) LNCaP and p53(−/−) PC3 cells did not yield a significant uptick in the Mtphagy dye signal. Notably, in PC3 cells, especially during the bafilomycin A blockade of autophagosome-lysosome fusion, the signals were even below baseline (). Lysosome dynamics, as indicated by the Lyso dye signal, were altered in LNCaP cells but remained unchanged in PC3 cells, hinting at potential macroautophagy activation in the former.
Figure 4. Impact of miR-141 mimic and siMAPK1 on mitophagy flux: assessments under normal, starvation, and bafilomycin A treatment conditions using MtPhagy and Lyso dyes (Dojindo) for mitophagy and lysosomes, respectively. (A) Flow cytometry histogram analysis of MtPhagy and Lyso dyes intensity in LNCaP and PC3 cells in non-treated (nt), starvation (nt_starvation), starvation after bafilomycin A treatment (nt_starv_Baf), miR-141 mimic transfected in high glucose (miR-141), and after bafilomycin A treatment (miR-141_Baf), and miR-141 mimic transfected in low glucose (miR-141_starv) conditions, and after bafilomycin A treatment (miR-141_starv_Baf). (B) Median with error bars plot of the MFI data obtained from non-treated (nt), starvation (nt_starvation), starvation after bafilomycin A treatment (nt_starvation_Baf), miR-141 mimic transfected in low glucose (miR-141_starvation) conditions, and after bafilomycin A treatment (miR-141_starvation_Baf), and miR-141 mimic transfected in high glucose (miR-141), and after bafilomycin A treatment (miR-141_Baf). statistically significant differences (p < 0.05) are shown using asterisks. (C) Flow cytometry histogram analysis of MtPhagy and Lyso dyes intensity in LNCaP and PC3 cells in intact (nt), starvation (nt_starvation), starvation after bafilomycin A treatment (nt_starv_Baf), siMAPK1 transfected in high glucose (siMAPK1), and after bafilomycin A treatment (siMAPK1_baf), and siMAPK1 transfected in low glucose (siMAPK1_starv) conditions, and after bafilomycin A treatment (siMAPK1_starv_baf). (D) Median with error bars plot of the MFI data obtained from intact (nt), starvation (nt_starvation), starvation after bafilomycin A treatment (nt_starvation_Baf), siMAPK1 transfected in low glucose (siMAPK1_starvation) conditions, and after bafilomycin A treatment (siMAPK1_starvation_Baf), and siMAPK1 transfected in high glucose (siMAPK1), and after bafilomycin A treatment (siMAPK1_Baf). statistically significant differences (p < 0.05) are shown using asterisks. (E) and (F) Non-treated (nt), starved (starv), miR-141 mimic transfected in high glucose (miR-141) and miR-141 mimic transfected in low glucose (miR-141 starv) conditions PC3 cells, showing cell morphology, Lyso dye fluorescence (green) and Mtphagy dye fluorescence (red) on Etaluma LS620 inverted microscope. Cells with co-localisation are shown with white full triangle, cells with lacking colocalization are shown with transparent triangle. All microscopy images have a scale bar of 25 µm. Expression in (B) and (F) is assessed using the MFI parameter from FCS histograms, with values normalized to a control value of 1. Asterisks above bars denote statistically significant differences as determined by ANOVA (*p < 0.05).
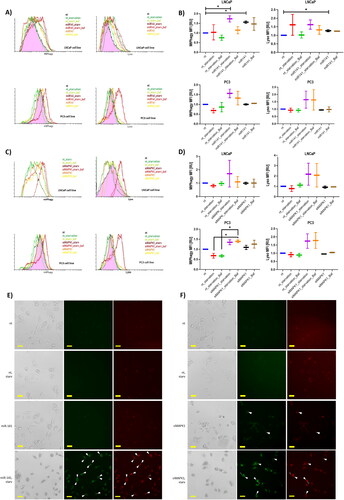
Upon miR-141 rescue in high glucose conditions—essential for these PCa cell lines—we noted a pronounced increase in the Mtphagy signal and a modest rise in lysosome dynamics in p53(+/+) LNCaP cells. However, p53(−/−) PC3 cells showed no such increase (). As anticipated, bafilomycin A pretreatment in LNCaP cells suppressed the MtPhagy signal. Intriguingly, miR-141 mimic transfection followed by starvation led to a significant surge in the Mtphagy signal in both cell lines, a rise that was predictably curtailed with bafilomycin A pretreatment (). Lysosomal dynamics mirrored this trend, evidenced by an elevated Lyso dye signal. Bafilomycin A’s lysosomal fusion blockade reduced the Lyso signal in LNCaP cells, but the effect was less pronounced in PC3 cells (). In essence, miR-141 mimic rescue alone effectively induced mitophagy in LNCaP cells, whereas a combination of starvation-induced macroautophagy and miR-141 mimic rescue triggered robust mitophagy signalling in both cell types ().
Silencing MAPK1/ERK2 alone yielded no discernible shift in mitophagy activation or lysosomal dynamics in p53(+/+) LNCaP cells. However, when these silenced cells were starved, we observed considerable variability in Mtphagy signalling, ranging from suppression to pronounced activation. This mitophagy activation was tempered when lysosomal fusion was inhibited with bafilomycin A. Concurrently, lysosomal dynamics paralleled mitophagy trends, with the Lyso signal increasing, albeit with significant variability. In contrast, in p53(−/−) PC3 cells, mitophagy was amplified under MAPK1/ERK2 silenced conditions, with a notable surge in the Mtphagy signal when silencing was coupled with starvation. Lysosomal dynamics increased correspondingly under these conditions ().
In summary, MAPK1/ERK2 appears to exert a suppressive effect on starvation-induced mitophagy in p53(−/−) PC3 cells, and potentially a dual role in p53(+/+) LNCaP cells, as evidenced by both suppression and activation in different experiments upon MAPK1/ERK2 silencing. This suppression was paired with an elevated Lyso dye signal, indicating increased lysosomal dynamics and possibly enhanced macroautophagy flux. The considerable variability in results suggests a heterogeneous population within LNCaP cells that either inhibits or activates macroautophagy in response to the inherently upregulated MAPK1 signal in PCa cells. In p53 null cells, which also exhibit PTEN suppression, starvation-induced macroautophagy more potently triggers mitophagy. Given that PTEN is essential for the PINK1/Parkin2 pathway, alternative mitophagy-inducing tagging molecules, such as BNIP3/BNIP3L (the latter being under JNK/c-JUN control), might assume a more dominant role.
Discussion
Mitophagy plays a pivotal role in regulating mitochondrial quality and ROS production within cancer cells. Impaired mitophagy can exacerbate DNA damage. Given this, we explored the influence of micro-RNA-141 (miR-141)—which is suppressed in PCa cells [Citation16,Citation17] and elevated in patients’ blood samples [Citation21]—on mitophagy in models of p53-positive and p53-negative metastatic PCa cell lines.
Our transcriptomic analysis revealed that miR-141 mimic rescue predominantly upregulated pathways associated with TAK1-induced JNK/c-Jun pathways. TAK1, a mitogen-activated protein kinase kinase kinase (MAPKKK), activates JNK (c-Jun N-terminal kinase) either directly or through specific MAPKKK [Citation4]. TAK1 can be activated by diverse stimuli, including cytokines, growth factors, and stress signals. Activation of JNK by TAK1 can lead to various cellular outcomes, such as apoptosis, inflammation, cell survival and differentiation. Notably, JNK-c-Jun-mediated autophagy activation and LC3 upregulation have been shown to protect against apoptosis in the PC3 bone marrow-derived PCa cell line [Citation39] and in nasopharyngeal carcinoma cells [Citation40]. When JNK is activated, it phosphorylates several autophagy-related proteins, including Beclin-1, LC3 and Atg7. The phosphorylation of Beclin-1 by JNK promotes autophagosome formation, while LC3 phosphorylation facilitates the fusion of autophagosomes with lysosomes [Citation4].
Given the pronounced suppression of apoptosis in cancer cells and the early inhibition of autophagy [Citation23,Citation24,Citation41], we hypothesized that the observed suppression of miR-141 in PCa might interact with JNK and MAPK1 pathways, modulating cell death.
In a nutrient-rich environment with growth factor stimulation, MTORC1—stimulated by upstream AKT/PKB and MAPK1/ERK2-MAPK3/ERK1—suppresses autophagy in healthy epithelial cells [Citation42]. Recent studies have highlighted the intricate crosstalk between autophagy and apoptosis. For instance, inhibiting macroautophagy by silencing autophagy-related proteins (like Atg5, Atg6/Beclin-1, Atg10 or Atg12) or using pharmacological agents, disrupting autophagolysosome formation (e.g. 3-methyladenine, hydroxychloroquine, bafilomycin A1 or monensin), has been shown to enhance apoptosis-induced cell death due to reduced mitochondrial membrane stabilisation or caspase inhibition [Citation43]. The autophagy-related protein Atg5 plays a central role in this process. Calpain-mediated cleavage of Atg5 can shift signalling towards autophagy or apoptosis [Citation44]. Furthermore, mitochondria-associated proteins may mediate this interplay between autophagic and apoptotic pathways. For instance, calpain-cleaved Atg5 interacts with the mitochondrial membrane-bound complex of Beclin-1 and anti-apoptotic Bcl-2, determining the shift towards autophagy or apoptosis. Both Beclin-1 and ULK1 are direct substrates of AKT and play integral roles in autophagosome formation. Recent evidence suggests that the intersection between autophagic cell death and apoptosis might indeed occur at the mitochondria [Citation45], potentially via mTORC1 and Akt pathways [Citation46,Citation47]. In colon cancer studies, JNK activation was essential for upregulating Atg5 and Beclin-1, inducing autophagy-mediated cell death [Citation48]. Moreover, Atg5-dependent autophagosome formation and caspase-independent cell death in fibroblasts in response to oncogenic H-ras was found to be solely Rac1/MKK7/JNK/c-Jun-dependent, bypassing the EKR (MAPK1) or p38 MAPK pathways [Citation4]. Conversely, MAPK/p38 was found to negatively regulate ATG5, thus inhibiting autophagy [Citation49].
ULK1 is not only crucial for macroautophagy initiation but also promotes mitophagy. It plays a central role in the selective degradation of mitochondria by autophagy. ULK1 translocates to fragmented mitochondria to phosphorylate and stabilise mitochondrial proteins BNIP3 and FUNDC1, promoting their binding to LC3, which is essential for mitophagy initiation and damaged mitochondria clearance [Citation50,Citation51]. Under hypoxic conditions, BNIP3 is also phosphorylated and stabilized by JNK1/2 (c-Jun N-terminal kinase 1/2), resulting in further LC3 binding [Citation52]. Thus, miR-141 rescue inducing JNK signalling could potentially activate ULK1 or directly promote mitophagy via the JNK–BNIP3–LC3 pathway. In contrast, MAPK1 (ERK2) activation might suppress mitophagy by phosphorylating ULK1, leading to its degradation, as observed in breast cancer bone metastasis. This attenuation of mitophagy enhances the metastatic potential of cancer cells [Citation12].
While blocking apoptosis in cancer cells can lead to over-activated autophagy, excessive autophagy can culminate in autophagic cell death. Numerous studies have found that impaired apoptosis and chemotherapy resistance in cancer cells can be counteracted by inducing autophagy, leading to increased autophagy-related cell death [Citation41]. Mitophagy, as a mechanism to control mitochondrial damage and ROS production, is another target of cancer mutations aimed at enhancing cell survival. It is a vital process for resolving cell death, as damaged mitochondria can release harmful molecules that can damage other cells or even trigger apoptosis. Mitophagy is regulated by various factors, including autophagy genes, Bcl-2 family proteins and Akt signalling. When mitophagy is impaired, it can result in the accumulation of damaged mitochondria, furthering cancer development. Mitophagy is initiated by sensors like PINK1 and Parkin. Once damaged mitochondria are detected, they are marked for destruction by proteins such as LC3 and p62. These damaged mitochondria are then engulfed by autophagosomes and delivered to lysosomes for degradation.
The loss of miR-141 expression in PCa cells suggests that decreased hsa-miR-141 levels are beneficial for cancer cell mutations that suppress the JNK–c-Jun–Beclin-1 axis, reducing mitophagy. This leads to elevated ROS levels, causing further DNA damage and oncogenic signalling. Elevated ROS in cancer cells can induce alterations promoting survival and metastasis, including DNA damage by the mitochondrial enzyme poly(ADP-ribose) polymerase (PARP), activation of survival pathways like phosphatidylinositol 3-kinase (PI3K)/AKT and mTOR, inhibition of the pro-apoptotic pathway p53, angiogenesis promotion by vascular endothelial growth factor (VEGF) and disruption of cell adhesion by E-cadherin [Citation53].
Different oxidative conditions result in distinct phenotypes: oxidative phosphorylation and glycolytic phenotypes. The former focuses on mitochondrial biogenesis and ATP production. In contrast, under poor nutrient conditions, low oxygen, or after increased oxidative metabolism and excessive proliferation, the latter glycolytic phenotype is exhibited, leading to high lactate production, oxidative stress, and subsequent mitophagy. Elevated levels of factors like HIF-1α, NF-κB, TGF-β and JNK/AP1 are associated with the glycolytic phenotype [Citation54]. This raises questions about how PC3/LNCaP responds under low glucose conditions and how miR-141 affects JNK and NF-kB pathways. Does miR-141 rescue support or conflict with the glycolytic phenotype?
P53 plays a multifaceted role in autophagy. It promotes gluconeogenesis, essential for oxidative phosphorylation in cancer stem cells, and suppresses glycolysis, necessary for glycolytic tumour cell phenotypes with increased ROS. P53 also activates Parkin (PARK2) [Citation36]. Gain-of-function mutations in the PI3K/AKT pathway or loss-of-function PTEN mutations can lead to mTOR activation, suppressing autophagy. These changes are foundational for early tumour development, highlighting the potential significance of inhibiting autophagy during the early stages of tumour formation [Citation45]. In healthy cells, p53 activates non-specific macroautophagy by inhibiting cellular mTOR and activating AMPK via Sestrin1/2 kinases [Citation37]. Additionally, p53 serves as a transcriptional activator for several autophagy genes (atg2/4/7/10) and lysosomal cathepsin D. It also restores Beclin-1 activity by modifying Bcl2–Beclin-1 protein interactions, all of which promote autophagy. Mitophagy can also be regulated by p53, as it upregulates the BNIP3 mitophagy receptor [Citation36]. This is beneficial for cancer suppression, as seen in K-ras mutant non-small-cell lung cancer, where the accumulation of dysfunctional mitochondria due to Atg-7 deficiency resulted in p53-mediated premature proliferative arrest [Citation55]. However, during oncogenesis, autophagy reprogramming and reactivation become beneficial for cancer progression. Autophagy suppresses anti-proliferative and pro-apoptotic p53 responses, maintains mitochondrial energy-producing function despite mitochondrial ROS damage, and sustains metabolic homeostasis and survival under stress, preventing tumour progression obstruction [Citation56].
The autophagy genes ATG7, ATG12 and LC3 only partially affect mitophagy but significantly influence macroautophagy. Mitophagy activation primarily proceeds through the conventional pathway via ATG5, serving as mitochondrial QC, as demonstrated by ATG5 deficiency studies. ATG5 is essential for PINK1–PARK2-related mitophagy [Citation5–8,Citation49]. Whether canonical or alternative (via RAB9) mitophagy occurs depends on the cell type and physiological conditions, most likely [Citation13]. Stress-induced mitophagy likely utilises the canonical pathway and is ATG5 and LC3 dependent. In contrast, starvation and hypoxia-induced mitophagy depend on the alternative RAB9 pathway, mediated via MAPK1/ERK2 and MAPK14 pathways [Citation13]. In our experiments, miR-141 activates the MAPK8/JNK pathway, which requires BNIP3L and possibly LC3. Under starvation conditions, mitophagy should be due to MAPK1 and either Parkin2 or BNIP3L-dependent interaction. We observed that mitophagy flux was induced by miR-141 mimic alone only in p53(+/+) LNCaP cells, while it required starvation to boost in the same cell line and even for initiation in the p53(−/−) cell line. Given the lost PTEN and high MAPK1 expression in both cell lines [Citation57–60], it is likely that Beclin-1, ULK1 and BCIP3L are present for macroautophagy to function, but the PTEN-dependent PINK1/Parkin2 pathway is less prominent. Thus, miR-141 mimic-induced JNK/c-JUN potentially phosphorylates Beclin-1 and LC3. This aligns with our findings of miR-141-induced LC3 expression in LNCaP but not in PC3 cells. On the other hand, high MAPK1 suppressed macroautophagy in both cell lines, and this was starvation (likely mTor) dependent. MAPK1 also suppressed mitophagy flux in both cell lines. While this phenomenon fluctuated in LNCaP, it was stable in PC3 cells, aligning with MAPK1-dependent induction of LC3 in LNCaP cells and MAPK1-dependent suppression in PC3 cells. Given that MAPK1 is essential for starvation-mitophagy in regular starving epithelia, following the alternative RAB8 pathway, we conclude that in advanced metastatic PCa in the AR refractory stage, as represented by the PC3 cell line, mitophagy dependency by MAPK1 is turned off. The mode of action of MAPK1 remains elusive, but there is evidence suggesting it promotes ULK1 degradation [Citation12], essential for both macroautophagy and specific mitophagy. MAPK1 overexpression combined with disrupted apoptosis provides a survival advantage for refractory metastatic cancer. In this context, p53 null PC3 cells serve as an excellent model, showcasing perturbed apoptotic and starvation mitotic pathways. However, miR-141 rescue could be therapeutically beneficial for patient genotypes corresponding to this model. This is a simplification, as miR-141 rescue indeed restores mitophagy and could potentially increase the demise of these highly damaged cancer cells. Additionally, MAPK1 silencing combined with starvation likely induced autophagic cell death, further supporting MAPK1’s role as an autophagy suppressor in this scenario.
Conclusions
Our study underscores the pivotal role of miR-141 in the regulation of mitophagy in PCa cells, particularly in the context of p53 status. The intricate interplay between miR-141 and the MAPK8/JNK and MAPK1 pathways highlights the complexity of autophagy regulation in cancer. The differential responses of LNCaP and PC3 cell lines to miR-141 mimic, especially under starvation conditions, emphasise the nuanced roles of MAPK1 in autophagy and mitophagy. Our findings suggest that the restoration of miR-141 expression could offer a promising therapeutic avenue for specific PCa genotypes, especially those that mirror the characteristics of the PC3 cell line. Furthermore, the potential of MAPK1 as a therapeutic target, given its suppressive role in autophagy, warrants deeper exploration. As cancer cells continually evolve strategies to evade cell death, understanding and targeting the molecular mechanisms underpinning autophagy and mitophagy could pave the way for more effective cancer treatments.
Author contributions
KT is the project PI and acquired National Science Fund Grant; KT and SH conceived and designed the study; RT conducted all the experiments with partial contribution help from IT. Statistical analysis was done by RT. Bioinformatic analysis was done by SH. Analysis and interpretation of data and the drafting of the paper were conducted by RT, KT and SH; paper critical revision for intellectual content and the final approval of the version to be published were done by KT and SH; corrections were discussed with all co-authors and all authors agree to be accountable for all aspects of the work.
Disclosure statement
The authors declare that they have no conflict of interest.
Data availability statement
The data that support the findings of this study are available from the corresponding author, KT, upon reasonable request.
Additional information
Funding
References
- Sung H, Ferlay J, Siegel RL, et al. Global cancer statistics 2020: GLOBOCAN estimates of incidence and mortality worldwide for 36 cancers in 185 countries. CA Cancer J Clin. 2021;71(3):1–16. doi: 10.3322/caac.21660.
- Kumar B, Koul S, Khandrika L, et al. Oxidative stress is inherent in prostate cancer cells and is required for aggressive phenotype. Cancer Res. 2008;68(6):1777–1785. doi: 10.1158/0008-5472.CAN-07-5259.
- Hayrabedyan S, Todorova K, Zasheva D, et al. Haberlea rhodopensis has potential as a new drug source based on its broad biological modalities. Biotechnol Biotechnol Equip. 2013;27(1):3553–3560.
- Zhou YY, Li Y, Jiang WQ, et al. MAPK/JNK signalling: a potential autophagy regulation pathway. Biosci Rep. 2015;35(3):e00199.
- Vara-Perez M, Felipe-Abrio B, Agostinis P. Mitophagy in cancer: a tale of adaptation. Cells. 2019;8(5):493. doi: 10.3390/cells8050493.
- Durcan TM, Fon EA. The three ‘P’s of mitophagy: PARKIN, PINK1, and post-translational modifications. Genes Dev. 2015;29(10):989–999. doi: 10.1101/gad.262758.115.
- Iorio R, Celenza G, Petricca S. Mitophagy: molecular mechanisms, new concepts on Parkin activation and the emerging role of AMPK/ULK1 axis. Cells. 2021;11(1):30. doi: 10.3390/cells11010030.
- Belousov DM, Mikhaylenko EV, Somasundaram SG, et al. The dawn of mitophagy: what do we know by now? Curr Neuropharmacol. 2021;19(2):170–192. doi: 10.2174/1570159X18666200522202319.
- Yang Z, Klionsky DJ. An overview of the molecular mechanism of autophagy. Curr Top Microbiol Immunol. 2009;335:1–32. doi: 10.1007/978-3-642-00302-8_1.
- Deas E, Wood NW, Plun-Favreau H. Mitophagy and Parkinson’s disease: the PINK1–Parkin link. Biochim Biophys Acta. 2011;1813(4):623–633. doi: 10.1016/j.bbamcr.2010.08.007.
- Farrow JM, Yang JC, Evans CP. Autophagy as a modulator and target in prostate cancer. Nat Rev Urol. 2014;11(9):508–516. doi: 10.1038/nrurol.2014.196.
- Deng R, Zhang HL, Huang JH, et al. MAPK1/3 kinase-dependent ULK1 degradation attenuates mitophagy and promotes breast cancer bone metastasis. Autophagy. 2021;17(10):3011–3029. doi: 10.1080/15548627.2020.1850609.
- Hirota Y, Yamashita S. I, Kurihara Y, et al. Mitophagy is primarily due to alternative autophagy and requires the MAPK1 and MAPK14 signaling pathways. Autophagy. 2015;11(2):332–343. doi: 10.1080/15548627.2015.1023047.
- Ji J, Qin Y, Ren J, et al. Mitochondria-related miR-141-3p contributes to mitochondrial dysfunction in HFD-induced obesity by inhibiting PTEN. Sci Rep. 2015;5(1):16262. doi: 10.1038/srep16262.
- Xu F, Hu Y, Gao J, et al. HIF-1α/Malat1/miR-141 axis activates autophagy to increase proliferation, migration, and invasion in triple-negative breast cancer. Curr Cancer Drug Targets. 2023;23(5):363–378. doi: 10.2174/1568009623666221228104833.
- Liu C, Liu R, Zhang D, et al. MicroRNA-141 suppresses prostate cancer stem cells and metastasis by targeting a cohort of pro-metastasis genes. Nat Commun. 2017;8(1):14270. doi: 10.1038/ncomms14270.
- Xu S, Ge J, Zhang Z, et al. miR-141 inhibits prostatic cancer cell proliferation and migration, and induces cell apoptosis via targeting of RUNX1. Oncol Rep. 2018;39(3):1454–1460. doi: 10.3892/or.2018.6209.
- Richardsen E, Andersen S, Melbø-Jørgensen C, et al. MicroRNA 141 is associated to outcome and aggressive tumor characteristics in prostate cancer. Sci Rep. 2019;9(1):386. doi: 10.1038/s41598-018-36854-7.
- Li X, Liu B, Wang S, et al. MiR-141-3p promotes malignant progression in prostate cancer through AlkB homolog 5-mediated m6A modification of protein arginine methyltransferase 6. Chin J Physiol. 2023;66(1):43–51. doi: 10.4103/cjop.CJOP-D-22-00071.
- Jou AFJ, Lu CH, Ou YC, et al. Diagnosing the miR-141 prostate cancer biomarker using nucleic acid-functionalized CdSe/ZnS QDs and telomerase. Chem Sci. 2015;6(1):659–665. doi: 10.1039/c4sc02104e.
- Porzycki P, Ciszkowicz E, Semik M, et al. Combination of three miRNA (miR-141, miR-21, and miR-375) as potential diagnostic tool for prostate cancer recognition. Int Urol Nephrol. 2018;50(9):1619–1626. doi: 10.1007/s11255-018-1938-2.
- Ye Y, Yuan XH, Wang JJ, et al. The diagnostic value of miRNA-141 in prostate cancer: a systematic review and PRISMA-compliant meta-analysis. Medicine. 2020;99(22):e19993. doi: 10.1097/MD.0000000000019993.
- Corcelle EA, Puustinen P, Jäättelä M. Apoptosis and autophagy: targeting autophagy signalling in cancer cells—‘trick or treats’? FEBS J. 2009;276(21):6084–6096. doi: 10.1111/j.1742-4658.2009.07332.x.
- Hippert MM, O'Toole PS, Thorburn A. Autophagy in cancer: good, bad, or both? Cancer Res. 2006;66(19):9349–9351. doi: 10.1158/0008-5472.CAN-06-1597.
- Kondo Y, Kanzawa T, Sawaya R, et al. The role of autophagy in cancer development and response to therapy. Nat Rev Cancer. 2005;5(9):726–734. doi: 10.1038/nrc1692.
- Kung HJ. Targeting tyrosine kinases and autophagy in prostate cancer. Horm Cancer. 2011;2(1):38–46. doi: 10.1007/s12672-010-0053-3.
- Bristol ML, Emery SM, Maycotte P, et al. Autophagy inhibition for chemosensitization and radiosensitization in cancer: do the preclinical data support this therapeutic strategy? J Pharmacol Exp Ther. 2013;344(3):544–552. doi: 10.1124/jpet.112.199802.
- Kumano M, Furukawa J, Shiota M, et al. Cotargeting stress-activated Hsp27 and autophagy as a combinatorial strategy to amplify endoplasmic reticular stress in prostate cancer. Mol Cancer Ther. 2012;11(8):1661–1671. doi: 10.1158/1535-7163.MCT-12-0072.
- Lamoureux F, Thomas C, Crafter C, et al. Blocked autophagy using lysosomotropic agents sensitizes resistant prostate tumor cells to the novel akt inhibitor AZD5363. Clin Cancer Res. 2013;19(4):833–844. doi: 10.1158/1078-0432.CCR-12-3114.
- Yu L, Tumati V, Tseng SF, et al. DAB2IP regulates autophagy in prostate cancer in response to combined treatment of radiation and a DNA-PKcs inhibitor. Neoplasia. 2012;14(12):1203–1212. doi: 10.1593/neo.121310.
- Todorova K, Metodiev MV, Metodieva G, et al. miR-204 is dysregulated in metastatic prostate cancer in vitro. Mol Carcinog. 2016;55(2):131–147. doi: 10.1002/mc.22263.
- De Coster W, Rademakers R. NanoPack2: population-scale evaluation of long-read sequencing data. Bioinformatics. 2023;39(5):btad311. doi: 10.1093/bioinformatics/btad311.
- Li H. Minimap2: pairwise alignment for nucleotide sequences. Bioinformatics. 2018;34(18):3094–3100. doi: 10.1093/bioinformatics/bty191.
- Iwashita H, Torii S, Nagahora N, et al. Live cell imaging of mitochondrial autophagy with a novel fluorescent small molecule. ACS Chem Biol. 2017;12(10):2546–2551. doi: 10.1021/acschembio.7b00647.
- Iwashita H, Sakurai HT, Nagahora N, et al. Small fluorescent molecules for monitoring autophagic flux. FEBS Lett. 2018;592(4):559–567. doi: 10.1002/1873-3468.12979.
- Wang H, Guo M, Wei H, et al. Targeting p53 pathways: mechanisms, structures, and advances in therapy. Signal Transduct Target Ther. 2023;8(1):92.
- Shen S, Shao Y, Li C. Different types of cell death and their shift in shaping disease. Cell Death Discov. 2023;9(1):284. doi: 10.1038/s41420-023-01581-0.
- Yogev O, Goldberg R, Anzi S, et al. Jun proteins are starvation-regulated inhibitors of autophagy. Cancer Res. 2010;70(6):2318–2327. doi: 10.1158/0008-5472.CAN-09-3408.
- Zhu X, Zhou M, Liu G, et al. Autophagy activated by the c-Jun N-terminal kinase-mediated pathway protects human prostate cancer PC3 cells from celecoxib-induced apoptosis. Exp Ther Med. 2017;13(5):2348–2354. doi: 10.3892/etm.2017.4287.
- Sun T, Li D, Wang L, et al. c-Jun NH2-terminal kinase activation is essential for up-regulation of LC3 during ceramide-induced autophagy in human nasopharyngeal carcinoma cells. J Transl Med. 2011;9(1):161. doi: 10.1186/1479-5876-9-161.
- Das S, Shukla N, Singh SS, et al. Mechanism of interaction between autophagy and apoptosis in cancer. Apoptosis. 2021;26(9–10):512–533. doi: 10.1007/s10495-021-01687-9.
- Williams T, Forsberg LJ, Viollet B, et al. Basal autophagy induction without AMP-activated protein kinase under low glucose conditions. Autophagy. 2009;5(8):1155–1165. doi: 10.4161/auto.5.8.10090.
- Boya P, González-Polo RA, Casares N, et al. Inhibition of macroautophagy triggers apoptosis. Mol Cell Biol. 2005;25(3):1025–1040. doi: 10.1128/MCB.25.3.1025-1040.2005.
- Rubinstein AD, Eisenstein M, Ber Y, et al. The autophagy protein Atg12 associates with antiapoptotic bcl-2 family members to promote mitochondrial apoptosis. Mol Cell. 2011;44(5):698–709. doi: 10.1016/j.molcel.2011.10.014.
- Noguchi M, Hirata N, Tanaka T, et al. Autophagy as a modulator of cell death machinery. Cell Death Dis. 2020;11(7):517. doi: 10.1038/s41419-020-2724-5.
- Noguchi M, Hirata N, Suizu F. The links between AKT and two intracellular proteolytic Cascades: ubiquitination and autophagy. Biochim Biophys Acta. 2014;1846(2):342–352. doi: 10.1016/j.bbcan.2014.07.013.
- Matsuda-Lennikov M, Suizu F, Hirata N, et al. Lysosomal interaction of Akt with Phafin2: a critical step in the induction of autophagy. PLoS One. 2014;9(1):e79795. doi: 10.1371/journal.pone.0079795.
- Xie CM, Chan WY, Yu S, et al. Bufalin induces autophagy-mediated cell death in human Colon cancer cells through reactive oxygen species generation and JNK activation. Free Radic Biol Med. 2011;51(7):1365–1375. doi: 10.1016/j.freeradbiomed.2011.06.016.
- Klionsky DJ, Abdel-Aziz AK, Abdelfatah S, et al. Guidelines for the use and interpretation of assays for monitoring autophagy (4th edition). Autophagy. 2021;17(1):1–382. doi: 10.1080/15548627.2020.1797280.
- Wu W, Tian W, Hu Z, et al. ULK1 translocates to mitochondria and phosphorylates FUNDC1 to regulate mitophagy. EMBO Rep. 2014;15(5):566–575. doi: 10.1002/embr.201438501.
- Poole LP, Bock-Hughes A, Berardi DE, et al. ULK1 promotes mitophagy via phosphorylation and stabilization of BNIP3. Sci Rep. 2021;11(1):20526. doi: 10.1038/s41598-021-00170-4.
- He YL, Li J, Gong SH, et al. BNIP3 phosphorylation by JNK1/2 promotes mitophagy via enhancing its stability under hypoxia. Cell Death Dis. 2022;13(11):966. doi: 10.1038/s41419-022-05418-z.
- Jung S, Jeong H, Yu SW. Autophagy as a decisive process for cell death. Exp Mol Med. 2020;52(6):921–930. doi: 10.1038/s12276-020-0455-4.
- El Hout M, Cosialls E, Mehrpour M, et al. Crosstalk between autophagy and metabolic regulation of cancer stem cells. Mol Cancer. 2020;19(1):27. doi: 10.1186/s12943-019-1126-8.
- Guo JY, Karsli-Uzunbas G, Mathew R, et al. Autophagy suppresses progression of K-ras-induced lung tumors to oncocytomas and maintains lipid homeostasis. Genes Dev. 2013;27(13):1447–1461. doi: 10.1101/gad.219642.113.
- Guo JY, Xia B, White E. Autophagy-mediated tumor promotion. Cell. 2013;155(6):1216–1219. doi: 10.1016/j.cell.2013.11.019.
- Qi W, Cooke LS, Stejskal A, et al. MP470, a novel receptor tyrosine kinase inhibitor, in combination with Erlotinib inhibits the HER family/PI3K/akt pathway and tumor growth in prostate cancer. BMC Cancer. 2009;9(1):142. doi: 10.1186/1471-2407-9-142.
- Chetram MA, Odero-Marah V, Hinton CV. Loss of PTEN permits CXCR4-Mediated tumorigenesis through ERK1/2 in prostate cancer cells. Mol Cancer Res. 2011;9(1):90–102. doi: 10.1158/1541-7786.MCR-10-0235.
- Jamaspishvili T, Patel PG, Niu Y, et al. Risk stratification of prostate cancer through quantitative assessment of PTEN loss (qPTEN). J Natl Cancer Inst. 2020;112(11):1098–1104. doi: 10.1093/jnci/djaa032.
- Gioeli D, Mandell JW, Petroni GR, et al. Activation of mitogen-activated protein kinase associated with prostate cancer progression. Cancer Res. 1999;59(2):279–284.