
 ?Mathematical formulae have been encoded as MathML and are displayed in this HTML version using MathJax in order to improve their display. Uncheck the box to turn MathJax off. This feature requires Javascript. Click on a formula to zoom.
Abstract
This study uniquely addresses declining business profitability because of a lack of coordinated meetings between the public and private sectors. We determine optimal meeting frequency (i.e., the highest number of regularly scheduled meetings of the Standing Committee of the inter-agency coordination per year at which profit can be maximised) for poorly functioning public–private partnership (PPP) industries (i.e., their average return on assets or ROA < 0). The tourism industry in emerging countries such as Laos provides an example of a PPP. Using two-person Nash bargaining theory and given budget constraints, we find that the government should conduct bimonthly meetings to improve PPP industry competitiveness. We believe that our study makes a significant contribution to the literature because few emerging studies use mathematical models to address the problem of public and private sector meeting frequency and collaboration.
1. Introduction
Inter-agency coordination can be ‘a vehicle for change’; that is, the concerning agencies should be ready to make adjustments to ensure customer satisfaction (Beatrice, Citation1991). This is to sustain business profitability and PPP industry competitiveness1. For the tourism industry, although the industry is profit-driven, inter-agency coordination between public and private sector entities is required to cultivate the country’s brand image.
We consider the case of inter-agency coordination in the tourism industry in emerging countries such as Laos. Based on Lao Tourism Development Strategy 2006 to 2020 (Lao National Tourism Administration, Citation2006) with special reference to a public–private partnership (PPP)2 and Porter's (Citation1990) Diamond Model3, we identify factors that lead to success with PPP industry strategies and investigate the underlying cause of weaknesses in those strategies. Specifically, a collaborative effort has been launched by the Lao government targeted at the public and private sector because, according to the Lao National Tourism Administration, (Citation2006), there is currently minimal cohesion among sectors. In fact, the government’s coordinated efforts to improve social welfare4 (Elster, Citation1982) and tourism competitiveness have been sabotaged by a lack of collaboration between the public and private sectors (Lao National Tourism Administration, Citation2006). This poor inter-agency coordination also explains the main motivation of this study. However, coordination requires infrastructure such as meeting facilities, budget, and management committees (Patrick, Madeleine, & Alan, Citation2000). An applicable example is the United Nations Inter-Agency Standing Committee, which represents the infrastructure for humanitarian aid coordination (Gostin et al., Citation2016).
Additionally, the literature documents that meetings can resolve many problems in organisations (Shin & Higa, Citation2005) including poor inter-agency coordination. Optimal meeting frequency (i.e., the highest value for the meeting frequency at which profit can be maximised) applies to the study of how meeting frequency (i.e., the number of regularly scheduled meetings of the Standing Committee of the inter-agency coordination per year) could improve poor coordination among agencies. Essentially, face-to-face meetings are more efficient than attempting to discuss and resolve problems via email (Shin & Higa, Citation2005); however, they can be difficult to coordinate because of participants, locations, and schedules (Larsen, Urry, & Axhausen, Citation2008). This study, therefore, focuses on routine administration and investigates the number of standing committee meetings per year that occur with respect to inter-agency coordination in the PPP industry. In this study, the number of the firm’s audit committee meetings with external auditors per year (Yin, Gao, Li, & Lv, Citation2012) and the number of board meetings per year (Baccouche, Hadriche, & Omri, Citation2014) are used as a proxy for meeting frequency .
We show that the evidence concerning can affect firm profitability (via the return on assets, or ROA, see equation
). Accordingly,
has strong correlation with a poorly functioning company and PPP industry (i.e., their average ROA < 0). In other words, the more active the standing committee is in inter-agency coordination, the poorer the measure of PPP industry performance. Many accounting firms observe three or four audit committee meetings5 per year (Yin et al., Citation2012). Moreover, according to Xinhua news,
‘the National Development and Reform Commission (NDRC) of China will convene an entrepreneurship and innovation conference with up to two plenary sessions a year in order to coordinate government measures to tackle major problems, tighten supervision, and mend communication between the public and private sectors’. 6
The Federal Open Market Committee (FOMC) in the United States has eight regular meetings per year (Aadland & Sterbenz, Citation2015). Should we accept the current practices for the meeting frequency, or should we consider another option that is based on the solution obtained in this study?
We identify optimal meeting frequency based on game theory and bargaining theory. Specifically, based on the negative relationship between
and ROA (Baccouche et al., Citation2014) as shown in equation
, we apply two-person Nash bargaining to determine
. The first player is represented by the government authority (player
) that is striving to improve national PPP industry competitiveness. The second player is the firm in the de facto industry (player
). We emphasise that player
’s average ROA can play a significant role in determining
. Unexpectedly, our results disagree with the recommendations of the NDRC (i.e., semi-annual meetings), the FOMC (i.e., eight coordinated meetings per year), and accounting firms (i.e., three to four meetings annually). This study, therefore, highlights the calling for change in inter-agency coordination based on
for the PPP industry and also other industries.
The main contributions of this paper include the following. First, we propose a two-person Nash bargaining equilibrium model considering budget constraints based on the Kuhn-Tucker conditions and seeking . Second, we emphasise that ROA can play a significant role in determining
by analysing and discussing specific cases. Finally, this study analyses two types of equilibria. The first is the two-person Nash bargaining equilibrium (i.e., Equation
), which captures the optimal meeting frequency given the budget constraints. The second is the Bayesian Nash equilibria (i.e., Equations
), which propose that the relevant government authority imposes measures to improve a poorly functioning PPP industry.
The remainder of this paper is organised as follows. Section 2 explains the motivation for our analysis of the bargaining problem and optimal meeting frequency. Section 3 shows the extensive form of the two-person bargaining problem. After determining the optimal meeting frequency, Section 4 discusses the implications of the findings. Finally, Section 5 presents the conclusions of our study.
2. Background and recent literature
The existing literature related to this study focuses on regularly scheduled meetings. However, research on regularly scheduled meetings using mathematical models has only begun to appear very recently, for example, Aadland and Sterbenz (Citation2015). With respect to efficiency benefits, regular meetings achieve higher efficiency than emergency meetings since regular meetings allow participants more time to parse the meeting content (Aadland & Sterbenz, Citation2015). However, we do not address emergency operations and meetings because they are beyond the scope of this study. We refer to the literature related to inter-agency coordination during emergency and disaster management such as Aros & Gibbons, Citation2018; Curnin, Owen, Paton, & Brooks, Citation2015; Peter, Karen, & Gyöngyi, Citation2017; Steven, Christine, Douglas, Cain, & David, Citation2015.
A crucial factor that influences optimal meeting frequency is the threshold value. Aadland and Sterbenz (Citation2015)’s threshold is determined by random distribution across optimal policy (e.g., the quantity changes based on oil prices and oil inventories, or the changes that occur when OPEC imposes quotas) and by inventory models. However, our threshold is raised by budget constraints and shadow prices based on two-person Nash bargaining. Therefore, our study fills the gap in the literature concerning regularly scheduled meetings.
We chose to conduct an analysis of a bargaining problem and (i.e., an optimal solution) because our methodology is based on game theory. Game theory is composed of three main features including players7, strategic moves, and outcomes. Elster (Citation1982) noted that game theory respects decisions made by rational and interacting players and is useful in the study of social and structural behaviour. Second, using game theory, we aim to solve a practical problem concerning poor coordination between a poorly functioning PPP industry (e.g., the tourism industry in Laos) and the related government authority.
In solving the problem of poor inter-agency coordination when deciding whether to determine optimal meeting frequency, we consider the potential beneficiaries; the tourism industry in Laos and in emerging countries, the accounting firms, the FOMC, and the NDRC are among suitable recipients. Consider, for example, that China has recently launched an effort to improve unproductive factories8. Consequently, several factories face a high risk of market reforms; otherwise, that of closure. Thus, the NDRC can influence the PPP industry’s low or decreased productivity by using optimal meeting frequency.
2.1. Finding the optimal meeting frequency 
Unlike other empirical studies (Baccouche et al., Citation2014; Greco, Citation2011; Sharma, Naiker, & Lee, Citation2009; Yin et al., Citation2012), this study determines for inter-agency coordination in the PPP industry. However, hypothetical questions abound as to whether
can be determined by the recommendations of accounting firms (Yin et al., Citation2012), the majority decision (Shin & Higa, Citation2005), or the negotiable result of relevant players? The latter is the focus of this study.
First, we address the link between and company profitability based on Baccouche et al. (Citation2014) and Yin et al. (Citation2012). Let
, where the value of 1 and 11 refer to the minimum and maximum meeting frequencies per year, respectively (Yin et al., Citation2012). Note that if the maximum meeting frequency (
or monthly meeting) is observed, then the budget constraint can never be imposed. However, the opposite is the case in this study. That is, we assume that budget constraints are one decisive factor in the coordination (Patrick et al., Citation2000) including the inter-agency coordination. Additionally, let
denote the average ROA in the PPP industry or player
(Baccouche et al., Citation2014). Specifically,
has a negative relationship with
(Baccouche et al., Citation2014); that is,
where
are coefficients at time
. For mathematical simplicity, regardless of time, we also assume that
(1)
(1)
Second, although Baccouche et al. (Citation2014) help us to formulate the linearisation of as shown in equation
, we still lack its optimality feature or
. This requires multi-player decision making (Basar & Jan, Citation1999) since the inter-agency coordination in the PPP industry is a multi-person game. The feature is, therefore, a Nash equilibrium (Basar & Jan, Citation1999) or the Pareto optimal (Elster, Citation1982). Additionally, we see the distinction between inter-agency coordination and PPP as follows.
2.2. Inter-agency coordination versus the public-private partnership
Based on Wang, Xiong, Wu, and Zhu (Citation2018), in addition to ensuring coordination, a PPP is a mutual agreement (i.e., mutual benefits for the partners involved) and often includes a joint program. Infrastructure investments are an example of PPP. However, inter-agency coordination/cooperation is one form of PPP (Lindsay, McQuaid, & Dutton, Citation2008). A good example is the Ministry of Defence’s ‘towers of excellence’ communities of practice that have been created in Britain whereby policy makers learn from scientific community exchanges of know-how (Merindol, Citation2005). Additionally, inter-agency coordination incorporates distinctive elements including psychological benefits as it has governance structure (Martin, Citation2016). That is, inter-agency coordination collectively facilitates the decision-making process (Wang et al., Citation2018) and also combines three ingredients of coordination: social interaction, resource sharing, and political economy outlooks (Farmakopoulou, Citation2002). Last, inter-agency coordination can tackle all issues concerning public administration (Li & Chan, Citation2009) including PPP industry competitive disadvantages.
3. Model
3.1. How players interact
Consider . As a first step, if players of the game are faced with an opportunity, player chooses to open a business given their optimistic expectations (Guardner, Citation2003). As a second step, player
now has two choices – whether to propose meeting frequency to the government authority or not. For example, according to Yin et al. (Citation2012), player
proposes three or four meetings per year9. The meeting frequency game can be solved by sub-game perfect equilibrium (Myerson, Citation1997). Specifically, player
’s decision can influence the outcome of the game based on backward induction. Note that the first payoff belongs to player
and the second payoff to player
.
Figure 1. The extensive form of the two-person bargaining game
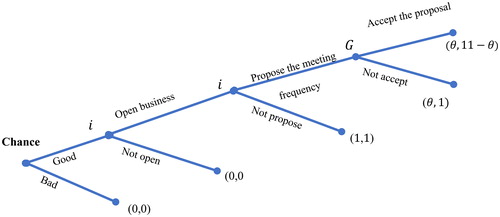
In principle, one of player ’s decision criteria are to optimise meeting frequency
. Similarly, player
’s proposal is also to maximise meeting frequency
. As with a game that has perfect information, the solution of the game is to obtain the optimal payoff or the point
. However, the disagreement point is the payoff
, which is the minimum meeting frequency. Therefore, this study attempts to tackle a bargaining problem about the meeting frequency between player
and player
regardless of bargaining power10. In other words, this game uses complete information.
3.2. Budget constraints
In this study, player ’s budget constraints (
) become
(2)
(2)
3.3. An optimal condition and the objective function
The optimised solution is typically composed of maximising or minimising an objective function. For example, we choose input values and compute optimal values of the function by using the first-order and second-order derivatives of the objective function11. Additionally, a usual definition of the bargaining problem is to seek an optimal solution. Therefore, our objective function concerns the Nash bargaining problem (Maschler, Solan, & Zamir, Citation2013). Specifically, the negotiation basis of the meeting frequency is mutually helpful if and only if . Given the two constraints in equations
and
, our objective function is to maximise a Lagrange function:
(3)
(3)
where
are the shadow price (Chiang & Wainwright, Citation2005) or the Lagrange multipliers (Sayama, Fan, & Fan, Citation1976). To conclude our results, the shadow price acts as ‘a judge’s decision’, which can influence desired or undesired outcomes. However, this interpretation is not new. For example, Sayama et al. (Citation1976) examined how to find feasible solutions based on the shadow prices. Finally, we use the notation shown in . Additionally, equation
represents the Nash equilibrium depicted by the highest point in curves in . The analytical factors in Figure 2 are provided in .
Figure 2. The objective function. The analytical parameter and the R-code are provided in and Appendix B, respectively.
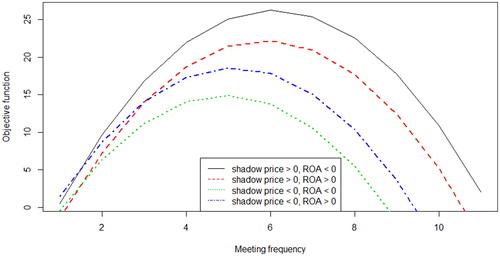
Table 1. Main notation used in the study.
Table 2. The analytical parameters based on equation
4. Solution and discussion
In this section, we analyse the bargaining game, and the Nash solution is central to our analysis. We note that most optimisation problems within a constraint possess the direct objective function property (Chiang & Wainwright, Citation2005). We seek the maximised or minimised values of a given set of parameters by using the Lagrange method. Specifically, in the non-linear setting of this study we use Kuhn-Tucker conditions, which are similar to the Lagrange method (Chiang & Wainwright, Citation2005).
4.1. Theorem. In the two-person bargaining game, the meeting frequency achieves its optimal negotiating solution if and only if
(4)
(4)
Proof.
The first-order necessary condition of the two endogenous variables , and
of the objective function (equation
) are the following:
For the case of , we find
For the case of , we find
The Kuhn-Tucker conditions (Chiang & Wainwright, Citation2005) are
We use a trial and error method to solve the Kuhn-Tucker conditions. Step 1: We suppose that the second constraint (the budget constraint) is nonbinding in the solution; that is, by complementary slackness (Chiang & Wainwright, Citation2005). We can, therefore, obtain the following equations
We solve for and yield trail answers
We see that may be profoundly satisfying the two constraints in equations
and
.
Step 2: Similar to Step 1, we make the assumption about , and obtain
The trail solutions are
Once again, can be our optimal solution. Here, we have two potential solutions including
Since the purpose of this study is to emphasise a causal relationship between and
, we only accept
as the final solution to the Kuhn-Tucker conditions.
4.2. Discussion
Based on Kuhn-Tucker conditions (Chiang & Wainwright, Citation2005), we see that is the shadow value of
, and
, which measures the rate of the change of the desired (maximum) value of
. This represents the optimality of the meeting frequency based on the shadow value. Specifically, the optimum condition, which is sufficient for equation
, is
Similarly,
We, therefore, have two sub-game perfect equilibria as optimum conditions, conditions and
. For example, if the PPP industry has the average value of
, then the optimal meeting frequency may not be necessary as Sharma et al. (Citation2009) hint that steady growth companies tend to meet less often (i.e., the condition
is satisfied). However, our study proposes that the government imposes a measure for the meeting frequency if condition
occurs (see and Appendix A). Similar to the result of Baccouche et al. (Citation2014), whenever the average value of
(i.e., poorly functioning), organising coordinated meetings six times a year or more is adequate.
In addition, the government authority (player ) can apply the Bayesian Nash equilibrium and the majority criterion to help impose the simple measure. First, the government defines two groups of PPP industry members, such as the condition
and
, to represent the PPP industry member group one as a strong performer and the group-two PPP industry member as a poor performer. Let
and
be the probability for group 1 and group 2, respectively. Additionally, based on Stewart and Munro (Citation2007), more than six meetings per year are considered unnecessary by experimental participants. Player
, therefore, has two choices (Bayesian Nash equilibria):
Next, a Bayesian Nash equilibrium exists if or
. Based on the government’s ‘strategic priority’ and the majority criterion, we can interpret
as, for example, if the number of firms in the PPP industry belonging to group two (condition
) is more than half, the government should impose a measure to organise six meetings per year to improve the PPP industry’s competitiveness.
A highly practical implication can be discussed based on the collapse of the public-private partnership-owned dam on 23 July 2018 in Southern Laos, which caused widespread damage and casualties12. The Xe-Pian Xe-Namnoy Hydroelectric Power Dam with 410 MW capacity13 is now under construction and expects to export 90% of the electric power to Thailand. However, the dam illustrates a perfect example of poor inter-agency coordination. Specifically, the villagers had been alerted only three or four hours before the Saddle dam D collapsed14 although the failure in the upper part of the Saddle occurred 24 hours earlier15. That is, regular communication (i.e., a meeting scheduled to occur six times a year) between the relevant parties had not been established and caused a communication breakdown. Apparently, we may include the under constructing PPP project as a poorly functioning one because of .
This study is concerned with Nash solutions or the government political aspect (the majority criterion). Thus, bimonthly meetings are a possible solution. However, few countries can commit to such a policy because few countries have specific functions similarly to the NDRC of China. A vital function of the NDRC16 is to ensure greater coordination between the public and private sector. Interestingly, 10 out of 15 main tasks of the NDRC require a substantial degree of coordinated effort. As a result, through the NDRC’s functions, imposing a measure to implement meeting frequency of six times per year is a plausible scenario.
However, considering the various forms of regular meeting frequency, we provide proof of the usefulness of optimal meeting frequency (Sharma et al., Citation2009) unless the content quality of the regular meeting can be created. What is the content of the meetings on inter-agency coordination in the PPP industry? Since 2002, a World Bank Group flagship report on doing business17 can address the content. Specifically, in a comparison of 190 countries, the report ranks each country according to 11 sub-indices based on business procedure, time, and cost. If Laos is designed to achieve its upper ranking18, then we propose convening bimonthly meetings. Additionally, based on the lessons from the Xe-Pian Xe-Namnoy Hydroelectric Power Dam, installing a warning system will be an additional content item of the regular meetings.
The quality of each meeting result is difficult to quantify. Many prolonged meetings produce only few tangible outcomes (Patrick et al., Citation2000). However, as Vivacqua, Garcia, and Gomes (Citation2011) note, although holding face-to-face meetings is a challenge, applying ‘ontology’19 to build sensory and emotional awareness of decision making can be an alternative. Further, Clifton and Van De Mieroop (Citation2010) examined records of President Kennedy’s meetings on the space race against the Soviets on 21 November 1962 and found that President Kennedy applied the rhetorical notion of ethos (i.e., topics of geo-politics, arousing ‘them and us’ polarity) to influence his audience. In addition, Francis (Citation1998) adopted an alternative definition of meetings in the cross-cultural context. He found that, in Papua New Guiney, to achieve the objectives of meetings, participants could make a start by searching tribal rituals (i.e., stereotypic, quasi-dramatic, and repetitive behaviours) before convening their formal meetings.
It is likely that a full investigation is required on the relevant ‘red tape’ or bureaucratic processes before we can offer suggestions for each government authority.
We recall the 80-20 rule20. Only 20% of enterprises contribute to 80% of economic performance in the PPP industry. In other words, only 20% of all firms actively participate and coordinate with government initiatives, and a lower percentage of participation is a source of governance failure (Martin, Citation2016). However, to encourage enterprise participation, we can use a Hobbesian variant of social contract theory (McCain, Citation2009). Specifically, if a firm is not a member of the PPP industry association, he risks facing Hobbes’s theory ‘the life of man, solitary, poor, nasty, brutish, and short’.
Last, the usefulness of optimal regular meeting frequency should be compared to the usefulness of emergency meetings. Although regular meetings bear considerable sunk costs (Aadland & Sterbenz, Citation2015), based on a cost-benefit analysis, the hidden costs of emergency meetings can escalate. To illustrate, during the tsunami of Banda Aceh, Indonesia in 2004, more than 70 emergency meetings were organised per week (Peter et al., Citation2017).
5. Conclusion
An important step in battling the problem of declining business profitability is determining the optimal meeting frequency of coordinated meetings. In this paper, we employ two-person Nash bargaining to guide players (i.e., the de facto industry and the government authority) to agree upon a maximised meeting frequency without side payments (i.e., contracts). Given the de facto industry’s budget constraints and the negative average value of the ROA, we determine the highest value for meeting frequency (i.e., six meetings per year) at which profit can be maximised. However, it is also asked: how can the optimal meeting frequency clearly improve profits in poorly performing PPP industries? As discussed, communication breakdown can ensure poor inter-agency coordination. The optimal meeting frequency is designed to solve the problem of poor inter-agency coordination. Additionally, given the meeting frequency has a negative relationship with ROA (Baccouche et al., Citation2014), this optimal meeting frequency thus helps perform the internal monitoring and evaluation, and acts as an effective mechanism for dealing with fraud and errors in a poorly functioning company (Yin, Gao, Li, & Lv, Citation2012). In turn, we hope our results have provided practical recommendations for improving the poorly functioning PPP industry in emerging countries and Laos. However, this study has some limitations.
Calculating a common value for optimal meeting frequency without a binding contract may be reasonable; however, it can be impractical. This is a limitation of bargaining theory. In addition, like Hudson, Hardy, Henwood, and Wistow (Citation1999), we observe that inter-agency cooperation related to the public sector is a highly abstract concept and not implementable. However, a cooperation solution with a binding agreement should be applicable.
Our optimisation method only addresses present value. Specifically, we are unable to interpret the discount rate of future value.
Future research on company profitability concerning the meeting frequency problem will focus upon a repeated game in the dynamic setting. This will involve players acting more than once, and the time path will play a role.
Table A1. The analytical parameters based on equation
Notes
1 Industry competitiveness can be deduced from firm profitability.
2 The PPP model is also known as the incomplete contract approach.
3 Based on the Diamond Model, government strategies can influence the competitive advantage of the national (tourism) industry.
4 We may interpret this as collective responsibility.
5 Probably, they use Robinstern bargaining to propose the meeting frequency.
7 There can be two or more players who interact with each other and make decisions either simultaneously or sequentially to solve the expected payoff - a form of utility – of each player based on the (best) alternative strategies.
9 This bottom-up approach can be described why Player moves first.
10 The model in this study is also tested on a case with unequal bargaining power with identical results.
11 The optimization condition is often an abstract concept. In mathematics, we can visualise an optimal point as the highest place on a hilltop or the lowest point in a valley. Sometimes we call an optimization condition ‘the quest for the best’ (Chiang AC, Wainwright K, 2005). Moreover, the optimal point on a hilltop or in a valley is called ‘local maximum or local minimum’, respectively. However, another definition exists called ‘absolute (or global) extremum’. For more details, we refer to Chiang and Wainwright (Citation2005).
16 The main functions of the NDRC can be found on the website http://en.ndrc.gov.cn/mfndrc/.
18 On 1 February 2018, the Lao Prime Minister issued decree no. 02 to improve the business environment based on the report by having follow-up quarterly meetings.
19 The ontology is based on the analysis of a series of recorded videos.
References
- Aadland, D., & Sterbenz, F. P. (2015). The economics of emergency meetings. Economic Inquiry, 53(2), 1019–1037. doi: 10.1111/ecin.12181
- Aros, S. K., & Gibbons, D. E. (2018). Exploring communication media options in an inter-organizational disaster response coordination network using agent-based simulation. European Journal of Operational Research, 269(2), 451–465. doi:10.1016/j.ejor.2018.02.013. doi: 10.1016/j.ejor.2018.02.013
- Baccouche, S., Hadriche, M., & Omri, A. (2014). Multiple directorships and board meeting frequency: Evidence from France. Applied Financial Economics, 24(14), 983–992. doi: 10.1080/09603107.2014.920475
- Basar, T., & Jan, G. (1999). Dynamic noncooperative game theory. 2nd ed. New York: Academic Press.
- Beatrice, D. F. (1991). Inter-agency coordination. Administration in Social Work, 14(4), 45–59. doi: 10.1300/J147v14n04_04
- Chiang, A. C., & Wainwright, K. (2005). Fundamental methods of mathematical economics. New York: The McGraw-Hill Companies, Inc.
- Clifton, J., & Van De Mieroop, D. (2010). Doing’ ethos: A discursive approach to the strategic deployment and negotiation of identities in meetings. Journal of Pragmatics, 42(9), 2449–2461. doi: 10.1016/j.pragma.2010.03.008
- Curnin, S., Owen, C., Paton, D., & Brooks, B. (2015). A theoretical framework for negotiating the path of emergency management multi-agency coordination. Applied Ergonomics, 47, 300–307. doi: 10.1016/j.apergo.2014.10.014
- Elster, J. (1982). Marxism, functionalism, and game theory: A debate. Theory and Society, 11(4), 453–482. doi: 10.1007/bf00162324
- Farmakopoulou, N. (2002). Using an integrated theoretical framework for understanding inter-agency collaboration in the special educational needs field. European Journal of Special Needs Education, 17(1), 49–59. doi: 10.1080/08856250110099015
- Francis, D. (1998). A voice in the wilderness: Meetings as ritual in a cross-cultural context. International Journal of Qualitative Studies in Education, 11(4), 583–601. doi: 10.1080/095183998236485
- Gostin, L. O., Tomori, O., Wibulpolprasert, S., Jha, A. K., Frenk, J., Moon, S., … Leung, G. M. (2016). Toward a common secure future: Four global commissions in the wake of Ebola. PLOS Medicine, 13(5), e1002042. doi: 10.1371/journal.pmed.1002042
- Greco, G. (2011). Determinants of board and audit committee meeting frequency: Evidence from Italian companies. Managerial Auditing Journal, 26(3), 208–229. doi: 10.1108/02686901111113172
- Guardner, R. (2003). Games for business and economics. New York: Wiley.
- Hudson, B., Hardy, B., Henwood, M., & Wistow, G. (1999). In pursuit of inter-agency collaboration in the public sector. Public Management: An International Journal of Research and Theory, 1(2), 235–260. doi: 10.1080/14719039900000005
- Lao National Tourism Administration. (2006). Lao PDR Tourism Strategy 2006-2020. Vientiane. Retrieved from https://www.tourismlaos.org/files/files/Lao%20PDR%20Tourism%20Strategy%202006-2020%20in%20English.pdf.
- Larsen, J., Urry, J., & Axhausen, K. (2008). Coordinating face-to-face meetings in mobile network societies. Information, Communication & Society, 11(5), 640–658. doi: 10.1080/13691180802126752
- Li, W., & Chan, H. S. (2009). Clean air in urban China: The case of inter-agency coordination in chongqing's blue sky program. Public Administration and Development, 29(1), 55–67. doi: 10.1002/pad.501
- Lindsay, C., McQuaid, R. W., & Dutton, M. (2008). Inter-agency cooperation and new approaches to employability. Social Policy & Administration, 42(7), 715–732. doi: 10.1111/j.1467-9515.2008.00634.x
- Martin, Q. (2016). Activation reform and inter-agency co-operation – Local consequences of mixed modes of governance in Sweden. Social Policy & Administration, 50(1), 19–38. doi: 10.1111/spol.12124
- Maschler, M., Solan, E., & Zamir, S. (2013). Game theory. Cambridge: Cambridge University Press.
- McCain, R. A. (2009). Game theory and public policy. London, UK: Edward Elgar Publishing Ltd.
- Merindol, V. (2005). Defense RDT&E and knowledge management: A new enquiry into public and public‐private coordination. Defense & Security Analysis, 21(2), 159–177. doi: 10.1080/1475179052000343991
- Myerson, R. B. (1997). Game theory: Analysis of conflict. Cambridge, MA: Harvard University Press.
- Patrick, E., Madeleine, A., & Alan, D. (2000). Inter-professional collaboration and conceptualisations of practice. Children & Society, 14(5), 355–367. doi: 10.1111/j.1099-0860.2000.tb00190.x
- Peter, T., Karen, S., & Gyöngyi, K. (2017). The humanitarian common logistic operating picture: A solution to the inter-agency coordination challenge. Disasters, 41(1), 77–100. doi: 10.1111/disa.12193
- Porter, M. E. (1990). The competitive advantage of nations. New York: The Free Press.
- Sayama, H., Fan, L. T., & Fan, L. S. (1976). On Lagrange multipliers and constraints I. Lagrangian approach. International Journal of Systems Science, 7(11), 1283–1298. doi: 10.1080/00207727608942004
- Sharma, V., Naiker, V., & Lee, B. (2009). Determinants of audit committee meeting frequency: Evidence from a voluntary governance system. Accounting Horizons, 23(3), 245–263. doi: 10.2308/acch.2009.23.3.245
- Shin, B., & Higa, K. (2005). Meeting scheduling: Face-to-face, automatic scheduler, and email based coordination. Journal of Organizational Computing and Electronic Commerce, 15(2), 137–159. doi: 10.1207/s15327744joce1502_3
- Steven, C., Christine, O., Douglas, P., Cain, T., & David, P. (2015). Role clarity, Swift trust and multi-agency coordination. Journal of Contingencies and Crisis Management, 23(1), 29–35. doi: 10.1111/1468-5973.12072
- Stewart, J., & Munro, L. (2007). The impact of audit committee existence and audit committee meeting frequency on the external audit: Perceptions of Australian auditors. International Journal of Auditing, 11(1), 51–69. doi: 10.1111/j.1099-1123.2007.00356.x
- Vivacqua, A. S., Garcia, A. C. B., & Gomes, A. (2011). BOO: Behavior-oriented ontology to describe participant dynamics in collocated design meetings. Expert Systems with Applications, 38(2), 1139–1147. doi: 10.1016/j.eswa.2010.05.007
- Wang, H., Xiong, W., Wu, G., & Zhu, D. (2018). Public-private partnership in Public Administration discipline: A literature review. Public Management Review, 20(2), 293–316. doi: 10.1080/14719037.2017.1313445
- Yin, F., Gao, S., Li, W., & Lv, H. (2012). Determinants of audit committee meeting frequency: Evidence from Chinese listed companies. Managerial Auditing Journal, 27(4), 425–444. doi: 10.1108/02686901211218003
Appendix A. The R-code of
The R-code:
##### Shadow price
roa = seq(−0.152, 0.266,len = 10)
theta = 1
##
lambda = 2*(5.5-theta)/(roa)
lambda
lm1 = data.frame(roa,lambda)
plot(lm1,type=‘l’,xlab=‘ROA’,ylab=‘Shadow value’,
ylim = c(-711,553),col=‘1’,lty = 1)
##
lambda2 = 2*(5.5-5.5)/(roa)
lambda2
lm2 = data.frame(roa,lambda2)
lines(lm2,type=‘l’,col=‘2’,lty = 2,lwd = 2)
##
lambda3 = 2*(5.5-6)/(roa)
lambda3
lm3 = data.frame(roa,lambda3)
lines(lm3,type=‘l’,col=‘3’,lty = 3,lwd = 2)
##
lambda4 = 2*(5.5-9)/(roa)
lambda4
lm4 = data.frame(roa,lambda4)
lines(lm4,type=‘l’,col=‘4’,lty = 4,lwd = 2)
##
legend(‘bottomright’,legend = c(‘1 meeting per year’,’5.5 meetings per year’,
‘6 meetings per year’,’9 meetings per year’),
col = c(‘1’, ‘2’, ‘3’, ‘4’), lty = 1:4)
Appendix B. The R-code of
##### Objective function
R= −0.152
theta = c(1:11)
lambda = 1
b1= −3.755
B = 8*R
##L
L=(10-theta)*(theta-1)+lambda*(theta + b1*R)+lambda*(B-theta*R)
L
plot(L,type=‘l’,xlab=‘Meeting frequency’,ylab=‘Objective function’,col=‘1’,lty = 1)
##L2
L2=(10-theta)*(theta-1)+lambda*(theta + b1*0.266)+lambda*(B-theta*0.266)
L2
lines(L2,type=‘l’,col=‘2’,lty = 2,lwd = 2)
##L3
lambda2=-1
L3=(10-theta)*(theta-1)+lambda2*(theta + b1*R)+lambda2*(B-theta*R)
L3
lines(L3,type=‘l’,col=‘3’,lty = 3,lwd = 2)
##L4
lambda2=-1
L4=(10-theta)*(theta-1)+lambda2*(theta + b1*0.266)+lambda2*(B-theta*0.266)
L4
lines(L4,type=‘l’,col=‘4’,lty = 4,lwd = 2)
##
legend(‘bottom’,legend = c(‘shadow price > 0, ROA < 0’,’shadow price > 0, ROA > 0’,
‘shadow price < 0, ROA < 0’,’shadow price < 0, ROA > 0’),
col = c(‘1’, ‘2’, ‘3’, ‘4’), lty = 1:4)