
Abstract
Cultural tourism is a fundamental element for the economic development of some local communities. There are many factors that can influence the success of this type of tourism, but any action or strategy implemented should be closely tied to ensuring tourist satisfaction. This research focuses on a heritage destination of an archaeological nature, and aims to analyse the destination image formation as well as the influence of this image on tourist satisfaction. The results show that the affective component is more relevant than the cognitive in the image of this destination formed by the tourist. The data were collected by means of a closed-ended questionnaire administered to tourists aged 18 and over, and were analysed using P.L.S.-S.E.M. methodology. These analyses provide useful information for the planning of future tourism marketing strategies; to that end, recommendations have been made regarding how to improve the provision of services and the management of these types of heritage sites.
1. Introduction
The importance of tourism in Spain is reflected in the number of foreign tourist arrivals to this country; according to data collected by the Ministry of Energy and Tourism (Citation2018), this figure surpassed 82 million in 2017, which represents an increase of 8.9% over the previous year. However, the influx of tourists is due not only to traditional sun and beach tourism, but also to cultural tourism. The development of this type tourism – particularly heritage tourism – has been very successful in this country. Nevertheless, despite being a country with a wealth of heritage sites, sun and beach destinations continue to take center stage. This increase in international tourism in recent decades and growing competition between destinations has sparked interest in improving, managing, and presenting a positive destination image. In the case of an archaeological heritage destination, such as the one that is the focus of this study, it is necessary to analyse the image formed by tourists and how this influences their post-visit satisfaction. This will enable such destinations to improve the aspects that attract the greatest number of visitors. The ultimate aim is to ensure that these cultural destinations are seen as an alternative to the traditional sun and beach destinations.
Creating a differentiated destination image has become essential to standing out in today’s competitive global market, where competition between destinations is intense (Qu, Kim, & Im, Citation2011). Destination image is a fundamental factor in travellers’ selection of a destination, since it influences their behavior (Gunn, Citation1972; Gartner, Citation1994; Bigné, Sánchez & Sánchez, 2001; Carballo, Araña, León, & Moreno-Gil, Citation2015). In this context, ‘image’ can be defined as mental concept formed from a set of impressions (Beerli & Martín, Citation2004): there is a cognitive element to the image created in the minds of tourists that depends on the quality and quantity of available information. In contrast, the affective part of the image is formed on the basis of each individual’s characteristics (Beerli & Martín, Citation2004). If a tourist takes into account both the cognitive and affective dimensions of the image, they will allow him/her to make a general assessment of the destination, on the basis of prior knowledge and beliefs about the place as well as his/her feelings towards it (Baloglu & Brinberg, Citation1997).
The literature attributes greater importance to the cognitive image (Baloglu & Brinberg, Citation1997; Pike, Citation2002; Pike & Ryan, Citation2004; Chi & Qu, Citation2008; Stepchenkova & Morrison, Citation2008; Sun, Chi, & Xu, Citation2013), and even its influence on the affective element, with the latter acting as an intermediary between the cognitive image and the overall image (Baloglu & McCleary, Citation1999; Beerli & Martin, 2004).
On the other hand, a review of the tourism literature has revealed the relationship between destination image and tourist satisfaction (Bigné, Sanchez, & Sanchez, Citation2001). Several studies (e.g., Chi & Qu, Citation2008) have shown that the more positive the image of the destination, the greater the level of satisfaction. Similarly, other studies on tourist destination image confirm that it is a critical factor in tourist satisfaction (Fakeye & Crompton, Citation1991).
In light of the above, the present study aims to develop and test a theoretical model of destination image formation, aimed at enabling a detailed analysis of the influence of its different components, i.e., cognitive and affective. An in-depth examination of these two components of the image will be carried out, so as ultimately to determine the extent to which they influence the formation of the overall destination image. The study will also explore how the latter influences tourist satisfaction after the visit. This conceptual model seeks to fill a gap in the literature regarding the role played by the image of such a specific destination, namely an archaeological site, as no studies to date have analysed image formation in relation to this type of destination. The data were collected at Segóbriga Archaeological Park, in the province of Cuenca (Spain), a cultural destination based on an archaeological heritage site regarded as one of the best preserved Roman cities in the Western Roman Empire. Tourists to the park can first take a tour of the most intact structures at the heritage site (walls, thermal baths, theater, amphitheater, basilica, circus, forum, necropolis, etc.). They can then visit the interpretation center, which offers tourists an idea of what the ancient city was like. The site was granted the status of archaeological park in order to promote tourism in the area and thereby boost the local economy.
2. Conceptual framework
2.1. Destination image
The image is a fundamental element in the promotion of tourism destinations, since what differentiates one destination from another is key to its success (Carballo et al., Citation2015). The importance of this concept has led to a growing body of research on tourism destinations (Gallarza, Saura & García, 2002), much of which builds on the work of Hunt (Citation1971), (Gartner & Hunt, Citation1987; Embacher & Buttle, Citation1989; Echtner & Ritchie, Citation1991; Fakeye & Crompton, Citation1991). The significance of the image in driving the success of a given tourism destination has been explored in a large body of literature from the last four decades, with a range of studies approaching the topic from different perspectives (Deng & Li, Citation2014) ().
Table 1. Different approaches in the analysis of destination image.
One of the first studies on image formation was that by Gunn (Citation1972), which looked at only two dimensions of the formation process: the organic image and the induced image. The organic image is understood as that arising from non-commercial or uncontrolled information sources, such as the opinions of friends, magazines, newspapers, news, reports, etc. In contrast, the induced image is that proffered by commercial information sources, i.e., marketing efforts of various commercial agents to publicise a destination (Tasci & Gartner, Citation2007).
The image a tourist may have of a destination can be quite personal, as it depends on each tourist’s individual perceptions of the place (Bigné et al., Citation2001; Gallarza, Saura, & Garcı́a, Citation2002; San Martín & Del Bosque, Citation2008). Tourists’ opinions are highly subjective, since they can form their views of the same destination based on very different antecedents, which in turn depend on their individual thoughts and emotions. This has prompted many authors to investigate the components of a tourism destination image, generally emphasising the cognitive and affective components. In tourists’ minds, while the cognitive image represents their knowledge of and beliefs regarding a place, the affective image refers to their feelings or emotional responses toward it (Garther, 1993; Beerli & Martín, Citation2004; Pike & Ryan, Citation2004; Royo-Vela, Citation2009; San Martín & Del Bosque, Citation2008, San Martín Gutiérrez, & Rodríguez del Bosque, Citation2011; Smith, Li, Pan, Witte, & Doherty, Citation2015). When the affective and cognitive images are combined, it gives rise to the overall image (Baloglu & McCleary, Citation1999), which includes the individual characteristics of the destination, and incorporates both tangible and intangible elements.
Most of the key research on the topic has looked at the two main components, i.e., the cognitive and affective images (Baloglu & Brinberg, Citation1997; Baloglu & McCleary, Citation1999; Kim & Richardson, Citation2003; Beerli & Martín, Citation2004; Pike & Ryan, Citation2004; San Martín & Del Bosque, Citation2008, San Martín Gutiérrez, & Rodríguez del Bosque, Citation2011; Smith et al., Citation2015; Tan & Wu, Citation2016; Molinillo, Liébana-Cabanillas, Anaya-Sánchez, & Buhalis, Citation2018). However, some have focused exclusively on the cognitive component of the image (Echtner & Ritchie, Citation1991; Echtner & Ritchie, Citation2003; Beerli & Martín, Citation2004; Chi & Qu, Citation2008; Sun et al., Citation2013). In fact, Pike (Citation2002) found that of 142 papers published between 1973 and 2000, only six included the affective or psychological component.
Some studies claim that the cognitive component influences the affective one (Baloglu & McCleary, Citation1999; Beerli & Martín, Citation2004; Llodrá, Citation2013), but regarding the relevance of these components in the general image, the evaluation of the affective characteristics of the destination can become more important than the evaluation of its objective properties (Kim & Richardson, Citation2003). Other studies (e.g., Marine-Roig & Clavé, Citation2016) have found that the cognitive elements represent a greater percentage of the general image than the affective components.
Regarding the measurement of the cognitive image, which refers to knowledge or beliefs about the attributes of the destination (Baloglu & McCleary, Citation1999), the literature shows that this dimension is, in turn, made up of other components. shows a comparison of the different attributes of the cognitive image that certain authors have considered in their research, some of which relate to successful destinations such as sun and beach locations.
Table 2. Attributes of the cognitive image.
To measure the affective image, Baloglu and McCleary (Citation1999), like many other authors (e.g., Bigné et al., Citation2001; Kim & Richardson, Citation2003; Beerli & Martín, Citation2004; Pike & Ryan, Citation2004; Chi & Qu, Citation2008; Chen, Lai, Petrick, & Lin, Citation2016), drew on the work of Russell and Pratt (Citation1980). Although the affective component has generally received less attention in the literature, it is key to improving tourists’ perception of the destination image. This is because it is defined as the feelings a person harbors toward a destination (Chen et al., Citation2016). Feelings-as-information theory explains how individuals make use of their emotions and impressions in ways that predispose them toward a destination (Kock, Josiassen, & Assaf, Citation2016). presents the different attributes that the listed authors have considered in each of their studies.
Table 3. Attributes of the affective image.
2.2. Tourist satisfaction
Literature has revealed how the pre-trip image of a destination influences visit intention and destination choice (Baloglu & McCleary, Citation1999) and how the image created during a trip influences the positive way in which the experiences are recreated in situ (Bigné et al., Citation2001). However, most of the related research focuses on the perceptions of the image that tourists get from the visit and their subsequent reflections on the visit (Prayag, Hosany, Muskat, & Del Chiappa, Citation2017), with many studies focusing on aspects such as their level of satisfaction (e.g., Chen & Phou, Citation2013; Lee, Lee, & Lee, Citation2014). Some of them have examined the relationship between destination image and tourist satisfaction worldwide (Bigné et al., Citation2001; Chen & Tsai, Citation2007). Indeed, the concept of satisfaction in the field of tourism has been much discussed in the academic literature. A clear definition is given by Chen and Tsai (Citation2007), who refer to the pleasure that the visitor feels as a consequence of the capacity of the travel experience to fulfill his/her wishes, expectations and needs relating to said experience. De Rojas and Camarero (Citation2008) consider that satisfaction is composed of affective and cognitive aspects and that it is largely decided during the visit. Other authors (e.g., Ozdemir et al., Citation2012) suggest that satisfaction is formed by subjective comparisons between perceptions and client expectations. However, one of the clearest definitions is that given by San Martín (Citation2005, p. 334), where he refers to satisfaction as ‘the response of the individual to a cognitive process where the experience of consumption is compared with his expectations’.
Therefore, in the field of tourism research, destination image is viewed as a direct antecedent of satisfaction (Bigné et al., Citation2001; Chen & Tsai, Citation2007; Chi & Qu, Citation2008; Qu et al., Citation2011; Chen & Phou, Citation2013; Lee et al., Citation2014). The study conducted by Prayag et al. (Citation2017) shows that tourists’ emotional experiences (measured through the three dimensions of joy, positive surprise and love) influence the perception of destination image, and that the evaluation of that image also influences their satisfaction. The study confirms that emotional responses are significant predictors of attitude and behavior. However, the third dimension, positive surprise, does not exert any kind of influence. The three dimensions used by Prayag et al. (Citation2017) were also used in other tourism research in the context of festivals (e.g., Lee & Kyle, Citation2013; Lee et al., Citation2014) and in the context of heritage tourism (e.g., Prayag, Hosany, & Odeh, Citation2013). The research by Prayag et al. (Citation2013) focused on a historical site with unique archaeological attributes and cultural properties, tried to determine whether tourists’ emotions – both positive (joy, love and pleasant surprise) and negative (regret, disappointment and disgust) – have a direct effect on satisfaction and in turn on behavioral intentions. Indeed, along with a number of other studies (e.g., Yuksel and Yuksel, Citation2007; San Martín & del Bosque, Citation2008; Faullant et al., Citation2011), the authors demonstrate that emotions are predictors of satisfaction and that there is a relationship between the latter and behavioural intentions. This finding is in line with those of previous studies conducted in the context of heritage tourism (e.g., Chen & Chen, Citation2010).
2.3. Proposed model and hypotheses
Drawing on the literature review, this study analyses the image of a cultural destination, representing it as a reflective multidimensional concept (Jarvis, MacKenzie, & Podsakoff, Citation2003). This multidimensional construct is, in turn, made up of different attributes that contribute individually, as is the case of the cognitive image. In this research, the proposed model was developed based on previous studies that have shown that destination image is fundamentally influenced by the cognitive and affective components, i.e., the cognitive and affective images that the tourist perceives. The degree to which the cognitive image influences the affective image is also studied. Another objective of this work is to determine the influence of the image of the archaeological park on the satisfaction of the tourist after the visit. To this end, the following conceptual model () and hypotheses are proposed:
Figure 1. Model for the formation of the image of a cultural destination and its influence on satisfaction.
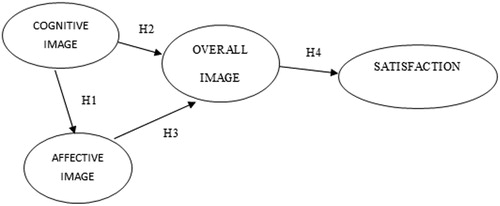
The items to measure in the construction of each of the variables were adopted from different sources, since the literature lacks a universally-accepted scale for this particular type of destination, namely, an archaeological park. Thus, the proposed model was divided into two parts: first, an attempt was made to measure the image formation of the park, for which hypotheses H1, H2 and H3 were formulated; second, the influence of the image of this destination on the tourists’ post-visit satisfaction was analysed, to which end hypothesis H4 was proposed. By testing H1, the analysis seeks to verify the influence of the cognitive image on the affective image; this part of the analysis was informed by the studies of Baloglu and McCleary (Citation1999), Beerli and Martín (Citation2004) and Llodrá (2013). The same studies were also used, along with studies by Stylos, Vassiliadis, Bellou, and Andronikidis (Citation2016) and Stylidis, Shani, and Belhassen (Citation2017), to formulate H2 and H3, respectively. The formulation of H4 drew from the studies of Bigné et al. (Citation2001), Chen and Phou (Citation2013), and Assaker, Hallak, Assaf, and Assad (Citation2015), among others.
Hypothesis 1 (H1): the cognitive image has a positive and significant influence on the affective image.
Hypothesis 2 (H2): the cognitive image has a positive and significant influence on the overall image.
Hypothesis 3 (H3): the affective image has a positive and significant influence on the overall image.
Hypothesis 4 (H4): the overall image has a positive and significant influence on satisfaction.
3. Methodology
Of the many procedures used by various authors to analyse tourism destination image and tourist satisfaction, the method chosen for this study was structural equation modelling (S.E.M.). To this end, the P.L.S. method was chosen as the most efficient alternative to carry out the S.E.M. Thus, the S.E.M. models allow the researcher to compare a priori theoretical knowledge and hypotheses with the empirical data. As such, these models are considered confirmatory rather than exploratory. There are two main components in S.E.M. models: one is the measurement model, which interprets the relationships between the constructs (cognitive image, affective image, general image and satisfaction) and their indicators; and the other is the structural model, which specifies the relationships among said constructs (Henseler, Citation2017).
3.1. Data collection procedure
The questionnaire was designed to collect information from visitors to the site following their visit. The questions included in the questionnaire were based on a thorough review of the literature and the specific characteristics of the destination under study, and addressed all the constructs included in the proposed conceptual model so as to allow the proposed hypotheses to be tested. The data were collected in the archaeological park over four consecutive weekends during the months of April and May 2017. The representative sample in this research was determined on the basis of the annual number of visitors to the archaeological park (around 40,000). The surveys were aimed at tourists, both men and women, however the age stratification of the sample was fixed as the questionnaire was only administered to tourists aged 18 and over. In addition, information was collected about the visitors’ sociodemographic characteristics (income level, studies, origin, gender, etc.). This allowed us to later define the profile of the typical tourist visiting Segóbriga. The decision was made to survey some 600 visitors aged 18 and over, resulting in a total of 598 questionnaires returned. From those, a final sample of 511 valid responses was obtained after eliminating all the questionnaires in which any question had been left blank. A pilot test was conducted prior to administering the questionnaire in order to make any necessary changes.
3.2. Variables and measurement scales
The measurement method chosen for all the constructs (cognitive image, affective image, general image and satisfaction) was a 5-point Likert scale. The first construct, the cognitive image, is a multidimensional concept; each of these dimensions is in turn composed of several elements. A total of 26 items in the cognitive dimension were analysed; the results are shown in (5-point Likert scale, 1 = Most negative score/5 = Most positive score)
Table 4. Cognitive image construct.
The items analysed were based on Beerli and Martín (Citation2004) and Qu et al. (Citation2011). Numerous studies have clearly shown that these dimensions cover the natural environment, cultural resources, infrastructure, and quality, although the importance given to each given varies (e.g., Baloglu & McCleary, Citation1999; Gallarza et al., Citation2002; Beerli & Martín, Citation2004; Chi & Qu, Citation2008; San Martín & Del Bosque, Citation2008). It should be noted that more recent research (e.g., Stylos et al., Citation2016; Stylidis et al., Citation2017) has considered many of these attributes, albeit using a different terminology.
However, when carrying out the confirmatory factor analysis (C.F.A.) of the cognitive image, only six factors emerged, grouping several items together and eliminating those whose lambda value was less than 0.5: C.O.G.N.I.T.I.V.E.1 corresponds to the variable natural resources (climate and richness of the landscape); C.O.G.N.I.T.I.V.E.2 covers tourist infrastructure (restaurants, hotels and accommodation); C.O.G.N.I.T.I.V.E.3 captures part of the variables relating to culture, history and art (monuments, museums, historical buildings, customs and ways of life); C.O.G.N.I.T.I.V.E.4 includes another five items relating to the variable culture, history and art (gastronomy, theater festivals, concerts, crafts and folklore); C.O.G.N.I.T.I.V.E.5 corresponds to the variable natural environment, measured by the maintenance and conservation of the site; and finally C.O.G.N.I.T.I.V.E.6 covers the social environment (hospitality and friendliness of local residents and quality of life in the area).
Numerous studies were referred to in order to measure the affective image (e.g., Baloglu & McCleary, Citation1999; Bigné et al., Citation2001; Kim & Richardson, Citation2003; Beerli & Martín, Citation2004; Pike & Ryan, Citation2004; Chi & Qu, Citation2008; Chen et al., Citation2016; Stylos et al., Citation2016; Stylidis et al., Citation2017). These studies, in turn, built on the findings of Russell and Pratt (Citation1980). Thus, a total of 10 attributes were considered in the present study for the measurement of the affective image: Beautiful (A.F.F.I.M.A.1), Ugly (A.F.F.I.M.A.2), Nice (A.F.F.I.M.A.3), Unpleasant (A.F.F.I.M.A.4), Relaxing (A.F.F.I.M.A.5), Stressful (A.F.F.I.M.A.6), Fun (A.F.F.I.M.A.7), Boring (A.F.F.I.M.A.8), Exciting (A.F.F.I.M.A.9) and Depressing (A.F.F.I.M.A.10). Respondents had to provide a score on a 5-point Likert scale (1 = Strongly disagree/5 = Strongly agree). After carrying out the C.F.A. for the affective image, only three factors emerged: A.F.F.I.M.A.1, A.F.F.I.M.A.3 and A.F.F.I.M.A.5 ().
Table 5. Measurement instrument: individual reliability.
With regard to the site’s overall image, it was measured with a single question based on Baloglu and McCleary (Citation1999): ‘After your visit, rate the site’s overall image.’ Respondents had to answer the question using a 5-point Likert scale (1 = Very bad/5 = Very good).
Finally, concerning tourist satisfaction, two questions based on previous research were included (e.g., Bigné et al., Citation2001, Chen & Phou, Citation2013, Assaker et al., Citation2015). The aim of these questions was to analyse the degree of satisfaction of the tourist after their visit to the site. The scale chosen to measure this variable was also a 5-point Likert scale. For the first question, tourists had to indicate whether they disagreed/agreed that the visit to the site had been worth it (S.A.T.1); and for the other, whether they would generally describe their visit to the Segóbriga Archaeological Park as very unsatisfactory/satisfactory (S.A.T.2).
A final section of questions was included to collect sociodemographic information about the respondents on factors such as age, income level, gender, education, overnight stay in the area, place of origin, etc. This made it possible to determine the profile of the typical tourist to Segóbriga: a middle-aged (between 40- and 59-years-old) woman, who is a salaried worker with a fairly high income, and a higher education qualification.
4. Analysis of results
4.1. Evaluation of the measurement model: validity and reliability
Before the proposed hypotheses were tested, the measurement model was evaluated with PLS (Barclay, Higgins, & Thompson, Citation1995) in order to verify the individual reliability of each item, the reliability of the scale, the convergent validity, and the discriminant validity. SmartPLS 3.0 software was used. The significance of the parameters was obtained through bootstrapping, which assesses the accuracy of the P.L.S. estimates (Hair, Ringle, & Sarstedt, Citation2011).
The individual reliability of each indicator was calculated, and the simple correlations of the means with their constructs were analysed. Those items with a factor loading greater than or equal to 0.707, meaning that more than 50% of the variance of the observed variable is shared by the construct, were deemed reliable (Carmines & Zeller, Citation1979).
The composite reliability was calculated to verify whether the indicators measure the construct to which they are assigned. This analysis was conducted using Cronbach’s alpha (Cronbach, Citation1951): a value equal to or greater than 0.7 confirms that the indicators measure the construct in question. shows that all the constructs meet the reliability requirement, since both the composite reliability and Cronbach’s alpha values are greater than 0.7.
Table 6. Measurement instrument: composite reliability.
In addition, the convergent validity was calculated. The average variance extracted (A.V.E.) was calculated for each construct. According to Fornell and Larcker (Citation1981), this measure shows the amount of variance that is captured by a construct, through its indicators, in relation to the amount of variance due to measurement error. A value equal to or greater than 0.5 indicates that each construct explains at least 50% of the variance of the assigned indicators. Another of the most important P.L.S. reliability measures, rho A, was also calculated (Dijkstra & Henseler, Citation2015) ().
Table 7. Measurement instrument: convergent validity.
Lastly, the discriminant validity of the measurement model was checked by determining the extent to which a given construct is different from the other constructs in the model. To meet the requirement for this type of validity, the variance shared by a variable and its respective indicators must be greater than the variance shared with the model’s other variables (Barclay et al., Citation1995). There are two methods for evaluating it: through an analysis of the cross-loadings and through the correlations of the latent variables (A.V.E.). The present research used the latter method, as can be seen in , which shows the data from the matrix of correlations between the model’s constructs. The diagonal of the matrix shows the value of the square root of the A.V.E. of the corresponding construct. As can be seen, the correlations between the constructs are less than the square root of the A.V.E. Therefore, the condition that each of the model’s constructs must share more variance with its indicators than with the model’s other constructs was met, thereby confirming the discriminant validity of the constructs.
Table 8. Measurement instrument: discriminant validity (Fornell-Larcker criterion).
4.2. Evaluation of the structural model
shows the results of the structural analysis carried out with P.L.S. It shows the path coefficients (β) indicating the relationships between the structures, as well as the significance of these relationships. As mentioned above, the nonparametric bootstrap resampling technique was used to test the stability and significance of the estimated parameters (Hair et al., Citation2011).
Table 9. Structural analysis of the hypothesis tests.
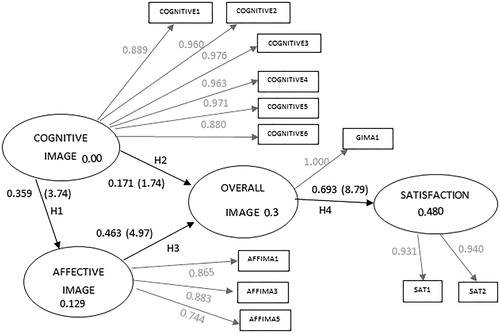
All direct effects were accepted (). Based on the results shown in , the following conclusions can be drawn: first, support was found for H1, thus confirming the positive and significant influence of the cognitive image on the affective image (H1) (β = 0,359, p < 0.001), as well as the effect of the cognitive image (H2) (β = 0,171; p < 0.001), and affective image (H3) (β = 0,463; p < 0.001) on the overall image. The fact that the cognitive image positively influences the overall image (H1) was consistent with previously reported findings (e.g., Baloglu & McCleary, Citation1999; Beerli & Martín, Citation2004; Qu et al., Citation2011; Llodrà, 2013). The influence of the cognitive image on the affective image (H2) likewise was consistent with previous findings (Baloglu & McCleary, Citation1999; Beerli & Martín, Citation2004). The support found for the influence of the affective image on the overall image (H3) confirmed the findings of Baloglu and McCleary (Citation1999), Beerli and Martín (Citation2004), Qu et al. (Citation2011), and Papadimitriou, Kaplanidou, and Apostolopoulou (Citation2015), which suggested that the affective image can have a very significant direct effect on the overall image.
The last hypothesis (H4) is also confirmed (β = 0,693; p < 0,001). The objective was to analyse if the general image that tourists perceive influences their satisfaction after visiting the site. Our findings thus confirm the results of most of the related academic literature, which holds that destination image is considered as a direct antecedent of satisfaction (Bigné et al., Citation2001; Chen & Tsai, Citation2007; Chi & Qu, Citation2008; Qu et al., Citation2011; Chen & Phou, Citation2013; Lee et al., Citation2014).
As for the assessment of the structural model, the magnitude of the R2 values indicate whether a significant amount of the variance in the dependent variables is explained. According to Falk and Miller (Citation1992), the explained variance in the endogenous variables (R2) should be greater than or equal to 0.1. An increasingly common alternative to considering solely R2 is to also use the predictive relevance criterion Q2 proposed by Stone (Citation1974). According to Chin (Citation1998: 318), Q2 offers a measure of how well the studied values can be reconstructed by the model and its parameters. If Q2 is greater than zero, the model has predictive relevance; if it is less than or equal to zero, it does not. As shown in , the R2 values were greater than 0.1 for all the variables. Likewise, all the Q2 values were greater than zero. Therefore, the predictive relevance of the model was confirmed.
Table 10. Predictive relevance of the model.
Finally, the value of the standardised root mean square residual (S.R.M.R.) was calculated (Henseler, Citation2017) as a measure of fit for the model, comparing the difference between the observed and predicted correlations. Values of less than 0.08 are considered acceptable. The model proposed here had a value of 0.048, which is therefore deemed an appropriate fit. The resulting S.E.M. is shown in .
Figure 2. Resulting S.E.M. model.
5. Conclusions
This study contributes to the field of tourism research by quantifying the contributions of the cognitive and affective images to the general image of a heritage destination. The formation of the image of a cultural destination was examined for the case of Segóbriga Archaeological Park. The analysis also focuses on the degree to which the destination image influences tourists’ post-visit satisfaction. The theoretical review of the concept of destination image and the quantitative studies performed show that the overall image of this destination is a multidimensional phenomenon consisting of cognitive and affective dimensions. Therefore, tourists’ perceptions of Segóbriga are formed not only on the basis of their individual knowledge and beliefs regarding the site’s characteristics, but also their feelings and perceptions about the destination. Of these two dimensions, the affective image was the one that had the greatest influence on the overall image. This finding represents a novel contribution to the literature, since most studies to date on the formation of destination image by tourists have found the cognitive component to be more relevant than the affective.
Similarly, this study confirms that the overall image of a destination is an antecedent of satisfaction. That is, tourists’ perceived image of this archaeological destination influences their post-visit satisfaction. Moreover, the literature reviewed suggests that a satisfied tourist is more likely to revisit or recommend this tourist destination. An analysis of the loyalty of satisfied tourists is proposed for future research. In addition, it would be interesting to analyse how these two components of the destination image (cognitive and affective) can be improved it, thus attracting more tourists. For example, one could analyse which sources of information – traditional or online – have the most influence on perceived image.
In conclusion, this research has analysed the factors influencing the image of an archaeological park perceived by visitors, as well as the effect of that image on their satisfaction. A key aim of the study is to help guide the future image management of archaeological sites and to highlight potential improvements to the image that would enable such cultural destinations to attract more tourists, as do other tourist destinations such as sun and beach locations. Thus, the results obtained shed some light on the utility and relevance of the cognitive and affective components of the overall image of destinations such as archaeological parks.
The study does suffer from some limitations. For practical reasons, the constructs relating to before and after the visit were measured at the same time, namely, following the visit to the site. Consequently, it was not possible to gauge respondents’ assessments of the site’s image prior to their tourism experience. Furthermore, the present study omits many potentially relevant variables and the relationships between them; as discussed earlier, future research should explore some of these. For example, future research could analyse the role played by local residents in the formation of the image of this type of destination. Other future lines of research include changes in the perception of the destination image that occurs before, during and after the visit.
Disclosure statement
No potential conflict of interest was reported by the authors.
References
- Ahmed, Z. U. (1991). The influence of the components of a state's tourist image on product positioning strategy. Tourism Management, 12(4), 331–340. doi:10.1016/0261-5177(91)90045-U
- Assaker, G., Hallak, R., Assaf, A. G., & Assad, T. (2015). Validating a structural model of destination image, satisfaction, and loyalty across gender and age: Multigroup analysis with PLS-SEM. Tourism Analysis, 20(6), 577–591. doi:10.3727/108354215X14464845877797
- Baloglu, S., & Brinberg, D. (1997). Affective images of tourism destinations. Journal of Travel Research, 35(4), 11–15. doi:10.1177/004728759703500402
- Baloglu, S., & McCleary, K. W. (1999). A model of destination image formation. Annals of Tourism Research, 26(4), 868–897. doi:10.1016/S0160-7383(99)00030-4
- Barclay, D. W., Higgins, C., & Thompson, R. (1995). The partial least squares approach to causal modeling: Personal computer adoption and use as illustration. Technology Studies, 2(2), 285–309.
- Beerli, A., & Martín, J. D. (2004). Factors influencing destination image. Annals of Tourism Research, 31(3), 657–681. doi:10.1016/j.annals.2004.01.010
- Bigné, J. E., Sanchez, M. I., & Sanchez, J. (2001). Tourism image, evaluation variables and after purchase behaviour: Inter-relationship. Tourism Management, 22(6), 607–616. doi:10.1016/S0261-5177(01)00035-8
- Carballo, M. M., Araña, J. E., León, C. J., & Moreno-Gil, S. (2015). Economic valuation of tourism destination image. Tourism Economics, 21(4), 741–759. doi:10.5367/te.2014.0381
- Carmines, E. G., & Zeller, R. A. (1979). Reliability and validity assessment (Vol. 17). Beverly Hills, CA: Sage Publications.
- Chen, C. F., & Chen, F. S. (2010). Experience quality, perceived value, satisfaction and behavioral intentions for heritage tourists Tourism management, 31(1), 29–35.
- Chen, C. C., Lai, Y. H. R., Petrick, J. F., & Lin, Y. H. (2016). Tourism between divided nations: An examination of stereotyping on destination image. Tourism Management, 55, 25–36. doi:10.1016/j.tourman.2016.01.012
- Chen, C. F., & Phou, S. (2013). A closer look at destination: Image, personality, relationship and loyalty. Tourism Management, 36, 269–278. doi:10.1016/j.tourman.2012.11.015
- Chen, C. F., & Tsai, D. (2007). How destination image and evaluative factors affect behavioral intentions. Tourism Management, 28(4), 1115–1122. doi:10.1016/j.tourman.2006.07.007
- Chi, C. G. Q., & Qu, H. (2008). Examining the structural relationships of destination image, tourist satisfaction and destination loyalty: An integrated approach. Tourism Management, 29(4), 624–636. doi:10.1016/j.tourman.2007.06.007
- Chin, W. W. (1998). The partial least squares approach to structural equation modeling. Modern Methods for Business Research, 295(2), 295–336.
- Chon, K. S. (1990). The role of destination image in tourism: A review and discussion. The Tourist Review, 45(2), 2–9. doi:10.1108/eb058040
- Choi, S. H., Cho, H. J., & Cai, L. A. (2015). Interface of country affective image and its tourism: Evidence from Chinese and South Koreans. Paper Presented at Tourism Travel and Research Association: Advancing Tourism Research Globally Annual Conference. Amherst: University of Massachusetts.
- Crompton, J. L. (1979). An assessment of the image of Mexico as a vacation destination and the influence of geographical location upon that image. Journal of Travel Research, 17(4), 18–23. doi:10.1177/004728757901700404
- Cronbach, L. J. (1951). Coefficient alpha and the internal structure of tests. Psychometrika, 16(3), 297–334. doi:10.1007/BF02310555
- De Rojas, C., & Camarero, C. (2008). Visitors’ experience, mood and satisfaction in a heritage context: Evidence from an interpretation center. Tourism Management, 29(3), 525–537. doi:10.1016/j.tourman.2007.06.004
- Deng, Q., & Li, M. (2014). A model of event–destination image transfer. Journal of Travel Research, 53(1), 69–82. doi:10.1177/0047287513491331
- Dijkstra, T. K., & Henseler, J. (2015). Consistent partial least squares path modeling. MIS Quarterly, 39(2), 297–316. doi:10.25300/MISQ/2015/39.2.02
- Echtner, C. M., & Ritchie, J. R. B. (1991). The meaning and measurement of destination image. The Journal of Tourism Studies, 2(2), 2–12.
- Echtner, C. M., & Ritchie, J. B. (1993). The measurement of destination image: An empirical assessment. Journal of Travel Research, 31(4), 3–13. doi:10.1177/004728759303100402
- Echtner, C. M., & Ritchie, J. R. (2003). The meaning and measurement of destination image [Reprint of original article published in v. 2, no. 2, 1991: 2-12.]. Journal of Tourism Studies, 14(1), 37.
- Embacher, J., & Buttle, F. (1989). A repertory grid analysis of Austria's image as a summer vacation destination. Journal of Travel Research, 27(3), 3–7. doi:10.1177/004728758902700302
- Fakeye, P. C., & Crompton, J. L. (1991). Image differences between prospective, first-time, and repeat visitors to the Lower Rio Grande Valley. Journal of Travel Research, 30(2), 10–16. doi:10.1177/004728759103000202
- Falk, R. F., & Miller, N. B. (1992). A primer for soft modeling. Akron, OH: University of Akron Press.
- Faullant, R., Matzler, K., & Mooradian, T. A. (2011). Personality, basic emotions, and satisfaction: Primary emotions in the mountaineering experience Tourism Management, 32(6), 1423–1430.
- Fornell, C., & Larcker, D. F. (1981). Evaluating structural equation models with unobservable variables and measurement error. Journal of Marketing Research, 18(1), 39–50. doi:10.1177/002224378101800104
- Gallarza, M. G., Saura, I. G., & Garcı́a, H. C. (2002). Destination image: Towards a conceptual framework. Annals of Tourism Research, 29(1), 56–78. doi:10.1016/S0160-7383(01)00031-7
- Gartner, W. C. (1989). Tourism image: Attribute measurement of state tourism products using multidimensional scaling techniques. Journal of Travel Research, 28(2), 16–20. doi:10.1177/004728758902800205
- Gartner, W. C. (1994). Image formation process. Journal of Travel & Tourism Marketing, 2(2–3), 191–216. doi:10.1300/J073v02n02_12
- Gartner, W. C., & Hunt, J. D. (1987). An analysis of state image change over a twelve-year period (1971-1983). Journal of Travel Research, 26(2), 15–19. doi:10.1177/004728758702600204
- Goodrich, J. N. (1978). The relationship between preferences for and perceptions of vacation destinations: Application of a choice model. Journal of Travel Research, 17(2), 8–13. doi:10.1177/004728757801700202
- Gunn, C. A. (1972). Vacationscape: Designing tourist regions. Austin: University of Texas. Bureau of Business Research.
- Hair, J. F., Ringle, C. M., & Sarstedt, M. (2011). PLS-SEM: Indeed a silver bullet. Journal of Marketing Theory and Practice, 19(2), 139–152. doi:10.2753/MTP1069-6679190202
- Henseler, J. (2017). Bridging design and behavioral research with variance-based structural equation modeling. Journal of Advertising, 46(1), 178–192. doi:10.1080/00913367.2017.1281780
- Hunt, J. D. (1971). Image: A factor in tourism. Unpublished Ph.D. diss., Colorado State University, Fort Collins.
- Hunt, J. D. (1975). Image as a factor in tourism development. Journal of Travel Research, 13(3), 1–7. doi:10.1177/004728757501300301
- Jarvis, C. B., MacKenzie, S. B., & Podsakoff, P. M. (2003). A critical review of construct indicators and measurement model misspecification in marketing and consumer research. Journal of Consumer Research, 30(2), 199–218. doi:10.1086/376806
- Kim, S. S., & Morrsion, A. M. (2005). Change of images of South Korea among foreign tourists after the 2002 FIFA World Cup. Tourism Management, 26(2), 233–247. doi:10.1016/j.tourman.2003.11.003
- Kim, H., & Richardson, S. L. (2003). Motion picture impacts on destination images. Annals of Tourism Research, 30(1), 216–237. doi:10.1016/S0160-7383(02)00062-2
- Kock, F., Josiassen, A., & Assaf, A. G. (2016). Advancing destination image: The destination content model. Annals of Tourism Research, 61, 28–44. doi:10.1016/j.annals.2016.07.003
- Lai, K., & Li, X. (2016). Tourism destination image: Conceptual problems and definitional solutions. Journal of Travel Research, 55(8), 1065–1080. doi:10.1177/0047287515619693
- Lee, J. J., & Kyle, G. T. (2013). The measurement of emotions elicited within festival contexts: A psychometric test of a Festival Consumption Emotions (FCE) Scale. Tourism Analysis, 18(6), 635–649. doi:10.3727/108354213X13824558188541
- Lee, B., Lee, C. K., & Lee, J. (2014). Dynamic nature of destination image and influence of tourist overall satisfaction on image modification. Journal of Travel Research, 53(2), 239–251. doi:10.1177/0047287513496466
- Llodrá, R. I. (2013). Gestión de la imagen del destino en el contexto del turismo 2.0: Recomendaciones estratégicas para las Organizaciones de Marketing de los Destinos (OMD).
- Marine-Roig, E., & Clavé, S. A. (2016). A detailed method for destination image analysis using user-generated content. Information Technology & Tourism, 15(4), 341–364. doi:10.1007/s40558-015-0040-1
- Martín-Santana, J. D., Beerli-Palacio, A., & Nazzareno, P. A. (2017). Antecedents and consequences of destination image gap. Annals of Tourism Research, 62, 13–25. doi:10.1016/j.annals.2016.11.001
- Ministry of Energy and Tourism. (2018). Retrieved on August 15, 2018 http://www.minetad.gob.es/es-ES/GabinetePrensa/NotasPrensa/2018/Paginas/Espa%C3%B1alograunr%C3%A9corddellegadasen2017con82millonesdeturistasinternacionales.aspx
- Molinillo, S., Liébana-Cabanillas, F., Anaya-Sánchez, R., & Buhalis, D. (2018). DMO online platforms: Image and intention to visit. Tourism Management, 65, 116–130. doi:10.1016/j.tourman.2017.09.021
- Ozdemir, B., Aksu, A., Ehtiyar, R., Çizel, B., Çizel, R. B., & İçigen, E. T. (2012). Relationships among tourist profile, satisfaction and destination loyalty: Examining empirical evidences in Antalya region of Turkey Journal of Hospitality Marketing and Management, 21(5), 506–540.
- Papadimitriou, D., Kaplanidou, K. K., & Apostolopoulou, A. (2015). Destination image components and word-of-mouth intentions in urban tourism: A multigroup approach. Journal of Hospitality and Tourism Research, (May) 5, 1–21. Advance online publication. doi:10.1177/1096348015584443
- Pike, S. (2002). Destination image analysis—A review of 142 papers from 1973 to 2000. Tourism Management, 23(5), 541–549. doi:10.1016/S0261-5177(02)00005-5
- Pike, S., & Ryan, C. (2004). Destination positioning analysis through a comparison of cognitive, affective, and conative perceptions. Journal of Travel Research, 42(4), 333–342. doi:10.1177/0047287504263029
- Prayag, G., Hosany, S., & Odeh, K. (2013). The role of tourists' emotional experiences and satisfaction in understanding behavioral intentions. Journal of Destination Marketing & Management, 2(2), 118–127. doi:10.1016/j.jdmm.2013.05.001
- Prayag, G., Hosany, S., Muskat, B., & Del Chiappa, G. (2017). Understanding the relationships between tourists’ emotional experiences, perceived overall image, satisfaction, and intention to recommend. Journal of Travel Research, 56(1), 41–54. doi:10.1177/0047287515620567
- Qu, H., Kim, L. H., & Im, H. H. (2011). A model of destination branding: Integrating the concepts of the branding and destination image. Tourism Management, 32(3), 465–476. doi:10.1016/j.tourman.2010.03.014
- Royo-Vela, M. (2009). Rural-cultural excursion conceptualization: A local tourism marketing management model based on tourist destination image measurement. Tourism Management, 30(3), 419–428. doi:10.1016/j.tourman.2008.07.013
- Russell, J. A., & Pratt, G. (1980). A description of the affective quality attributed to environments. Journal of Personality and Social Psychology, 38(2), 311. doi:10.1037/0022-3514.38.2.311
- San Martín, H., & Del Bosque, I. A. R. (2008). Exploring the cognitive–affective nature of destination image and the role of psychological factors in its formation. Tourism Management, 29(2), 263–277. doi:10.1016/j.tourman.2007.03.012
- San Martín Gutiérrez, H. (2006). Estudio de la imagen de destino turístico y el proceso global de satisfacción: adopción de un enfoque integrador. Doctoral Thesis, Universidad de Cantabria.
- San Martín Gutiérrez, H., & Rodríguez del Bosque, I. (2011). Un enfoque de gestión de la imagen de marca de los destinos turísticos basado en las características del turista. Revista de Análisis Turístico, 9, 5–13.
- Smith, W. W., Li, X. R., Pan, B., Witte, M., & Doherty, S. T. (2015). Tracking destination image across the trip experience with smartphone technology. Tourism Management, 48, 113–122. doi:10.1016/j.tourman.2014.04.010
- Sirakaya, E., & Woodside, A. G. (2005). Building and testing theories of decision making by travellers. Tourism Management, 26(6), 815–832. doi:10.1016/j.tourman.2004.05.004
- Stepchenkova, S., & Morrison, A. M. (2008). Russia's destination image among American pleasure travelers: Revisiting Echtner and Ritchie. Tourism Management, 29(3), 548–560. doi:10.1016/j.tourman.2007.06.003
- Stone, M. (1974). Cross-validatory choice and assessment of statistical predictions. Journal of the Royal Statistical Society: Series B (Methodological)), 36(2), 111–147. doi:10.1111/j.2517-6161.1974.tb00994.x
- Stylidis, D., Shani, A., & Belhassen, Y. (2017). Testing an integrated destination image model across residents and tourists. Tourism Management, 58, 184–195. doi:10.1016/j.tourman.2016.10.014
- Stylos, N., Vassiliadis, C. A., Bellou, V., & Andronikidis, A. (2016). Destination images, holistic images and personal normative beliefs: Predictors of intention to revisit a destination. Tourism Management, 53, 40–60. doi:10.1016/j.tourman.2015.09.006
- Sun, X., Chi, C. G. Q., & Xu, H. (2013). Developing destination loyalty: The case of Hainan Island. Annals of Tourism Research, 43, 547–577. doi:10.1016/j.annals.2013.04.006
- Tan, W. K., & Wu, C. E. (2016). An investigation of the relationships among destination familiarity, destination image and future visit intention. Journal of Destination Marketing & Management, 5(3), 214–226. doi:10.1016/j.jdmm.2015.12.008
- Tasci, A. D., & Gartner, W. C. (2007). Destination image and its functional relationships. Journal of Travel Research, 45(4), 413–425. doi:10.1177/0047287507299569
- Tasci, A. D., Gartner, W. C., & Cavusgil, S. T. (2007). Conceptualization and operationalization of destination image. Journal of Hospitality & Tourism Research, 31(2), 194–223. doi:10.1177/1096348006297290
- Yang, J., He, J., & Gu, Y. (2012). The implicit measurement of destination image: The application of implicit association tests. Tourism Management, 33(1), 50–52. doi:10.1016/j.tourman.2011.01.022
- Yüksel, A., & Yüksel, F. (2007). Shopping risk perceptions: Effects on tourists’ emotions, satisfaction and expressed loyalty intentions. Tourism management, 28(3), 703–713.