
 ?Mathematical formulae have been encoded as MathML and are displayed in this HTML version using MathJax in order to improve their display. Uncheck the box to turn MathJax off. This feature requires Javascript. Click on a formula to zoom.
Abstract
Nowadays, a huge amount of data is generated due to rapid Information and Communication Technology development. In this paper, a digital banking strategy has been suggested applying these big data for Iranian banking industry. This strategy would guide Iranian banks to analyse and distinguish customers’ needs to offer services proportionate to their manner. In this research, the balances of more than 2,600,000 accounts over 400 weeks are computed in a bank. These accounts are clustered based on justified RFM parameters containing maximum balances, the most number of maximum balances and the last week number with the maximum balance using k-means method. Subsequently, the clusters are prioritised employing Best Worst Method- COmplex PRoportional ASsessment methods considering the diverse inner value of each cluster. The accounts are classified into six clusters. The experts named the clusters as special, loyal, silver- high interaction, silver- low interaction, bronze, averted- low interaction. silver- low interaction cluster and loyal cluster are picked in order by experts and BWM-COPRAS as the most influential clusters and the digital banking strategy is developed for them. RFM parameters are modelled for customers’ accounts singly. The aggregation of the separate accounts of a customer should be considered.
Keywords:
1. Introduction
Today, organisations and business enterprises’ customers carry different needs and tastes in markets. Good and service providers try to attract these customers and create value for them in a fierce competition. The organisations would be the champion that identify the customers’ behaviour agile and take the suitable actions. Concentrating on some of the groups of customers would be profitable while this procedure is not applicable for others. Customers are diagnosed in the stage of analysis and recognition during the process of strategic management. Customers, customer orientation and customer satisfaction are influential for organisations notably service organisations. Identifying customers, understanding their expectations, setting up process found on their desire and at last achieving the customers satisfaction and loyalty are a part of today’s business goals (Amoozad Mahdiraji & Razavi Hajiagha, Citation2017). Consequently, grouping and clustering the customers and determining the interaction strategy for each of them is significant.
A huge volume of data are generated, gathered, stored and refined everyday by customers. It is impossible to analyse and process these data and extract knowledge from them using traditional ICT and data mining tools. Big data include four features (4 V) covering volume, variety, velocity and value (Qi, Tao, Zuo, & Zhao, Citation2018).
At first glance these data seem to be valueless and do not relate to each other logically; however, in recent years these data are called ‘new oil (Kantarcioglu, Ferrari, & States, Citation2019). Refinement and analysis of these data could create value, gain competitive advantage and improve performance in organisations. Organisations can study their customer’s behaviours and needs, respond them and designate the discrepancy between customers to provide goods and services tailored to them (Grover, Chiang, Liang, & Zhang, Citation2018).
According to the Gartner’s Institute, global investing in the field of big data analysis is rising uninterruptedly. In 2013, approximately 2.1 billion dollars and in 2014 nearly 3.8 billion dollars has been invested in this field. In the review of big businesses (e.g., GE), 87% believes that analysis and proper use of big data will change their competition in next three years. Additionally, 89% suppose that they will lose a significant portion of their market share during next year without employing the big data analysis’ techniques.
In order to extract knowledge from these data, data mining tools are used to identify, predict and respond to customers’ actions. Clustering methods are some of the tools applying in data mining. In this paper, customer analysis with strategic management approach and using data mining tools is employed to choose the best strategy for offering goods and services to customers and create value for them. For this purpose, the market is clustered focusing on the performance of 2,600,000 accounts in an Iranian bank to develop an appropriate strategy by experts after prioritising the clusters using Best Worst Method (henceforth BWM)-COmplex PRoportional ASsesment (henceforward COPRAS).
The remaining of this research is organised as follow. First the theoretical foundation of the research including data mining, Recency, Frequency, Monetary (Hereafter RFM) model, clustering, Multi Criteria Decision Making (henceforth MCDM) and digital banking strategies is reviewed. Afterwards, previous researches are presented, explained and analysed. Next, the clustering variables are computed based on RFM parameters. Subsequently, the market is clustered applying k-means method. Finally, the clusters are labelled by experts, prioritised by BWM-COPRAS and the marketing group has developed a digital banking strategy for the two customers’ most influential clusters.
2. Literature review
2.1. Data mining
The ability of generating, gathering and processing data from various resources has been improved due to extension of computers and ICT. Explosive growth in storing and transferring data have highlighted the need of mechanised techniques to convert data to knowledge. This need has led to emergence of a modern science in computers field called data mining (Cheng, Chen, Sun, Zhang, & Tao, Citation2018).
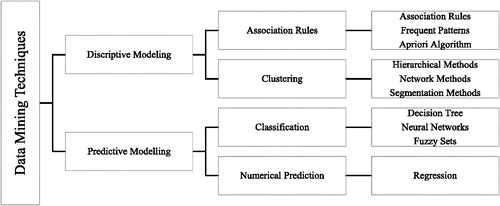
In other words, extracting the patterns accumulating in data banks, webs, data bases and data flows that express knowledge is labelled as data mining (Han, Kamber, & Pei, Citation2011). Data mining discusses some issues in statistics, machine learning, pattern recognition, data base technology, data recycling, network science, knowledge-based systems, artificial intelligence and etc. In the , some of the available tools in data mining are demonstrated. Among the tools in , clustering is used in this research.
Figure 1. Data mining techniques (Source created by authors).
2.2. Data modelling based on RFM model in banking industry
RFM is a model in customer value analysis. This model studies the customer value based on three parameters including the purchase frequency, monetary and recency. The basis of the suggested model is the balance of customers’ accounts (Roshan & Afsharinezhad, Citation2017). In this research the average balance of each customer’s accounts has been computed during 403 weeks and the below steps are performed.
The account balances are computed for each day (
).
The weekly average balance is calculated on previous step (
The maximum of the weekly average is determined applying (1).
There is a number as a maximum of the weekly average for each account. Formula 2 is used to compute the peak balance and analyse the customers with more than one account.
Note that in formula 2, is a number between zero and one. The experts have chosen 0.5 in this research considering conservative circumstances in banking industry of Iran. In the following, the RFM parameters are defined.
Recency. The number of the last week that the weekly balance is equal or more than peak balance.
Frequency. The number of the weeks that the weekly balance is equal or more than peak balance.
Monetary. The average of peak periods balance.
Moreover, the below assumptions are considered in RFM modelling.
Weeks starts at Saturday and ends in Fridays, considering Iranian national calendar;
The balances are calculated at the end of the working time of each day;
RFM has been modelled for customers’ accounts solely. The aggregation of the separate accounts of a customer should be discussed (Gultom et al., Citation2018).
2.3. Clustering
The process of placing data in the groups that have the most resemblance in some features is called clustering. Each cluster contains a set of data similar to other data in that cluster and different from data in other clusters (Han et al., Citation2011).
The subject matter in clustering is the similarities and differences of the samples. Similar samples are sat in a cluster; thus, data features are used to compare samples.
Distance is the similarity criterion and the formula to measure distance is significant in clustering. The distance assists the moving in data space and forming the clusters. The closeness of data is perceived by measuring the distance. There are different ways to measure distance (Jintana & Mori, Citation2019).
2.4. Best worst method
BWM is a new and efficient technique in MCDM. It is used to derive the weights of criterions in decision making. There are some approaches to BWM which is illustrated in .
Figure 2. Different approaches to BWM (Source created by authors).
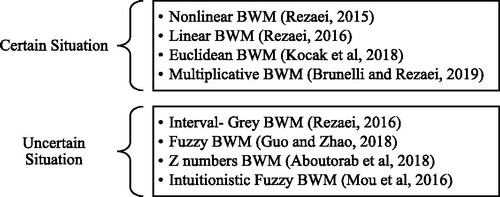
In this paper, nonlinear approach to BWM is employed. The steps of nonlinear BWM is described as below (Rezaei, Citation2015):
A set of decision criteria is determined (
The best and the worst criteria is elected by each expert or focus group decision;
The preference of the best criteria over the all criteria is determined using a number between 1 and 9 (
The preference of the all criteria over the worst criteria is determined using a number between 1 and 9 (
The optimal weights are found by solving the nonlinear (NLP) model of (3) (
BWM has been employed in many researches in recent years. Garoosi Mokhtarzadeh et al, in 2018 used BWM to find the weights of criterion to rank the technologies for R&D in an Iranian high tech company (Garoosi Mokhtarzadeh, Amoozad Mahdiraji, Beheshti, & Zavadskas, Citation2018).
Furthermore, Gupta performed BWM to prioritise the service quality attribute for airline industry (Gupta, Citation2018). Moreover, Rezaei et al., in 2018 applied BWM to assign weights to logistic performance index which is significant for policymakers (Rezaei, Roekel, Van, & Tavasszy, 2018). Note that, recently the integrations and applications of this method has been analysed and presented (Xiaomei et al., Citation2019)
2.5. COPRAS method
COPRAS is a MCDM technique introduced by Zavadskas to rank alternatives based on decision criteria (Zavadskas, Kaklauskas, & Sarka, Citation1994). The steps of this method are expressed below.
The decision matrix is formed.
In (4), X is the decision matrix and denotes the value of criteria jth for the alternative ith. In this matrix, m is the number of alternatives and n is the number of criteria.
The decision matrix is normalised by (5).
In (5), R is the normalised matrix and presents the normalised elements.
Weights are provided to the matrix by using (6).
Note that, D is the weighted normalised matrix and indicates the weighted normalised elements.
Weighted normalised scores are calculated for beneficial criteria as well as cost criteria employing (7).
Remark that, is the beneficial score and
is the cost score in (7).
Relative priority of alternatives (
Absolute priority of alternatives (
In current years, COPRAS has been performed in many researches. Beheshti et al., in 2016 used COPRAS-G to select organisational strategy found on boundaries of its resources (Beheshti, Amoozad Mahdiraji, & Zavadskas, Citation2016). Similarly, Arunodaya et al., in 2018 employed COPRAS under the condition of hesitant fuzzy sets to choose service quality (Arunodaya, Rani, & Pardasani, Citation2018).
Moreover, a mixed fuzzy approach of this method with BWM has been performed by Amoozad Mahdiraji et al., in 2018 to rank the key factors of the sustainable architecture (Amoozad Mahdiraji, Arzaghi, Stauskis, & Zavadskas, Citation2018). Furthermore, Roy et al., in 2019 applied COPRAS to prioritise hotels across several criteria from tourists’ view of point (Roy, Sharma, Kar, Zavadskas, & Saparauskas, Citation2019). Recently, a novel uncertain approach of this method has been presented (Garg & Nancy, Citation2019).
2.6. Digital banking strategy
Technology development in bank sector is critical to attract and maintain customers. Digital banking has been used to reach this aim via telephones, internet and mobiles (Mbama & Ezepue, Citation2018). Digital banking will begin a serious competition between banks with other banks and other financial actors e.g., finteches (Grym, Koskinen, & Mannien, Citation2018). Hence, developing an appropriate strategy for digital banking is crucial.
Digital banking influences on every aspect of banking and gains many competitive advantages such as providing more accessible products and reducing cash payments in markets (Nguyen & Dang, Citation2018). In return, banks face a wide range of challenges on the way of digitalisation for instance lack of infrastructural facilities, network problems, customers’ resistance in front of technology and etc. (Nayak, Citation2018).
Previous related researches in the field of data mining, clustering methods, big data and MCDM is reviewed in .
Table 1. Previous related researches.
According to , there are three types of related researches.
Type 1. Researches focusing on reviewing and developing the algorithms and methods;
Type 2. Researches demonstrating the application of these algorithms and methods in different fields e.g., banking industry.
Type 3. Researches comparing and analysing the use of different algorithms and methods on a similar problem.
However big data can create value in serving customers, though a few researches have been found to focus on the application of data mining in Iranian banking industry. Moreover, the volume of big data employed in other researches has been limited in most cases. Besides, developing digital banking strategy is not skilled adequately in Iranian banks and this can harm the success of the banks. After all, the capacity of data mining tools and the combination of these tools with MCDM methods has not employed sufficiently.
This research is similar to type two that combines clustering and MCDM techniques in a banking system to segment the customers and develop a strategy for each cluster. This research has a new approach to RFM and employs expert opinion which is novel among similar researches. Further, the huge volume of data are used in this research containing the data from over 2,600,000 accounts for 403 weeks (including more than 200 million transactions) in a bank. This research provides a framework to develop a digital banking strategy by applying the power big data and aggregation of data mining and MCDM methods. This framework can be practiced by Iranian banking industry and other analogous bank in other countries.
3. Research methodology
This research is performed on a specific real-world case study that employs data of transactions in a bank during 403 weeks. The research community is all the customers of a bank in Iran which is unnamed due to security considerations. There are 2,636,540 accounts in this bank. It should be noted that an account holder can have more than an account at the same time. Over 200 million transactions have been analysed during these weeks and the below steps are scheduled.
Step 1. Data Collection.
In the first step, financial transactions data of the customers are gathered from Oracle database. These data are anonymised by reason of preserving confidentiality. It means that customer’s personal data (e.g., account number, phone number and etc.) is changed in a way that doesn’t affect undesirably on research. All the data contain 260 million records.
Step 2. Data preparation.
RFM values described in 2.2 are calculated found on prepared data for each account. In total, 2,636,540 data records have been formed that each demonstrates an account data.
Step 3. Clustering.
The number of clusters is determined 6 based on the need of the bank (experts’ opinions). In this step the RFM data are clustered using IBM SPSS Modeller, employing the K-Means method.
Step 4. Ranking Clusters.
In this step, the clusters are named and ranked applying experts’ opinion and BWM-COPRAS methods. LINGO software is employed for this step.
Step 5. Strategy Development.
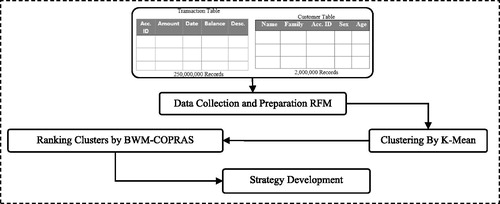
The significant clusters are preferred in this step. Experts can develop appropriate strategy for them. In , the methodology process is shaped.
Figure 3. Methodology process.
4. Research finding
In total, 2,636,540 data record have been formed that each demonstrates an account data. These data are gathered from transactions in Iran banking systems for 403 weeks; hence, Over 200 million transactions have been analysed during these weeks. RFM parameters are computed after data collection which was described in step 1. These data have been collected in collaboration with Kish Informatics Services Corporation which provides the banking information and communication infrastructure at national level.
As bolded in , the maximum of weekly average balances is 900 using Formula (1). Experts have determined , therefore the peak balance is 450 by formula (2). The weekly average balances are more than peak balances in 8 weeks. The average of these weeks is 796 and the last week with the balance more than peak balance is the 18th week. Hence, the result of step 2 is demonstrated in .
Figure 4. Average balances per week.
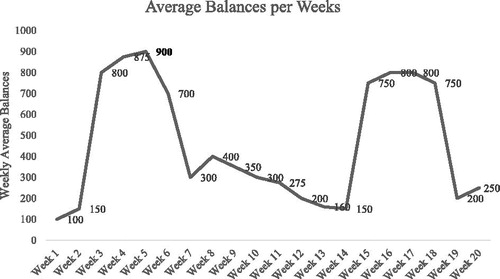
Table 2. RFM results.
In the following, the accounts are clustered applying k-means method found on step 3. The result is illustrated in .
Table 3. Clusters emanated from K-mean.
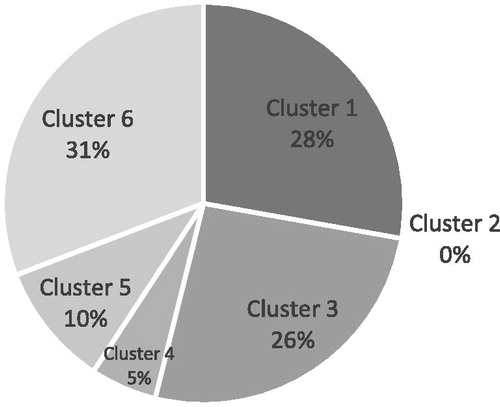
The cluster 6 includes the most frequency of the members and the cluster 2 has the least. pictures the relative frequency of clusters.
Figure 5. Frequency of members.
The clusters are named and ranked by experts and prioritised by BWM-COPRAS in step 4. First the experts elected the account balance as the most significant criteria. Name and Rank of clusters employing experts’ opinion is shown in . It is worth noting here that the experts of this research consist of highly ranked managers from Iranian Central Bank; thus, the results nearly present the real situation.
Table 4. Name and rank of clusters.
The meaning of each cluster is characterised in based upon experts’ decision.
Table 5. Description of clusters name.
In the following, 5 criteria are selected based upon focus group expert’s opinion including monetary average, frequency average, monetary standard deviation (SD), frequency SD and the frequency of members. Decision matrix is presented in .
Table 6. Decision matrix.
BWM method is used to derive the weights of criterions. Average of monetary has been determined as the most important and the frequency of members as the least important criteria by experts. displays the resulted weights.
Table 7. Weights derived by BWM.
Eventually, priority of the customer’s clusters by applying COPRAS could be viewed in .
Table 8. Cluster ranks by COPRAS.
As shown in , Cluster 2 is the most significant cluster which is similar to expert opinion expressed in . and demonstrate the comparison between Expert Opinion and COPRAS ranks.
Table 9. Comparison between expert opinion and COPRAS rank.
Figure 6. Comparing ranking results.
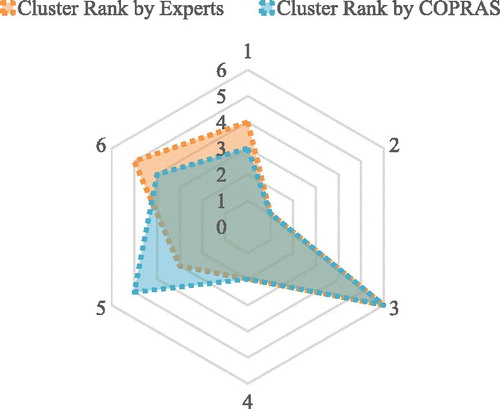
Expert opinion and COPRAS results are similar for clusters 2, 3 and 4 though dissimilar for cluster 1, 5 and 6. The reason of dissimilarity can be the frequency of members which is meaningless for experts; however, it is applied in COPRAS method.
Cluster 1 (silver- low interaction) and cluster 4 (loyal) are picked in order by experts and COPRAS as the most influential clusters and the digital banking strategy is developed for them which is described in .
Table 10. Digital banking strategy development.
5. Conclusion
This research has been implemented applying customer-oriented and service-centric approach. First, customers’ behaviour has been identified and studied employing bank transaction analysis. In the following, customers have been clustered by k-means and ranked by expert and BWM-COPRAS. Two influential clusters have been picked and digital banking strategy has developed for them according to .
Among various weighing methods in this research nonlinear BWM has been employed. Performing other possible weighing methods encompassing AHP, FARE, DEMATEL, Entropy or other BWM methods such as Euclidean, fuzzy, interval, multiplicative or Z numbers BWM may affect the results of this research.
In our proposed approach, expert’s opinion has been considered for weighing and ranking the clusters under certain circumstances. Considering this research under uncertain situations by performing grey, fuzzy, hesitant fuzzy, intuitionistic fuzzy or interval valued fuzzy could be interesting. Moreover, the ranking results could be compared with other similar methods such as VIKOR, LINMAP, TOPSIS, CODAS or EDAS.
Disclosure statement
The author reports no conflicts of interest.
References
- Amoozad Mahdiraji, H., Arzaghi, S., Stauskis, G., & Zavadskas, E. K. (2018). A hybrid fuzzy BWM-COPRAS method for analyzing key factors of sustainable architecture. Sustainability, 10(5), 1626–1626. doi:10.3390/su10051626
- Amoozad Mahdiraji, H., & Razavi Hajiagha, S. H. (2017). Strategy development and implementation. Tehran, Iran: Sanei Publication (in Persian).
- Ansari, A., & Riasi, A. (2016). Customer clustering using a combination of fuzzy C-means and genetic algorithms. International Journal of Business and Management, 11(7), 59–66. doi:10.5539/ijbm.v11n7p59
- Arunodaya, R. M., Rani, P., & Pardasani, K. R. (2018). Multiple-criteria decision-making for service quality selection based on Shapley COPRAS method under hesitant fuzzy sets. Granular Computing, 1(1), 1–15. doi:10.1007/s41066-018-0103-8
- Aryuni, M., & Miranda, E. (2018). Customer segmentation in XYZ bank using K-means and K-medoids clustering. 2018 International Conference on Information Management and Technology (ICIMTech); September 1–9.
- Bashiri Mosavi, A., & Afsar, A. (2018). Customer value analysis in banks using data mining and fuzzy analytic hierarchy processes. International Journal of Information Technology & Decision Making, 17(3), 819–840. doi:10.1142/S0219622018500104
- Beheshti, M., Amoozad Mahdiraji, H., & Zavadskas, E. K. (2016). Strategy portfolio optimisation: A COPRAS G-MODM hybrid approach management and business administration: Multidisciplinary perspective. Transformations in Business and Economics, 15(3), 500–519.
- Brunelli, M., & Rezaei, J. (2019). A multiplicative best – Worst method for multi-criteria decision making. Operations Research Letters, 47(1), 12–15. doi:10.1016/j.orl.2018.11.008
- Cebeci, Z., & Yildiz, F. (2015). Comparison of K-means and fuzzy C-means algorithms on different cluster structures. Journal of Agricultural Informatics, 6(3), 13–23. doi:10.17700/jai.2015.6.3.196
- Cheng, Y., Chen, K., Sun, H., Zhang, Y., & Tao, F. (2018). Data and knowledge mining with big data towards smart production. Journal of Industrial Information Integration, 9(1), 1–13. doi:10.1016/j.jii.2017.08.001
- Dursun, A., & Caber, M. (2016). Using data mining techniques for profiling profitable hotel customers: An application of RFM analysis. Tourism Management Perspectives, 18(1), 153–160. doi:10.1016/j.tmp.2016.03.001
- Fahad, A., Alshatri, N., Tari, Z., Alamri, A., Khalil, I., Zomaya, A. Y., … Bouras, A. (2014). A Survey of clustering algorithms for big data: Taxonomy and empirical analysis. IEEE Transactions on Emerging Topics in Computing, 2(3), 267–279. doi:10.1109/TETC.2014.2330519
- Garg, H., & Nancy, (2019). Algorithms for possibility linguistic single-valued neutrosophic decision-making based on COPRAS and aggregation operators with new information measures. Measurement, 138, 278–290. doi:10.1016/j.measurement.2019.02.031
- Garoosi Mokhtarzadeh, N., Amoozad Mahdiraji, H., Beheshti, M., & Zavadskas, E. K. (2018). A novel hybrid approach for technology selection in the information technology industry. Technologies Journal, 6(1), 1–17. doi:10.3390/technologies6010034
- Grover, V., Chiang, R. H. L., Liang, T.-P., & Zhang, D. (2018). Creating strategic business value from big data analytics: A research framework. Journal of Management Information Systems, 35(2), 388–423. doi:10.1080/07421222.2018.1451951
- Grym, A., Koskinen, K., & Mannien, O. (2018). Nordic banks go digital. Bank of Finland Bulletin: Bank of Finland Articles on the Economy.
- Gultom, S., Sriadhi, S., Martaino, M., & Simarmata, J. (2018). Comparison analysis of K-means and K-medoid with Ecluidience distance algorithm, Chanberra distance, and Chebyshev distance for big data clustering. IOP Conference Series: Materials Science and Engineering. doi:10.1088/1757-899X/420/1/012092
- Gupta, H. (2018). Evaluating service quality of airline industry using hybrid best worst method and VIKOR. Journal of Air Transport Management, 68, 35–47. doi:10.1016/j.jairtraman.2017.06.001
- Han, J., Kamber, M., & Pei, J. (2011). Data mining: Concepts and techniques (The Morgan Kaufmann series in data management systems). Burlington, MA: Morgan Kaufmann Publications.
- Hendalianpour, A., Razmi, J., & Gheitasi, M. (2017). Comparing clustering models in bank customers: Based on fuzzy relational clustering approach. Accounting, 3(2), 81–94. doi:10.5267/j.ac.2016.8.003
- Hiziroglu, A. (2013). Expert systems with applications soft computing applications in customer segmentation: State-of-art review and critique. Expert Systems with Applications, 40(16), 6491–6507. doi:10.1016/j.eswa.2013.05.052
- Jintana, J., & Mori, T. (2019). Customer clustering for a new method of marketing strategy support within the courier business. Academia Book Chapter, 31(2), 1–19.
- Julio, A., & Eugenia, V. (2014). Customer segmentation model based on value generation for marketing strategies formulation. Estudios Gerenciales, 30(130), 25–30. doi:10.1016/j.estger.2014.02.005
- Kahreh, M. S., Tive, M., Babania, A., & Hesan, M. (2014). Analyzing the applications of customer lifetime value (CLV) based on benefit segmentation for the banking sector. Procedia - Social and Behavioral Sciences, 109, 590–594. doi:10.1016/j.sbspro.2013.12.511
- Kantarcioglu, M., Ferrari, E., & States, U. (2019). Research challenges at the intersection of big data, security and privacy. Frontiers in Big Data, 2(1), 1–8. doi:10.3389/fdata.2019.00001
- Mbama, C. I., & Ezepue, P. O. (2018). Digital banking, customer experience and bank financial performance UK customers’ perceptions. International Journal of Bank Marketing, 12(4), 432–451. doi:10.1108/IJBM-11-2016-0181
- Mohammadian, M., & Makhani, I. (2016). RFM-based customer segmentation as an elaborative analytical tool for enriching the creation of sales and trade marketing strategies. International Academic Journal of Accounting and Financial Management, 3(6), 21–35.
- Motlagh, O., Berry, A., & Neil, L. O. (2019). Clustering of residential electricity customers using load time series. Applied Energy, 237, 11–24. doi:10.1016/j.apenergy.2018.12.063
- Murray, P. W., Agard, B., & Barajas, M. A. (2017). Market segmentation through data mining: A method to extract behaviors from a noisy data set. Computers & Industrial Engineering, 109, 233–252. doi:10.1016/j.cie.2017.04.017
- Nayak, R. (2018). A conceptual study on digitalization of banking, issues and challenges in rural India. International Journal of Management, IT and Engineering, 8(6), 186–198.
- Nguyen, T. P., & Dang, T. L. P. (2018). Digital banking in Vietnam current situation and recommendations. International Journal of Innovation and Research in Educational Sciences, 5(4), 418–420.
- Qi, Q., Tao, F., Zuo, Y., & Zhao, D. (2018). Digital twin and big data towards smart manufacturing and industry 4. Procedia Cirp, 72, 237–242. doi:10.1016/j.procir.2018.03.103
- Razavi Hajiagha, S. H., Hashemi, S. S., & Amoozad Mahdiraji, H. (2016). Fuzzy C-means based data envelopment analysis for mitigating the impact of units’ heterogeneity. Kybernetes, 45(3), 536–551. doi:10.1108/K-07-2015-0176
- Rezaei, J. (2015). Best-worst multi-criteria decision-making method. Omega, 53, 49–57. doi:10.1016/j.omega.2014.11.009
- Rezaei, J., Van Roekel, W. S., & Tavasszy, L. (2018). Measuring the relative importance of the logistics performance index indicators using Best Worst Method. Transport Policy, 68, 158–169. doi:10.1016/j.tranpol.2018.05.007
- Roy, J., Sharma, H. K., Kar, S., Zavadskas, E. K., & Saparauskas, J. (2019). An extended COPRAS model for multi-criteria decision-making problems and its application in web-based hotel evaluation and selection. Economic Research-Ekonomska Istraživanja, 32(1), 219–253. doi:10.1080/1331677X.2018.1543054
- Roshan, H., & Afsharinezhad, M. (2017). The new approach in market segmentation by using RFM model. Journal of Applied Research in Industrial Engineering, 4(4), 259–267. doi:10.22105/jarie.2017.91297.101
- Sajjadi, K., Firuzabadi, M. A. K., Amiri, M., & Sadaghiani, J. S. (2015). A developing model for clustering and ranking bank customers. International Journal of Electronic Customer Relationship Management, 9(1), 73. doi:10.1504/IJECRM.2015.070701
- Vahdatzad, M. A., & Khademi Zare, H. (2018). An evaluation method and clustering of credibly behavior of customers using AHP and fuzzy neural networks. Journal of Intelligent & Fuzzy Systems, 35(5), 5605–5617. doi:10.3233/JIFS-16323
- Wang, B., Miao, Y., Zhao, H., Jin, J., & Chen, Y. (2016). A Biclustering-based method for market segmentation using customer pain points. Engineering Applications of Artificial Intelligence, 47, 101–109. doi:10.1016/j.engappai.2015.06.005
- Wang, R., Ji, W., Liu, M., Wang, X., Weng, J., Deng, S., … Yuan, C-A. (2018). Review on mining data from multiple data sources. Pattern Recognition Letters, 109, 120–128. doi:10.1016/j.patrec.2018.01.013
- Xiaomei, M., Ming, T., Huchang, L., Wenjing, S., & Lev, B. (2019). The state-of-the-art survey on integrations and applications of the best worst method in decision making: Why, what, what for and what's next? Omega, 87, 205–225. doi:10.1016/j.omega.2019.01.009
- Zavadskas, E. K., Kaklauskas, A., & Sarka, V. (1994). The new method of multicriteria complex proportional assessment of projects. Technological and Economic Development of Economy, 1(3), 131–139.