
Abstract
Past financial crises have illustrated the importance of recognising the combinations of factors that can cause financial distress in the banking industry. Accordingly, this study uses fuzzy-set qualitative comparative analysis (fsQCA) to identify the combinations of factors that lead to bank failure. The data consist of 30 annual financial ratio series for 156 U.S. banks over a 15-year period (2001–2015). Identifying combinations of conditions that can produce bank failure is crucial to help regulators and bank managers. The fsQCA presented in this paper sheds light on the relationships between combinations of conditions and bank failure, providing a solution comprising two sufficient and disjunctive sets of conditions that lead to bank failure. This solution includes financial indicators of performance, asset quality, efficiency and capitalisation. The robustness of the two sets of conditions is assessed using several tests.
1. Introduction
The study of factors causing financial distress in the banking industry is a matter of public concern that deserves thorough consideration. Identifying such factors may improve regulators’ ability to anticipate banking crises. Moreover, early distinction between distressed and financially sound banks may well facilitate timely action to reform troubled financial institutions or even to protect healthy ones.
The bailout and restructuring of a troubled banking sector has taken a heavy toll on taxpayers in past financial crises and may, in turn, induce turmoil in other markets such as the currency market, further harming the economy. Moreover, banking industry crises are often accompanied by a credit crunch that leads to underuse and misallocation of funds, a situation that may also hinder economic growth.
Although each financial crisis has its own distinctive features, most financial crises share underlying causes and outcomes (Dell’Ariccia, Igan, & Laeven, Citation2012). Therefore, it is important to develop models that are capable of identifying combinations of factors that produce bank financial distress but are not excessively tied to the economic and financial circumstances surrounding a specific crisis. In this paper, fuzzy-set qualitative comparative analysis (fsQCA) is performed to find combinations of factors that lead to bank financial distress.
In a comprehensive study, Jones, Johnstone, and Wilson (Citation2015) compared the predictive performance of classifiers ranging from conventional classifiers (such as logit, probit and linear discriminant analysis) to fully non-linear classifiers, including neural networks, support vector machines and recent statistical learning techniques such as generalised boosting, AdaBoost and random forests. The newer classifiers outperformed all other classifiers. In exploring financial distress, Zięba, Tomczak, and Tomczak (Citation2016) compared methods based on statistical hypothesis testing, statistical modelling (e.g. generalised linear models) and recent artificial intelligence methods (e.g. neural networks, support vector machines and decision trees). They examined the quality of various machine learning approaches designed to solve two-class problems. Extreme gradient boosting yielded the best results.
To the best of our knowledge, this is the first time that fsQCA has been applied to business failure in the banking industry. In a thorough review of the literature, no studies applying this method to bank failure were found. To remedy this lack of fsQCA studies of failure in the banking sector, this paper presents the results of fsQCA of bank failure. This study should be regarded as an extension of a prior study on bank failure prediction in the United States (Carmona, Climent, & Momparler, Citation2019), in which the extreme gradient boosting method was applied over the same sampling period.
The remainder of the paper is organised as follows. Section 2 presents a review of the literature on bank failure. Section 3 describes the data. Section 4 discusses the method. Section 5 presents the results of the analysis. Section 6 offers the main conclusions and managerial implications of the paper.
2. Literature review
In an early study of bank financial distress, Meyer and Pifer (Citation1970) developed a model to analyse bank failure by matching each failed bank with a comparable solvent bank. They thus identified financial variables that can potentially indicate insolvency. They concluded that insolvency is indicated by factors such as fraud and other financial irregularities.
Boyd and Runkle (Citation1993) linked indicators of bank failure to bank size rather than market-wide competition measures such as the Herfindahl index and concentration ratios. Arguably, bank size is likely to correlate with market power, so the findings of this study are at least suggestive of bank failure. They found that the probability of failure is essentially unrelated to bank size.
Lane, Looney, and Wansley (Citation1986) compared techniques for developing failure prediction models. They used the Cox proportional hazards model to create a bank failure prediction model. This model constitutes a semi-parametric technique based on survival analysis. The authors compared survival analysis with discriminant analysis, showing that survival analysis yields better results in two-year-before-failure models.
Kumar and Ravi (Citation2007) classified failure prediction methods in two groups: statistical and intelligent techniques. Statistical techniques include logistic regression and factor analysis. Intelligent techniques include neural networks, nearest neighbour classifiers, operations research methods and decision tree induction methods. They concluded that each standard algorithm has pros and cons.
Demyanyk and Hasan (Citation2010) reviewed the empirical results presented in economics and operations research on bank failures. Their paper outlines the methods used in previous studies, including an extensive review of intelligence techniques used in the operations literature to predict bank failure.
Cao, Wan, and Wang (Citation2011) predicted financial distress for Chinese listed companies using an integrated model of rough set theory and support vector machines. The aim was to improve early warning methods and enhance prediction accuracy. The support vector machine was found to perform better than the model of rough set theory.
Olson, Delen, and Meng (Citation2012) applied a variety of data mining tools to bankruptcy data to compare accuracy and number of rules. Decision trees were found to be more accurate than neural networks and support vector machines, albeit with an undesirably high number of rule nodes.
Ecer (Citation2013) compared the ability of artificial neural networks and support vector machines to predict the failure of Turkish commercial banks. Neural networks were observed to have a slightly better predictive ability than support vector machines. In a similar context, Eygi (Citation2013) applied support vector machines to bank distress analysis using practical steps for 42 Turkish failed and non-failed banks between 1997 and 2003. The results indicate that support vector machines are capable of extracting useful information from financial data and can be used as part of an early warning system.
Moldovan and Mutu (Citation2015) identified the relationship between banks’ probability of default and risk-taking incentives. They applied cluster analysis to a large set of bank-level financial data from 203 European banks for the years 2005 to 2013. The results reveal two very different groups in the data set within each year based on both the hierarchical trees and the k-means clustering algorithms. Finally, when mapping clusters to the distance to default computed through the z-score variable, they showed that large banks with high liquidity risk enhance their default risk.
Fejér-Király (Citation2015) presented a summary of bankruptcy prediction research, noting the most widely used models. The paper also provides a summary of the most cited papers that discuss the development of bankruptcy prediction and papers that have contributed to bankruptcy prediction. Some criticisms of bankruptcy prediction that can be found in the literature are also mentioned, and suggestions for future research on bankruptcy prediction are provided. For example, the timeframe should be chosen carefully because if there are economic changes beyond the financial ratios, the model should contain key macroeconomic variables too. Moreover, bankruptcy is the effect of a misleading human factor and the economic situation. Therefore, the use of only financial variables is not enough.
SirElkhatim and Salim (Citation2015) conducted a comprehensive review of the literature on techniques that have been used to assist the prediction of bank distress and found that intelligent hybrid techniques are highly valued methods in terms of accuracy and reputation. Momparler, Carmona, and Climent (Citation2016) applied the boosted classification tree method to predict failure in the EU banking sector between 2006 and 2012. They identified four key variables that can help anticipate and prevent bank financial distress.
Tian and Yu (Citation2017) studied bankruptcy prediction in the international market using the Compustat Global database. They applied a variable selection method (adaptive least absolute shrinkage and selection operator, or LASSO) to select a parsimonious set of default predictor variables. For the Japanese market, three predictor variables (retained earnings/total assets, total debt/total assets and current liabilities/sales) were selected by the adaptive LASSO method. For certain European countries, including the UK, Germany and France, the equity ratio variable (equity/total liabilities) was consistently selected across different prediction horizons, whereas the other selected variables varied.
Ekinci and Erdal (Citation2017) analysed bank failure prediction for 37 commercial banks operating in Turkey between 1997 and 2001 using three common machine learning models. Logistic, J48 and voted perceptron were used as the base learners. The experimental results indicate that hybrid ensemble machine learning models outperform conventional base and ensemble models.
Le and Viviani (Citation2018) compared the accuracy of traditional statistical techniques (discriminant analysis and logistic regression) and machine learning techniques (artificial neural networks, support vector machines and k-nearest neighbours) that attempt to predict the failure of banks. The empirical results indicate that the artificial neural network and k-nearest neighbour methods are the most accurate.
Carmona et al. (Citation2019) used extreme gradient boosting to predict bank failure in the U.S. banking sector. The findings indicate that lower values for retained earnings to average equity, pre-tax return on assets and total risk-based capital ratio are associated with a higher risk of bank failure. In addition, an exceedingly high yield on earning assets increases the chance of bank financial distress.
3. Data
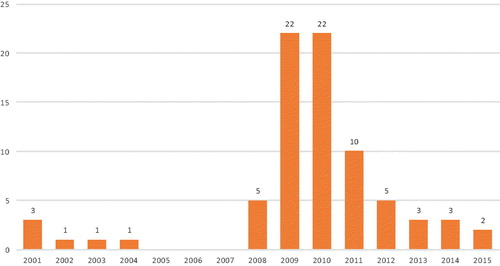
The cross-sectional data used in this study consisted of 30 annual financial ratio series (2001–2015) for 156 U.S. national commercial banks, where 78 failed banks () were matched with 78 non-failed banks of a similar size in terms of total assets. The data source was the Federal Deposit Insurance Corporation database. We included all available financial ratios and total assets (the appendix).
Figure 1. Failed U.S. national banks (2001–2015).
Source: fdic.gov. Note: There were no bank failures from 2005 to 2007.
4. Method
This paper uses one of the set-theoretic methods introduced by Ragin (Citation1987, Citation2000, Citation2008), namely fsQCA. This method is located at the intersection between variable-oriented and case-oriented research. FsQCA largely fits the causes-of-effects approach by testing whether a condition or combination of conditions is necessary and/or sufficient for the presence of the outcome. It also aims to reveal the minimal (combinations of) conditions that lead to a particular outcome (Vis, Citation2012). In doing so, fsQCA enables exploration of more complex pathways. Fiss (Citation2011) noted that set-theoretic methods differ from conventional, variable-based approaches in that they do not disaggregate cases into their independent, analytically separate aspects but instead treat configurations as different types of cases.
Hsu, Woodside, and Marshall (Citation2013) also affirmed that this method seems more appropriate if an outcome is often the result of complex interactions because fsQCA helps researchers to find patterns in the condition variables for the cases they study and to make sense of the variables. In addition, thinking in terms of alternative mechanisms indicates that several causal recipes might be related to the outcome (or response variable), which is a better approach than developing theory and thinking in terms of relative impacts of independent variables (Woodside, Citation2013). The goal of ordinary least-squares regression methods is to ascertain whether, in a population of cases, an individual variable has a significant effect, which may be positive or negative, on the dependent variable. This effect is considered net of the effects of the other variables. Regression gives us the magnitude and direction of the effect of a variable, net of other variables included in the model. However, fsQCA is not concerned with independent effects; instead, it deals with combined effects. FsQCA focuses on showing the conditions that lead to a given outcome or finding combinations of causal measures that lead to the outcome (Elliot, Citation2013). Consequently, this method has major advantages over traditional statistical techniques such as multiple regression analysis.
In regression, it is common for cases to disappear behind variables and their coefficients. In contrast, in fsQCA, it is necessary to consider both variables —or conditions that lead to the outcome— and observations —or cases that are explained by a causal configuration (Schneider & Grofman, Citation2007).
FsQCA is used to analyse in detail how causal conditions lead to a particular outcome. FsQCA relies on a configurational understanding of how causes are combined to bring about outcomes. The method can handle considerable causal complexity (Ragin, Citation2000, Citation2008). FsQCA describes cases as the combination of causal conditions and the outcome rather than constituting a single condition.
In fsQCA, variables are converted into sets to examine what combination of causal sets leads to the outcome set. This approach can show which combination or combinations of antecedent conditions (the set-theoretic equivalent of independent variables) are most likely to produce an outcome (the set-theoretic equivalent of the dependent variable). The result is a number of different combinations, called configurations or causal recipes, that enable the presence of the outcome under analysis (Longest & Vaisey, Citation2008). In this study, the goal is to determine what combination of financial ratios constitutes a subset of failed banks (outcome). Therefore, this study intends to determine the conditions or configurations that could lead to bank failure, revealing complex pathways to this outcome.
Crucially, the results of fsQCA do not prove causal relationships. Instead, they reveal patterns of associations across sets of cases or observations, thereby providing support for the existence of such causal relationships (Schneider & Wagemann, Citation2010). This method seeks to establish logical connections between combinations of causal conditions and a given outcome. It produces rules that illustrate the sufficiency between subsets of all possible combinations of causal conditions and the outcome. Therefore, fsQCA does not have causal identification as a goal, and a combination of conditions that is sufficient for the presence of a certain outcome must be interpreted under the laws of Boolean algebra based on the available data.
Fiss (Citation2011) has argued that the basic intuition underlying fsQCA is that cases are best understood as configurations of attributes resembling overall types and that a comparison across cases can allow the researcher to strip away attributes that are unrelated to the outcome in question.
5. Results
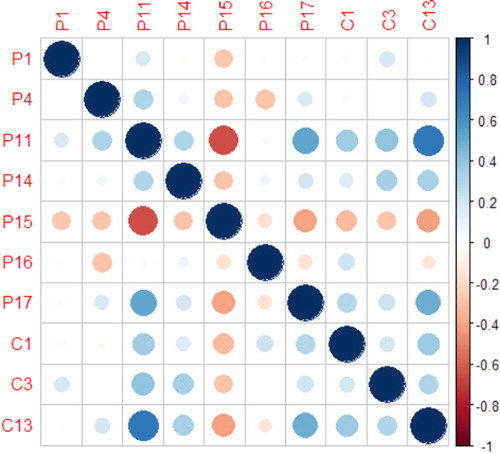
The initial conditions are 30 annual financial ratios and the bank’s total assets, as mentioned earlier (also see the appendix ). Before proceeding with the analysis, we checked for the presence of high correlations between variables using the matrix of Pearson’s correlation coefficients. We observed high correlations between some of these variables. We therefore dropped some of the ratios shown in the appendix. The following ratios were not correlated: P1, P4, P11, P14, P15, P16, P17, C1, C3 and C13. Thus, the analysis considers these 10 conditions to identify causal relationships leading to the outcome of bank failure. The correlogram plot () shows the non-highly correlated variables (conditions). A correlogram illustrates the amount of correlation between variables.
Figure 2. Correlogram plot of financial ratios taken as conditions. Source: The Authors.
These 10 non-correlated financial ratios are the conditions considered in this study as possible antecedents of the outcome of bank failure. shows a summary of all conditions, which are defined in their raw form as continuous variables.
Table 1. Conditions.
The methodological approach of this study sheds light on the causal relationships between the configurations of conditions and failed banks (the outcome of interest).
5.1. Data calibration
Calibration of the conditions into sets is mandatory when performing fsQCA. Calibration is analogous to a z-scale transformation of original data (Woodside, Citation2013). It is the process of expressing a degree of set membership and requires the use of three thresholds or breakpoints: full membership (value of 1), full non-membership (value of 0) and cross-over point where the case is neither in nor out of the set (value of 0.5). The first stage of fsQCA is to transform the variables into calibrated sets.
For the calibration of the conditions to obtain the fuzzy sets, we used a percentile-based approach because the variables were defined in their raw form as continuous variables. The 20th percentile, the 50th percentile and the 80th percentile provided the breakpoints for full non-membership, the cross-over point and full membership, respectively.
In fsQCA, it is also important to consider negated sets or the absence of a set. In this study, negated sets are denoted by writing the set name in lower case. These conditions do not contribute to the outcome.
All models were fitted in R version 3.5.1 (R Core Team, Citation2018). For fsQCA, we used QCA package version 3.3 (Dusa, Citation2019).
5.2. Analysis of the conditions leading to bank failure
Qualitative comparative analysis (QCA) involves exploring the conditions or combinations of conditions that are sufficient or necessary for some outcome to occur. The data must be analysed to detect which combinations of attributes are sufficient to obtain the outcome. Additionally, the researcher must examine the data for combinations of attributes that are necessary to obtain the outcome in question (Fiss, Citation2011).
5.3. Sufficiency of conditions
Sufficient conditions always produce the outcome. Cases that correspond to sufficient conditions also correspond to the outcome. The sufficient condition set is a subset of the outcome set. It requires the construction of the truth table, which involves identifying all possible combinations of causal conditions or recipes – one row for each combination – that produce the outcome. In other words, it consists of all logically possible combinations of condition sets (Fiss, Citation2011). Cases are thus assigned to the combinations for which their membership scores are greater than 0.5. Next, commonalities amongst the configurations produce that the outcome is analysed using Boolean algebra. The Quine-McCluskey algorithm is typically used to perform the logical reduction of statements (Fiss, Citation2007).
For k conditions, the truth table has 2k rows. The current study considers 10 conditions. Consequently, the number of possible combinations is 1024 (210). The truth table shows which combinations of causal sets lead to the outcome.
Two descriptive performance measures are used to assess fuzzy-set relationships: consistency and coverage (Hsu et al., Citation2013). In relation to sufficiency, consistency is the proportion of cases where a condition (or configuration) and an outcome both occur with respect to the total number of cases where the same condition (or configuration) occurs (Dusa, Citation2019). Thus, consistency is the degree to which cases are members of the conditions and the outcome in relation to their overall membership to the conditions. In addition, for relationships of sufficiency, the coverage provides a measure to calculate how much of the outcome is ‘explained’ by a given causal condition. For relationships of sufficiency, a condition is more important for the outcome when it has a higher coverage. Coverage is the degree to which cases are members of conditions and the outcome in relation to their overall membership to the outcome. When a causal condition covers exactly 100% of the outcome, it is not only sufficient but also necessary for the outcome. Hsu et al. (Citation2013) described how consistency scores are analogous to Pearson’s r coefficient in statistical analysis and how coverage is analogous to the coefficient of determination, R2, in statistical analysis. In summary, whereas coverage indicates the empirical relevance of a solution (the higher the better), consistency quantifies the extent to which cases that share similar conditions correspond to the same outcome.
displays the results of the analysis of sufficient conditions for the outcome of bank failure, showing an acceptable consistency value of 0.820 and a reasonable raw coverage of 0.538. The raw coverage of a prime implicant refers to all of this prime implicant, whereas its unique coverage refers only to that part of a prime implicant that does not overlap with any other prime implicants in the solution (Cooper & Glaesser, Citation2012). Dusa (Citation2019) explained that a similar phenomenon occurs in regression analysis. Two independent variables can have their own R2 explaining the dependent variable, but if the independent variables are collinear, then much of their independent explanations overlap, and the overall R2 for the entire regression model is not equal to the sum of the individual explanations.
Table 2. Analysis of sufficient conditions for the outcome of bank failure.
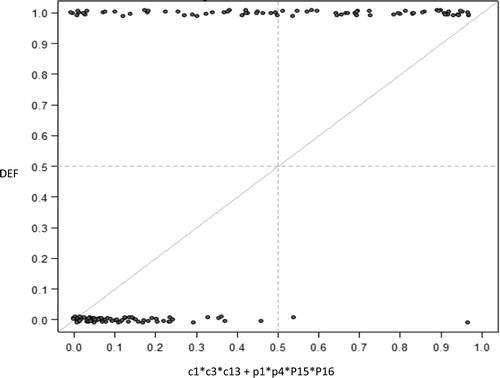
Two combinations of conditions lead to bank failure, giving a solution of one minimal sum that contains two prime implicants: 1) low values of earning assets to total assets ratio (c1), low values of loss allowance to non-current loans and leases ratio (c3) and low levels of total risk-based capital ratio (c13); and 2) low values of yield on earning assets ratio (p1), low levels of non-interest income to assets ratio (p4), high values of the efficiency ratio (P15) and high values of assets per employee (P16).
The configurations in show the two different paths that lead to bank failure. Therefore, more than one combination of conditions is sufficient for the outcome. presents the results graphically. For a condition to be sufficient, most cases should be located around or above the bisecting line (Ragin, Citation2000).
Figure 3. Sufficient conditions for the outcome of bank failure.
Notes: Lower-case letters indicate the absence of the condition. DEF: Defaulting bank. Remaining variables are defined in the appendix. Source: The Authors.
5.4. Robustness analysis for sufficiency
In fuzzy sets, it is possible for a condition or a causal configuration to be consistent with both the outcome and the negation of the outcome in a seemingly paradoxical relationship. Care must be taken because certain cases confirm a situation in which a condition may be sufficient for an outcome as well the negation of that outcome (Dusa & Alrik, Citation2013). It means, it is necessary to perform the algorithm for the negation of the outcome. Results show none of the two identify causal configurations have a high enough consistency score in relation to the negation of the outcome bank failure to confirm a paradoxical relationship (). Another problem could arise from the fact that a relationship of sufficiency between a condition and the outcome may be as strong as the evidence for the existence of a relationship of sufficiency between the negation of the condition and the outcome (Dusa & Alrik, Citation2013). The outcomes of this analysis do not confirm sufficiency for the negation of the causal conditions. Therefore, the scores of the negation of the combination of conditions are low enough to confirm this contradiction ().
Table 3. Analysis of sufficient conditions for the negation of the outcome of bank failure (def).
Table 4. Analysis of sufficiency for the negation of the causal conditions.
5.5. Necessity of conditions
A necessary condition means that the condition must be present for the outcome to occur, although its presence might not be sufficient for that outcome to occur (Dul, Citation2016). To analyse relationships of necessity, the critical question is whether the condition always produces the desired outcome. When a condition is required for the outcome, then it is necessary. The outcome set is a subset of the necessary condition set; likewise, the necessary condition is a superset of the outcome. Observations containing the outcome also contain the necessary condition, but they are important enough to be a necessary part of the causal mix: Whatever causal combination it contains, the mix will always contain those necessary conditions (Dusa, Citation2019).
In relationships of necessity, consistency refers to the proportion of an outcome that is included in a given condition. In terms of consistency, a set X is necessary for a set Y when the fuzzy scores of Y are consistently lower than the fuzzy scores of X across all cases (when the fuzzy scores of Y consistently display a subset relation with X). In such a situation, the set Y is included in the set X because most of their intersection belongs to Y (or covers Y). Therefore, we can say that the consistency of necessity is high (Dusa, Citation2019). In contrast, coverage is a measure of how trivial or relevant a necessary condition is for an outcome. It measures the proportion within a condition that is covered by the outcome. Thus, coverage is the degree to which observations are members of conditions in relation to their overall membership of failed banks.
Schneider & Wagemann (Citation2007) recommend considering conditions to be necessary only if their consistency scores are very high. The R package QCA (Dusa, Citation2019) offers a useful function called superSubset(), which explores every possible relationship of necessity for individual conditions, conjunctions and all possible disjunctions of conditions that are necessary for a given outcome ().
Table 5. Analysis of necessary conditions for the outcome of bank failure.
Two single conditions were observed to be individually necessary for the outcome (p11 and p14). A low value for ‘retained earnings to average equity’ (p11) has the maximum consistency and coverage score, making a low value of this ratio a necessary condition for bank failure. Therefore, according to these results, bank failure can only be expected in entities that have low retained earnings to average equity. Similarly, a low value of ‘earnings coverage of net loan charge-offs’ (p14) is a necessary condition for bank failure.
5.6. Robustness analysis for necessity
A situation in which the evidence for the existence of a relationship of necessity between a condition and the outcome is as sufficiently strong as the evidence for the existence of a relationship of necessity between the negation of this condition and the outcome represents a problem in the analysis of relationships of necessity (Dusa & Alrik, Citation2013). The results in show that all necessity consistency scores of the negated combinations are low enough to indicate a possible relationship of necessity to the outcome, indicating the absence of the aforementioned problem.
Table 6. Analysis of the negation of the necessary conditions for the outcome of bank failure.
Another contradiction could arise if a relationship of necessity between a condition and the outcome was as strong as the evidence for the existence of a relationship of sufficiency between the condition and the negation of the outcome (Dusa & Alrik, Citation2013). The results of this analysis fail to confirm necessity for the negation of the outcome, and the consistency scores of the negation of the outcome are low enough to accept this contradiction ().
Table 7. Analysis of the necessary conditions for the negation of the outcome of bank failure.
6. Conclusions
The purpose of this study was to identify the combinations of factors that lead to bank failure in the U.S. banking sector. Empirical analysis was conducted using fsQCA. The sampling strategy of case-control matching helped eliminate any bias between failed and non-failed banks. The ultimate goal was to identify sets of variables associated with bank failure to support managers’ and regulators’ efforts to prevent bank financial distress.
This study is the first in which fsQCA has been applied to business failure in the banking industry. The fsQCA method reveals both necessary and sufficient conditions leading to bank failure. The most relevant necessary condition for bank failure is a low value of ‘earnings coverage of net loan charge-offs’.
There are two sufficient and disjunctive sets of conditions that lead to bank failure. The robustness of the two sets of conditions combined is assessed using several tests. When jointly considered, the two groups of financial ratios are a powerful indicator of bank failure and deserve special attention.
One indicative set of ratios comprises two performance indicators (low earning assets to total assets and low loan loss allowance to total loans and leases) and a capitalisation indicator (low risk-based capitalisation). Therefore, whenever non-performing assets (mostly bad loans) account for a large share of banks’ balance sheets and the levels of risk coverage (loan loss provisioning) and capitalisation are low, then the chances of bank failure are high.
Another revealing set of ratios includes four different conditions that may lead to bank failure, including two performance ratios (low yields on earning assets and low non-interest income to assets) and two efficiency ratios (high values of the efficiency ratio and high assets per employee). The counterintuitive nature of this last ratio (high assets per employee) deserves further research through qualitative analysis of bank financial statements.
Consequently, the joint effect of low interest loans, low commissions on banking services, high overhead expenses and a large size makes financial distress more likely in the banking industry. Although size per se should not be a problem, it is highly likely that asset risk control weakens as the volume of assets managed per employee exceeds certain levels.
From a managerial perspective, this paper sheds light on bank financial distress and serves as an innovative tool to explain the diverse aspects of the banking business. To improve efficiency and avoid bank financial distress, managers should not only consider banking industry benchmarks but also monitor their own historical records and act upon the financial indicators included in both sets of sufficient conditions.
In summary, the causal relationships discussed in this paper should encourage bank managers to track seven scorecard variables identified in the two sets of sufficient conditions that make up the solution. Managers may prevent financial distress by monitoring the seven scorecard variables and acting appropriately rather than waiting for regulators’ warnings. Regulators may also find the model useful to spot and advise potentially distressed banks.
This study ignores the economic environment of bank failure. Future research on bank failure should consider a multifactor approach that includes variables in areas other than accounting and finance.
Disclosure statement
No potential conflict of interest was reported by the author(s).
Additional information
Funding
References
- Boyd, J. H., & Runkle, D. E. (1993). Size and performance of banking firms: Testing the predictions of theory. Journal of Monetary Economics, 31(1), 47–67. doi:10.1016/0304-3932(93)90016-9
- Cao, Y., Wan, G., & Wang, F. (2011). Predicting financial distress of Chinese listed companies using rough set theory and support vector machine. Asia-Pacific Journal of Operational Research, 28(1), 95–109. doi:10.1142/S0217595911003077
- Carmona, P., Climent, F., & Momparler, A. (2019). Predicting failure in the U.S. banking sector: An extreme gradient boosting approach. International Review of Economics & Finance, 61, 304–323. doi:10.1016/j.iref.2018.03.008
- Cooper, B., & Glaesser, J. (2012). Qualitative work and the testing and development of theory: lessons from a study combining cross-case and within-case analysis via Ragin's QCA [53 paragraphs]. Forum Qualitative Sozialforschung/Forum: Qualitative Social Research, 13(2), Art.4, http://nbn-resolving.de/urn:nbn:de:0114-fqs120247.
- Dell’Ariccia, G., Igan, D., & Laeven, L. (2012). Credit booms and lending standards: evidence from the subprime mortgage market. Journal of Money, Credit and Banking, 44(2–3), 367–384. March–April 2012, doi:10.1111/j.1538-4616.2011.00491.x
- Demyanyk, Y., & Hasan, I. (2010). Financial crises and bank failures: A review of prediction methods. Omega, 38(5), 315–324. doi:10.1016/j.omega.2009.09.007
- Dul, J. (2016). Necessary condition analysis (NCA): Logic and methodology of “necessary but not sufficient” causality. Organizational Research Methods, 19(1), 10–52. doi:10.1177/1094428115584005
- Dusa, A. (2019). QCA with R. A comprehensive resource. New York, NY: Springer International Publishing.
- Dusa, A., & Alrik, T. (2013). Qualitative comparative analysis with R. New York, NY: Springer.
- Ecer, F. (2013). Comparing the bank failure prediction performance of neural networks and support vector machines: the Turkish case. Economic Research-Ekonomska Istraživanja, 26(3), 81–98. doi:10.1080/1331677X.2013.11517623
- Ekinci, A., & Erdal, H. I. (2017). Forecasting bank failure: Base learners, ensembles and hybrid ensembles. Computational Economics, 49(4), 677–686. doi:10.1007/s10614-016-9623-y
- Elliot, T. (2013). Fuzzy set qualitative comparative analysis. Retrieved December 20, 2018, from http://thomaselliott.me/pdfs/fsqca.pdf.
- Eygi, B. (2013). Prediction of bankruptcy using support vector machines: an application to bank bankruptcy. Journal of Statistical Computation and Simulation, 83(8), 1543–1555.
- FDIC. Bank Failures in Brief. www.fdic.gov/bank/historical/bank/index.html. Retrieved December 2016.
- Fejér-Király, G., (2015). Bankruptcy prediction: A survey on evolution, critiques, and solutions. Acta Universitatis Sapientiae, Economics and Business, 3, 93–108. doi:10.1515/auseb-2015-0006
- Fiss, P. C. (2007). A set-theoretic approach to organizational configurations. Academy of Management Review, 32(4), 1180–1198. doi:10.5465/amr.2007.26586092
- Fiss, P. C. (2011). Building better causal theories: a fuzzy set approach to typologies in organization research. Academy of Management Journal, 54(2), 393–420. doi:10.5465/amj.2011.60263120
- Hsu, S., Woodside, A., & Marshall, R. (2013). Critical tests of multiple theories of cultures’ consequences. Journal of Travel Research, 52(6), 679–704. doi:10.1177/0047287512475218
- Jones, S., Johnstone, D., & Wilson, R. (2015). An empirical evaluation of the performance of binary classifiers in the prediction of credit ratings changes. Journal of Banking & Finance, 56, 72–85. doi:10.1016/j.jbankfin.2015.02.006
- Kumar, P. R., & Ravi, V. (2007). Bankruptcy prediction in banks and firms via statistical and intelligent techniques–A review. European Journal of Operational Research, 180, 1–28. doi:10.1016/j.ejor.2006.08.043
- Lane, W. R., Looney, S. W., & Wansley, J. W. (1986). An application of the Cox proportional hazards model to bank failure. Journal of Banking & Finance, 10, 511–531. doi:10.1016/S0378-4266(86)80003-6
- Le, H. H., & Viviani, J.-L. (2018). Predicting bank failure: An improvement by implementing a machine-learning approach to classical financial ratios. Research in International Business and Finance, 44, 16–25. doi:10.1016/j.ribaf.2017.07.104
- Longest, K. C., & Vaisey, S. (2008). Fuzzy: A program for performing qualitative comparative analyses (QCA) in Stata. The Stata Journal: Promoting Communications on Statistics and Stata, 8(1), 79–104. doi:10.1177/1536867X0800800106
- Meyer, P. A., & Pifer, H. W. (1970). Prediction of bank failures. The Journal of Finance, 25(4), 853–868. doi:10.2307/2325421
- Moldovan, D., & Mutu, S. (2015). A cluster analysis on the default determinants in the European banking sector. In W. Abramowicz (Ed.), Business information systems workshops (BIS 2015). Lecture notes in business information processing, vol 228, pp. 64–74. Springer.
- Momparler, A., Carmona, P., & Climent, F. (2016). Banking failure prediction: a boosting classification tree approach. Spanish Journal of Finance and Accounting / Revista Española de Financiación y Contabilidad, 45(1), 63–91. doi:10.1080/02102412.2015.1118903
- Olson, D., Delen, D., & Meng, Y. (2012). Comparative analysis of data mining methods for bankruptcy prediction. Decision Support Systems, 52(2), 464–473. doi:10.1016/j.dss.2011.10.007
- R Core Team (2018). R: A language and environment for statistical computing. Vienna, Austria: R Foundation for Statistical Computing. Retrieved from http://www.R-project.org
- Ragin, C. C. (1987). The comparative method: Moving beyond qualitative and quantitative strategies. Berkeley: University of California Press.
- Ragin, C. C. (2000). Fuzzy set social science. Chicago, IL: University of Chicago Press.
- Ragin, C. C. (2008). Redesigning social inquiry: Fuzzy sets and beyond. Chicago, IL: University of Chicago Press.
- Schneider, C. Q., Grofman, B. (2006). It might look like a regression equation … but it's not! An intuitive approach to the presentation of QCA and FS/QCA results. COMPASSS working paper n. 39. http://www.compasss.org/wpseries/SchneiderGrofman2006.pdf
- Schneider, C. Q., & Wagemann, C. (2007). Qualitative Comparative Analysis (QCA) und Fuzzy Sets: Ein Lehrbuch für Anwender und jene, die es werden wollen. Opladen/Farmington Hills, MI: Barbara Budrich.
- Schneider, C. Q., & Wagemann, C. (2010). Standards of good practice in qualitative comparative analysis (QCA) and fuzzy-sets. Comparative Sociology, 9(3), 397–418. doi:10.1163/156913210X12493538729793
- SirElkhatim, M. A., & Salim, N. (2015). Prediction of banks financial distress. Journal of Engineering and Computer Sciences, 16(1), 40–55.
- Tian, S., & Yu, Y. (2017). Financial ratios and bankruptcy predictions: An international evidence. International Review of Economics and Finance, 51, 510–526.
- Vis, B. (2012). The comparative advantages of fsQCA and regression analysis for moderately large-N analyses. Sociological Methods & Research, 41(1), 168–198. doi:10.1177/0049124112442142
- Woodside, A. (2013). Moving beyond multiple regression analysis to algorithms: Calling for adoption of a paradigm shift from symmetric to asymmetric thinking in data analysis and crafting theory. Journal of Business Research, 66(4), 463–472. doi:10.1016/j.jbusres.2012.12.021
- Zięba, M., Tomczak, S. K., & Tomczak, J. M. (2016). Ensemble boosted trees with synthetic features generation in application to bankruptcy prediction. Expert Systems with Applications, 58, 93–101. doi:10.1016/j.eswa.2016.04.001