
Abstract
This research investigates customer reactions by exploring satisfaction(SAT), complaints(CC) and loyalty(CL) in an online shopping carnival(OSC) context in China. Expanding the American Customer Satisfaction Index(ACSI) model by including e-commerce corporate image(ECCI) next to customer expectations(CE), perceived quality(PQ), perceived value(PV), SAT was determined, while CC and CL were estimated based on SAT. For estimating CL, ECCI was added. 300 valid questionnaires were collected from Chinese shoppers with OSC experience. The research hypotheses were tested through Confirmatory Factor Analysis and Structural Equation Modelling. The results prompt five key paths influencing SAT and CL. No significant impact on and of CC was identified. ECCI significantly impacted on CC, SAT and CL. This study provides in the context of OSCs a new research perspective of customer reactions, centred on satisfaction, emphasising the role of image on expectations, satisfaction and loyalty, and incorporating customer complaints to quantify negative aspects of shopping experience in determining customer loyalty. E-commerce companies should deliver unforgettable customer experience through building a long-lasting image, offering consistent quality and delivering clearly-delineated value, as antecedents of satisfaction and loyalty. The model can be further expanded by exploring the consequences of customer loyalty on potential buying behaviour, focusing on purchasing intention and recommendations.
1. Introduction
Online Shopping Carnivals(OSCs), also known as Black Fridays (Zeng et al., Citation2019), enable e-commerce businesses, in a short period of time, to achieve large-scale promotions of goods, quickly improve brand image and significantly increase product sales, especially in countries like China (Xu et al., Citation2015). Thus, the e-commerce + entertainment combination is a worthy business development option (Yang et al., Citation2018), an OSC being a continuously updating environment rendered by a mix of information and communication technology and human input (Kyriakopoulos, Citation2011a; Yu et al., Citation2018). The tremendous potential business opportunities rendered by OSCs paired with the market propensity for large-scale centralized promotions have been confirmed by the constantly growing transaction volumes recorded during such events (Wu et al., Citation2016a; Xu et al., Citation2017). For example, Alibaba’s Double 11 OSC grew from 2009 to 2019 by at least 27% year-on-year, reaching a total transaction volume of 74.1 billion USD in 2020, almost double compared to 2019, with more than 250000 Chinese and international brands being sold and 2.3 billion orders processed (Alibaba Group, Citation2020; Yu et al., Citation2018). However, shopping carnivals have subsequent downsides for businesses, once ended, problems, such as declines in sales, difficulties in adjusting prices, or soaring requests for merchandise returns, replacements or refunds can put pressure on businesses (Xu et al., Citation2017).
Business opportunity seizing and problem handling are centred on customer reactions, satisfaction, as a customer reaction, being a means to cultivate loyalty and decrease complaints.
Customer satisfaction is an emotional response customers build by comparing the perceived quality of the purchased goods or services with the pre-purchase expectations formed based on previous shopping experiences (Oliver, Citation1981). Satisfaction is higher when the degree of exceeding expectations is higher (Tse & Wilton, Citation1988). Before OSCs buyers build shopping expectations based on past shopping experience, advertising or other stimuli (Xu et al., Citation2017). The emotional reaction formed based on the difference between the expectations built prior to a shopping carnival and the perception acquired after the actual shopping will be associated with satisfaction or dissatisfaction regarding utilitarian and/or hedonic needs (Yu et al., Citation2018). If perception exceeds expectations, customer satisfaction will be higher. Customer satisfaction is a prerequisite of loyalty, loyalty entailing the same brand continuous and consistent purchase (Oliver, Citation1981), thus, representing an important means for the organic growth of enterprises (Sarantidou, Citation2017). Satisfaction, besides significantly affecting loyalty, can also induce positive word-of-mouth effects, hence, providing additional benefits to a company (Lam et al., Citation2004, Huete-Alcocer, Citation2017), both leading to an increase in sales. Moreover, there is a direct relationship between satisfaction and customer willingness to assume risks in e-commerce (Javaria et al., Citation2020), the perception of risk connected to a seller diminishing in time (Veselý & Dohnal, Citation2016). Conversely, dissatisfaction is expressed in the form of complaints and negative word-of-mouth (Bayol et al., Citation2000; Huete-Alcocer, Citation2017; Zhang et al., Citation2019). The current literature prompts studies on OSC consumer behaviour, covering impulse buying (Akram et al., Citation2017; Zhao et al., Citation2019), purchase intention (Xu et al., Citation2015; Yang et al., Citation2018), purchase and intention behaviour (Zeng et al., Citation2019), the impact of information and social influence on OSC consumer behaviour (Xu et al., Citation2017), or consumer intention to participate in OSC (Yu et al., Citation2018) and platform usage (Xu et al., Citation2020). Yet, very few of these studies focus on customer reactions, centring on satisfaction, as a dependent and independent variable in the same theoretical approach, and not one of them aimed to explore its influence on customer complaints.
As mentioned previously, the number of brands of national and international origin sold during an OSC is significant (Alibaba Group, Citation2020). OSCs facilitate product selection through the wealth of displayed information, catering this way to customers’ utilitarian needs (Yu et al., Citation2018). Additionally, customer’s personal involvement, which is manifested through brand scrutinising, is documented to be an important impulse buying antecedent in OSCs (Zhao et al., Citation2019). Thus, brand is a variable worth considering in understanding customer satisfaction and loyalty in an OSC context. Corporate image was documented in other fields as an important prerequisite of satisfaction and loyalty (Cha & Seo, Citation2019; Kaur & Soch, Citation2018; Revilla-Camacho et al., Citation2017). However, there is a lack of studies in general and specifically on OSC, analysing the impact of corporate image on satisfaction antecedents and customer satisfaction and loyalty in the same research approach.
Considering the identified research gaps, as well as the enormous economic potential of OSCs, considering the steady sales growth recorded in the past years, their national and international impact through the significant number of well-established and new traded brands of various country origin (Lao, 2019), and the desire of Chinese companies to internationalise such events (Zeng et al., Citation2019), this study proposes a comprehensive customer reaction research model, to investigate the influencers of satisfaction, loyalty and complaints, and the relationships between them. Thus, this research expands the American Customer Satisfaction Index (ACSI) model, one of the most endorsed models in satisfaction measurement (Revilla-Camacho et al., Citation2017), aiming to verify the relationship between customer expectations(CE), approached based on the Expectation Confirmation Theory (Tse & Wilton, Citation1988), perceived quality(PQ), perceived value(PV), E-commerce corporate image(ECCI) and satisfaction(SAT), the effect of SAT on customer loyalty(CL) and complaints(CC), the influence of CL on CC, as well as the impact of ECCI and SAT on CL and CC.
This paper is structured in five parts, with the first one presenting OSC features and figures, the second documenting the literature on customer satisfaction, ACSI model and E-commerce corporate image, and building the hypotheses, the third part covering research design and empirical analysis, the fourth part detailing research results and discussion, and the fifth one presenting conclusions, managerial implications, limitations and future research directions.
2. Online shopping carnivals (OSC)- features and figures
OSCs are worldwide shopping events considering the number of hosting countries and geographic coverage, taking place in various moments throughout the year, October-November being the most popular months (Xu et al., Citation2017). Well-known OSCs are Black Friday, Cyber Monday, Amazon Prime Day, originating from the US, or Double 11, taking place in China (Zhao et al., Citation2019). OSCs incorporate features pertaining to shopping and entertainment (Yu et al., Citation2018). Although, initially, the shopping part through discounted prices for a definite period of time captured the most interest of shoppers, lately, the entertainment side started to become an essential element in attracting buyers and retaining them on online platforms, especially in China (Zhao et al., Citation2019). Double 11 strikes out based on the significantly higher sales compared to other Chinese similar events or international ones, and its glamorous entertaining content (Zhao et al., Citation2019). To comprehend the magnitude of this event, in 2020, while the e-commerce transactions in China totalled 37210 billion Yuan, the Double 11’s sales reached 524.90 billion Yuan only in one day, namely November 11 (1USD = 6.7232Yuan) (Foresight Industry Research Institute, Citation2020). The most traded product categories during Double 11 were home appliances and mobile phones, displaying an interesting shift in consumer preferences compared to 2019, when personal care and makeup products topped the list (ASKCI, Citation2020; ASKCI, Citation2019). Other well-traded categories in 2020 were apparel, personal care products, shoes and bags, furniture, computers, and food and beverages (ASKCI, Citation2020). Also, services were traded, as more than 2 million providers took part from over 100 cities (Lou, Citation2020). Compared to Black Friday 2020 in various geographic regions, according to Nosto (Citation2020), based on their e-commerce solutions, product categories with significant worldwide revenue increases on November 27, 2020 were home and garden, food and beverage, health and beauty, and sporting goods and hobbies.
The most important platforms during Double 11 based on sales in 2020 were Tmall and Jingdong, followed by Pinduoduo, while a significant number of new comers were represented through Kuaishou, Douyin or Haokan Video, just to mention a few examples, while livestreaming e-commerce was the highlight of the event (iResearch, Citation2020). provides figures for the 2020 Double 11 event.
Table 1. Sales figures for double 11 OSC in 2020.
To understand the dimension of the event and its impact on various industries, according to Alibaba Group (Citation2020), Tmall offered throughout the event 250000 brands, 31000 being foreign, with the US, Australia, Canada, France, Germany, Italy, Japan, Korea, New Zealand and UK being the most important vendor countries to China. Moreover, in only one day Tmall recorded, compared with the event in 2019, an increase of 47.30% of sales of imported brands, an increase of 92% of new brands reaching 1 million Yuan in sales, and 180 foreign brands surpassing 10 million Yuan (Foresight Industry Research Institute, Citation2020). Behind the scene, an entire network of delivery services companies and financial providers supported the event, Cainiao Network processing more than 2.30 billion orders, while Alipay, Ant Huabei, JD Finance or Suning Finance supporting the shoppers from a payment and financial perspective (Alibaba Group, Citation2020; Lou, Citation2020; iResearch, Citation2020). These companies, together with the actual platforms, sellers, media and shoppers, and their families and friends, make up an OSC’s stakeholders (Zhao et al., Citation2019). An important aspect that contributed to the 2020 high-value indicators was the significant support offered by the Chinese government through its involvement in the supply chain of agricultural and industrial goods, infrastructure building, facilitation of e-platform integration, parcel delivery through the implication of the State Post, and even offering of discount coupons to population to increase participation in the event (iResearch, Citation2020).
In conclusion, OSCs are appropriate avenues for comprehending consumer behaviour patterns due to the complex B2C and B2B relationships established in such events (Xu et al., Citation2020), driven by the catering of physical and spiritual needs of shoppers (Zhao et al., Citation2019).
3. Theoretical basis and literature review
3.1. Satisfaction, the main sought-after customer reaction, and its prerequisites. The American customer satisfaction index (ACSI) Model
Cardozo (Citation1965) introduced the concept of customer satisfaction in marketing, underlining that satisfaction can entice customers’ repeat purchase of goods. Satisfaction can be defined, centring on the Expectation Confirmation Theory, as the difference between the quality perceived after the purchase of goods and services and the expectation formed prior to the respective purchase, being higher when the level of expectation confirmation is higher (Oliver, Citation1981). Satisfaction is also documented in the literature based on its nexus with perceived value (Hsu et al., Citation2015; Xu et al., Citation2017), or its impact on customer loyalty (Bloemer & Kasper, Citation1995; Luarn & Lin, Citation2003; Yu et al., Citation2018).
Customer satisfaction can be measured through a number of models established in the literature, ACSI (American Customer Satisfaction Index), ECSI (European Customer Satisfaction Index), SCBS (Swedish Customer Satisfaction Barometer), or NCSB (Norwegian Customer Satisfaction Barometer), being suitable examples in this regard (Revilla-Camacho et al., Citation2017), all these models being concentrated on similar variables but tailored to certain scenarios (Lee et al., Citation2016).
The American Customer Satisfaction Index (ACSI) model, which is the focus of this study, is used to evaluate the quality of goods or services based on consumption experience, being centred on the perspective that customer satisfaction represents the overall satisfaction of customers with goods or service, determined based on their experiences and expectations (Fornell et al., Citation1996). The ACSI model employs six variables: customer expectations(CE), perceived quality(PQ), perceived value(PV), overall customer satisfaction index(SAT), customer complaints(CC) and customer loyalty(CL) (Fornell et al., Citation1996), CC being one differentiator of ACSI from ECSI. The relationships between the variables in the model are established based on a prior-subsequent approach concentrated on SAT (Fornell et al., Citation1996), SAT being assessed based on CE, PQ and PV. At the same time, the model analyses the impact of SAT on CC and CL, which are two outcome variables.
Over time, the model has gained high academic acceptance and practical significance, being widely used in satisfaction research in various fields, such as e-commerce (Choi et al., Citation2008), tourism (Sun & Kim, Citation2013), or motor vehicle industry (Terblanche, Citation2006). Moreover, there is significant evidence of adaptations of the ACSI model to various perspectives. Hsu (Citation2008) adapted the ACSI model by replacing PQ with e-service quality and CE with trust, successfully proposing an online customer satisfaction index. Makkar and Makkar (Citation2013) made use of the first part of the ACSI model (antecedents of satisfaction) to prompt a retail customer satisfaction model for the Indian retail. Khalid et al. (Citation2018) introduced e-commerce service quality, concluding that it was the most important influencer of e-commerce system SAT in a Saudi Arabian context. Considering the number of various contexts of usage and its versatility, it is safe to assume that the ACSI model can be effectively employed to measure the satisfaction index and its consequences in an OSC context. Therefore, this paper aims to employ the ACSI model in an OSC framework by using the already established customer satisfaction antecedents, namely CE, PQ and PV, to explain SAT. Moreover, the paper envisages the extension of the model in order to provide a more comprehensive understanding of SAT’s influence on CL and CC, thus, probing into positive and negative customer reactions.
3.2. Expanding the ACSI model- Corporate image as an antecedent of customer satisfaction and loyalty
Corporate image is a factor highly appraised by prospects and customers when assessing enterprises, its impact on customer satisfaction being addressed in the literature. The ECSI model uses image or corporate image as an independent variable, Revilla-Camacho et al. (Citation2017) listing 15 studies in which this model, with various extensions/adaptations, was employed between 1999 and 2015. Investigating the influence of company image, Vilares and Coelho (Citation2003) confirmed that customers’ overall perception of the corporate image in retail had an impact on their product and service selection, and, subsequently on SAT, while Bayol et al. (Citation2000), Cha and Seo (Citation2019), and Strenitzerova and Gana (Citation2018) confirmed, regarding a number of services types, that corporate image was an important factor affecting SAT. During OSCs, shoppers not only choose goods and services they need or want to buy, but also choose e-commerce platforms for browsing and informing themselves (Belanche et al., Citation2012), in all cases, the image of an enterprise playing an important role in their buying decision. From another angle, a number of studies show a direct or indirect effect of corporate image on CL. Bayol et al. (Citation2000), and Kaur and Soch (Citation2018) uncovered that corporate image was a significant determinant of CL in the case of mobile services. Nguyen (Citation2006) identified that corporate image had an indirect impact on CL in the case of hospitality services. Nguyen and Leblanc (Citation2001) concluded that corporate image would strongly impact on CL, their focus being on 3 service sectors. In OSCs, corporate image is connected to utilitarian and hedonic values sought-after by customers (Xu et al., Citation2020).
All in all, considering the documented impact of corporate image on SAT and CL, and building on the recommendation of Awwad (Citation2012), that of including image as an independent variable in the ACSI model to measure direct and indirect influences, it becomes clear that an extension of this model would provide a richer perspective on SAT and CL. Therefore, this paper proposes to expand the ACSI model by adapting Bayol et al. (Citation2000) evaluation approach to be tested in an OSC context, including the e-commerce corporate image(ECCI) dimension next to CE, PQ, PV, as antecedent variables, to investigate SAT (to be understood as the overall customer satisfaction), and assess the relationship between SAT and CC and CL, and further analyse the formation paths for SAT and CL. In order to test the model, 12 research hypotheses are proposed.
3.3. Research hypotheses
3.3.1. Research hypotheses on customer satisfaction prerequisites: customer expectations (CE), perceived quality (PQ) and perceived value (PV)
Customer Expectations(CE) are quality estimations of goods or services before purchase (Strenitzerova & Gana, Citation2018). Zeithaml et al. (Citation1988) believe that CE are both retrospective and forward-looking, hence, CE being built based on perceptions and information about the quality of goods or services purchased over time. CE are largely reasonable and reflect shoppers’ judgments and predictions of the quality and value of goods according to the actual consumption (Fornell et al., Citation1996). Exploring the mobile phone industry, Bayol et al. (Citation2000) found a direct relationship between CE and PQ and PV, while Revilla-Camacho et al. (Citation2017) between CE and PQ in a study on the impact of CSR on SAT in the hotel industry. In an OSC, customers seek original products, the best deals, and/or top quality offerings (Wu et al., Citation2016b). Based on CE, enterprises can strive to meet future demand (Zeithaml et al., Citation1988). Considering the afore-mentioned perspectives, the following hypotheses are put forward for the OSC context ():
Figure 1. Research model of customer reactions centred on satisfaction in online shopping carnivals. Source: from literature.
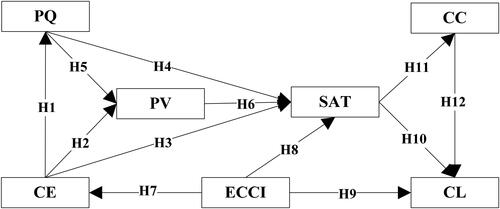
H1: Customer expectations (CE) have a significant positive impact on perceived quality (PQ).
H2: Customer expectations (CE) have a significant positive impact on perceived value (PV).
According to the Expectation Confirmation Theory, based on the difference between pre-purchase expectations and after-purchase assessments of product/service performance, a customer will feel satisfied if performance meets or exceeds expectations, or not in a converse situation (Tse & Wilton, Citation1988). Cardozo (Citation1965) used experimental methods to verify if SAT would be affected by CE of goods, the author uncovering an inverse relationship between the two variables. Fornell et al. (Citation1996) argue that when CE are low, SAT will be higher as shoppers will be easier to satisfy. In the automotive industry, Terblanche (Citation2006) found a relationship between CE and SAT. An OSC is a relatively short-term buying occasion, not lasting more than a month (Wu et al., Citation2016a). Based on online shopping past experience on one hand, and on various marketing strategies and advertising employed by vendors, on the other hand, as well as on word-of-mouth effects before an OSC, customers can build expectations for desired goods or services. However, as detailed above, if expectations are not matched by the perceived performance of the purchased goods, customers will be dissatisfied. Thus, the present paper assumes that in OSCs, expectations significantly influence SAT, the following hypothesis being forwarded ():
H3: Customer expectations (CE) have a significant positive impact on customer satisfaction (SAT).
Perceived quality (PQ) is the result of a product or service performance evaluation done by a customer (Olsen, Citation2002). Zeithaml et al. (Citation1988) believed that PQ was the primary determinant of SAT, and, a direct driving factor of shopping satisfaction. PQ includes the overall perception of goods or services, comprising the perception of reliability, as well as that of meeting individual specific needs (Fornell et al., Citation1996). Olsen's (Citation2002) research, exploring seafood products, shows that PQ can significantly predict PV and SAT. Terblanche (Citation2006) uncovered a direct relationship between PQ and PV and SAT, investigating the automotive industry. As OSCs continuously develop integrated platforms, aiming to deliver value to customers and vendors (Wu et al., Citation2016a), this paper presumes that PQ in OSCs positively affects PV and SAT. Thus, the following hypotheses being proposed ():
H4: Customer perceived quality (PQ) has a significant positive impact on perceived value (PV).
H5: Customer perceived quality (PQ) has a significant positive impact on customer satisfaction (SAT).
Perceived value (PV) is the result of the overall subjective evaluation of a purchased product or service utility compared to the acquisition price (Zeithaml, Citation1988). In a broader approach, PV could be comprehended as the feelings customers have on the utility acquired after putting product or service quality and delivered experience, and price in the same basket (Fornell et al., Citation1996). Zeithaml (Citation1988) confirmed that customers’ perception of purchased goods or services positively affected PV, and PV significantly affected customers’ willingness to purchase. Hsu et al. (Citation2015) showed in their online buying behaviour research that customers would be more satisfied if the PV of goods or services was higher. In an OSC context, Xu et al. (Citation2017) and Yu et al. (Citation2018) found direct influences of PV on SAT. This study assumes that during OSCs, customers’ PQ after purchasing goods or services affects PV, which further affects SAT, hence, the following hypothesis being proposed:
H6: Customer perceived value (PV) has a significant positive impact on customer satisfaction (SAT) ().
3.3.2. Research hypothesis on E-commerce corporate image (ECCI)
Corporate image is an important factor in customer evaluations of enterprises and their offers (Bayol et al., Citation2000), being the outcome of an overall subjective appraisal of various attributes deemed important by shoppers (Nguyen, Citation2006). E-commerce enterprises provide goods and services to buyers through the Internet, partially or totally, thus, their corporate image being a result of an evaluation of a combination of functional and emotional aspects encountered by shoppers in their online purchasing experiences (Nguyen, Citation2006). When buying online, customers will favour e-commerce companies with better image (Cha & Seo, Citation2019). Bayol et al. (Citation2000) argued that corporate image could influence CE and SAT concerning goods or services. Chin and Chiayu (Citation2005) showed that corporate image played an important driving role in SAT in retail. Nguyen (Citation2006) found that corporate image significantly affected customers’ PV and SAT and indirectly affected CL in hospitality services. Kaur and Soch (Citation2018) and Nguyen and Leblanc (Citation2001) found a direct relationship between image and CL in services sectors. In an OSC, suppliers should calibrate their efforts to focus on delivering either low prices or top quality (Yu et al., Citation2018), in both instances ECCI being the conveyor of such aim to prospects. Moreover, Xu et al. (Citation2020) argue that an OSC is a favourable environment for value co-creation. Hence, this paper assumes that during an OSC, ECCI will have an impact on CE, SAT and CL, hence the following hypotheses being forwarded ():
H7: E-commerce corporate image (ECCI) has a significant positive impact on customer expectations (CE).
H8: E-commerce corporate image (ECCI) has a significant positive impact on customer satisfaction (SAT).
H9: E-commerce corporate image (ECCI) has a significant positive impact on customer loyalty (CL).
3.3.3. Research hypotheses on customer loyalty (CL) and customer complaints (CC)
SAT is an emotional response to the evaluation of PQ of purchased goods or services compared to pre-purchase expectations built based on past shopping experience and/or acquired information (Tse & Wilton, Citation1988). Customer loyalty (CL) is the attitude or behavioural intention of buyers toward a company or a brand they like, expressed as repeated purchases and consumption behaviours of the same product or brand (Lam et al., Citation2004). In previous studies, the significant impact of SAT on CL has been confirmed (Chin & Chiayu, Citation2005; Lam et al., Citation2004). By constructing a shopping loyalty model, Bayol et al. (Citation2000) confirmed that SAT in mobile communication also significantly affected CL. Moreover, customer's willingness to repurchase is stronger when SAT is higher (Bloemer & Kasper, Citation1995). The same study, also, displays that SAT significantly affects CL. Yu et al. (Citation2018) contend that OSCs platforms and vendors should cooperate to ensure SAT and attain profit, these being prerequisites of CL. This paper prompts that SAT has a direct impact on CL in an OSC context, the following hypothesis being proposed ():
H10: Customer satisfaction (SAT) has a significant positive impact on customer loyalty (CL).
Customer complaints (CC) refer to attitudes or behaviours that buyers express in some way when they are dissatisfied with goods or services they purchase (Bayol et al., Citation2000). Customers’ dissatisfaction is often expressed in the form of complaints about the shopping process, price and quality of goods or services, or shopping experience (Xu et al., Citation2015; Zeng et al., Citation2019). Bayol et al. (Citation2000) uncovered in their research a direct relationship between SAT and CC. In online shopping, word-of-mouth and comments after purchasing goods or services are the most intuitive expressions of SAT or CC (Huete-Alcocer, Citation2017; Zhang et al., Citation2019). The more dissatisfied customers are, the more likely they are to complain. At the same time, CC can impact on CL. Lou (Citation2020) underlined that a significant number of CC were recorded during the Double 11 OSC in 2020 due to various imposed rules and regulations, although the event was the most successful one ever from a financial perspective and the number of processed orders (Alibaba Group, Citation2020). Therefore, this study prompts for OSCs the following hypotheses ():
H11: Customer satisfaction (SAT) has a significant negative impact on customer complaints (CC).
H12: Customer complaints (CC) have a significant negative impact on customer loyalty (CL).
The research model is presented in
4. Research design and empirical analysis
4.1. Questionnaire design and variable measurement
For data collection, a questionnaire structured in two parts was used. The first part comprised questions about the profile of the respondents. The second part included questions to measure seven latent variables, namely CE, PQ, PV, ECCI, SAT, CC and CL. In order to ensure the reliability and validity of the measurement tools, the maturity scale perspective in the existing literature was used (adapted from Zhao et al., Citation2019). Thus, the latent variables in the ACSI model were tailored from the works of Fornell et al. (Citation1996), and Strenitzerova and Gana (Citation2018), while the ECCI was investigated based on the work of Nguyen and Leblanc (Citation2001). The extant variables were revised and expanded according to the peculiarities of an OSC, changing and supplementing relevant questions. Hence, each latent variable contains 3 items, measured through 5-level Likert scales (Koo & Ju, Citation2010; Loureiro & Roschk, Citation2014). The questionnaire was forwarded to 6 experts, 3 in e-commerce, 1 in online communication and 2 in marketing to review it. The 2 experts in e-commerce covered the questions focusing on OSC peculiarities, while the expert in online communication centred on ECCI. The 2 experts in marketing scrutinized the questions related to the ACSI model. Based on the feedback received from the experts, the questionnaire was amended and piloted among 50 respondents with OSC previous experience chosen randomly (Loureiro & Roschk, Citation2014; Xu et al., Citation2017), three days after the Double 11 OSC in 2020, between November 14 and 18. Minor layout adjustments were made to the questionnaire, subject to the received recommendations, thus, the definitive version being rendered to be employed (Loureiro & Roschk, Citation2014).
4.2. Data collection and sample description
The data collection was performed online, aiming to gather data from Chinese shoppers with at least one OSC experience in the previous three years, using QQ, e-mail and WeChat. Thus, a convenience sampling procedure was employed to collect data from shoppers residing in Changchun and Jilin city (N-E China), tier 2 and 3 cities in social commerce usage (e-commerce + social media) (DATA100, Citation2020), employing Akram et al. (Citation2017) recommendation to cover other geographic areas when investigating OSC behaviour, as they focused in their research on four cities from the tier 1 group of social commerce usage. The questionnaires were administered between November 20 and December 22, 2020, initially 357 being collected, but, after deleting the incomplete ones, 300 valid questionnaires (84.03%) were retained. Considering the sample size rule of thumb in social sciences, that of not being smaller than 15 times the number of predictors (Stevens, Citation2009), and the minimum sample size suggested by Hoelter (Citation1983) for using SEM (Structural Equation Model), that of a minimum size of 200, this study’s sample size exceeds the minimum grounded research requirements.
Based on the collected data, 57.00% of the respondents were women, with 94.34% of the sample being between 18 and 45 years old, while from an educational perspective, 56.00% were undergraduates. Moreover, 75.34% of the respondents declared a personal monthly disposable income between 1001 and 5000 yuan, while 85.33% mentioned they would spend monthly on online shopping on average between 500 and 3000 yuan. The number of times to participate in OSCs was relatively high, with those taking part more than five times representing 89.00% of the total sample. The findings on the sample’s structure are in sync with those from previous studies on OSCs regarding gender, age, education and online shopping experience (Akram et al., Citation2017; Xu et al., Citation2017).
4.3. Common method bias
Common method bias issues could occur because the questionnaires were self-completed and the data for the independent and dependent variables were collected from the same respondents (Zhao et al., Citation2019), being addressed through trap items inserted in the questionnaire and statistical methods. Trap items were included in the questionnaire to delineate careless respondents based on different answers provided to the same questions placed in various parts of the questionnaire (adapted from Dupuis et al., Citation2019). The first statistical method employed, Harman’s one-factor test (Podsakoff et al., Citation2003), emphasises that common method bias could represent a problem if one factor explains more than 50% of the variance (MacKenzie & Podsakoff, Citation2012; Podsakoff et al., Citation2003). The findings, 5 factors extracted, comprising all items employed in this study (Xu et al., Citation2017), considering an eigen value of at least 1, and the most variance explained by a single factor of 39.7%, signify that common method biases do not represent a problem.
The second method entailed using a common method factor (Xu et al., Citation2020), and measuring the variance of each variable considering the principal construct, on one side, and the common factor, on the other side, and subsequently calculating the ratio of the two variances (Liang et al., Citation2007). The findings display average explained variances of the main variable to the measured variables of 0.758, on one part, and of the common method factor to the measured variable of 0.003, on the other part, with a ratio of 253:1. Additionally, the factor loadings of all variables are significant, while those calculated for the method factor are not significant with the exception of two cases. The seven factors included each three items, all 21 loading significantly on the substantive factors, while 19 items in the case of the method factors were not significant, with the exception of two that were significant in the case of CL. These findings indicate that common method bias should not be a serious problem for this study (Xu et al., Citation2020).
4.4. Measurement model assessment
Factor analysis was performed based on the Partial Least Square (PLS) method, while the relationships between variables were established through the usage of Structural Equation Modelling (SEM), Hair et al. (Citation2019) recommending the method when aiming to develop existing models. This paper focuses on extending the ACSI model by integrating ECCI to evaluate its impact on CE, and, together with the influence of CE, PQ, PV, as antecedent variables, on SAT acquired in an OSC, and assess the relationship between SAT and CC and CL. Moreover, SPSS 20 was used for data analysis, while Smart PLS 3.0 was employed for path analysis and testing of hypotheses.
4.4.1. Standard loading assessment
The standard loading values of the investigated variables surpass the threshold of 0.708 (), suggesting that the respective variables explain adequately the latent variables (Hair et al., Citation2019).
Table 2. Measurement model assessment.
4.4.2. Reliability and validity assessments
Considering that Cronbach’s α and Composite Reliability (CR) values for the latent variables exceed 0.7 (), acceptable reliability can be inferred (Bagozzi & Yi, Citation1988; Xu et al., Citation2017). Additionally, Cronbach’s α value for the entire questionnaire, 0.9, suggests a high reliability, while the value of 0.907 for KMO (Kaiser-Meyer-Olkin) displays that factor analysis can be employed (Xu et al., Citation2020).
Validity was tested based on convergent validity, the findings for Average Variance Extraction (AVE), exceeding the threshold of 0.5, suggesting convergent validity, and based on discriminant validity, the square root values of AVE, exceeding the correlation values between variables, reflecting discriminant validity (Bagozzi & Yi, Citation1988; Xu et al., Citation2017). Moreover, discriminant validity was further investigated based on Heterotrait-Monotrait Ratio (HTMT) of the item correlations, the findings, all below 0.9 (), suggesting the existence of discriminant validity (Henseler et al., Citation2015).
Table 3. Discriminant validity analysis.
4.5. Structural model assessment
4.5.1. Testing for multi-collinearity
Multi-collinearity was assessed through the usage of Variance Inflation Factor (VIF). As all values of VIF (), expanding from 1.32 to 2.74, are below the ceiling of 3, suggested by Hair et al. (Citation2019), an absence of multi-collinearity can be suggested.
4.5.2. Testing the relationship between variables and concluding on the research hypotheses
The research hypotheses were tested through the usage of route analysis, the path relation between variables being analysed through PLS Algorithm, while the significance levels were established based on Bootstrapping (Hair Jr et al., Citation2016). A reference value of 0.2 for R2 was used to establish how effectively the model measures the connections between the investigated variables (Hair Jr et al., Citation2016). Two variables recorded R2 values below 0.2, therefore CE (R2=0.19) and PQ (R2=0.18) had weak explanatory powers, while PV (R2=0.43), SAT (R2=0.59) and CL (R2=0.42) had moderate explanatory powers (Yen et al., Citation2017). Moreover, Q2 (cross-validated redundancy) values were determined to assess the predictive relevance of the endogenous variables. As the results rendered through Blindfolding exceed the minimum value of 0 suggested by Hair Jr et al. (Citation2016) and Tenenhaus et al. (Citation2005), it is safe to assume that the endogenous variables predict accurately the structural model. (see ).
The path coefficients and significance levels, R2 and T values, and the conclusions upon the research hypotheses are presented in .
Figure 2. Research model path coefficients, their significance levels and T values. Source: The authors.
Note: *p < 0.05; **p < 0.01; ***p < 0.001; ns = not significant; H3, H11, H12 not supported
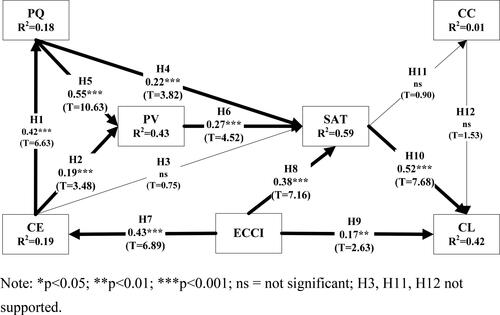
Hypotheses H3, H11, and H12 are not supported, while the other ones are supported. Thus, CE significantly affected PQ and PV, but had no significant impact on SAT; PQ significantly influenced PV and SAT; PV significantly impacted on SAT; ECCI significantly affected CE, SAT and CL; SAT significantly influenced CL, but it had no significant impact on CC; CC had no significant impact on CL.
5. Results and discussion
5.1. Influencing factors of satisfaction
CE significantly affected PQ, but had no significant impact on SAT. These results are consistent with Bayol et al. (Citation2000) findings, as they employed the ECSI model, to investigate SAT in the mobile phone industry but inconsistent with Khalid et al. (Citation2018) results as they found a relationship between CE and SAT by applying the ACSI model in a study on e-commerce in Saudi Arabia. At the same time, the findings of this paper confirm the impact of CE on PV, this outcome being inconsistent with the results of Bayol et al. (Citation2000). An explanation of these results could come from the fact that the vast majority of the respondents mentioned they participated many times in OSCs, thus, being quite safe to assume that they built expectations on value and quality to a considerable extent based on previous experiences with products and brands. However, the non-significant relationship between CE and SAT could be explained from the perspective as although customers knew what to expect when buying, briefly categorised by Wu et al. (Citation2016a) as original products, cheap buys or top quality, the results unveiling an indirect relationship between CE and SAT through PQ and PV, SAT could be influenced by developments in marketing communication, platform technical problems, or delivery inconsistencies (Akram et al., Citation2017).
PQ of goods/services had a significant impact on PV and SAT. Moreover, PV had a significant impact on SAT, the findings confirming the results of Yu et al. (Citation2018), meaning an influence of utilitarian and hedonic values on SAT in OSCs, or those of Xu et al. (Citation2017), as they found an impact of participation, interaction and pleasure, as values sought after by customers, on consumer behaviour in OSCs. Thus, it is safe to say that during an OSC, customers’ evaluation of the quality of the purchased goods or services can directly affect their PV and SAT. SAT will be higher when the PV of the customer's purchased goods or services is higher, the situation being consistent with the results of Hsu et al. (Citation2015) and Zeithaml (Citation1988). Once a customer builds expectations of a particular quality, the respective customer will expect to receive particular benefits at a cost, hence a value, thus, PQ and PV, individually, and together, will be important antecedents of SAT.
ECCI significantly affected CE, SAT and CL. The results on the impact of ECCI on CE are on the same length with those of Bayol et al. (Citation2000). The findings on the influence on SAT are consistent with the results of Bayol et al. (Citation2000), Chin and Chiayu (Citation2005), Nguyen (Citation2006), Vilares and Coelho (Citation2003), and Strenitzerova and Gana (Citation2018) obtained in a variety of services sectors, and of Cha and Seo (Citation2019) in food online shopping. The results on the impact on CL match the findings of Bayol et al. (Citation2000), Kaur and Soch (Citation2018), and Nguyen and Leblanc (Citation2001) and to a certain extent those of Nguyen (Citation2006), as in this study the impact was an indirect one, these studies focusing on a number of services. These findings show that ECCI is an important factor affecting shoppers’ choice of goods and services in OSCs. Therefore, e-commerce enterprises should focus on their own corporate image by permanently improving their core competencies in order to create and strengthen a market position of either selling at low prices or providing top quality (Yu et al., Citation2018), and, thus, attaining a competitive advantage.
5.2. The impact of satisfaction
SAT significantly affected CL, the result being consistent with findings of previous works in services (Bayol et al., Citation2000; Chin & Chiayu, Citation2005; Lam et al., Citation2004). Additionally, the result is in line with the conclusion of Akram et al. (Citation2017), underlining that SAT is the prime condition for the growth of an OSC. The higher SAT is, the stronger the repurchase will be. Therefore, e-commerce companies should constantly improve all aspects of goods and services to improve SAT and CL, and work together with OSC platforms in delivering SAT to acquire mutual benefits (Yu et al., Citation2018).
SAT had no significant impact on CC, thus, contradicting the findings of Bayol et al. (Citation2000), while CC had no significant impact on CL, confirming the conclusion of Bayol et al. (Citation2000). The negative impact of SAT on CC was not confirmed, which could indicate that SAT during OSCs was relatively high and did not generate strong CC. However, Lou (Citation2020) underlined that during Double 11 OSC in 2020 an important number of complaints were recorded because of rules and conditions. The difference between these two perspectives could be explained based on improvements prompted in the inventory management, platform stability, and delivery services (Zeng et al., Citation2019) and product benefits (Xu et al., Citation2015). Moreover, the refund assurance provides a guarantee for buyers, building trust in an OSC (Xu et al., Citation2015), and, thus, enticing people to buy goods. At the same time, CC did not have a significant negative impact on CL, indicating that even if there were CC during OSCs, through reasonable and appropriate handling by businesses, they were mitigated. An explanation for these results could be derived from the conclusions of Xu et al. (Citation2017), stating that supplier information richness and peer imitation are very strong OSC customer behaviour influencing factors, and those of Yu et al. (Citation2018) underlining the importance of the cooperation between vendors and OSC platforms for their success and the event’s one.
5.3. Theoretical significance of the findings
By employing an extended version of the ACSI model through the inclusion of E-commerce corporate image(ECCI), this paper proposes a research avenue for customer reactions, exploring satisfaction(SAT), loyalty(CL) and complaints(CC) in OSCs. The insertion of ECCI represents a diversification of customer behaviour antecedents as this variable represents a manifestation of customer trust, hence offering a different angle in comprehending SAT and CL (Cha & Seo, Citation2019). ECCI proved to be the first antecedent in all identified significant paths, influencing directly and indirectly both SAT and CL, thus, strengthening the literature on the role of image in e-commerce satisfaction and loyalty building, and, hence, expanding the OSC theory (Xu et al., Citation2017). Furthermore, this model assesses customer complaints(CC) in an OSC context, aiming to cover deterrents of CL, the literature in the field attempting to discuss customer behaviour obstacles so far through a variety of risks pertaining to offer, price, delivery or privacy (Xu et al., Citation2015), thus, the model emphasising the importance of appraising the negative aspects of shopping experiences when aiming to determine CL, and therefore, broadening the e-commerce theoretical view.
5.4. Practical significance of the findings
The results unveil several marketing courses of action for Chinese and international e-commerce companies involved in OSCs and other short-term intensive shopping e-commerce events. Corporate image was prompted as a direct and indirect influencer of satisfaction and loyalty. Thus, it is recommended that e-commerce businesses coordinate their marketing efforts in building and preserving a long-lasting image, such actions being deemed one of the business success prerequisites in this field (Barroso et al., Citation2019). Image is one of the factors based on which customers build expectations, comparing them to the quality and value they perceived after interacting with a company and its offers. Hence, a business should aim to meet customer expectations with consistent quality and extremely well delineated value, providing, this way, unforgettable customer experience. Moreover, PQ and PV influence SAT together with corporate image. Thus, a well-defined and consistent image, supported by clear offer quality, drawing from features, marketing communication, delivery, pre and post-purchase interactions, and the delivery of expected benefits, such as economic, emotional or social, represent key success factors for businesses involved in e-commerce, in general, and OSCs in particular for gaining a competitive advantage and ensuring a sustainable development (Svatosova, Citation2020). Once SAT is established, CL can be achieved and preserved, being also supported through a reinforced corporate image.
6. Conclusions, managerial implications, limitations and future research directions
This study expanded the ACSI model by adding ECCI as an independent variable to build a customer reaction research model appropriate for OSCs. Data were collected through online questionnaires for statistical analysis and testing of hypotheses. Considering the hypotheses that were confirmed, five paths leading to satisfaction and loyalty can be delineated, all of them having as the starting point ECCI. These paths are: (1) ECCI→CE→PQ→PV→SAT→CL; (2) ECCI→CE→PV→SAT→CL; (3) ECCI→CE→PQ→SAT→CL; (4) ECCI→SAT→CL; (5) ECCI→CL. The results show the high importance of corporate image in OSC context, this variable affecting directly and indirectly satisfaction and loyalty. Furthermore, although a direct relationship between customer expectations and satisfaction cannot be established, an indirect one between the two variables is established through perceived quality and perceived value. Thus, the research extends the literature on e-commerce customer reactions, and proposes business directions by documenting and testing a model that can be used in China and other parts of the world (Zeng et al., Citation2019).
6.1. Managerial implications
The findings suggest that businesses involved in OSCs should work together with the other participants, such as supporting services companies, namely logistics and financial ones, media and shoppers and their communities, in order to build and preserve a proper corporate image(ECCI), as buyers seek discounts and satisfaction of spiritual needs when attending an OSC (Zhao et al., Citation2019). Considering a quality management approach (Kyriakopoulos, Citation2011b), an OSC platform, based on collaboration with the participating companies, should establish standards to be met by all parties on the platform, thus, creating the prerequisites for qualitative offerings and control of price soars (Xu et al., Citation2021), such endeavours clearly impacting on CE, PQ and PV, leading to SAT and CL. Building good ties with media on their own or through the OSC, attending brands could gain publicity (Zhao et al., Citation2019), the impact on ECCI, and, as a consequence, on CE being significant. Vendors should facilitate from a technical perspective and stimulate, through their own sites and OSC platforms in an integrated approach (Kyriakopoulos, Citation2012), based on incentives, social interactions between shoppers, their friends and families (Xu et al., Citation2017; Li et al., Citation2019), as such interactions will lower or eliminate shopping obstacles, building CE and PV, hence, leading faster to SAT and CL, and forging of long-lasting ties with customers (Štefko et al., Citation2019).
Focusing on OSC platforms, they should continue introducing new brands of products and services, and supporting SMEs (Lou, Citation2020), as these approaches will not just diversify the assortment but also develop local and national businesses, creating an image for the OSC of that of a supporter of national brands, leading to CL from shoppers valuing such actions. Also, introducing new international brands can attract local and foreign customers, strengthening the OSC image and increase CL. At a macroeconomic level, considering the impact of OSCs on local and national economy, public authorities should support these events, as the input of the Chinese government in the Double 11 event in 2020 through logistics support, infrastructure building and financial incentives offered to population (iResearch, Citation2020), impacted favourably on the sales volume. Public authorities should also pay attention to the handling of customer complaints (Lou, Citation2020), and inform buyers about their rights. These approaches will build shopper confidence by lowering buying barriers, leading to CE with impact on PQ and PV, thus, being beneficial for OCS organisers and vendors.
6.2. Limitations and future research directions
Limitations can be delineated from several perspectives. Firstly, this study is a snapshot, reflecting a one-time perspective. A longitudinal approach can be considered to determine eventual evolutions of the predictors and changes in their explaining power, thus, rendering a better understanding of the model usage appropriateness (Xi et al., Citation2020). Secondly, the employed convenient sample makes difficult the generalisation of the findings. Thus, future studies should test the model in other geographic areas (Xu et al., Citation2020), and, if possible, use probability samples. Thirdly, a significant proportion of the data collected in this study comes from young and middle-aged people. Although previous studies (Akram et al., Citation2017; Xu et al., Citation2017) have shown that the majority of participants in OSCs are middle-aged and young, with the development of information technology and popularization of intelligent mobile terminals, the elders are gradually adopting online shopping and actively paying attention to and participating in OSCs (Quest Mobile, Citation2020). Therefore, future research can enrich the literature by studying differences of satisfaction among customers of different generations during OSCs. Fourthly, the non-significant impact of customer complaints needs further investigation, as the number of complaints was significant during Double 11 OSC in 2020 (Lou, Citation2020). Moreover, future research should focus on testing the model in other geographic areas by focusing on similar types of events, such as Black Friday. Additionally, the model can be expanded by exploring the influence of image on perceived quality (Kaur & Soch, Citation2018), and the consequences of customer loyalty on potential shopping behaviour by considering two variables, namely, buying intention (Yang et al., Citation2018) and recommendations (Zeng et al., Citation2019).
Disclosure statement
No potential conflicts of interest are to be reported.
Additional information
Funding
References
- Akram, U., Hui, P., Khan, M. K., Saduzai, S. K., Akram, Z., & Bhati, M. H. (2017). The plight of humanity: Online impulse shopping in China. Human Systems Management, 36(1), 73–90. https://doi.org/10.3233/HSM-171768
- Alibaba Group. (2020). Alibaba Generates RMB498.2 billion (US$74.1 billion) in GMV during the 2020 11.11 Global Shopping Festival (November 12, 2020). https://alibabagroup.com/en/news/article?news=p201112
- ASKCI. (2019). Online sales of "Double 11" reached 410.1 billion yuan in 2019, the personal care industry ranked first in total online sales. https://www.askci.com/news/chanye/20191113/1117261154689.shtml
- ASKCI. (2020). 2020 double eleven national top ten industry network sales ranking. https://www.askci.com/news/chanye/20201112/1000161280484.shtml
- Awwad, M. S. (2012). An application of the American Customer Satisfaction Index (ACSI) in the Jordanian mobile phone sector. The TQM Journal, 24(6), 529–541. https://doi.org/10.1108/17542731211270098
- Bagozzi, R. P., & Yi, Y. (1988). On the evaluation of structural equation models. Journal of the Academy of Marketing Science, 16(1), 74–94. https://doi.org/10.1007/BF02723327
- Barroso, R. M. R., Ferreira, F. A. F., Meidutė-Kavaliauskienė, I., Banaitienė, N., Falcão, P. F., & Rosa, Á. A. (2019). Analyzing the determinants of e-commerce in small and medium-sized enterprises: A cognition-driven framework. Technological and Economic Development of Economy, 25(3), 496–518. https://doi.org/10.3846/tede.2019.9386
- Bayol, M. P., de la Foye, A., Tellier, C., & Tenenhaus, M. (2000). Use of PLS path modelling to estimate the European Consumer Satisfaction Index (ECSI) model. Statistica Applicata, 12(3), 361–375.
- Belanche, D., Casalo, L. V., & Guinalíu, M. (2012). Website usability, consumer satisfaction and the intention to use a website: The moderating effect of perceived risk. Journal of Retailing and Consumer Services, 19(1), 124–132. https://doi.org/10.1016/j.jretconser.2011.11.001
- Bloemer, J. M. M., & Kasper, H. D. P. (1995). The complex relationship between consumer satisfaction and brand loyalty. Journal of Economic Psychology, 16(2), 311–329. https://doi.org/10.1016/0167-4870(95)00007-B
- Cardozo, R. N. (1965). An experimental study of consumer effort, expectation and satisfaction. Journal of Marketing Research, 2(3), 244–249. https://doi.org/10.2307/3150182
- Cha, S. S., & Seo, B. K. (2019). The effect of brand trust of home meal replacement on repurchasing in online shopping. Journal of Business Economics and Environmental Studies, 9(3), 21–26. https://doi.org/10.13106/jbees.2019.vol9.no3.21
- Chin, H. C., & Chiayu, T. (2005). Exploring store image, customer satisfaction and customer loyalty relationship: Evidence from Taiwanese Hypermarket Industry. The Journal of American Academy of Business, 7(2), 197–202.
- Choi, J., Seol, H., Lee, S., Cho, H., & Park, Y. (2008). Customer satisfaction factors of mobile commerce in Korea. Internet Research, 18(3), 313–335. https://doi.org/10.1108/10662240810883335
- DATA100. (2020). 2020 Social E-commerce Consumer Shopping Behavior Research Report, drafted with Internet Association of China and Chuang Qi Social Ecommerce Research Center. https://www.data100.com/information-details.php?id=201
- Dupuis, M., Meier, E., & Cuneo, F. (2019). Detecting computer-generated random responding in questionnaire-based data: A comparison of seven indices. Behavior Research Methods, 51(5), 2228–2237. https://doi.org/10.3758/s13428-018-1103-y
- Foresight Industry Research Institute. (2020). China's e-commerce industry market outlook and investment strategy planning analysis report. https://www.qianzhan.com/analyst/detail/220/201119-931dc80b.html
- Fornell, C., Johnson, M. D., Anderson, E. W., Cha, J., & Bryant, B. E. (1996). The American Customer Satisfaction Index: Nature, purpose, and findings. Journal of Marketing, 60(4), 7–18. https://doi.org/10.1177/002224299606000403
- Hair Jr, J. F., Hult, G. T. M., Ringle, C., & Sarstedt, M. (2016). A primer on partial least squares structural equation modeling (PLS-SEM). Sage Publications.
- Hair, J. F., Risher, J. J., Sarstedt, M., & Ringle, C. M. (2019). When to use and how to report the results of PLS-SEM. European Business Review, 31(1), 2–24. https://doi.org/10.1108/EBR-11-2018-0203
- Henseler, J., Ringle, C. M., & Sarstedt, M. (2015). A new criterion for assessing discriminant validity in variance-based structural equation modeling. Journal of the Academy of Marketing Science, 43(1), 115–135. https://doi.org/10.1007/s11747-014-0403-8
- Hoelter, J. W. (1983). The analysis of covariance structure: Goodness-of-fit Indices. Sociological Methods & Research, 11(3), 325–344. https://doi.org/10.1177/0049124183011003003
- Hsu, S. H. (2008). Developing an index for online customer satisfaction: Adaptation of American Customer Satisfaction Index. Expert Systems with Applications, 34(4), 3033–3042. https://doi.org/10.1016/j.eswa.2007.06.036
- Hsu, M. H., Chang, C. M., & Chuang, L. W. (2015). Understanding the determinants of online repeat purchase intention and moderating role of habit: The case of online group-buying in Taiwan. International Journal of Information Management, 35(1), 45–56. https://doi.org/10.1016/j.ijinfomgt.2014.09.002
- Huete-Alcocer, N. (2017). A literature review of word of mouth and electronic word of mouth: Implications for consumer behavior. Frontiers in Psychology, 8, 1256. https://doi.org/10.3389/fpsyg.2017.01256
- iResearch. (2020). The 2020 Double 11 E-commerce Shopping Festival Report. http://report.iresearch.cn/report/202012/3694.shtml
- Javaria, K., Masood, O., & Garcia, F. (2020). Strategies to manage the risks faced by consumers in developing e-commerce. Insights into Regional Development, 2(4), 774–783. https://doi.org/10.9770/IRD.2020.2.4(4)
- Kaur, H., & Soch, H. (2018). Satisfaction, trust and loyalty: Investigating the mediating effects of commitment, switching costs and corporate image. Journal of Asia Business Studies, 12(4), 361–380. https://doi.org/10.1108/JABS-08-2015-0119
- Khalid, A., Lee, O. O. K., Choi, M., & Ahn, J. (2018). The effects of customer satisfaction with e-commerce system. Journal of Theoretical and Applied Information Technology, 96(2), 481–491.
- Koo, D. M., & Ju, S. H. (2010). The interactional effects of atmospherics and perceptual curiosity on emotions and online shopping intention. Computers in Human Behavior, 26(3), 377–388. https://doi.org/10.1016/j.chb.2009.11.009
- Kyriakopoulos, G. L. (2011a). Project management (PM) prosperity: A second half of the 20th century literature review. Journal of Management and Sustainability, 1(1), 64. https://doi.org/10.5539/jms.v1n1p64
- Kyriakopoulos, G. L. (2011b). The role of quality management for effective implementation of customer satisfaction, customer consultation and self-assessment, within service quality schemes: A review. African Journal of Business Management, 5(12), 4901–4915.
- Kyriakopoulos, G. L. (2012). Half a century of management by objectives (MBO): A review. African Journal of Business Management, 6(5), 1772–1786.
- Lam, S. Y., Shankar, V., Erramilli, M. K., & Murthy, B. (2004). Customer value, satisfaction, loyalty, and switching costs: An illustration from a business-to-business service context. Journal of the Academy of Marketing Science, 32(3), 293–311. https://doi.org/10.1177/0092070304263330
- Lee, Y. C., Wang, Y. C., Lu, S. C., Hsieh, Y. F., Chien, C. H., Tsai, S. B., & Dong, W. (2016). An empirical research on customer satisfaction study: A consideration of different levels of performance. SpringerPlus, 5(1), 1577–1579. https://doi.org/10.1186/s40064-016-3208-z
- Li, T., Li, W., Zhao, Y., & Chen, H. (2019). The impact of online shopping carnival on consumer decision-making: The moderating role of gender. In PACIS (pp. 184).
- Liang, H., Saraf, N., Hu, Q., & Xue, Y. (2007). Assimilation of enterprise systems: The effect of institutional pressures and the mediating role of top management. MIS Quarterly, 31(1), 59–87. https://doi.org/10.2307/25148781
- Lou, C. (2020). China’s double 11 shopping festival tests consumption strength after COVID-19. China Briefing, November 13, https://www.china-briefing.com/news/chinas-double-11-shopping-festival-tests-consumption-strength-after-covid-19/#:∼:text=On%20November%2011%20alone%2C%20there,consumption%20recovery%20since%20COVID%2D19.
- Loureiro, S. M. C., & Roschk, H. (2014). Differential effects of atmospheric cues on emotions and loyalty intention with respect to age under online/offline environment. Journal of Retailing and Consumer Services, 21(2), 211–219. https://doi.org/10.1016/j.jretconser.2013.09.001
- Luarn, P., & Lin, H. H. (2003). A customer loyalty model for e-service context. Journal of Electronic Commerce Research, 4(4), 156–167.
- MacKenzie, S. B., & Podsakoff, P. M. (2012). Common method bias in marketing: Causes, mechanisms, and procedural remedies. Journal of Retailing, 88(4), 542–555. https://doi.org/10.1016/j.jretai.2012.08.001
- Makkar, D., & Makkar, H. (2013). Diagnostic analysis of factors affecting customer satisfaction index in retail sector in India. Retrieved from https://doi.org/10.2139/ssrn.2622901
- Nguyen, N. (2006). The collective impact of service workers and servicescape on the corporate image formation. International Journal of Hospitality Management, 25(2), 227–244. https://doi.org/10.1016/j.ijhm.2005.06.001
- Nguyen, N., & Leblanc, G. (2001). Corporate image and corporate reputation in customers’ retention decisions in services. Journal of Retailing and Consumer Services, 8(4), 227–236. https://doi.org/10.1016/S0969-6989(00)00029-1
- Nosto. (2020). Global Black Friday statistics for 2020: What you need to know. https://www.nosto.com/blog/black-friday-statistics/
- Oliver, R. L. (1981). Measurement and evaluation of satisfaction process in retail settings. Journal of Retailing, 57(3), 25–48.
- Olsen, S. O. (2002). Comparative evaluation and the relationship between quality, satisfaction, and repurchase loyalty. Journal of the Academy of Marketing Science, 30(3), 240–249. https://doi.org/10.1177/0092070302303005
- Podsakoff, P. M., MacKenzie, S. B., Lee, J. Y., & Podsakoff, N. P. (2003). Common method biases in behavioral research: A critical review of the literature and recommended remedies. Journal of Applied Psychology, 88(5), 879–903. https://doi.org/10.1037/0021-9010.88.5.879
- Quest Mobile. (2020). Quest Mobile 2020 China mobile Internet spring report. https://www.questmobile.com.cn/research/report-new/90.
- Revilla-Camacho, M. A., Cossio-Silva, F. J., & Palacios-Florencio, B. (2017). Corporate responsibility under the ECSI model: An application in the hotel sector. European Research on Management and Business Economics, 23(1), 23–32. https://doi.org/10.1016/j.iedeen.2016.07.003
- Sarantidou, P. (2017). Enriching the ECSI model using brand strength in the retail setting. European Journal of Management and Business Economics, 26(3), 294–312. https://doi.org/10.1108/EJMBE-10-2017-017
- Štefko, R., Bačík, R., Fedorko, R., Oleárová, M., & Rigelský, M. (2019). Analysis of consumer preferences related to the use of digital devices in the e-commerce dimension. Entrepreneurship and Sustainability Issues, 7(1), 25–33. https://doi.org/10.9770/jesi.2019.7.1(2)
- Stevens, J. P. (2009). Applied multivariate statistics for the social sciences (5th ed.). Routledge.
- Strenitzerova, M., & Gana, J. (2018). Customer satisfaction and loyalty as a part of customer-based Corporate Sustainability in the sector of mobile communications services. Sustainability, 10(5), 1657. https://doi.org/10.3390/su10051657
- Sun, K. A., & Kim, D. Y. (2013). Does customer satisfaction increase firm performance? An application of American Customer Satisfaction Index (ACSI). International Journal of Hospitality Management, 35, 68–77. https://doi.org/10.1016/j.ijhm.2013.05.008
- Svatosova, V. (2020). The importance of online shopping behavior in the strategic management of E-commerce competitiveness. Journal of Competitiveness, 12(4), 143–160. https://doi.org/10.7441/joc.2020.04.09
- Tenenhaus, M., Vinzi, V. E., Chatelin, Y. M., & Lauro, C. (2005). PLS path modeling. Computational Statistics & Data Analysis, 48(1), 159–205. https://doi.org/10.1016/j.csda.2004.03.005
- Terblanche, N. S. (2006). An application of the American Customer Satisfaction Index (ACSI) in the South African motor vehicle industry. South African Journal of Business Management, 37(4), 29–38. https://doi.org/10.4102/sajbm.v37i4.611
- Tse, D. K., & Wilton, P. C. (1988). Models of consumer satisfaction formation: An extension. Journal of Marketing Research, 25(2), 204–212. https://doi.org/10.2307/3172652
- Veselý, Š., & Dohnal, M. (2016). Formalized qualitative modeling of online trust: Introduction of the method and detailed example. E + M Ekonomie a Management, 19(2), 201–214. https://doi.org/10.15240/tul/001/2016-2-014
- Vilares, M. J., & Coelho, P. S. (2003). The employee-customer satisfaction chain in the ECSI Model. European Journal of Marketing, 37(11–12), 1703–1722. https://doi.org/10.1108/03090560310495429
- Wu, J. H., Li, Q., & Kee Wei, K. (2016a). Alibaba's IT platform and electronic commerce synergy in driving "Singles' Day. Journal of Organizational Computing and Electronic Commerce, 26(3), 193–202. https://doi.org/10.1080/10919392.2016.1194050
- Wu, J. H., Peng, L., Li, Q., & Chen, Y. C. (2016b). Falling in love with online shopping carnival on singles' day in China: An uses and Gratifications perspective. 2016 IEEE/ACIS 15th International Conference on Computer and Information Science (ICIS), In (pp. 1–6). IEEE. https://doi.org/10.1109/ICIS.2016.7550801
- Xi, G., Cao, X., & Zhen, F. (2020). The impacts of same day delivery online shopping on local store shopping in Nanjing, China. Transportation Research Part A: Policy and Practice, 136, 35–47. https://doi.org/10.1016/j.tra.2020.03.030
- Xu, Y., Chong, T. W., Krilavicius, T., & Man, K. L. (2015). Perceived benefits, risks and trust on Online Shopping Festival. In International Conference on Information and Software Technologies (pp. 225–235). Springer.
- Xu, X., Li, Q., Peng, L., Hsia, T. L., Huang, C. J., & Wu, J. H. (2017). The impact of informational incentives and social influence on consumer behavior during Alibaba’s online shopping carnival. Computers in Human Behavior, 76, 245–254. https://doi.org/10.1016/j.chb.2017.07.018
- Xu, Q., Shao, Z., & He, Y. (2021). Effect of the buy‐online‐and‐pickup‐in‐store option on pricing and ordering decisions during online shopping carnivals. International Transactions in Operational Research, 28(5), 2496–2517. https://doi.org/10.1111/itor.12942
- Xu, X., Wang, L., & Zhao, K. (2020). Exploring determinants of consumers’ platform usage in “Double Eleven” shopping carnival in China: Cognition and emotion from an integrated perspective. Sustainability, 12(7), 2790. https://doi.org/10.3390/su12072790
- Yang, S., Li, L., & Zhang, J. (2018). Understanding consumers’ sustainable consumption intention at China’s double-11 online shopping festival: An extended theory of planned behavior model. Sustainability, 10(6), 1801. https://doi.org/10.3390/su10061801
- Yen, Y., Wang, Z., Shi, Y., Xu, F., Soeung, B., Sohail, M. T., Rubakula, G., & Juma, S. A. (2017). The predictors of the behavioral intention to the use of urban green spaces: The perspectives of young residents in Phnom Penh, Cambodia. Habitat International, 64, 98–108. https://doi.org/10.1016/j.habitatint.2017.04.009
- Yu, H., Zhang, R., & Liu, B. (2018). Analysis on consumers’ purchase and shopping well-being in online shopping carnivals with two motivational dimensions. Sustainability, 10(12), 4603. https://doi.org/10.3390/su10124603
- Zeithaml, V. A. (1988). Consumer perceptions of price, quality, and value: A means-end model and synthesis of evidence. Journal of Marketing, 52(3), 2–22. https://doi.org/10.1177/002224298805200302
- Zeithaml, V. A., Berry, L. L., & Parasuraman, A. (1988). Communication and control processes in the delivery of service quality. Journal of Marketing, 52(2), 35–48. https://doi.org/10.1177/002224298805200203
- Zeng, M., Cao, H., Chen, M., & Li, Y. (2019). User behaviour modeling, recommendations, and purchase prediction during shopping festivals. Electronic Markets, 29(2), 263–274. https://doi.org/10.1007/s12525-018-0311-8
- Zhang, X., Ma, L., & Wang, G. S. (2019). Investigating consumer word-of-mouth behaviour in a Chinese context. Total Quality Management & Business Excellence, 30(5-6), 579–593. https://doi.org/10.1080/14783363.2017.1317587
- Zhao, Z., Chen, M., & Zhang, W. (2019). Social community, personal involvement and psychological processes: A study of impulse buying in the online shopping carnival. Journal of Electronic Commerce Research, 20(4), 255–272.