
 ?Mathematical formulae have been encoded as MathML and are displayed in this HTML version using MathJax in order to improve their display. Uncheck the box to turn MathJax off. This feature requires Javascript. Click on a formula to zoom.
Abstract
The coronavirus epidemic (COVID19) has affected the global economy and the services sector. Quarantine measures related to travel restrictions have led to an unprecedented decline in the tourism industry with repercussions on tourism service providers, transport companies and state budgets. Travel is necessary for tourism, therefore, any factor that prevents travel can have a profound impact on the tourism industry. In the current pandemic context, the forecast in the field of tourist travel has played an important role in supporting the revival of this sector. In this study, econometric and interpretive methods were combined to predict the demand. In this study we approached a prediction model that is based on the seasonal stationary and adjustment of observed and FFT data. Experimental results show that the proposed prediction model has demonstrated a good medium-term forecast and can be used successfully in short and medium periods of time. For a certification of the exploratory evaluation of tourism forecasts there were comparatively analyzed the results obtained for three countries in south-eastern Central Europe, countries with similar natural and anthropic tourist resources (Bulgaria, Croatia and Romania).
1. Introduction
For most of its history, travel has been difficult, inconvenient, expensive, and often dangerous. However, travel has been undertaken and this involves some strong motivators. In the last 150 years alone, travel has become more accessible and less difficult. Most of those who traveled were prepared to openly admit that pleasure was one of the motivations of their travels. Only in the 21st century has the journey encountered several obstacles such as the unfortunate events of the 9/11 attacks (Goodrich, Citation2002), SARS in Asia (McKercher & Chon, Citation2004, pp. 716–719) international terrorist attacks (Schmude et al., Citation2020, pp. 88-102), the global financial crisis of 2008 (UNWTO, Citation2013), are all examples of how dramatic situations have affected the behavior and habits of tourists, but they also highlight the way in which the tourist market has always managed to return and develop over time (Gössling et al., Citation2021). For example, the outbreak of Severe Acute Respiratory Syndrome (SARS) in 2003 devastated the Asian tourism (McKercher & Kaye, 2004, pp. 716-719) and led to a global depreciation of tourism by 0.4%, and the financial crisis of 2008 led to a 4% decrease in the year 2009, a decrease of 37 million tourists compared to the previous year (UNWTO, Citation2021).
The current health crisis caused by the coronavirus SARS-CoV-2 (associated with the disease called Covid-19) has led to an unprecedented decrease in tourism, in 2020 the flow of tourists decreased by 73.9% which meant that they traveled with 1.1 billion people less (UNWTO, Citation2021). This pandemic crisis has reduced travel mobility (Marcu, Citation2021, pp. 1-18), all countries in the world have imposed restrictions on international and national travel, and it increased the risk of travel. Security is one of the main criteria in assessing and choosing the destination (Şuşu & Leuciuc, Citation2018, pp. 83-89) of a tourist, therefore he will choose a space that is free of real and potential risks.
Tourism is an important moving force for most of the world’s economies (Rasool, Citation2021), advanced or developing economies. At the same time it is a strong sector interconnected with a large part of the national economy of each country.
Tourism is the product of a confluence of multiple material and imaginary elements that must be placed in specific political, economic, cultural and social contexts. In the context of the current pandemic (Szentesi et al., Citation2021), any transformation of one of the factors that make up the processes and the tourism system brings direct or indirect changes to all actors in the tourism market (Yustisia et al., Citation2021).
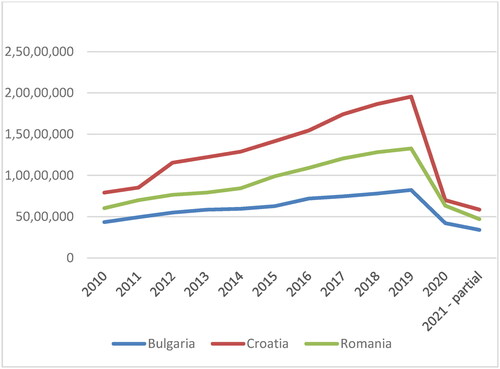
For this study we chose to refer to three countries within the European Union (Ari et al., Citation2020), namely Bulgaria, Croatia and Romania. These countries have similar tourist resources in the south-eastern part of Europe (Chi-Wei et al., Citation2021) and have a similar evolution of the tourism industry ().
Figure 1. Annual arrivals in the period 2010–2021 (first semester).
Source: Author contribution based on statistical dataFootnote9
Covid-19 has disrupted tourism around the world, causing tourism demand forecasts to be exceeded. Researchers have begun to look for the best ways to predict the recovery of tourism from the devastating effects of Covid-19. The exact prediction of the tourist flow is essential, especially in the periods when the tourism industry is going through a period of crisis, that is why the paper has a theoretical applicability, by finding a short and medium term forecast model of Fourier type applicable to the tourist traffic in the three countries of SE Europe in a pandemic context, as well as practical one, offering the possibility to anticipate its values which are particularly important for the authorities of the respective states in order to take the necessary measures to diminish and counteract the negative effects of the pandemic on the tourism sector and for its recovery and resilience.
Tourism plays an important role in the EU because more than one in ten enterprises in the European non-financial business economy belonged to the tourism industries, and its socio-economic and employment implications.Footnote1
For the proper preparation of tourist attractions according to the current pandemic context caused by the SARS-CoV-2 coronavirus (Panasiuk & Wszendybył-Skulska, Citation2021) and the correct information of tourism companies and providing a vision, even for a short period of time, on tourist demand can reduce the risk in the decision-making process (YiFei & Han, Citation2018).
2. Literature review
2.1. Conceptual approach
The year 2020 was strongly marked, globally, by the shock wave caused by Covid-19 pandemic. This has created a situation that the states of the world have not faced for a very long time and which has led the authorities to resort to extraordinary measures. As the uncertainty associated with the evolution of the pandemic and the restrictions implemented by the authorities to limit the spread of the virus have substantially affected both supply and demand, the world economy contracted by 3.3 percent in 2020Footnote2, a greater decline being avoided as a result of extreme comprehensive measures fiscal and monetary stimulus measures adopted in many countries.
Tourism is an important driving force for much of the world’s economies. In recent decades, tourism has developed steadily (Aguiar-Barbosa et al., Citation2021, pp. 435-462) and become one of the fastest growing economic sectors globally. The sector has grown by 59% in a decade, the number of international tourist arrivals reached 1.5 billion in 2019, compared to 880 million in 2009. Tourism is also a key factor for socio-economic progress, with developments specific to tourism in a growing number of international destinations.
According to data published by the World Travel Tourism Council, tourism (before the pandemic) participates with 1 in 4 new jobs created worldwide, 10.6% of all jobs (334 million) and 10.4% of GDP-global spending, and spending on international visitors amounted to $1.7 trillion in 2019 (6.8% of total exports, 27.4% of global services exports)Footnote3.
The latest annual WTTCFootnote4 research shows that tourism suffered a loss of almost $4.5 trillion in 2020, the contribution to GDP falling by a staggering 49.1% compared to 2019, in 2020, 62 millions of jobs were lost, and spending on domestic visitors fell by 45%Footnote5, while the spending on international visitors fell by an unprecedented 69.4%.
Croatia is one of the most popular tourist destinations in Europe, the tourism sector being an important economic engine of the country’s economy (Vucenovic et al., Citation2020, pp. 80-92). With almost 1100 miles of Adriatic coast, mountains, spas and old port cities full of history with stone buildings from the Venetian era, Croatia reached a peak in the tourism industry in 2019 (Kovačević, Citation2020, pp. 1652-1670) (see ). The total GDP contribution in 2019 was 10.4%, and in 2020 the contribution of the tourism sector was only 5.5%. Croatia also faced a dramatic drop in the number of international tourists of −65.7%Footnote6 during the pandemic, expressed in a decrease of about 7.8 billion USD (Šulc & Fuerst-Bjeliš, Citation2021). Like all countries, the tourism industry has been severely affected (Payne et al., Citation2021).
Bulgaria has a coastline of 378 km, of which 200 km are sandy beaches on the Black Sea and a third of the country’s territory is covered by mountains. It annually attracts tourists from both the mainland and around the world, it recorded in 2019 over 8.2 million arrivals, but in 2020 only over 4.2 million arrivals were recorded (Ivanova et al., Citation2021, pp. 1-11) (see ). International tourist arrivals in 2020 led to a change in spending with international visitors by −64.5% expressed in a decrease of about $3.1 billionFootnote7.
Romania exploits both the coastal resources of the Black Sea and the mountain resources of the Carpathians (Dorobăţ & Dobrescu, Citation2016, pp. 63–72), to which are added the rich balneo-climateric resources (Nistoreanu & Aluculesei, Citation2021, p. 270) from all over the territory. The number of arrivals registered in the accredited accommodation bases has steadily increased since 2010, reaching in 2019 a maximum of over 13.2 million tourists (see ). The decrease in the number of tourists of − 64.2% is in line with the global trend. The arrivals of international tourists in 2020 led to a change in spending on international visitors by −79.9% (the largest decrease in percentages among the analyzed countries) expressed in a decrease of about $3.4 billionFootnote8.
2.2. Statistical approach
After the drastic cessation of tourism due to the pandemic, this year the sector is ready for recovery, and statistics give us the ability to make predictions (Jiao et al., Citation2021). With the launch of the vaccination campaign (Turcu-Stiolica et al., Citation2021) at the beginning of the year, a gradual improvement of the situation in the tourism sector is expected. Domestic tourism will benefit first (Panasiuk & Wszendybył-Skulska, Citation2021). The markets’ demand is likely to remain low for longer period of time and some business tourism will stagnate as digitalization accelerates (Ying et al., Citation2021). There is still considerable uncertainty about the further evolution of the pandemic, the progress of immunization campaigns and the relaxation of isolation and protection measures, therefore the forecast can contribute to the restart of the sector (Höpken et al., Citation2021).
Tourism demand forecasting (Aleksandrova et al., Citation2021, pp. 181–196) has played an important role in supporting governments to develop development policies for travel and tourism. Time series (Isaic-Maniu et al., Citation2004) related to tourism often do not comply to statistical assumptions and show significant time fluctuations (Apergis et al., Citation2017, pp. 78-98), but a Fourier series is often applied to oscillating sequences, it is reasonable to develop a prediction model with a Fourier series to forecast tourism demand (Zhang et al., Citation2021). Timeline forecasting is the process of using a forecast model to predict the future values of a variable based on its previously observed values (Ghalehkhondabi et al., Citation2019, pp. 75-93). But “tourism demand” is a broad concept that is not easy to measure by a certain standard. Domestic tourism demand could be measured by the number of tourist arrivals, tourist expenses or the number of nights spent by tourists. The complexity of collecting data on timely tourist expenditures, the number of tourist arrivals has been widely used as an appropriate indicator of tourism demand (Shu & Hung, Citation2014).
Forecasts play a major role in tourism planning, they are even more valuable in times of crisis and post-crisis. It is applied the Fourier LM unit root test to obtain more robust findings (Pata, Citation2020, pp. 1149–1155). Since the test can mimic a small number of smooth breaks using a parsimonious number of parameters, it can avoid the loss of power that can occur in unit root tests using a large number of estimated dummy variables (Enders & Lee, Citation2012, pp. 574–599). A Fourier approximation attempts to minimize the average prediction bias (Gallant, Citation1981, pp. l-245).
In the context of Covid-19, the Fourier causality regression was deemed to be the most suitable technique, as it provides robust estimates following the structural breaks (Zhang et al., Citation2021). Reviving the tourism industry would be much easier if it were possible to analyze current and past tourist traffic and predict the nature of changes in tourism demand. These extrapolation approaches to forecasting require historical data. Most quantitative methods use historical data to make a forecast, and some of them use data from test markets (Danbatta & Varol, Citation2021, pp. 1-6). The results of the demand forecast can be used for supply, workforce planning, defining pricing and marketing strategy. Incorrect calculation of the volume of future demand can be costly, both in case of underestimation and overestimation.
3. Theoretical framework and methodology
In order to obtain conclusive results from the statistical analysis of the chronological series regarding the tourist activity in Bulgaria, Croatia and Romania, certain working hypotheses must be observed, regarding the study of the normality of the series through which their forecast is made, the stationarity of the series based on, independence of variables, absence of autocorrelation of residues, etc.
Regarding the verification of the stationarity of the statistical data series, we used the ADF (Augmented-Dickey-Fuller) (Islam et al., Citation2018) and PP (Philips-Perron) (Vogelsang, Citation2013, pp. 609-628) stationarity tests, Auto-correlation function graph (ACF) (Gujarati, Citation2004) and partial auto-correlation function graph (PACF) (Killick et al., Citation2020). Given the fact that the initial series of statistical data are not stationary and present seasonality, the analysis and statistical modeling of tourist data needs to correct these deviations from statistical hypothesis in order to obtain credible results. For a correct interpretation of the evolution and correlations between the analyzed variables, we proceeded to the stationarisation of the respective series, by differentiating degree 2, standardizing and verifying the normality of the stationary chronological series d(arr_BG, 2), d(arr_CR, 2) and d(arr_RO,2) by the coefficients Skewness and Kurtosis, and by the values of Jarque-Bera statistics, of quantile distribution and distribution-Kernel Density.
Regarding the determination of the trend of the time series, the Hodrick–Prescott Filter was applied and thus their cyclic component was eliminated, and then the seasonal adjustment was performed with the help of STL Decomposition, but also the elimination of autocorrelations between residues and only then we would apply Fourier Forecast Fast Transformation in the form of the Forecast_Fourier_ReSeas model.
The forecasting power of the Forecast_Fourier_ReSeas model determined with the help of SPSS 28 is 0.943 for the case of Bulgarian tourism, 0.917 for the Croatian one and only 0.852 for the Romanian one.
Given that tourism is seasonal in general, but also in the case of the three analyzed countries, the time series of arrivals in Bulgaria, Croatia and Romania can be analyzed and forecasted using a prediction model based on stationary and seasonal adjustment of observed and FFT. This model is readjusted with the seasonal factor (ReSeasonal), in order to improve its accuracy, and in order to evaluate its forecasting power, we compare the forecasted values with the effective ones from December 2010 to July 2021.
An urgent problem that arises in the analysis of the evolution of the volume of arrivals in the three similar countries in terms of tourism is that of determining the legitimacy of its variation. Because the evolution of the time series of arrivals is relatively seasonal (12), from year to year, the basic idea of this method is to model by a FFT the data recorded over a period of time and analyze the variation of the series arrivals on this function.
However, the central idea is to regularize the analyzed data because the general study on the Fourier curve gives much simpler indications on the local extremes of the phenomenon and the period of their appearance (Rodrigues & Robert, Citation2012, pp. 736–759).
Therefore the function f:R→R, periodic of main period T > 0 that is:f(x + T)=f(x), ∀x∈R where T is the smallest with this property. We will also assume that f is continuous on portions and has finite lateral limits at any point (Ioan & Ioan, Citation2011, pp. 146-161)
The Fourier series (trigonometric) associated with the function f on the interval is:
(1)
(1)
Fourier coefficients an, n ≥ 0 and bn, n ≥ 1 are determined from the formulas:
(2)
(2)
For a set of N data obtained at equal time intervals, we will consider the period T = N and the function f given tabulated, in the form:
Table
In this case, the function f is constant over any interval
taking the value yk, k=
The determination of the Fourier coefficients is obtained by decomposing the integrals on the N intervals, becoming:
(3)
(3)
Considering the Fourier development with a finite number “p” of terms we obtain in the end:
(4)
(4)
Since the function f is periodic, it is obvious that its determination based on the Fourier development in a point outside the interval it will not generate another value, being obtained by periodicity (Ioan & Ioan, Citation2019).
In order to model the real phenomenon more accurately, as many terms as possible must be considered in Fourier development. A comparative analysis was performed based on a statistical software for the three series of arrivals, based on the determination of the Fourier series, the determination of the frequency, the amplitude, FFT amplitude Mirror and FFT amplitude, and then on the determination of seasonal factor, seasonal adjustment of the series, forecast and forecast Fourier determination and reseasonal for greater accuracy. Therefore, the number of observations was set at 128, given that a Fourier series requires 2n terms.
In the case of Bulgaria, Croatia and Romania, after analyzing the comparative graphs, it is observed that the graphs of the two curves regarding Arrivals and Forecast_Fourier_ReSeas are almost identical. The behavior of the forecast using the Fourier_ReSeas curve generally reveals deviations from the evolution of the arrivals series, especially during the pandemic, and especially during the months of generalized lockdown, for which we proceeded to an analysis of the correlation factor between them, both for the entire period, and by excluding the lockdown months, respectively March-June 2020, and by excluding from the analysis the period from the onset of the pandemic. Thus, it is observed that the values of the correlation coefficients are very high, of over 0.90, but also that they increase by eliminating the lockdown months or the entire period from the onset of the pandemic.
4. Results - Exploratory analysis
The exploratory and comparative assessment was performed on an initial number of 417 observations (139 observations for each of the 3 studied countries), between January 2010 and July 2021, later reduced to a number of 384 observations (128 for each country) from December 2010 to July 2021, as the application of FFT implies the existence of a number of 2n elements.
The statistics on arrivals in Bulgaria from January 2010 to July 2021 were obtained from https://www.ceicdata.com/en/indicator/bulgaria/visitor-arrivals and https://www.unwto.org/statistic/basic-tourism-statistics, and for October 2019 and November 2019 they were interpolated because these values were not available, and the website National Statistics Institute of Bulgaria https://www.nsi.bg/opendata/ does not work.
Historical data on arrivals in Croatia were collected using the Eurostat database https://ec.europa.eu/eurostat/web/tourism/data/database, and for Romania the same Eurostat database was used for the period January 2010 - May 2021 https://ec.europa.eu/eurostat/web/tourism/data/database as well as the Tempo Online database within the National Institute of Statistics of Romania http://statistici.insse.ro/shop/index.jsp?page=tempo2&lang=en&context=63.
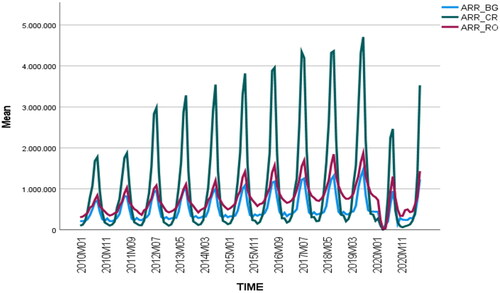
Based on statistical data on the monthly evolution of tourist arrivals in Bulgaria, Croatia and Romania, the following graph is obtained which highlights the seasonality of the three analyzed series ().
Figure 2. Evolution of time series arrivals.
Source: Author Estimations based on SPSS 28
With the help of statistical software SPSS28 and EViews12, Descriptive Statistics are obtained for the series of arrivals (see ).
Table 1. Descriptive Statistics for the series arrivals.
The statistical analysis of the series of arrivals from the 3 countries will allow us to obtain reliable results if they comply with certain working hypotheses, regarding the normality of the series by which their forecast is achieved, the stationarity of the series based on the forecast, the independence of variables, absence of residue autocorrelation, etc. ().
Most of the time the initial time series do not meet these conditions and even more so the initial time series on arrivals. Moreover, the tourist data are characterized by a seasonality compared to the other economic-financial time series. Thus, the analysis and statistical modeling of tourist data need to correct these deviations from statistical assumptions in order to obtain credible results. For a correct interpretation of the evolution and correlations between the analyzed variables we will first proceed to the stationarizing of the respective series, their standardization and normalization, but also to the elimination of the autocorrelations between the residues and only then we can apply Forecast_Fourier_Transformation.
4.1. Checking the stationarity of the arrivals series and their stationary
Based on and the correlogram () for the series arrivals verify the normality of the stationarity. Thus, we start from the hypothesis H0: the series has at least one unitary root (has a unit root). By applying the ADF and PP tests, values were obtained for the statistical test that were higher than the critical values, which is why the null hypothesis H0 could not be rejected, i.e. the series had at least one unit root (has a unit root) and therefore, the series was unsteady.
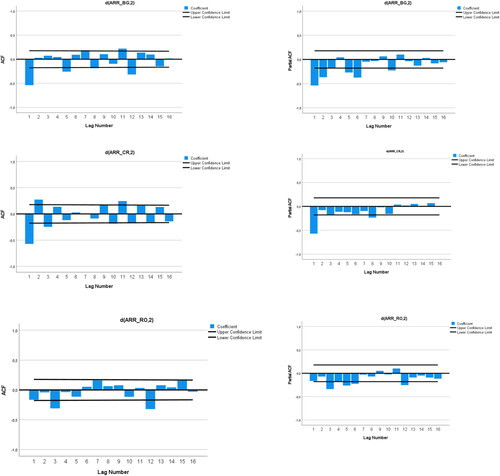
Figure 3. Correlogram ACF and PACF.
Source: Author Estimations
In order to statistically test the stationarity of the three initial data series, we applied the ADF and PP stationarity tests with the help of statistical software. For this purpose we have proceeded to generate the series arr_BG, arr_CR and arr_RO, respectively d(arr_BG, 1), d(arr_CR, 1) and d(arr_RO, 1) by differentiating the initial series of order 1. By applying the tests ADF and PP there are obtained values for the statistical test that were higher than the critical values, fact for which the null hypothesis H0 could not be rejected, i.e. the series had at least one unit root and therefore, the series were non-stationary.
Considering the fact that the order 1 series are not stationary either, we later proceeded to the order 2 differentiation and to the logarithm. By order 2 differentiation stationary series are obtained for all 3 countries, namely series d(arr_BG, 2), d(arr_CR, 2) and d(arr_RO, 2) because based on the ADF and PP test for them it is found that the value of the statistical test is lower than any critical value for a significance level of 1%, 5% and 10%, and the associated probability is <0.05, so we can say that the null hypothesis H0 is rejected, i.e. the respective series do not have a unitary unit, i.e. the respective series are stationary for a significance level of 1%.
By logarithm, non-stationary series are also obtained, and only after the order 1 differentiation of the initial logarithmic series, stationary series are obtained.
We will choose the order 2 differential series because they have a better correlation coefficient than those obtained by the order 1 differentiation of log(arr_BG), log(arr_CR) and log(arr_RO), and the Durbin-Watson coefficients have values close to 2, which means that the parameters are stable. So the order of integration of the three series is 2 or the series are lag 2. Also, the stationarity of the series can be appreciated with the help of the autocorrelation function (correlogram) generated with the help of statistical software. The ACF and PACF correlograms for the 3 stationary series are presented as follows:
Auto-correlation function graph (ACF) and partial auto-correlation function graph (PACF) for series d(arr_BG, 2), d(arr_CR, 2) and d(arr_RO, 2) highlight the stationarity of the series for 2 degree of seasonal difference.
4.2. Checking the normality of the stationary series
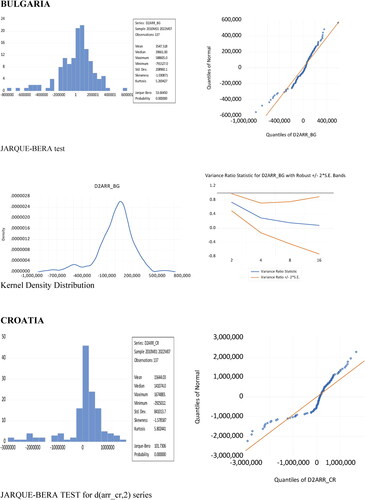
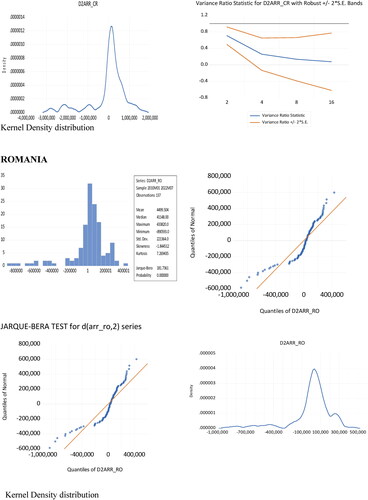
Verifying the normality of the stationary chronological series d(arr_BG, 2), d(arr_CR, 2) and d(arr_RO, 2) is performed both by the coefficients Skewness and Kurtosis, and, especially, by the values of Jarque-Bera statistics of quantile distribution and Kernel-Density distribution.
Based on the tests applied and presented in , it is found that all 3 series that were stationary have a leptokurtic distribution (value for Kurtosis> 3) and with a slight asymmetry to the left (negative skew). In the case of leptokurtic distributions, the probability of an extreme event occurring is higher than in the case of a normal distribution. Also, the quantiles are relatively close to the quantile distribution of a normal distribution and Variance Ratio Statistic for the three series of order 2 shows that with Robust +/- 2 * S.E. Bands show the predictability of time series data by comparing data differences (returns) calculated at different intervals.
Figure 4. Verification of normality for the stationary data series.
Source: Author Estimations
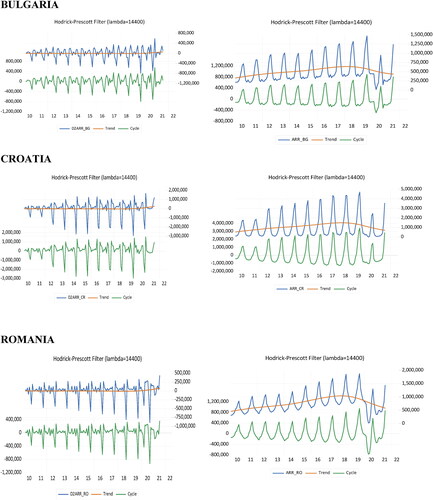
4.3. Determining the trend of stationary series and their seasonal adjustment
The determination of the trend is obtained by applying the Hodrick-Prescott Filter with the help of statistical software on the stationary data series d(arr_BG, 2), d(arr_CR, 2) and d(arr_RO, 2) and thus their cyclic component can be eliminated. Thus, we obtain some graphical representations as a smoothed curve of a time series, which is more sensitive to long-term fluctuations than to short-term fluctuations. Adjusting the sensitivity of the trend to short-term fluctuations is done by modifying the lambda multiplier.
Based on the representations in , it can be noticed the trend for each of the 3 stationary series.
Figure 5. Trend for the stationary data series.
Source: Author Estimations
The seasonal adjustment of the stationary series is presented as follows in .
Figure 6. Seasonal averages for series d (arr_BG, 2), d (arr_CR, 2) and d (arr_RO, 2).
Source: Author Estimations based on EViews
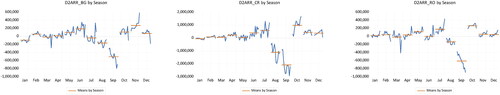
shows the evolution of the stationary series and the average of the observations for each month (horizontal line). If there are significant differences between the monthly averages as in the case of the 3 analyzed countries, it highlights the fact that the 3 stationary series have seasonality.
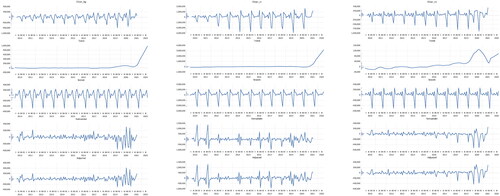
The de-seasonalization of the series can be done with STL Decomposition (see ).
Figure 7. STL Decomposition for the stationary data series.
Source: Author Estimations
4.4. Forecast Fast Fourier transformation
Starting from the fact that the analyzed time series are seasonal, they can be predicted using FFT. The achievement of the forecasting model called Forecast_ReSeas was determined by stationary the initial series, their seasonal adjustment and FFT, and then to increase the precision power it is readjusted with the seasonal factor (ReSeasonal) which can be seen in .
Figure 8. Forecast series for Bulgaria.
Source: Author Estimations
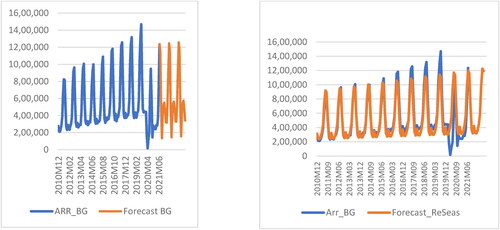
Figure 9. Forecast series for arr_CR and Forecast_Fourier_ReSeas_CR.
Source: Author Estimations
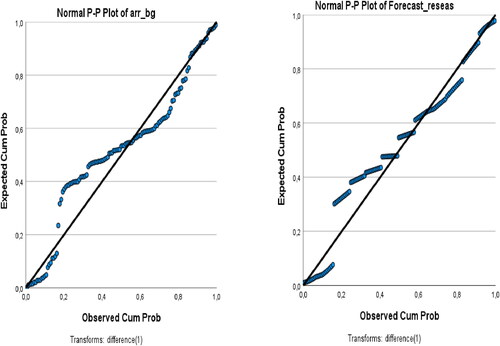
Figure 10. Forecast series for arr_RO and Forecast_Fourier_ReSeas.
Source: Author Estimations
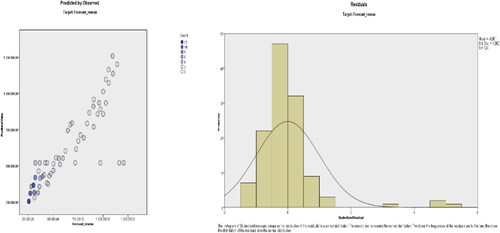
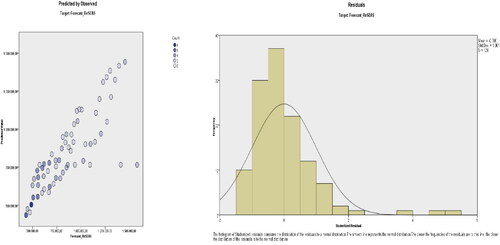
In the following graphs it can be observed the comparative evolution between the initial series, the stationary series and Forecast_Fourier_ReSeas (see ). It can be seen that for all 3 analyzed countries it is found that the largest deviations between Forecast Reseas and the initial series are recorded during the lockdown generated by the pandemic with Covid-19, and that in Romania is the largest deviations because tourism it was most affected by the pandemic. The normal probability plot shows that FFT series are approximately normally distributed (see ) and predicted values versus observed and distribution of residuals can be observed in for all 3 analyzed countries.
Figure 11. Normal probability plot for serie arr_BG and Forecast_ReSeas_BG.
Source: Author Estimations
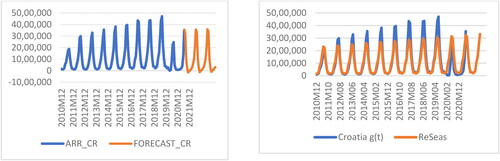
Figure 12. Normal probability plot for serie arr_CR and Forecast_ReSeas_CR.
Source: Author Estimations
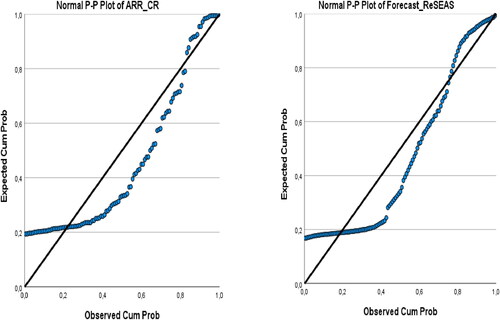
Figure 13. Normal probability plot for serie arr_RO and Forecast_ReSeas_RO.
Source: Author Estimations
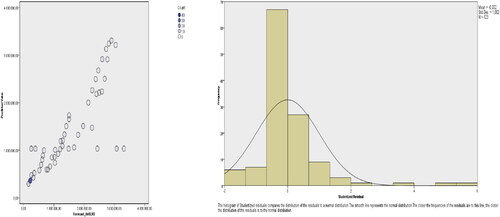
Figure 14. Predicted values Forecast_ReSeas_BG vs observed and distribution of residuals.
Source: Author Estimations
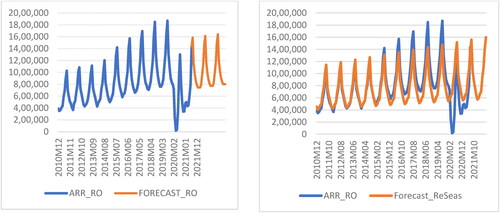
Figure 15. Predicted values Forecast_ReSeas_CR vs Observed and distribution of residuals.
Source: Author Estimations
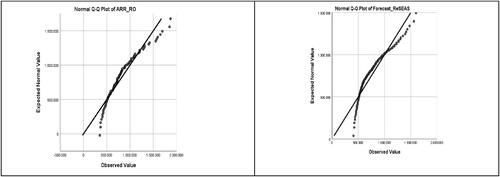
Figure 16. Predicted values Forecast_ReSeas_RO vs Observed and distribution of residuals.
Source: Author Estimations
4.4.1. Forecast FFT Bulgaria
For Bulgaria, based on and , a correlation coefficient of 0.903 is obtained, but which increases to the value of 0.943, respectively to 0.971, if the values related to the lockdown period of 2020 are not considered, respectively if the values from December 2010-February 2020 are analyzed, that is, until the onset of the pandemic.
Table 2. Correlations for series arr_BG and Forecast_Fourier_ReSeas serie for Bulgaria.
Table 3. Correlations for series arr_BG and Forecast_Fourier_ReSeas serie for Bulgaria.
Table 4. Model Summary for Forecast_Fourier_ReSeas_BG.
shows the prediction power determined using SPSS for Forecast_Fourier_ReSeas is 0.943, which is a very high value.
4.4.2. Forecast FFT Croatia as shown in and and and
Regarding the analysis of data on tourism in Croatia, based on and , the values of the correlation coefficient is 0.917 for the period December 2010–July 2021, and 0.935 if not analyzed the values recorded in the lockdown months, respectively 0.964 for the period before the outbreak of the pandemic ( and ).
Table 5. Correlations for series arr_CR and Fourier_Forecast_ReSeas serie for Croatia.
Table 6. Model Summary for Forecast_Fourier_ReSeas_CR.
Table 7. Model Summary for Forecast_Fourier_ReSeas_CR.
shows the forecasting power of the model Forecast_Fourier_ReSeas_CR determined with SPSS 28 is 0.929 which confirms that the respective function can be used successfully for the medium and short-term prediction of the tourist activity.
4.4.3. Forecast FFT Romania according to and , and and
For the forecast of the evolution of the tourist activity in Romania, based on and , the respective Forecast_Fourier_ReSeas function the correlation coefficient is 0.812, but its value increases if it is eliminated from the analysis those months in which the tourist circulation was impeded due to the generalized lockdown, at 0.851, respectively at 0.924 if only the data are analyzed until the onset of the pandemic ( and ).
Table 8. Correlations for series arr_RO and Forecast_Fourier_ReSeas serie for Romania.
Table 9. Model Summary for Forecast_Fourier_ReSeas_RO.
shows the forecasting power of the forecast model in the case of Romanian tourism, determined with SPSS 28 is 0.852 because it seems that this country was the most affected in terms of tourism among the 3 analyzed countries.
5. Discussions
Other authors have studied the implications of the pandemic on the evolution of international trade with the help of the novel Fourier causality test because the Fourier causality regression was deemed to be the most suitable technique, as it provides robust estimates following the structural breaks (Zhang et al., Citation2021)
Also, the modeling and forecasting of tourism in a post-pandemic context was approached by (Danbatta & Varol, Citation2021) and (Kovačević, Citation2020).
The exploratory and comparative assessment of the tourist activity from the 3 similar countries from South-Central Europe was realized in the period January 2010 - July 2021. In order to obtain reliable results from the statistical analysis of the tourist activity in the 3 studied countries, certain working hypotheses must be observed, regarding the study of the normality of the series through which their forecast is achieved, the stationarity of the series based on the forecast, independence of variables, absence of residual autocorrelation, etc.
The forecasting power of the Forecast_Fourier_ReSeas model determined with the help of SPSS 28 is 0.943 for the case of Bulgarian tourism, 0.917 for the Croatian one and only 0.852 for the Romanian one.
Following these results, it can be appreciated that this forecasting method based on the seasonal adjustment of time series on arrivals and their forecast by FFT and re-seasonalization of the forecast model is very good for a medium-term forecast, and can be used successfully in case of short and medium periods of time. This method will be useful for anticipating the way in which the tourism sector will evolve in the short and medium term, which has been severely affected by the pandemic, and can provide economic operators in the field a starting point for planning their activities.
The estimated results obtained for the number of tourists who can arrive in the three countries considered in the study are shown in and represented graphically in from which it can be seen that the tourist phenomenon will return in the course of 2022 to values appropriate to those recorded before the pandemic ( and ).
Figure 17. Forecast Fourier.
Source: Author Estimations.
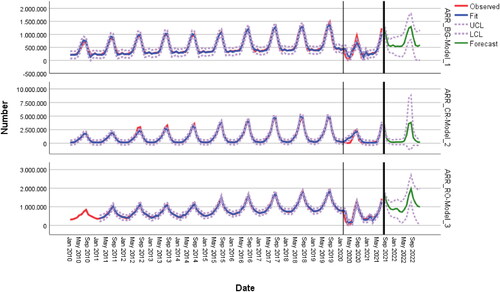
Table 10. Model Summary for Forecast_Fourier_ReSeas_RO.
Table 11. Forecast_Fourier_ReSeas.
and illustrate the 12-month forecast, 2021M08-2022M07 based on Forecast_Fourier_ReSeas. The values of arrivals obtained by this forecast compared to the values of arrivals in 2019, the best year for the tourism industry, for the three countries analyzed in south-central Europe highlight the fact that the months with maximum variances are recorded in the summer season. It is also observed that Croatia remains the leader in the area followed by Romania and Bulgaria. This prediction is limited by the economic situation as we are already in a health crisis, which is associated with an economic crisis combined with an energy crisis.
6. Conclusions
The Covid-19 pandemic is causing imbalances in many of the world’s economies, triggering a global health crisis and slowing travel and international trade due to strict quarantine measures. Being an extreme phenomenon, the blockade triggered a global economic shock at an alarming rate, bringing strong recessions for many countries. The basic strategy for overcoming this multiple crisis caused by Covid-19 will have to involve solutions that combine effective and widely available vaccines and therapeutic drugs.
The main features of intangibility and perishability tourism products and services make the forecast an important tool for tourism planning, especially in the current period of the Covid-19 pandemic. Ministries and tourism authorities face uncertainty regarding the forecast of demand and the decisions they have to take in order to reopen the business so as to ensure the safety of tourists and employees in the sector.
It should be noted that this type of research is not intended to determine the final conclusions of the studied subject, but to serve as a basis for further investigations, so that they are responsible for extracting the results that led to relevant conclusions. Promoting tourism projects that involve substantial sums of money requires an estimate of future demand and market entry.
In the case of the analyzed countries, the estimated results regarding arrivals have noticeable differences, being observed especially in the period after the onset of the pandemic, and especially during the months of generalized lockdown (see ). It can be concluded that this forecast model could be useful for tourism decision makers if countries do not face other risks, as they could affect the predictability of tourism, which could reach during the year 2022 values comparable to those before the pandemic.
Unfortunately, currently the countries of Eastern Europe, and implicitly the analyzed ones, are facing another particularly serious problem, namely the existence of a war in the immediate vicinity, in Ukraine, which leads to a series of other problems related to insecurity which foreign tourists perceive, which represents a new threat to the tourist domain, which has already been put to test during this period.
This study has certain limitations because the empirical study may be affected by the anomalies recorded by the tourism activity since the onset of the pandemic and therefore it cannot determine a forecast model that is valid in the longer term if restrictions occur again in terms of tourist traffic. Moreover, this study focuses mainly on the series of arrivals from the 3 countries taken in the analysis, so future research will be able to start from it but also take into account a number of other factors that may influence tourism, not only the influence exerted by the pandemic context. In addition, future research should be conducted, which can analyze other forecast models for seasonal tourist series such as ARIMA.
Authors contributions
The authors have equally contributed to the present article.
Disclosure statement
No potential conflict of interest was reported by the authors.
Data availability statement
The data presented in this study are available on request from the corresponding author.
Additional information
Funding
Notes
3 World Travel & Tourism Council (Citation2020). Global Economic Impact & Trends 2020; World Travel & Tourism Council: London, UK, 2020.
4 World Travel & Tourism Council (Citation2021). ECONOMIC IMPACT 2021; World Travel & Tourism Council: London, UK, 2021.
5 World Tourism Barometer, January 2020, UNWTO
6 World Travel & Tourism Council. CROATIA 2021 Annual Research: Key Highlights; World Travel & Tourism Council: London, UK, 2021.
7 World Travel & Tourism Council. BULGARIA 2021 Annual Research: Key Highlights; World Travel & Tourism Council: London, UK, 2021.
8 World Travel & Tourism Council. Romania 2021 Annual Research: Key Highlights; World Travel & Tourism Council: London, UK, 2021.
References
- Aguiar-Barbosa, A., Chim-Miki, A., & Kozak, M. (2021). Two decades of evolution in tourism competitiveness: a co-word analysis. International Journal of Tourism Cities, 7(2), 435–462. https://doi.org/10.1108/IJTC-10-2020-0224
- Aleksandrova, A., Aigina, E., & Dombrovskaya, V. (2021). The forecasting potential of adaptive models in tourism. Turyzm/Tourism, 31(2), 181–196. https://doi.org/10.18778/0867-5856.31.2.10
- Apergis, N., Mervar, A., & Payne, J. (2017). Forecasting disaggregated tourist arrivals in Croatia: Evidence from seasonal univariate time series models. Tourism Economics, 23(1), 78–98. https://doi.org/10.5367/te.2015.0499
- Ari, A., Bartolini, D., Boranova, V., et al. (2020). Infrastructure in Central, Eastern, and Southeastern Europe: Benchmarking, macroeconomic impact, and policy issues. Retrieved from https://www.elibrary.imf.org/view/journals/087/2020/011/article-A001-en.xml
- Chi-Wei, S., Ke Dai, S. U., & Zubaria, A. (2021). Covid-19 pandemic and unemployment dynamics in European economies. Economic Research-Ekonomska Istraživanja, 35(1), 1752–1764. https://doi.org/10.1080/1331677X.2021.1912627
- Danbatta, S., & Varol, A. (2021). Modeling and forecasting of tourism time series data using ANN-Fourier series model and Monte Carlo Simulation [Paper presentation]. 9th International Symposium on Digital Forensics and Security (ISDFS), 1–6. https://doi.org/10.1109/ISDFS52919.2021.9486325
- Dorobăţ, M., & Dobrescu, C. (2016). The anthropic impact in the North-Western Side of Leaota mountains. Journal of Current Trends in Natural Sciences, 5, 63–72. doi:[Google Scholar].
- Enders, W., & Lee, J. (2012). A unit root test using a Fourier series to approximate smooth breaks. Oxford Bulletin of Economics and Statistics, 74, 574–599. https://doi.org/10.1111/j.1468-0084.2011.00662.x
- Gallant, A. (1981). On the bias in flexible functional forms and an essentially unbiased form, The Fourier Flexible Form. Journal of Econometrics, 15, l–245. https://doi.org/10.1016/0304-4076(81)90115-9
- Ghalehkhondabi, I., Ardjmand, E., Young, W., & Weckman, G. (2019). A review of demand forecasting models and methodological developments within tourism and passenger transportation industry. Journal of Tourism Futures, 5(1), 75–93. https://doi.org/10.1108/JTF-10-2018-0061
- Goodrich, J. N. (2002). September 11, 2001, Attack on America: Impact on Tourism Security. Journal of Travel & Tourism Marketing, 11(4), 1–12. https://doi.org/10.1300/J073v11n04_01
- Gössling, S., Scott, D., & Hall, M. C. (2021). Pandemics, tourism and global change: a rapid assessment. Journal of Sustainable Tourism, 29(1), 1–20. https://doi.org/10.1080/09669582.2020.1758708
- Gujarati, D. (2004). Basic econometric 4. McGraw-Hill Companies, Inc.
- Höpken, W., Eberle, T., Fuchs, M., & Lexhagen, M. (2021). Improving tourist arrival prediction: a big data and artificial neural network approach. Journal of Travel Research, 60(5), 998–1017. https://doi.org/10.1177/0047287520921244
- Ioan, C. A., & Ioan, G. (2011). The analysis of the evolution of the gross domestic product by means of Fourier development. Acta Universitatis Danubius. Œconomica, 7(4), 146–161.
- Ioan, C. A., & Ioan, G. (2019). An equilibrium model with applications for the European Union countries. Economic development models of emerging countries. http://evidentacercetare.univ-danubius.ro/Surse/Set_014/PsI4n6QpHA.pdf
- Isaic-Maniu, A., Mitrut, C., & Voineagu, V. (2004). Statistică/Statistics. Ed. Universala.
- Islam, M., Akhtar, A., Munira, S., Khan, S., & Murshed, M. (2018). Optimized Dickey-Fuller test refines sign and boundary problems compare to traditional Dickey-Fuller test. International Journal of Statistics and Probability, 7(5). https://doi.org/10.5539/ijsp.v7n5p19
- Ivanova, M., Krasimirov Ivanov, I., & Ivanov, S. (2021). Travel behaviour after the pandemic: the case of Bulgaria. Anatolia, 32(1), 1–11. https://doi.org/10.1080/13032917.2020.1818267
- Jiao, X., Chen, J. L., & Li, G. (2021). Forecasting tourism demand: Developing a general nesting spatiotemporal model. Annals of Tourism Research, 90, 103277. https://doi.org/10.1016/j.annals.2021.103277
- Killick, R., Knight, M. I., Nason, G. P., & Eckley, I. A. (2020). The local partial autocorrelation function and some applications. Electronic Journal of Statistics, 14(2), 3268–3314. https://doi.org/10.1214/20-EJS1748
- Kovačević, D. (2020). Economic impact of Covid-19 on the European tourism sector with special view on Croatian tourism management board. Modern Economy, 11, 1652–1670. https://doi.org/10.4236/me.2020.1110115
- Marcu, S. (2021). Towards sustainable mobility? The influence of the covid-19 pandemic on Romanian mobile citizens in Spain. Sustainability, 13(7), 1–18. https://doi.org/10.3390/su13074023
- McKercher, B., & Chon, K. (2004). The over‐reaction to SARS and the collapse of Asian tourism. Annals of Tourism Research, 31(3), 716–719. [PMC free article] [PubMed] https://doi.org/10.1016/j.annals.2003.11.002
- Nistoreanu, P., & Aluculesei, A.-C. (2021). Can Spa tourism enhance water resources and turn them into a national brand? A theoretical review about the Romanian case. Information, 12(7), 270. https://doi.org/10.3390/info12070270
- Panasiuk, A., & Wszendybył-Skulska, E. (2021). Social aspects of tourism policy in the European union. The example of Poland and Slovakia. Economies, 9(1), 16. https://doi.org/10.3390/economies9010016
- Pata, U. (2020). How is Covid-19 affecting environmental pollution in US cities? Evidence from asymmetric Fourier causality test. Air Quality, Atmosphere, & Health, 13(10), 1149–1155. https://doi.org/10.1007/s11869-020-00877-9
- Payne, J., Gil-Alana, L., & Mervar, A. (2021). Persistence in Croatian tourism: The impact of Covid-19. Tourism Economics. https://doi.org/10.1177/1354816621999969
- Rasool, H. M. (2021). The relationship between tourism and economic growth among BRICS countries: a panel cointegration analysis. Future Business Journal, 7(1). https://doi.org/10.1186/s43093-020-00048-3
- Rodrigues, P. M., & Robert, T. A. (2012). The flexible Fourier form and local generalized least squares de-trended unit root tests. Oxford Bulletin of Economics and Statistics, 74(5), 736–759. https://doi.org/10.1111/j.1468-0084.2011.00665.x
- Schmude, J., Karl, M., & Weber, F. (2020). Tourism and Terrorism: Economic impact of terrorist attacks on the tourism industry. The example of the destination of Paris. Zeitschrift Für Wirtschaftsgeographie, 64(2), 88–102. https://doi.org/10.1515/zfw-2019-0015
- Shu, M., & Hung, W. (2014). Forecasting with Fourier residual modified ARIMA model-An empirical case of inbound tourism demand in New Zealand. 2014 WSEAS Transactions on Mathematics.
- Šulc, I., & Fuerst-Bjeliš, B. (2021). Changes of tourism trajectories in (post)covidian world: Croatian perspectives. Research in Globalization. 3 https://doi.org/10.1016/j.resglo.2021.100052
- Şuşu, Ş., & Leuciuc, E.-G. (2018). Romanian pharmaceutical sector -Between challenges, opportunities and market threats. Legal aspects of the trading of listed companies. LUMEN Proceedings, 6(1), 83–89. https://doi.org/10.18662/lumproc.64
- Szentesi, S., Cuc, L., Feher, A., & Cuc, P. (2021). Does Covid-19 affect safety and security perception in the hospitality industry? A Romanian case study. Sustainability, 13. https://doi.org/10.3390/su132011388
- Turcu-Stiolica, A., Bogdan, M., Subtirelu, M.-S., Meca, A.-D., Taerel, A.-E., Iaru, I., & Petrova, G. (2021). Influence of Covid-19 on health-related quality of life and the perception of being vaccinated to prevent Covid-19: An approach for community pharmacists from Romania and Bulgaria. Journal of Clinical Medicine, 10(4), 864. https://doi.org/10.3390/jcm10040864
- UNWTO. (2013). Economic crisis, international tourism decline and its impact on the poor world. Tourism Organization and International Labour Organization. https://doi.org/10.18111/978928441444
- UNWTO. (2021). Covid-19 and tourism in 2020. https://www.unwto.org/Covid-19-and-tourism-2020
- Vogelsang, T. &. (2013). A fixed-b perspective on the Phillips–Perron unit root tests. Econometric Theory, 29(3), 609–628. https://doi.org/10.1017/S0266466612000485
- Vucenovic, D., Klimoska, A. M., & Manestar, D. (2020). Do tourist percept Croatia as a safe tourist destination? Presentation of the empirical evidence. UTMS Journal of Economics, 11(1), 80–92.
- World Travel & Tourism Council. (2020). Travel & Tourism Global Economic Impact & Trends. London: World Travel & Tourism Council.
- World Travel & Tourism Council Travel. (2021). Tourism Economic Impact—World Travel & Tourism Council (WTTC). London, UK: WTTC.
- YiFei, L., & Han, C. (2018). Prediction for tourism flow based on LSTM neural network. Procedia Computer Science, 129, 277–283. https://doi.org/10.1016/j.procs.2018.03.076
- Ying, L., Yung-Ho, C., Yushan, L., & Tai-Yu, L.-N. (2021). The influence of the internet on catering and accommodation industry efficiency. Economic Research-Ekonomska Istraživanja. https://doi.org/10.1080/1331677X.2021.1952087
- Yustisia, K., Pramono, R., & Reagan, B. (2021). Adaptation strategy of tourism industry stakeholders during the Covid-19 pandemic: A case study in Indonesia. The Journal of Asian Finance, Economics and Business, 8(4), 213–223. https://doi.org/10.13106/JAFEB.2021.VOL8.NO4.0213
- Zhang, W.-W., Dawei, W., Majeed, M. T., & Sohail, S. (2021). Covid-19 and international trade: insights and policy challenges in China and USA. Economic Research-Ekonomska Istraživanja. https://doi.org/10.1080/1331677X.2021.1930091