
 ?Mathematical formulae have been encoded as MathML and are displayed in this HTML version using MathJax in order to improve their display. Uncheck the box to turn MathJax off. This feature requires Javascript. Click on a formula to zoom.
Abstract
The emphasis of current study is on the assessment of households’ willingness to pay (WTP) and preference heterogeneity for the upgradation of degraded terrestrial and aquatic ecosystem services across sub-basins of Heihe River. A sum of 1679 households were interviewed through choice experiment, and random parameter logit model is applied for welfare estimation. The estimated results signified the importance of selected terrestrial and aquatic ecological attributes. Sampled respondents of upper and middle basins placed highest WTP for reducing the emission of greenhouse gases among all other attributes and the WTP amount was 99.27 and 66.49 Yuan/Year respectively. Whereas in lower basin, improvement in landscape of farmland was highly valued, i.e., 107 Yuan/Year. In terrestrial ecosystem services the lowest WTP was recorded for Ejinaqi oasis size in all sub basins. In aquatic ecosystem services, improving water quality was the most valued attribute in all sub basins, and the corresponding WTP values are 122.81, 99.87 and 177.43 Yuan/Year in upper, middle and lower basins respectively, which ensure the significance of water quality in the entire basin. In aquatic ecosystem services the lowest WTP amount was recorded for leisure and entertainment conditions in each sub basin.
JEL CODES:
1. Introduction
The ecosystem services, that pertain the benefits to society and households from the natural ecosystem, are a vital notion to improve ecosystem conservation. Therefore, the conservation of ecosystem’s quality is significant for the healthy ecosystem services (Assessment, Citation2005). However, human activities caused serious land cover variations, which are projected to occur up to half of the surface of the earth, and endangered two-third of the planet’s ecosystems, some of which are irreparable (Han et al., Citation2020). Undoubtedly, the rising population and economic development will create considerable environmental degradation in the future (Pham et al., Citation2020). The imbalance between environmental conservation and societal development has always been a blockage to the global development. To rectify and get rid of this problem, the General Assembly of United Nation agreed the 2030 Sustainable Development Agenda, which intends to attain sustainable growth through the Sustainable Development Goals (SDGs), that take into account the environmental, social and economic aspects (Desa, Citation2016). The conservation of ecosystems and to minimize degradation, in the fifteenth goal of the Sustainable Development Goals, has also focused on the need to keep harmony between humanity and ecosystem services to achieve sustainable state (Han et al., Citation2020). With the deployment of Sustainable Development Goals, the evaluation of the environmental impacts caused by anthropogenic activities and mitigate the detrimental impacts on the ecosystems has increasingly become an important consideration for policy makers across the globe.
The ecosystems have been researched at different scales of global, national, regional and watershed levels, involving a wide range of areas, such as wetland areas of lakes and coastline as well as rapidly growing urban areas (Ali et al., Citation2022; Song & Deng, Citation2015). The river basins are the rich sources for the provision of numerous ecosystems that provide a wide range of economic welfares, along with products consisting of timberland, therapeutic plants and fuel-wood, as well as they offer niches for wild-life and procreating grounds. The ongoing anthropogenic activities will cause significant degradation in these estuaries, which may either cause the complete loss of these ecosystems or will affect the associated benefits with them (Jadhav et al., Citation2017). The destruction posed by human activities to rivers has been endorsed globally, as mostly rivers of the biosphere have almost demolished or altered (Mauerhofer et al., Citation2018), and thus it become under consideration globally as one of the red-hot issue. The disturbance of river ecosystem services is due to human activities like industrial development, residential encroachment, and the irrigation of farm-lands, whereas, the excessive exploitation of the river ecosystems has become the reason of pressure on ecosystem services (Grizzetti et al., Citation2016). The imposition of certain restoration strategies for the achievement of environmental goals are expected to offer substantial ecological benefits.
Recent urbanization and population growth have raised the financial burden on the overall ecosystem, causing both regional and global ecosystems to steadily deteriorate. This, in particular, leads to water pollution and shortages, which pose serious threats to the survival of mankind. According to some relevant and available studies (Feoli et al., Citation2002; Shu et al., Citation1998), argues that, due to the vulnerable climate, the future economic and environmental degradation would lead to serious damage to the worldwide ecological sustainability, specifically in the arid and semi-arid territories. Correspondingly, the inland river i.e. Heihe River Basin has encountered the significant problems of ecological failure in the arid region (north-western part of China) due to the rapid industrialization and rise in urbanization (Qi & Luo, Citation2007).
Since few decades, the ecological environment of Heihe River Basin has been continuously challenged by the issues of water scarcity and water pollution, which have led to a decline in ecosystem functions (Chen et al., Citation2016). The upper basin of the river is confronted with severe threat of grassland degradation and desertification as well as the propagation of harmful weeds. The middle basin of the river is plagued by water pollution, desertification and land salinity. While, the lower basin is confronted by 4 key environmental challenges, including the rising tendency in the sand resource, depletion of eastern Lake (Juyan Lake), decline in the oasis region, and the growing desertification. The lower basin is the most vulnerable environmental area of the entire river basin.
The evaluation of ecosystems is crucial in order to ensure and maintain the long-run potential of ecosystem services (Zhang et al., Citation2018). The payment assessments for ecosystems, especially in the domain of ecological and natural resource economics have been the emphasis of economists in recent years (Bartczak & Metelska-Szaniawska, Citation2015). In order to bring restoration in the deteriorated ecosystems, valuation of ecosystem services and the public perception towards the restoration can be achieved through several approaches (Nicosia et al., Citation2014). The estimation of public willingness to pay can be achieved through the analysis of revealed preference approach by calculating the amount paid by people for the consumption of a specific resource (Carr & Mendelsohn, Citation2003). Similarly, Loomis et al. (Citation2000) stated that public willingness to pay can be attained by means of direct or indirect surveys through the analysis of stated preferences.
Choice experiment technique, which is one of the stated preference approach, and a renowned mechanism in the arena of environmental economics, having the potential to obtain information about public willingness to pay (Hanley et al., Citation1998). Alike to contingent valuation approach, which is also a stated preference approach, choice experiment uses surveys in order to attain value statement, and public willingness to pay, while, due to the high potential of assessment for many ecosystems, choice experiment has become more recognized and gaining consideration (Cerda et al., Citation2013). Usually, many researchers have employed choice experiment in their specified domains, like assessment of natural resources and marketing, where emphasis was focused on the estimation of spatial practices (Mazur & Bennett, Citation2008). Whereas, space heterogeneity has captured the attention of many researchers in the assessment of environmental valuation. Similarly, the studies of Liu and Huang (Citation2017) and Zhou et al. (Citation2015) endorsed that spatial heterogeneity is present among different ecological attributes, offered by natural resources across the various locations of China, and also variations are recorded in the qualities and types of these ecosystems throughout landscape. Therefore, spatial heterogeneity has an impact on the public willingness to pay for these ecosystems.
The expeditious industrial development has drastically altered the appearance of Heihe River Basin. According to Chen et al. (Citation2016), it is stated that effect of urbanization and human activities on river ecosystem services is significant, and also posing a serious threat to the structures of river networks. Therefore, the research on improving river ecosystems is crucial, and to review the policies to ensure the viable management of the deteriorated ecological conditions is significant. This study is based on the valuation of 6 terrestrial and 5 aquatic river ecosystem services by emphasising the variations among their valuation, and the spatial preferences of upper basin, middle basin, and lower basin households of Heihe River Basin.
2. Research methods
2.1. Background of study site
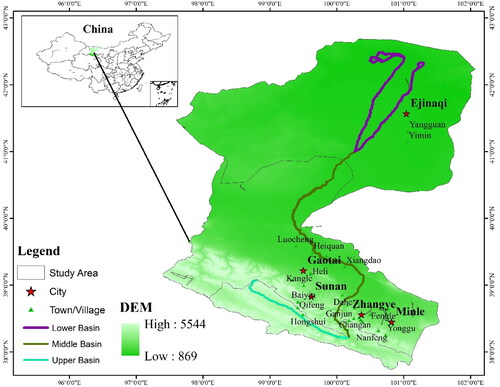
Heihe River Basin (98°–101°30′ E, 37° 50′–42°_40′ N) , originating from the Qilian mountains in Gansu province of China in north, while in south, it is heading towards Inner Mongolia. The total area under Heihe River Basin, which is the China’s second largest inland river, is 128,000 Km2 (Qi & Luo, Citation2007), whereas, the approximate length and catchment area is 821 Km2, and 14.2 × 10⁴ Km2, respectively (Chen et al., Citation2016). The location of this river basin is central Hexi corridor, which is an arid zone facing a serious problem of water scarcity. Similarly, the South and West sides geography is higher as compared to the North and East sides, which is having a lower geography. The variations in elevation provoked climatic conditions, and environmental landscape has apparently vertical zonation law (Wu et al., Citation2015). According to Wu et al. (Citation2014), it is evident that producing plenty of sunshine and strengthening the air, are created by dry and the arid climatic condition, however, due to the distinctive geographical position, there are high variations in the temperature of day and night. Moreover, the temperature and seasonal rainfall vary considerably, such as, during rainy season it receives abundant rainfall, whereas there is lack of precipitation in spring. Among the three sub basins of Heihe River, the upper basin (Qilian mountains) has the annual rainfall between 300-500 mm, while the annual precipitation in middle basin, which is the Hexi Corridor, is 100-250 mm, but the lower basin (Ejinaqi oasis) receives a precipitation lower than 45 mm annually (Z. Li et al., Citation2015).
Figure 1. Heihe River Basin (Arc GIS 10.3).
Source: Created by author.
2.2. Description of survey and data collection
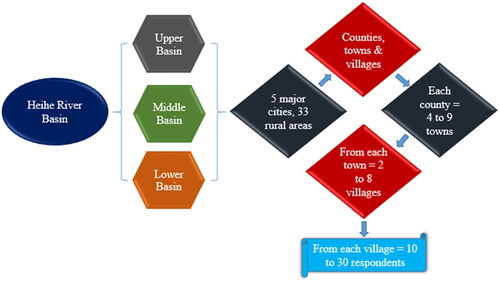
This segment discusses the survey method used to range the entire sampled respondents, in order to collect data on the improvement of existing state of Heihe River Basin’s environmental conditions. A comprehensive survey was carried out in 3 different sub basins, involving 5 main cities, and the adjoining rural population, through a pre-tested and a well-structured questionnaire for data collection. Based on the current executive division, the 3 sub basins were acknowledged, in which Sunnan was selected in the region of upper sub basin, while from the region of middle sub basin, Minle, Zhangye, and Gaotai were nominated. Similarly, from the region of lower sub basin, Ejinaqi was finalized. Due to the fact of reflecting the existing economic and ecological characteristics of the stated cities, the adjacent rural population/areas were taken under consideration. Furthermore, the nomination of the corresponding towns and villages were done by approach of stratified random sampling, and through this technique, a random selection of 3 to 8 towns from the respective county, and a random selection of 2 to 7 villages from every corresponding town were done. Finally, a sum of 10 to 30 households was selected through the approach of proportional allocation from every selected village. The graphical representation of the survey is illustrated in the following . A data of 1679 households was gathered from 3 sub basins (upper, middle and lower sub basins), including 5 major cities as well as 33 adjacent rural populations/areas, in which 201 households were from Sunnan, i.e., from upper sub basin, 280, 695, and 304 were from Minle, Zhangye, and Gaotai respectively, which is middle sub basin. Whereas, from lower sub basin, i.e., Ejinaqi region, a sum of 199 households were selected. Through the application of proportional allocation, and based on some earlier research work of I. Khan et al. (Citation2018) and Kosenius and Markku (Citation2015), it is stated that present sample size for representing the target region is enough.
Figure 2. Graphical representation of survey.
Source: Created by author.
The purpose of preliminary consultations with regulatory authorities and households about environment, was to provide an appropriate and practical picture of the problems under assessment. Primarily, through the pilot survey from 70 households of the study area, pertinent environmental (aquatic and terrestrial) attributes, and their related levels were identified. This survey helped the households to perceive the prevailing status and issues regarding ecosystem services, while the discussion with local authorities and thorough review of earlier research work have made some significant addition. Whereas, the different levels for payment were determined based on the local economic status and by following respective research work (S. U. Khan et al., Citation2019).
The nomination and inclusion of different ecosystem services and their corresponding levels in this study of choice experiment were done on the basis of some past studies like (Ali et al., Citation2020; S. U. Khan et al., Citation2020), and through comprehensive consultations with the local authorities, and finally came up with six terrestrial attributes and five aquatic attributes. The six terrestrial ecological attributes are yield of cultivated land (X1), quality of agriculture production (X2), oasis size in Ejinaqi region (X3), improvement of biodiversity (X4), reducing the emission of greenhouse gases (X5) and improvement in landscape of farmland (X6) with attribute of payment. Similarly, the five aquatic related ecological attributes that were selected are improving water quality (X1), irrigation of farm land (X2), reduction in sandstorms days annually (X3), area under East Juyan Lake (X4) and upgradation in leisure and entertainment conditions (X5) along with payment attribute, while status quo and 2 alternate policy programs are presented in Supplementary Tables 1 and 2.
Table 1. Random parameter logit results for terrestrial attributes.
Table 2. Random parameter logit results for aquatic attributes.
In the studies of choice experiment, where enclosure of status quo is a common feature, that can be prioritized by respondents over any expected change in attribute’s level. It was essential to include status quo in choice set, as welfare estimates might be unreliable, as well as biased with demand theory without its existence (Barreiro-Hurle et al., Citation2018). Based on the morphological and geographical position of river as well as the different seasons etc., that bring variations in the river attributes and their corresponding levels, therefore, it’s tough to define the status quo in the studies about water quality, and to summarize the existing variable module into solitary fixed state, it may be too restrictive. Furthermore, Konishi and Coggins (Citation2008) stated that heterogeneous nature and low education of the respondents as well as their vision of status quo is less or less realistic. This diversion could lead to a reduction in accuracy of welfare estimates.
The selection of multiple choice options was given to the respondents (Supplementary Tables 1 and 2), where each alternative containing a set of ecological attributes, and their associated levels which reflect the outcome of the policy, along with status quo that represent the current conditions with zero payment. A sum of 60 choice sets was developed through the implementation of D efficiency design and Ngene software 1.1.1 that were separated in twenty blocks, whereas error D is 0.006939, while error A is 1.420521. Hence, a set of three questions (choice sets) was enquired from every respondent to answer.
2.3. The choice experiment and econometric specification
The individual’s preferences for restoration of degraded ecosystems, and to get the degraded ecosystems in refined form by 2025 in Heihe river basin, were presumed by applying choice experiment technique. Choice experiment is a stated preference technique that accounts for the estimation of individual’s preferences for assessing non-marketable commodities and services through a hypothetical market, where they are acquired to choose the most favoured choice set amongst the offered available choice sets/options. Following the study of Lancaster (Citation1966), that on the basis of Lancaster’s consumer theory, choice experiment put forward characteristic theory of value by revealing that utility derived from the consumption of a good is the utility associated with the characteristics of that specific good rather than the good itself. Usually in the choice experiment studies, where hypothetical choice sets are offered to the individuals, in which they compared the associated payments with every choice set for the upgradation of degraded ecosystem services that will be collected from the individual’s and the alternate conditions of the ecosystem services.
The idea of choice experiment technique is based on the definition of any good or service should be in the context of its attributes and their related levels (Bateman et al., Citation2002). This technique was first utilized by Adamowicz et al. (Citation1994) in the field of environment to encounter the ecological problems, and then this technique has become the most preferred stated preference technique for ecological assessment, especially in the field of ecosystem services.
According to Louviere (Citation2001), choice experiment that is utilized in assessment of ecological and non-marketable goods and services works on explicit utility theory, which is usually established on random utility maximization, in which on the bases of maximum utility U, an individual selects the alternate J in every task. The ith individual derived Uij utility from incurring the alternative j comprise of 2 parts, such as, the observable deterministic component, while the second one is unobservable and random stochastic component. Mathematically, this function is illustrated below:
(1)
(1)
Where:
Xi in the Equationequation 1(1)
(1) , demonstrates the socio-economic characteristics of ith individual, while the alternate j attributes are represented by Zij. The response of the people might be different for the Zij attributes, and fluctuate along with choices/alternatives having numerous levels of the attribute, however, Xi remains consistent for an individual upon alternatives. Based on the derivation of high satisfaction, and maximum yielding utility, an ith individual inclines towards the selection of alternative j upon k such as j > Uik.
(2)
(2)
Where:
J in the Equationequation 2(2)
(2) , represents the whole set which includes entire alternatives for every choice set. The distribution of error term in the estimation of Equationequation 2
(2)
(2) is assumed to be random and normal distribution.
2.4. Random parameter logit model
The random parameter logit model has the potential to lessen the 3 assumptions of conditional logit model. Conditional logit model presumes that preferences of an individual relay on the observed factors, but mixed logit model presumes that unobserved characteristics have also an impact on these preferences. There is much flexibility in the mixed logit model, which permits for the correlation in unobserved characteristics, substitution, and the heterogeneity in preferences. Moreover, the heterogeneity in preferences can be verified through the specific characteristics of the respondent (Cn), along with the alternative specific constant (ASCj), or with the (xnjk) attributes, with (γnk) and (εnj) as the related constants (Bennett & Blamey, Citation2001; Train, Citation2009). In mixed logit model, for accounting the heterogeneity and autocorrelation, there is one additional factor that is ηij, while the identical and independent distribution with type 1 extreme value is denoted by (εij). Mathematically, utility function in mixed logit model can be illustrated as:
(3)
(3)
2.5. Estimation of marginal willingness to pay
The assessment of implicit price/marginal willingness to pay of attributes is done from utilization of calculated coefficients (β). While keeping other factors constant, and for any attribute the marginal willingness to pay is the inverse ratio between parameter
and price parameter
The mathematical representation of the marginal willingness to pay function can be illustrated as:
(4)
(4)
In the above mentioned Equationequation (4)(4)
(4) , the coefficients for attribute k, and for the marginal utility of income are denoted by
and
respectively, in which the coefficient for income’s marginal utility is often supposed as calculated coefficient for cost (Upton et al., Citation2012). Hence, Monte Carlo simulation approach which was presented by Krinsky and Robb (Citation1986), was utilized for generating the confidence interval of 95%, in order to estimate the marginal willingness to pay (Sælen & Ericson, Citation2013; Upton et al., Citation2012).
2.6. Data screening and coefficient distribution
Follow-up queries were carried out prior to analyse the welfare estimates, where the data (questionnaires) demonstrating actual zero willingness were separated, and then excluded from the final figure. Following this procedure, we came up with 1619 final questionnaires for the welfare assessment, while 60 questionnaires have been removed, that were 3% of entire questionnaires. The estimation of random parameter model or mixed logit model was done by implementing the econometric software STATA. Both the explained and explanatory variables, all selected ecological (aquatic and terrestrial) attributes, and payment were allotted linear coding, while choice and alternative specific constant (ASC) have dummy coding (Supplementary Table 3). Random normal distribution was allocated to all selected ecological (aquatic and terrestrial) ecosystems/attributes, while to ASC as well as to monetary attribute, a non-random distribution was assigned. Keeping the price coefficient constant is to reduce instability of mixed logit model, because Ruud (Citation1996) stated that random parameter model will face instability if the variation is permitted in the distribution of all coefficients.
Table 3. Mean willingness to pay results for terrestrial attributes.
3. Results and discussion
3.1. Socioeconomic status
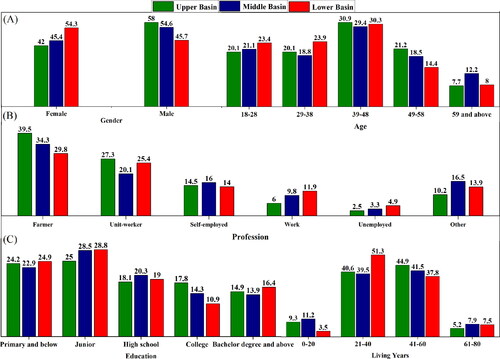
The following portrayed the socioeconomic status of the selected respondents of study area. , expressed the gender and age of the selected respondents in all basins, where in gender section, the total number of female representatives are 42%, 45.4%, and 54.3% in upper, middle and lower basin, respectively. While, the total number of male representatives are 58%, 54.6%, and 45.7%, respectively. Similarly, the age of respondents in , represents that maximum respondents are under the age group of 39-48. While, lesser number of respondents is fall in the age group 59 and above. Moreover, profession of the selected respondents is expressed in , i.e., the profession of respondents showed that maximum number of respondents is farmers in the study area, while lower number of respondents is fall under the group of unemployed. Similarly, education and living years of the respondents are defined in the . The education scenario of respondents showed that the maximum respondents have junior level of education. Whereas, the bachelor degree and above represents the high level of education of the selected respondents in study area. At the same time, living years of the respondents are categorized in 4 different groups, which represents the different levels of respondents, that from how long they are living in the study area. Majority of the sampled respondents fall in the 21–40 and 41–60 groups.
Figure 3. Socioeconomic status of selected respondents.
Source: Created by author.
3.2. Welfare estimation
The results obtained for the terrestrial ecological attributes from the implementation of random parameter logit model, are demonstrated in . Which depicts that entire coefficients for the selected attributes along with payment and ASC are significant statistically, across all sub basins and adjoining rural population/areas, except X3 attribute which represent oasis, in upper and lower basin. Whereas, the negative but significant coefficient for payment denotes that public satisfaction/utility have an inverse relation with an increase in price. Similarly, the respondents’ satisfaction from the improvements of selected ecological attributes is determined by the significant coefficient of ASC, which is related to the selection of alternative options rather than selection of status quo (Brouwer et al., Citation2016). The estimated statistically significant (1% and 5% significance level) results for all selected attributes except X3 in upper and lower basin demonstrated that sampled respondents have demand for improved ecosystem services, and they are willing to pay for restoration of nominated terrestrial ecological attributes. Whereas, significant coefficients for SD (standard deviation) of mean for entire attributes, which is represented in the second part of , depicts the impression of preference heterogeneity for the nominated attributes throughout Heihe River Basin. Using the low quality water for irrigation to boost agricultural output may have a detrimental effect on ecosystem services, regardless of the fact that in recent decades, when valuing viable production, irrigation water quality has become one of the most crucial environmental aspect (Singh, Citation2015).
depicts the research outcomes for aquatic related ecological attributes that are obtained by applying random parameter logit model. It is evident from the results that the coefficients of selected all aquatic ecological attributes are significant at 1% and 5% significance level, while the coefficient of X3 is significant at 10% in the middle basin. Similarly, the coefficients for attributes of payment and ASC are significant, and having the expected negative signs for both attributes, i.e., the negative coefficient for payment showing the sampled respondents’ willingness to pay for restoring ecosystem services become decline as the price goes up, and are in line with economic theory (Perni & Martínez-Paz, Citation2017). While the respondents’ willingness for restoration of current degraded aquatic ecological attributes is proved from the significant coefficient of ASC. The findings of our current study are parallel with research findings of some previous studies, e.g., (Czajkowski et al., Citation2017; S. U. Khan et al., Citation2020). Whereas, preference heterogeneity for entire nominated aquatic attributes across the river basin is proved from the significant outcomes at lower portion of .
Ecosystem is the basis of human’s survival, growth, and socioeconomic development, while the drastically progress in world’s economy, and the development of industries along with the pressure posed by humans have exacerbated water scarcity and severely threatened the water ecological balance (Ren et al., Citation2020). For viable economic growth and improved biodiversity, healthy river ecosystems are of prime importance to be under consideration. However, the climatic changes, anthropogenic activities, and worldwide population growth might alter the river ecosystems, which are directed towards the deterioration of river water quality, declining biodiversity, and effecting the water habitat (Dudgeon, Citation2014; Reid et al., Citation2019). Hence, the better understanding for viable management of ecosystems is necessary about basic functions and procedures of river ecosystems, that how they react to the natural and human induced variations.
The anthropogenic activities such as urbanization, extensive irrigation, and economic growth have put the river ecosystem, and its services and benefits for the society in risk on a global scale. Similarly, this economic and population growth, urbanization, and an ever-increasing need for water have put more stress on the inland rivers, impacting their ecological status. As a result, the increasing anxiety about river’s health, and the detrimental impact on its status, have led the upgradation of current river ecosystems extremely important. Whereas, the studies of Bateman et al. (Citation2006) and Brouwer (Citation2008) endorsed that the introduction of certain upgradation strategies are projected to have important, and positive consequences in the light of environmental objectives.
3.3. Estimation of public willingness to pay
The ecosystems valuation could be attained through household’s willingness to pay. In contrast, the amounts of willingness to pay are different among households, and having no consistency among them (Higgins et al., Citation2020). In this paper, and are illustrating and identifying the mean, and upper as well as lower limits (95 percent confidence interval) of the willingness to pay attained through Krinsky-Robb technique (500 Halton draws) for terrestrial ecological attributes of the sampled respondents in Heihe River Basin. Among all the chosen attributes, people willingness is different due to their taste and preferences (J. Li et al., Citation2020), like in upper and middle basins the highest willingness to pay was noticed for X5 like 99.27 Yuan, 66.49 Yuan per year, respectively. While in lower basin the high amount of willingness to pay was noticed for X6 i.e. 107.00 Yuan per year. Similarly, the selected respondents paid attention for the upgradation of X3 attribute, but they showed the lowest willingness to pay for it, i.e. 0.01 Yuan per year (upper basin), 0.03 Yuan per year (middle basin), and 0.02 Yuan per year (lower basin). The respondents from all three basins of study area showed their attention, and willingness to restore the selected terrestrial ecological attributes, which is validated by current results. The public attitude and willingness to pay for the restoration of deteriorated attributes, endorsed their importance (F. Li et al., Citation2013). The presence of spatial heterogeneity in a certain area is validated by various amounts of willingness to pay for the restoration of degraded ecosystem services (A. Khan et al., Citation2022). Hence, in order to avoid serious estimation bias in the evaluation of public willingness to pay, it is necessary to include spatial features (Ren et al., Citation2020). Similarly, the preference heterogeneity might be the reason of individuals’ location in the assessment of their willingness to pay (Aregay et al., Citation2016).
Figure 4. Depiction of mean, upper, and lower willingness to pay for terrestrial ecosystems in upper, middle and lower basins.
Source: Created by author.
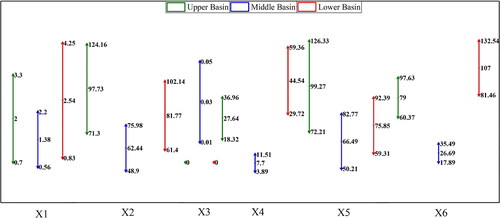
In order to improve the aquatic attributes, mean willingness to pay of selected households, and upper and lower limits (95 percent confidence interval) of the willingness to pay is attained through Krinsky-Robb technique (500 Halton draws) from Heihe River Basin, is demonstrated in and . The respondents from different places and communities are valuing ecological services in different ways (Rolfe et al., Citation2000). Willingness to pay for X1, showed that X1 is highly preferred attribute among all selected aquatic attributes throughout whole river basin, i.e., 122.81 Yuan per year, 99.87 Yuan per year, and 177.43 Yuan per year from upper, middle and lower basins, respectively. It has also been evident from earlier study conducted by S. U. Khan et al. (Citation2022), that river water quality is highly preferred, and an important ecological attribute among different ecosystem services in China. While studies of Dudgeon (Citation2014) and Reid et al. (Citation2019), discovered that deteriorating the water quality is deteriorating the environment. Similarly, the sampled respondents from all sub basins payed lower attention towards the improvement of X5, and recorded lowest willingness to pay, such as, 1.11 Yuan per year (upper basin), 0.97 Yuan per year (middle basin), and 1.49 Yuan per year (lower basin). The amount of willingness to pay for improving the deteriorated ecological attributes is different among individuals, because of comparative significance of attributes (I. Khan et al., Citation2018).
Figure 5. Depiction of mean, upper, and lower limits of willingness to pay for aquatic ecosystems in upper, middle and lower basins.
Source: Created by author.
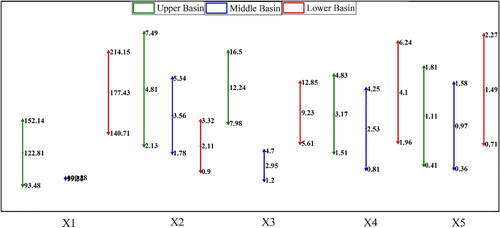
Table 4. Mean willingness to pay results for aquatic attributes.
4. Conclusion
An attempt was made in this study with key objectives of determining the public willingness for the upgradation of degraded terrestrial and aquatic ecological attributes, and to determine the existing spatial heterogeneity across Heihe River Basin. In order to determine preference heterogeneity, data was collected from three different sub basins comprising of 5 major cities and 33 villages through choice experiment. According to current results, public concern regarding upgradation of selected terrestrial and aquatic ecological attributes and their significance is validated, while different location of household’s induced different values for improving the degraded attributes. Results depicted that households of each sub basin are willing to pay for bringing upgradation in selected terrestrial attributes, and they favoured the alternatives as compared to the existing conditions i.e. status quo, such as households recorded high willingness for upgradation of X5 in upper and middle basins (99.27 Yuan/Year and 66.49 Yuan/Year) respectively, while in lower basin X6 was highly valued (107.00 Yuan/Year) by households. Similarly, the households showed their willingness to pay for improvement of X3, but they recorded a low willingness to pay for this attribute across whole basin, i.e., 0.01 Yuan/Year (upper basin), 0.03 Yuan/Year (middle basin) and 0.02 Yuan/Year (lower basin). Moreover, the households also favoured the alternatives as compared to status quo for upgradation of selected aquatic attributes. The selected households payed highest attention for the provision of X1 attribute in a good quality, such as 122.81 Yuan/Year (upper basin), 99.87 Yuan/Year (middle basin) and 177.43 Yuan/Year (lower basin), whereas households recorded a low willingness to pay of 1.11 Yuan/Year (upper basin), 0.97 Yuan/Year (middle basin), and 1.49 Yuan/Year (lower basin) for the provision of improved X5 attribute in aquatic ecological attributes.
Following the results of current study from which some basic policy suggestions have been endorsed for the management of Heihe River Basin, in connection with the implementation of certain policies for upgradation of selected terrestrial and aquatic attributes should be taken into account by Chinese government. The provision of such policies aims to conserve ecosystem services, their various functions, and maintaining them in a better way for future use. Similarly, the results approved some useful information about supervision, policy commendations and setting a goal for future research works for the improvement of existing river ecosystem services. Furthermore, the presence of preference heterogeneity among households across river basin based on their location should be taken under consideration, while making and implementing any policy for the conservation of ecosystem services and their various functions. So that welfare impressions can be accurately determined regarding different participants, and to decline the dispute of conservationists and local population.
Supplemental Material
Download MS Word (18.6 KB)Disclosure statement
No potential conflict of interest was reported by the authors.
Additional information
Funding
References
- Adamowicz, W., Louviere, J., & Williams, M. (1994). Combining revealed and stated preference methods for valuing environmental amenities. Journal of Environmental Economics and Management, 26(3), 271–292. https://doi.org/10.1006/jeem.1994.1017
- Ali, M. A. S., Khan, S. U., Khan, A., Khan, A. A., & Zhao, M. (2020). Ranking of ecosystem services on the basis of willingness to pay: Monetary assessment of a subset of ecosystem services in the Heihe River basin. Science of the Total Environment, 734, 139447. https://doi.org/10.1016/j.scitotenv.2020.139447
- Ali, M. A. S., Yi, L., Khan, S. U., Khan, A. A., Musa, M., & Yang, L. (2022). Quantifying the spatial preferences heterogeneity to upgrade the endemic ecological attributes for a cleaner environment: Evaluating the feasibility of benefit transfer among sub-basins of an inland river. Environmental Science and Pollution Research, 29(52), 79357–79374. https://doi.org/10.1007/s11356-022-21276-w
- Aregay, F. A., Yao, L., & Zhao, M. (2016). Spatial preference heterogeneity for integrated river basin management: the case of the Shiyang River basin, China. Sustainability, 8(10), 970. https://doi.org/10.3390/su8100970
- Assessment, M. E. (2005). Ecosystems and human well-being (Vol. 5). Island press.
- Barreiro-Hurle, J., Espinosa-Goded, M., Martinez-Paz, J. M., & Perni, A. (2018). Choosing not to choose: A meta-analysis of status quo effects in environmental valuations using choice experiments. Economía Agraria y Recursos Naturales, 18(1), 79–109. https://doi.org/10.7201/earn.2018.01.04
- Bartczak, A., & Metelska-Szaniawska, K. (2015). Should we pay, and to whom, for biodiversity enhancement in private forests? An empirical study of attitudes towards payments for forest ecosystem services in Poland. Land Use Policy, 48, 261–269. https://doi.org/10.1016/j.landusepol.2015.05.027
- Bateman, I. J., Carson, R. T., Day, B., Hanemann, M., Hanley, N., Hett, T., Jones-Lee, M., Loomes, G., Mourato, S., & Pearce, D. W. (2002). Economic valuation with stated preference techniques: a manual. Economic valuation with stated preference techniques: a manual. https://www.e-elgar.com/shop/gbp/economic-valuation-with-stated-preference-techniques-9781843768524.html
- Bateman, I. J., Day, B. H., Georgiou, S., & Lake, I. (2006). The aggregation of environmental benefit values: welfare measures, distance decay and total WTP. Ecological Economics, 60(2), 450–460. https://doi.org/10.1016/j.ecolecon.2006.04.003
- Bennett, J., & Blamey, R. (2001). The choice modelling approach to environmental valuation. Edward Elgar Publishing.
- Brouwer, R. (2008). The potential role of stated preference methods in the Water Framework Directive to assess disproportionate costs. Journal of Environmental Planning and Management, 51(5), 597–614. https://doi.org/10.1080/09640560802207860
- Brouwer, R., Bliem, M., Getzner, M., Kerekes, S., Milton, S., Palarie, T., Szerényi, Z., Vadineanu, A., & Wagtendonk, A. (2016). Valuation and transferability of the non-market benefits of river restoration in the Danube river basin using a choice experiment. Ecological Engineering, 87, 20–29. https://doi.org/10.1016/j.ecoleng.2015.11.018
- Carr, L., & Mendelsohn, R. (2003). Valuing coral reefs: a travel cost analysis of the Great Barrier Reef. Ambio, 32(5), 353–357. https://doi.org/10.1579/0044-7447-32.5.353
- Cerda, C., Ponce, A., & Zappi, M. (2013). Using choice experiments to understand public demand for the conservation of nature: a case study in a protected area of Chile. Journal for Nature Conservation, 21(3), 143–153. https://doi.org/10.1016/j.jnc.2012.11.010
- Chen, D., Jin, G., Zhang, Q., Arowolo, A. O., & Li, Y. (2016). Water ecological function zoning in Heihe River basin, Northwest China. Physics and Chemistry of the Earth, Parts A/B/C, 96, 74–83. https://doi.org/10.1016/j.pce.2016.08.005
- Czajkowski, M., Budziński, W., Campbell, D., Giergiczny, M., & Hanley, N. (2017). Spatial heterogeneity of willingness to pay for forest management. Environmental and Resource Economics, 68(3), 705–727. https://doi.org/10.1007/s10640-016-0044-0
- Desa, U. (2016). Transforming our world: The 2030 agenda for sustainable development. https://stg-wedocs.unep.org/bitstream/handle/20.500.11822/11125/unepswiosm1inf7sdg.pdf?sequence=1
- Dudgeon, D. (2014). Accept no substitute: biodiversity matters. Aquatic Conservation: Marine and Freshwater Ecosystems, 24(4), 435–440. https://doi.org/10.1002/aqc.2485
- Feoli, E., Vuerich, L. G., & Zerihun, W. (2002). Evaluation of environmental degradation in northern Ethiopia using GIS to integrate vegetation, geomorphological, erosion and socio-economic factors. Agriculture, Ecosystems & Environment, 91(1–3), 313–325. https://doi.org/10.1016/S0167-8809(01)00236-5
- Grizzetti, B., Lanzanova, D., Liquete, C., Reynaud, A., & Cardoso, A. (2016). Assessing water ecosystem services for water resource management. Environmental Science & Policy, 61, 194–203. https://doi.org/10.1016/j.envsci.2016.04.008
- Han, R., Feng, C.-C., Xu, N., & Guo, L. (2020). Spatial heterogeneous relationship between ecosystem services and human disturbances: A case study in Chuandong, China. The Science of the Total Environment, 721, 137818. https://doi.org/10.1016/j.scitotenv.2020.137818
- Hanley, N., Wright, R. E., & Adamowicz, V. (1998). Using choice experiments to value the environment. Environmental and Resource Economics, 11(3/4), 413–428. https://doi.org/10.1023/A:1008287310583
- Higgins, K., Hutchinson, G., & Longo, A. (2020). Willingness-to-pay for eco-labelled forest products in Northern Ireland: An experimental auction approach. Journal of Behavioral and Experimental Economics, 87, 101572. https://doi.org/10.1016/j.socec.2020.101572
- Jadhav, A., Anderson, S., Dyer, M. J., & Sutton, P. C. (2017). Revisiting ecosystem services: Assessment and valuation as starting points for environmental politics. Sustainability, 9(10), 1755. https://doi.org/10.3390/su9101755
- Khan, A., Khan, S. U., Ali, M. A. S., Khan, A. A., & Zhao, M. (2022). Prioritizing stakeholders’ preferences for policy scenarios of vulnerable ecosystems with spatial heterogeneity in choice experiment: Coupling stated preferences with elevation. Journal of Environmental Management, 310, 114757. https://doi.org/10.1016/j.jenvman.2022.114757
- Khan, I., Zhao, M., Khan, S. U., Yao, L., Ullah, A., & Xu, T. (2018). Spatial heterogeneity of preferences for improvements in river basin ecosystem services and its validity for benefit transfer. Ecological Indicators, 93, 627–637. https://doi.org/10.1016/j.ecolind.2018.05.018
- Khan, S. U., Guo, X., Hu, J., Khan, A. A., Talpur, M. A., Liu, G., & Zhao, M. (2022). Who cares and how much? Narrative for advances in aquatic ecosystem services through non-market valuation with spatial dimensions using a discrete choice experiment. Journal of Cleaner Production, 337, 130603. https://doi.org/10.1016/j.jclepro.2022.130603
- Khan, S. U., Hayat, S., Xia, X., Liu, G., & Zhao, M. (2020). Improvisation of indigenous environmental benefit transfer and valuation for cleaner environment: Choice experiment across northwest China. Journal of Cleaner Production, 274, 123176. https://doi.org/10.1016/j.jclepro.2020.123176
- Khan, S. U., Khan, I., Zhao, M., Khan, A. A., & Ali, M. A. S. (2019). Valuation of ecosystem services using choice experiment with preference heterogeneity: a benefit transfer analysis across inland river basin. The Science of the Total Environment, 679, 126–135. https://doi.org/10.1016/j.scitotenv.2019.05.049
- Khan, S. U., Liu, G., Zhao, M., Chien, H., Lu, Q., Khan, A. A., Ali, M. A. S., & Misbahullah. (2020). Spatial prioritization of willingness to pay for ecosystem services. A novel notion of distance from origin’s impression. Environmental Science and Pollution Research International, 27(3), 3100–3112., https://doi.org/10.1007/s11356-019-06538-4
- Konishi, Y., & Coggins, J. S. (2008). Environmental risk and welfare valuation under imperfect information. Resource and Energy Economics, 30(2), 150–169. https://doi.org/10.1016/j.reseneeco.2007.05.002
- Kosenius, A.-K., & Markku, O. (2015). Ecosystem benefits from coastal habitats—A three-country choice experiment. Marine Policy, 58, 15–27. https://doi.org/10.1016/j.marpol.2015.03.032
- Krinsky, I., & Robb, A. L. (1986). On approximating the statistical properties of elasticities. The Review of Economics and Statistics, 68(4), 715–719. https://doi.org/10.2307/1924536
- Lancaster, K. J. (1966). A new approach to consumer theory. Journal of Political Economy, 74(2), 132–157. https://doi.org/10.1086/259131
- Li, F., Zhu, G., & Guo, C. (2013). Shiyang River ecosystem problems and countermeasures. Agricultural Sciences, 4(2), 72–78. https://doi.org/10.4236/as.2013.42012
- Li, J., Ren, L., & Sun, M. (2020). Is there a spatial heterogeneous effect of willingness to pay for ecological consumption? An environmental cognitive perspective. Journal of Cleaner Production, 245, 118259. https://doi.org/10.1016/j.jclepro.2019.118259
- Li, Z., Deng, X., Wu, F., & Hasan, S. S. (2015). Scenario analysis for water resources in response to land use change in the middle and upper reaches of the Heihe River Basin. Sustainability, 7(3), 3086–3108. https://doi.org/10.3390/su7033086
- Liu, Y., & Huang, Y. (2017). An analysis on spatial heterogeneity of ecosystem service function in agricultural mechanization. Journal of Agricultural Mech Res, 9, 259–263.
- Loomis, J., Kent, P., Strange, L., Fausch, K., & Covich, A. (2000). Measuring the total economic value of restoring ecosystem services in an impaired river basin: results from a contingent valuation survey. Ecological Economics, 33(1), 103–117. https://doi.org/10.1016/S0921-8009(99)00131-7
- Louviere, J. J. (2001). Choice experiments: an overview of concepts and issues. The Choice Modelling Approach to Environmental Valuation, 13(3.3).
- Mauerhofer, V., Ichinose, T., Blackwell, B. D., Willig, M. R., Flint, C. G., Krause, M., & Penker, M. (2018). Underuse of social-ecological systems: A research agenda for addressing challenges to biocultural diversity. Land Use Policy, 72, 57–64. https://doi.org/10.1016/j.landusepol.2017.12.003
- Mazur, K., & Bennett, J. W. (2008). Choice modelling in the development of natural resource management strategies in NSW. No. 448-2016-33934. https://doi.org/10.22004/ag.econ.94716
- Nicosia, K., Daaram, S., Edelman, B., Gedrich, L., He, E., McNeilly, S., Shenoy, V., Velagapudi, A., Wu, W., Zhang, L., Barvalia, A., Bokka, V., Chan, B., Chiu, J., Dhulipalla, S., Hernandez, V., Jeon, J., Kanukollu, P., Kravets, P., … Gray, S. (2014). Determining the willingness to pay for ecosystem service restoration in a degraded coastal watershed: A ninth grade investigation. Ecological Economics, 104, 145–151. https://doi.org/10.1016/j.ecolecon.2014.02.010
- Perni, Á., & Martínez-Paz, J. M. (2017). Measuring conflicts in the management of anthropized ecosystems: Evidence from a choice experiment in a human-created Mediterranean wetland. Journal of Environmental Management, 203(Pt 1), 40–50. https://doi.org/10.1016/j.jenvman.2017.07.049
- Pham, N. M., Huynh, T. L. D., & Nasir, M. A. (2020). Environmental consequences of population, affluence and technological progress for European countries: A Malthusian view. Journal of Environmental Management, 260, 110143. https://doi.org/10.1016/j.jenvman.2020.110143
- Qi, S., & Luo, F. (2007). Environmental degradation problems in the Heihe River Basin, northwest China. Water and Environment Journal, 21(2), 142–148. https://doi.org/10.1111/j.1747-6593.2006.00059.x
- Reid, A. J., Carlson, A. K., Creed, I. F., Eliason, E. J., Gell, P. A., Johnson, P. T. J., Kidd, K. A., MacCormack, T. J., Olden, J. D., Ormerod, S. J., Smol, J. P., Taylor, W. W., Tockner, K., Vermaire, J. C., Dudgeon, D., & Cooke, S. J. (2019). Emerging threats and persistent conservation challenges for freshwater biodiversity. Biological Reviews of the Cambridge Philosophical Society, 94(3), 849–873. https://doi.org/10.1111/brv.12480
- Ren, Y., Lu, L., Zhang, H., Chen, H., & Zhu, D. (2020). Residents’ willingness to pay for ecosystem services and its influencing factors: A study of the Xin’an river basin. Journal of Cleaner Production, 268, 122301. https://doi.org/10.1016/j.jclepro.2020.122301
- Rolfe, J., Bennett, J., & Louviere, J. (2000). Choice modelling and its potential application to tropical rainforest preservation. Ecological Economics, 35(2), 289–302. https://doi.org/10.1016/S0921-8009(00)00201-9
- Ruud, P. (1996). Approximation and simulation of the multinomial probit model: an analysis of covariance matrix estimation (pp. 1–17). Department of Economics, Berkeley.
- Sælen, H., & Ericson, T. (2013). The recreational value of different winter conditions in Oslo forests: A choice experiment. Journal of Environmental Management, 131, 426–434. https://doi.org/10.1016/j.jenvman.2013.10.006
- Shu, J., Wang, J., Zheng, B., Gao, J., & Zhang, L. (1998). Eco-environmental degeneration and improving proposal in the Heihe River Basin. Research of Environmental Sciences, 11, 55–61.
- Singh, A. (2015). Poor quality water utilization for agricultural production: An environmental perspective. Land Use Policy, 43, 259–262. https://doi.org/10.1016/j.landusepol.2014.11.015
- Song, W., & Deng, X. (2015). Effects of urbanization-induced cultivated land loss on ecosystem services in the North China Plain. Energies, 8(6), 5678–5693. https://doi.org/10.3390/en8065678
- Train, K. E. (2009). Discrete choice methods with simulation. Cambridge university press. https://books.google.com.hk/books?id=4yHaAgAAQBAJ
- Upton, V., Dhubháin, Á. N., & Bullock, C. (2012). Preferences and values for afforestation: The effects of location and respondent understanding on forest attributes in a labelled choice experiment. Forest Policy and Economics, 23, 17–27. https://doi.org/10.1016/j.forpol.2012.06.006
- Wu, F., Zhan, J., Chen, J., He, C., & Zhang, Q. (2015). Water yield variation due to forestry change in the head-water area of Heihe River Basin, Northwest China. Advances in Meteorology, 2015, 1–8. https://doi.org/10.1155/2015/786764
- Wu, F., Zhan, J., Zhang, Q., Sun, Z., & Wang, Z. (2014). Evaluating impacts of industrial transformation on water consumption in the Heihe river basin of Northwest China. Sustainability, 6(11), 8283–8296. https://doi.org/10.3390/su6118283
- Zhang, Y., Liu, Y., Zhang, Y., Liu, Y., Zhang, G., & Chen, Y. (2018). On the spatial relationship between ecosystem services and urbanization: A case study in Wuhan, China. Science of the Total Environment, 637–638, 780–790. https://doi.org/10.1016/j.scitotenv.2018.04.396
- Zhou, Z., Huang, Y., Zhao, L., & Jia, A. (2015). An analysis of the spatial heterogeneity of the functioning of ecosystem services related to land-and-water resources. Nature Environment & Pollution Technology, 14(2), 291–298.