
 ?Mathematical formulae have been encoded as MathML and are displayed in this HTML version using MathJax in order to improve their display. Uncheck the box to turn MathJax off. This feature requires Javascript. Click on a formula to zoom.
ABSTRACT
This study provided an investigation of strain evolutions in bonded and unbonded prestressed reinforced concrete beams via nonlinear finite element analyses considering concrete plasticity and concrete-damaged plasticity. Usually, non-convergence problems often occurred during analyses of prestressed beams due to drastic increase in contact stresses during stress transferring stages and material softening at large deformations. To avoid this issue, material models with gentle softening behaviors can be used. However, authors introduced a method of employing automatic stabilization using damping factor and viscosity parameters to enhance convergencies. Preciseness of models was then verified by test results of ten beams from referenced researches. Furthermore, strains evolution in concrete, rebars, and tendons was investigated. It is noticed that material inelasticity characteristics make the rate of strain activation unique in defining structural performances of beams under loads. However, this concept is not frequently introduced because measuring the strains in experiments was complicated, while most researchers are only interested in load–deflection relationships and conditions at failure stage. This work demonstrates element strains as functions of deflections to show strains activation mechanisms of structural components. The study offered knowledges which can not only enhance material utilization, but also improve the ductility of prestressed beam designs.
1. Introduction
Since the early 20th century, prestressed concrete structures have been playing a significant role in the construction industry. Originally, the idea was installing prestressed tendons into concrete components to counter unfavorable tensile stress in concrete, and hence deformations and cracks were controlled. Based on that concept, two technologies were developed, which were bonded and unbonded prestressed tendons. So far, many studies have attempted to investigate prestressed concrete behaviors, and structure simulation has always been an attractive topic. While responses of bonded prestressed structures were clear because tendon strains could be found directly from section equilibrium, those of unbonded prestressed concrete were much difficult since tendon strains could be obtained only from global conditions of the components.
One common method for solving prestressed beams is employing analysis models, which followed Euler or Timoshenko beam theories. Typical examples of this method are made by Moreirab, Sousa, and Parente (Citation2018), Lou, Lopes, and Lopes (Citation2013), and Vu and Castel (Citation2010). In these researches, strains of unbonded tendons were calculated from associate displacements of beams to overcome the strain incompatibility problem.
Besides analytical analysis, computer-aided engineering programs have been proven as a powerful alternative method for structure investigations. In commercial software such as ABAQUS or ANSYS, all contacts between beam elements, as well as geometrical and material nonlinearities could be simulated. Since interactions of tendons and surrounding concrete were included in these models, the strain incompatibility problem was eliminated. Recent studies that followed this philosophy are conducted by Yapar, Basu, and Nordendale (Citation2015), Lee et al. (Citation2020), Mercan, Schultz, and Stolarski (Citation2010), and Silva et al. (Citation2020). These studies carried out ABAQUS analysis to predict behaviors of prestressed beams, and they verified the results by experimental data.
In general, previous researches mainly focused on finding load–deflection relationships and failure strains; but the researches on the micro-reasons of structure responses are rare.
2. Research scope and significate
First, behaviors of prestressed reinforced concrete beams are simulated using nonlinear finite element models considering concrete plasticity (CP) and concrete-damaged plasticity (CDP). Practically, one common challenge in ABAQUS analyses is non-convergencies. To tackle this challenge, engineers often used either automatic stabilization by damping factors or viscosities of concrete. Although these methods allowed ABAQUS to achieve convergencies easier, they might greatly affect output preciseness. In 2015, Szczecina Michał and Winnicki Andrzej (Citation2015) gave a parametric study of viscosity values. Their results showed that the viscosity of concrete redistributed the concrete damages to the regions around critical line. For analyzing prestressed concrete, Yapar, Basu, and Nordendale (Citation2015) and Silva et al. (Citation2020) used viscosity values of 0.001 and 0.005, respectively, while Lee et al. (Citation2020) used up to 0.5. For adapting damping factor in structural analysis, in 2018, J.D. Nzabonimpa and Won-Kee Hong (Citation2018) introduced a series of results that reflected the effects of damping factors on numerical analyses of steel joints. However, researches that explained the uses of damping or viscosity to enhance the numerical analyses of prestressed beams are rare. Hence, this study presents an effective way of employing damping factors and viscosities to enhance model convergencies.
Secondly, according to Chern, You, and Bazant (Citation1992), prestressed beams could experience three stages under loads and the transitions between stages were denoted by strain limits. Thus, understanding strain activations of beam elements would help to unravel the nature of structure behaviors. However, most numerical studies performed were limited at load–deflection relationships and strains at failure stages. In present study, strain evolutions were presented to discover how flexural capacities of prestressed beams are activated, exploring the life of such structures from an onset of initial cracks to fracture.
Test data which was obtained from ten bonded and unbonded prestressed beams were used as verification. Strain evolutions as functions of displacements and loads were also explored to discover the activation mechanism of flexural capacities of prestressed beams.
Table
3. Finite element model description
3.1. Modeling problems
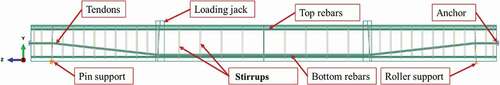
The finite element models were first compared with experimental results of seven beams from the study of Hussien et al. (Citation2012). Overall, the selected specimens are seven simply supported beams with spans of 4 m and rectangular section, as illustrated in .
Figure 1. Modeling tested beam (O.F. Hussien et al. Citation2012) in ABAQUS.
Among the selected beams, B2 and B5 were bonded partially prestressed beams; B3 and B6 were bonded fully prestressed beams; B7, B8, and B9 were unbonded prestressed beams. The term “fully prestressed” implied that there was no bottom reinforcement. The configurations of each type and material properties can be found in .
Table 1. Detail configuration of tested beams (Hussien et al. Citation2012)
Table 2. Strengths of steel materials (Hussien et al. Citation2012)
Three simply supported unbonded prestressed beams from the study of Warwaruk, Sozen, and Siess (Citation1962) were also referred to verify the ABAQUS models. summarizes the descriptions of test samples.
Table 3. Beam configurations (Warwaruk, Sozen, and Siess Citation1962)
3.2. Material
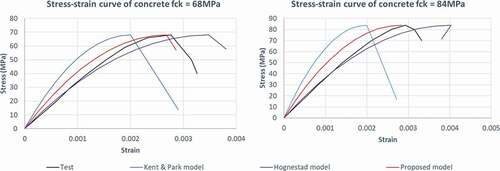
To express the material nonlinearity, concrete plasticity (CP) and concrete-damaged plasticity (CDP) model was adopted. In which, Drucker–Prager yield criterion was employed and function coefficients were taken according to Milad Hafezolghorani et al. (Citation2017); but there were modifications in dilation angles and viscosities (). Owing to the lack of material test data in the reference experiments, authors used the Kent & Park concrete model with modification to predict compression behaviors of concrete. The original Kent & Park model prefixed strain at peak stress as
. However, this could not reflex the actual properties of concrete since the value of
increased in higher strength concrete, according to Shehata, Shehata, and Mattos (Citation2000). Besides, another commonly used model was proposed by Hognestad (Citation1951), the model presented
as a function of concrete strength, however the ultimate strain
was constantly equal to 0.0038. illustrates the comparison between the Hognestad, original and modified Kent & Park stress–strain curves with actual test data from the study of Pendyala et al. (Citation1996). It can be noticed that the available models gave significant errors in predicting
, while the modified model had reasonable matches. The improvement was made by adopting Tomaszewicz formula (Bjerkeli, Tomaszewicz, and Jensen Citation1990) to calculate
. The formula was recommended by Van Gysel and Taerwe (Citation1996) and European committee for standardization (Citation2004). Numerical expressions of the modified model are given by EquationEquations 1
(1)
(1) –Equation5
(5)
(5) .
Table 4. Drucker–Prager coefficients for concrete damage plasticity model
Figure 2. Stress–strain curves of proposed concrete model, original Kent & Park model, Hognestad model and actual test results of normal weight concrete from the study of Pendyala et al. (Citation1996).
Tomascewicz formula:
In which:
Note that the value of in EquationEquation 4
(4)
(4) was modified to suit the strain at peak stress from Tomascewicz formula. According to European committee for standardization (Citation2004), the ultimate strain of concrete can be calculated by EquationEquation 5
(5)
(5) . Furthermore, results from EquationEquation 5
(5)
(5) showed a good agreement with the tests which was conducted by Xuekang Tao and Gongchen Du (Citation1985). In those tests, the maximum strains of concrete varied from 0.0022 to 0.004, and EquationEquation 5
(5)
(5) predicts the value of 0.0035 for the same concrete strengths.
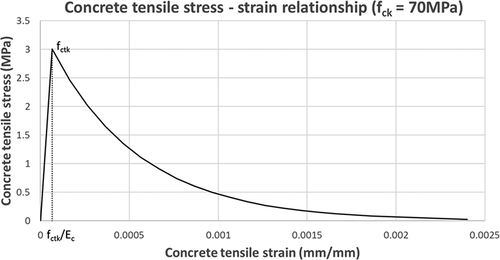
Tensile strengths of concrete in present study were taken as characteristic values of 5 percentile fractal. According to European committee for standardization (Citation2002), the term characteristic strength denoted a value that only higher than strength of a certain number of tested samples, graphically illustrates this. Tension stress–strain relationships of concrete was calculated following nonlinear tension softening model ().
Figure 3. Graphic illustration of 5 percentile fractal characteristic value.
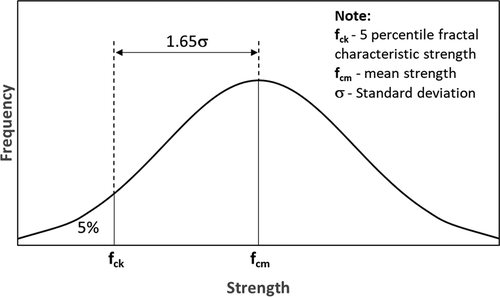
Figure 4. Tensile concrete constitutive models.
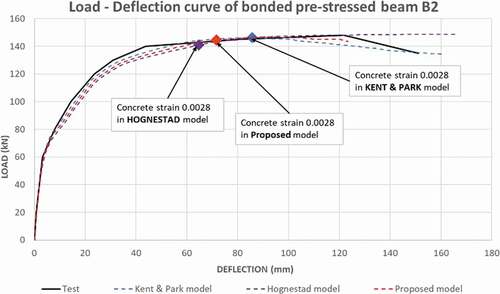
shows the comparison of load–deflection curves from the three abovementioned concrete models. Although the stress–strain relationships were different, the general behavior of the beam was almost the same. This might imply the minor role of concrete strain rate in beam performances.
Figure 5. Results comparison between three different concrete models.
Concrete-damaged plasticity (CDP) model allows micro damages in concrete structures to be considered as a reduction in elastic modulus as functions of damage factors dc and dt (). If those damage parameters are zero, materials will behave as concrete plasticity model (CP). It is very hard to exactly determine damaged indexes dc and dt because of the complexity of concrete degradation mechanism. Some researches such as the study of Milad Hafezolghorani et al. (Citation2017) or Nzabonimpa, Hong and Kim (Citation2017) suggested typical values for damage indexes. However, when damage is considered, ABAQUS will automatically convert inelastic strain to plastic strain following EquationEquations 6(6)
(6) and Equation7
(7)
(7) . The software only accepts material properties if plastic strain rate is positive as shown in . Whereas, EquationEquations 6 and 7 indicate that plastic strain is a function of concrete elastic modulus, stresses, damage factors, inelastic strains, and cracking strains. Therefore, dc and dt should be varied for different concrete properties. The study about modeling parameters for reinforced concrete finite element models of Birtel and Mark (Citation2006) recommended two formulas (EquationEquations 8
(8)
(8) and Equation9
(9)
(9) ) that can take into account concrete properties to calculate dc and dt.
Figure 6. Compressive concrete-damaged plasticity (fck = 37.44 MPa).
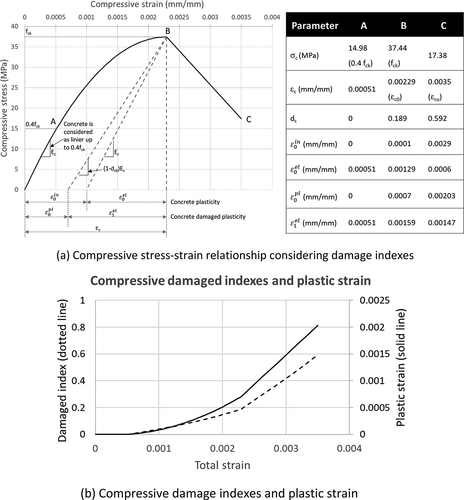
Figure 7. Tensile concrete-damaged plasticity (fctk = 2.35 MPa). (a) Tensile stress-strain relationship considering damage indexes(b) Tensile damage indexes and plastic strain
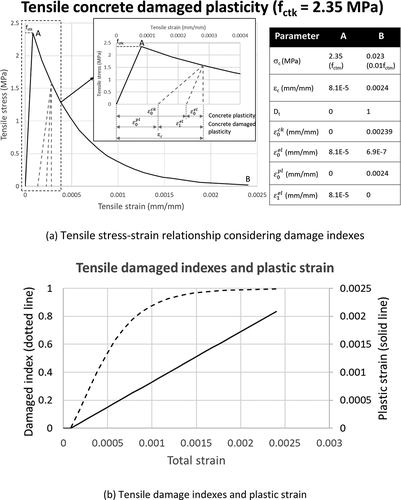
It is noted that EquationEquations 9(9)
(9) used tensile stresses and cracking strains. Experiment bases values bc = 0.7 and bt = 0.1 were recommended Birtel and Mark (Citation2006). However, in EquationEquations 9
(9)
(9) , a calibration factor
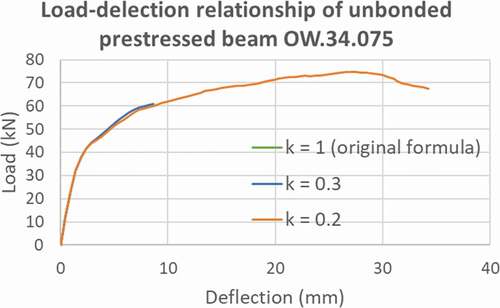
was added to ease the concrete degradation rate so the convergency of ABAQUS can be improved. shows that calibration factor k strongly improved convergency of analysis, but it did not cause much affection to general beam capacities.
Figure 8. Load-deflection curves with different tensile damage indexes.
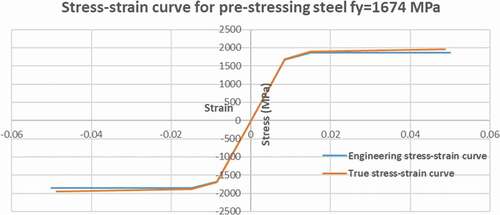
Because of the similarity between compressive and tensile behaviors, steel materials were defined as a combination of elastic and plastic materials. In this study, engineering stress–strain relationships of rebars was interpolated from typical cases that were given by Nadim Hassoun and Al-Manaseer (Citation2015). According to Mast et al. (Citation2008), tendons could be able to sustain the strain of at least 0.05; so ultimate strain of tendon was taken as 0.005 in the current models. Based on Dassault Systèmes Simulia Corp (Citation2014), input data for plastic material should be converted from engineering values to true value to express the geometrical nonlinearity. According to Iman Faridmehr et al. (Citation2014), the calculation can be conducted by EquationEquations 10(10)
(10) and Equation11
(11)
(11) . show stress–strain curves of reinforcing steels and prestressing steels, respectively.
Figure 9. Stress–strain curves of reinforcing steel used in the proposed model.
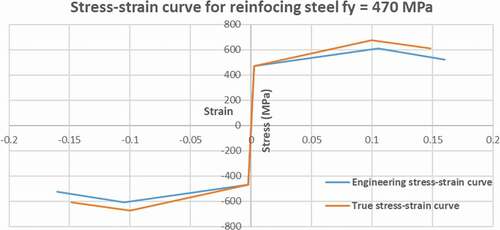
Figure 10. Stress–strain curves of prestressing steel used in the proposed model.
3.3. Interaction
An ABAQUS model is composed of parts, each part represents a beam element (concrete body, longitudinal reinforcement, stirrup, etc.). Program allowed users to define interactions between parts by a variety of types of constraints and contacts. In present study, firstly, stirrups were considered as embedded into concrete, translations of an embedded node were interpolated from the corresponding displacements of host elements (Dassault Systèmes Simulia Corp Citation2014). Secondly, surfaces of rebars and surrounding concrete were connected by tie constraints to merge them together regardless of the mesh equality (Dassault Systèmes Simulia Corp Citation2014). Thirdly, tangential interactions of tendons and concrete were frictional-based contacts, so it could either permit unbonded tendons to slip freely or penalize the separations of bonded tendons by shear forces. Finally, in normal direction, hard contact was used to prevent the penetration of tendons into concrete. summarizes the detailed setups of tendon to concrete interactions.
Table 5. Interaction parameter of tendons
3.4. Meshing technique
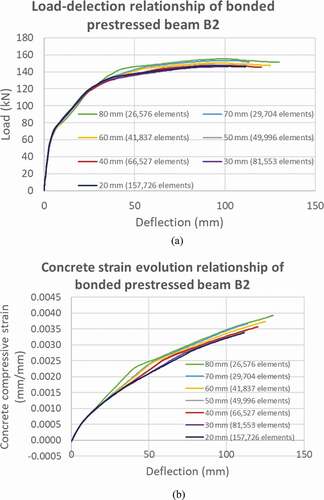
Because it was necessary to create surfaces for contacts between concrete and tendons, as well as concrete and rebars, many non-parallel holes were made in concrete body ()), this created sharped edge elements in regions between two holes. These elements had high possibilities to block the convergence of iterations. To solve this problem, beams should be partitioned so each hole is isolated and separated by transition regions, as illustrated in ). It is noted that the positions of tendons at the middle segment were modified by a distance of 20 mm (i.e., 6.4% of the total drape of tendons) in the beams B2, B5, B7, B8, and B9 ()), this modification helped to separate partition zones of tendon holes and reinforcement holes. Besides, mesh sizes should be reasonable, the dimensions should be small enough so the meshed elements could have appropriate shapes, but it should also not be too small to save the analyzing time ()). Mesh sensitivity analysis ()) showed that load-deflection relationships considerably changed when mesh size is reduced from 80 mm to 50 mm, but there were not any noticeable differences between load-deflection curves of models with mesh size 40 mm, 30 mm, and 20 mm. In ), although mesh size 40 mm provided slightly different strains evolutions than those in finer meshed models, concrete strains in 20 mm and 30 mm mesh size models could not reach the ultimate strain (0.0035) due to nonconvergence problems. Therefore, the mesh size of 40 mm was selected.
Figure 11. Beam partitioning and meshing (a) Load-deflection relationships (b) Concrete strain evolutions.
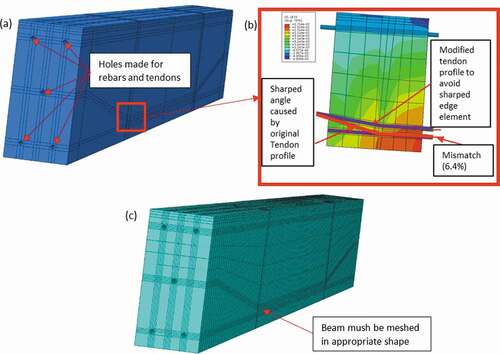
Figure 12. Mesh sensitivity analysis.
3.5. Boundary conditions and analysis time steps
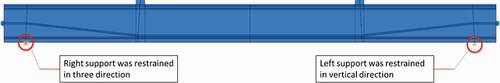
Boundary conditions of models were set asymmetrically. While displacements of the left support were restrained in all three directions, the right support was only restrained vertically (). Constrain points for each side were selected in one line so the supports could rotate freely around the transverse direction.
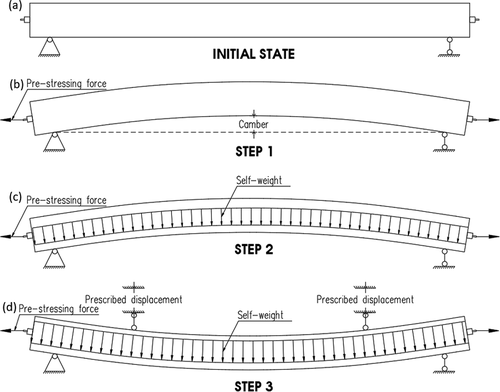
Figure 13. Boundary conditions.
To simulate test sequences, models were set to be analyzed through three continuous time steps, in which, successors inherit the results of predecessors. First, as illustrated in ), prestressing forces were transferred to concrete through anchors and bonding forces from tendons, no support reactions appeared because of the statically deterministic nature of the beams. In the following step, structural self-weight was considered, this simulated the removal of temporary supports in the beam-casting process ()). Finally, beams were loaded at the third step by two imposition displacements at jacking positions, as illustrated in ).
Figure 14. Analyzing time steps.
3.6. Convergence enhancement
illustrates that average shear stress in contact surfaces between bonded tendons and concrete dramatically increased in the early of stress transferring step. Therefore, contact convergence problems occurred in this state, as illustrated in . In the case of unbonded tendons, at the first step, contact pressure increased rapidly at corner positions (), this resulted in plasticity non-convergence in surrounding concrete elements (). The unconvergence points in are reported by ABAQUS. In , red points were called “slipping points” by ABAQUS, this term means that the preassigned sticking (cohesion) contact conditions between tendons and concrete were not satisfied in the current iteration. In , red elements were named as “unconverged concrete plasticity” elements by ABAQUS because those points did not satisfy convergence criteria. The stick–slipping contact points and “unconverged concrete plasticity” elements led to severe discontinuity iterations (SDIs). Those iterations indicate that structures are experiencing abrupt changes in stiffness. ABAQUS will try to reduce the time increasements and iterate again until the convergence criteria are achieved, otherwise, analyses will be aborted. In present study, automatic stabilization was employed to overcome this problem; this method allows users to reduce the residual between external and internal forces by damping factor, as illustrated in EquationEquation 12(12)
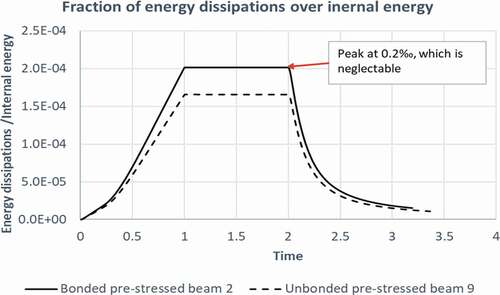
(12) , according to Dassault Systèmes Simulia Corp (Citation2014). It is obvious that this method could heavily affect results preciseness, so the damping factor must be selected carefully. In present study, damping factor of 1E-6 was used in the first step for beams B2 and B9. The errors can be neglected since energy dissipations were neglectable in comparison with internal energies ().
Figure 15. Shear stress in the contact surface between bonded tendon and concrete.
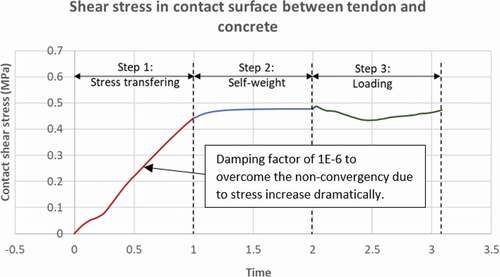
Figure 16. Non-convergence contact points (red points) occurred due to the dramatic increase in contact shear stress in the bonded beam.
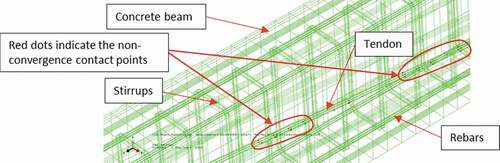
Figure 17. Pressure in the contact surface between unbonded tendon and concrete.
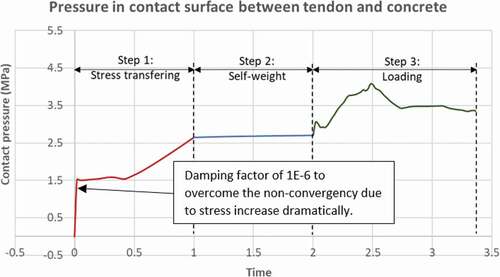
Figure 18. Non-convergence elements (red elements) occurred due to the dramatic increase in contact pressure in the unbonded tendon.
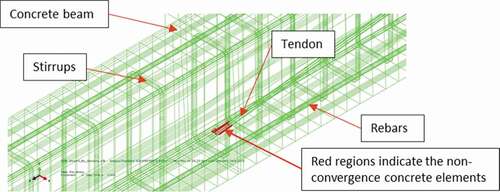
Figure 19. Fraction of energy dissipations of damping factor 1E-6 in comparison with internal energy.
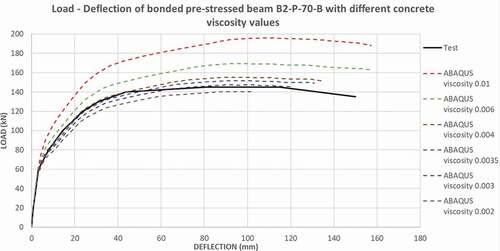
Moreover, according to Dassault Systèmes Simulia Corp (Citation2014), the models often experience non-convergency troubles in the softening stage of materials. Thus, a value of viscosity was taken in defining concrete to improve convergency. illustrates a parametric study of this parameter, and the value of 0.003 was the best for the case.
Figure 20. Analyzed results of the bonded prestressed beam B2 with different concrete viscosity values.
4. Numerical results of CP models
4.1. Load–deflection
To validate the reliability of finite element models, predicted load–deflection curves of ten prestressed beams were compared with the test data, as illustrated in . In the curves, importance thresholds of beams were marked by six points: A, B, C, D, E, F.
Point A denoted the degradation of bottom concrete due to tension cracks. It was determined by the decrease in average tension stresses at the bottom of the beams (). It can be seen from the ten curves (), after point A, the load increased slower due to the loss of concrete tensile strengths.
Figure 21. Average stress of concrete at the bottom of the beams.
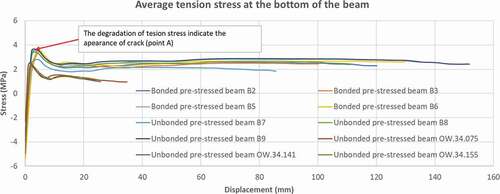
Figure 22. Load–deflection curves.
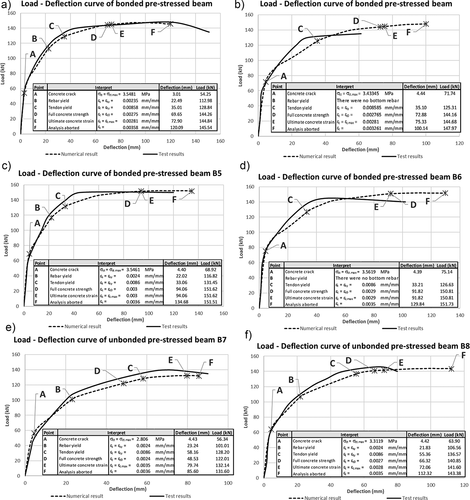
Figure 22b. continue
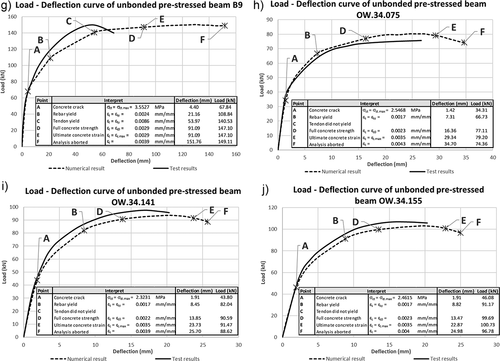
Points B and C indicated the yielding points of rebars and tendons, respectively. These points also marked the slowdown in the rate of resistance. After point C, the load–deflection curves were nearly horizontal. In the bonded beams B2 and B5, points B and C located closely ()), while in the unbonded beams B7, B8, and B9, they were far from each other, the reason for this phenomenon will be explained by strain investigation. Point B is not available in ) because beams B3 and B6 had no bottom reinforcement. Three beams OW.34.075, OW.34.141, and OW.34.155 failed before tendons yield, so point C is not indicated in .
Point D indicated the point that concrete strain reached the strain at peak stress. In ten considered beams ()), resistances only slightly increased up after point D, the additional strengths were due to the activation of steels.
Point E represented the stage when concrete reached the ultimate strain which was calculated based on EquationEquation 5(5)
(5) . According to European committee for standardization (Citation2004), concrete could only attain to this strain value (0.0027–0.0035). In the beams B9, B6, and B5, point D and E were identical because their concrete strength was above 90MPa. It can be seen that tested beams did not experience the failure exactly when concrete reached the theoretical ultimate strains, which ranged from 0.0027 to 0.0035. In fact,American Concrete Institute (Citation2011) pointed out that the maximum concrete compressive strain could be higher than 0.008 in special cases. This ductile phenomenon was significant in beam B2 ()). Meanwhile, ) illustrates that the failures in the test of seven beams that occurred near the predicted points. Beams B3 and B9 witnessed a failure earlier before concrete reached the ultimate strain (0.0027 to 0.0035, depending on the strength), as illustrated in ); this can be explained by the imperfection of beam structures and test procedures.
Point F indicated the abort of ABAQUS analyses, those endings were caused by the non-convergencies of the models. The phenomenon occurred during this period because of materials softening, as explained in Section 3.6.
4.2. Strain rate
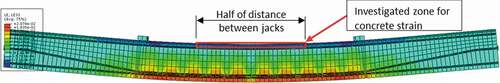
To reflect the general conditions, concrete strains were taken as average strains at the middle zone of beams, as illustrated in . Furthermore, only a normal component of concrete strains was considered to focus on the compressive contribution of concrete. Besides, there was no shear force at the middle of tested beams, so normal components strain could fairly represent the strain condition of concrete elements.
Figure 23. Contour of concrete normal strain.
On the other hand, strains of tendons and bottom reinforcements were considered in terms of maximum principal values. Two types of strains were extracted from each element, one was at the average strain of the whole length and the other was strain at the most critical positions at the final state. It is noted that while strain concentrations of tendons located in the middle ()) or jacked positions ()) of the beams, a maximum strain of bottom reinforcements always occurred under the jacks (). The location of maximum strains in reinforcements implied the affection of shear strains which concentrated under the jacks.
Figure 24. Strain concentrations of tendons.
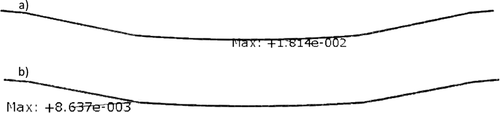
Figure 25. Strains concentration of reinforcements.
The left-hand side plots in demonstrate the evolution of materials in ordinary measure. According to European committee for standardization (Citation2004), the ultimate strain of concrete, which is calculated by EquationEquation 5(5)
(5) , can be considered as the maximum usable strain of concrete. Besides, the point that the concrete achieved the ultimate strain (point E) can be called the ultimate point of the beams since the concrete always reached the ultimate strains (0.0027 to 0.0035, depending on strength) sooner than tendons and reinforcements, as illustrated in . At the ultimate point (E), though tendons and reinforcements strains were much larger than concrete, they were still far below ultimate limits, their strains only got up to 30% and 11% of ultimate numbers, respectively. Moreover, although initial strains of tendons were the highest among all materials, bottom reinforcements experienced the fastest strain rates because of the furthest distance to the compressive concrete. It can be also be noted that tendons and rebars strains only rapidly increased after the occurrence of concrete tension crack (point A). As illustrated in , the bonded prestressing tendons and the bottom reinforcement steels nearly had equal strain rates since they were both restrained to surrounding concrete and located in nearby positions. Besides, due to the lack of bonding force, the unbonded tendons developed strains much slower than the bottom reinforcements ()).
Figure 26. Strain investigations.
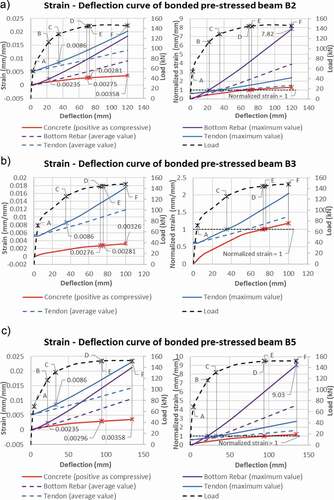
Figure 26b. continue
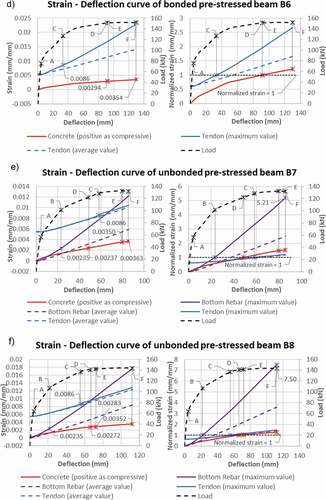
Figure 26c. continue
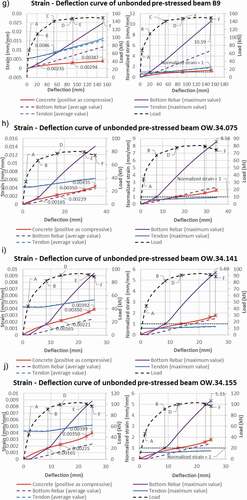
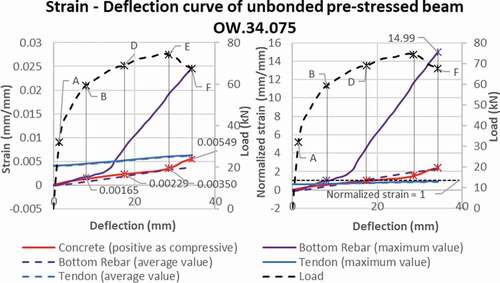
Though only concrete was activated to ultimate strain (0.0027 to 0.0035 depend on strength), it is impossible to say that the steels were not utilized because the resistance did not increase much after yielding strain. Therefore, to display strain activations clearer, normalized strains were calculated and plotted in right-hand side figures of , in which concrete strains were normalized by strain at peak stress () while metal strains were normalized by yielding strain.
The right-hand side plots in illustrate that the non-prestressing reinforcements were the first element to be fully mobilized by strength, in the ultimate point (E), the values could be achieved from 4-times to 6-times yielding strain. Moreover, different behaviors were obtained in the bonded and unbonded tendons; the bonded tendons often reached to yielding strains at middle life of beam experiments (), while unbonded ones in three beams B7–B9 only attained yielding strains slightly before beams failure (), and unbonded tendons in three beams OW.34.075, OW.34.141 and OW.34.155 did not yield ().
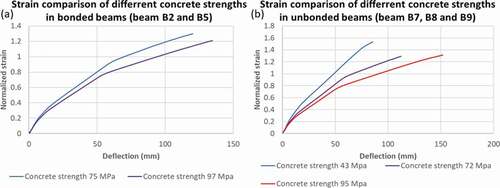
illustrates the comparison between strains of the bonded and unbonded tendons. Though maximum strains in the bonded tendons increased faster and peaked at higher values than those in unbonded tendons, average strains were nearly equal in the two types. Moreover, illustrates that the lower strength concrete had faster strain rates than the higher ones in both the bonded and unbonded prestressed beams.
Figure 27. Strain comparison between bonded and unbonded tendon.
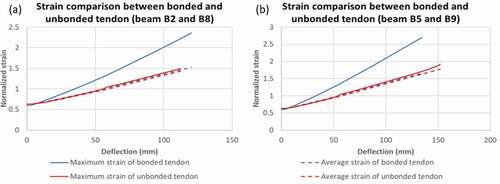
Figure 28. Strain comparison between different concrete strengths.
5. Numerical results of CDP models
) shows beam capacities based on CP models were lower than test capacities in all considered beams except OW.34.075. In this case, applying damage indexes will further underestimate beam strength. Therefore, CDP model will only be used in beam OW.34.075. The results are represented in . Generally, beam resistance was lowered when concrete damages were considered. However, the positions of five points A, C, D, E, F show that there was not any considerable change in strain rates in compared with using CP model.
Figure 29. Load–deflection curve of unbonded prestressed beam OW.34.075.
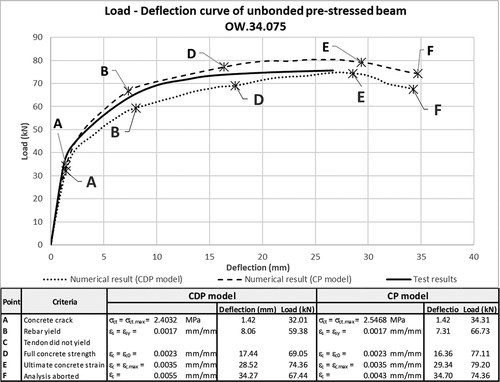
Figure 30. Strain investigation of unbonded prestressed beam OW.34.075.
6. Conclusion
This study has adopted a nonlinear finite element model considering CP and CDP to predict behaviors of both bonded and unbonded prestressed reinforced concrete beams. Furthermore, an investigation of strain rates in structural components was performed to identify the critical elements that engineers should pay attention to. The results revealed details of strain activation mechanisms in concrete, reinforcements, and bonded tendons, as well as unbonded tendons. Material utilization and structure ductility of prestressed beam designs could be benefited from the demonstrated conclusions. Within the numerical results, the following observations can be drawn:
The nonlinear finite element models with CP and CDP were able to simulate the structural responses of bonded and unbonded prestressed reinforced concrete beams.
There were two common causes of non-convergence in prestressed beam analyses, one was a sudden increase in contact stresses during stress transferring stages and the other was the material softening at large deformations.
The damping factor of 1E-6 and viscosity of 0.003 was recommended for analyzing prestressed concrete. Damping factors helped overcome non-convergency during stress transferring phases, while the convergency of load-bearing stages was benefited from the use of viscosities.
Strains of bottom reinforcing steel always reached the largest values under the jacked positions because of the contribution of shear strain, while the maximum strain of tendons varied between the middle of the beam and the jacked positions ().
Although initial strains of tendons were highest among all elements, reinforcing steels demonstrated the fastest strain rates in non-normalized measures, as well as in normalized measures. The ductility of rebars could achieve up to six at the ultimate point (point E in ) of the beams.
Bonded and unbonded tendons experienced different strain rates, the maximum strains of bonded tendons increased faster as compared with unbonded ones. However, the difference of average strains over the beam length of two tendon types was insignificant. The overall component (material) mobilizations of prestressing steel in both tendon types were found similar, but the balance forces from them were distributed differently.
Strain rates of lower strength concrete were higher than those of higher strength concretes.
Disclosure statement
No potential conflict of interest was reported by the authors.
Additional information
Funding
Notes on contributors
Tien Dat Pham
Tien Dat Pham is currently enrolled as a PhD candidate in the Department of Architectural Engineering at Kyung Hee University, Republic of Korea. His research interest includes precast structures.
Won-Kee Hong
Dr. Won-Kee Hong is a Professor of Architectural Engineering at Kyung Hee University. Dr. Hong received his Master’s and Ph.D. degrees from UCLA, and he worked for Englelkirk and Hart, Inc. (USA), Nihhon Sekkei (Japan) and Samsung Engineering and Construction Company (Korea) before joining Kyung Hee University (Korea). He also has a professional engineering license from both Korea and the USA. Dr. Hong has more than 30 years of professional experience in structural engineering. His research interests include a new approach to construction technologies based on value engineering with hybrid composite structures. He provided many useful solutions to issues in current structural design and construction technologies as a result of his research that combines structural engineering with construction technologies. He is the author of numerous papers and patents both in Korea and the USA. Currently, Dr. Hong is developing new connections that can be used with various types of frames including hybrid steel–concrete precast composite frames, precast frames and steel frames. These connections would contribute to the modular construction of heavy plant structures and buildings as well.He recently published a book titled as “Hybrid Composite Precast Systems: Numerical Investigation to Construction„ (Elsevier).
References
- ’
- ’
- ABAQUS. 2014. “Analysis User’s Manual 6.14-2.” Providence, RI: Dassault Systèmes Simulia Corp.
- Birtel, V., and P. Mark. 2006. “Parameterised Finite Element Modelling of RC Beam Shear Failure.” ABAQUS users’ conference, 95–108. Cambridge, Massachusetts.
- Bjerkeli, L., A. Tomaszewicz, and J. J. Jensen. 1990. “Deformation Properties and Ductility of High-Strength Concrete.” Symposium Paper 121: 215–238. doi:https://doi.org/10.14359/2844.
- Chern, J.-C., C.-M. You, and Z. P. Bazant. 1992. “Deformation of Progressively Cracking Partially Prestressed Concrete Beams.” PCI Journal 37 (1): 74–84. doi:https://doi.org/10.15554/pcij.01011992.74.85.
- European committee for standardization. 2002. BS EN 1990-1-1:1994. Eurocode 1: Basis of structural design.
- European committee for standardization. 2004. BS EN 1992-1-1:2004. Eurocode 2: Design of concrete structures - Part 1-1: General rules and rules for buildings.
- Faridmehr, I., M. H. Osman, A. B. Adnan, A. F. Nejad, R. Hodjati, and M. Azimi. 2014. “Correlation between Engineering Stress-Strain and True Stress-Strain Curve.” American Journal of Civil Engineering and Architecture 2 (1): 53–59. doi:https://doi.org/10.12691/ajcea-2-1-6.
- Hafezolghorani, M., F. Hejazi, R. Vaghei, M. S. B. Jaafar, and K. Karimzade. 2017. “Simplified Damage Plasticity Model for Concrete.” Structural Engineering International Nr. 1/2017. doi:https://doi.org/10.2749/101686616X1081.
- Hognestad, E. 1951. Study of Combined Bending and Axial Load in Reinforced Concrete Members. University of Illinois at Urbana Champaign, College of Engineering. Engineering Experiment Station.
- Hong, W. K. 2019. Hybrid Composite Precast Systems: Numerical Investigation to Construction. United Kingdom: Woodhead Publishing Elsevier.
- Hussien, O. F., T. H. K. Elafandy, A. A. Abdelrahman, S. A. Abdel Baky, and E. A. Nasr. 2012. “Behavior of Bonded and Unbonded Prestressed Normal and High Strength Concrete Beams.” HBRC Journal 8 (3): 239–251. doi:https://doi.org/10.1016/j.hbrcj.2012.10.008.
- Lee, S.-H., A. Abolmaali, K.-J. Shin, and H.-D. Lee. 2020. “ABAQUS Modeling for Post-tensioned Reinforced Concrete Beams.” Journal of Building Engineering 30: 68–78. doi:https://doi.org/10.1016/j.jobe.2020.101273.
- Lou, T., S. M. R. Lopes, and A. V. Lopes. 2013. “Nonlinear and Time-dependent Analysis of Continuous Unbonded Prestressed Concrete Beams.” Computers and Structures 119: 166–176. doi:https://doi.org/10.1016/j.compstruc.2012.12.014.
- Mast, R. F., M. Dawood, S. H. Rizkalla, and P. Zia. 2008. “Flexural Strength Design of Concrete Beams Reinforced with High-Strength Steel Bars.” ACI Structural Journal 105 (5): 570–577. doi:https://doi.org/10.22636/MKCI.2010.22.5.83.
- Mercan, B., A. E. Schultz, and H. K. Stolarski. 2010. “Finite Element Modeling of Prestressed Concrete Spandrel Beams.” Engineering Structures 32 (9): 2804–2813. doi:https://doi.org/10.1016/j.engstruct.2010.04.049.
- Michał, S., and W. Andrzej. 2015. “Calibration of the CDP Model Parameters in Abaqus.” The 2015 World Congress on Adcances in structural Engineering and Merchanics. Incheon, Korea.
- Moreirab, L. S., J. B. M. Sousa Jr., and E. Parente Jr. 2018. “Nonlinear Finite Element Simulation of Unbonded Prestressed Concrete Beams.” Engineering Structures 170: 167–177. doi:https://doi.org/10.1016/j.engstruct.2018.05.077.
- Nadim Hassoun, M., and A. Al-Manaseer. 2015. Structural Concrete, Theory and Design Sixth Edition. Hoboken, New Jersey: John Wiley & Sons.
- Nzabonimpa, J. D., W. K. Hong, and J. Kim. 2017. “Strength and Post‐yield Behavior of T‐section Steel Encased by Structural Concrete.” The Structural Design of Tall and Special Buildings 27 (5): e1447. doi:https://doi.org/10.1002/tal.1447.
- Nzabonimpa, J. D., and W.-K. Hong. 2018. “Use of Artificial Damping Factors to Enhance Numerical Stability for Irregular Joints.” Journal of Constructional Steel Research 148: 295–303. doi:https://doi.org/10.1016/j.jcsr.2018.05.034.
- Pendyala, R., P. Mendis, and I. Patnaikuni. 1996. “Full-Range Behavior of High-Strength Concrete Flexural Members: Comparison of Ductility Parameters of High and Normal-Strength Concrete Members.” ACI Structural Journal, 93 (1): 30–35.
- Shehata, I., L. Shehata, and T. S. Mattos. 2000. “Stress-strain Curve for the Design of High-strength Concrete Elements.” Materials and Structures 33 (7): 411–418. doi:https://doi.org/10.1007/BF02480659.
- Silva, R., W. V. Silva, J. Y. de Farias, M. A. A. Santos, and L. O. Neiva. 2020. “Experimental and Numerical Analyses of the Failure of Prestressed Concrete Railway Sleepers.” MDPI Materials 13 (7): 1704. doi:https://doi.org/10.3390/ma13071704.
- Standard, A. A. 2011. “Building Code Requirements for Structural Concrete (ACI 318-11).” In American Concrete Institute.
- Tao, X., and D. Gongchen. 1985. “Ultimate Stress of Unbonded Tendons in Partially Prestressed Concrete Beams.” PCI Journal 30 (6): 72–91. doi:https://doi.org/10.15554/pcij.11011985.72.91.
- Van Gysel, A., and L. Taerwe. 1996. “Analytical Formulation of the Complete Stress-strain Curve for High Strength Concrete.” Materials and Structures 29 (9): 529–533. doi:https://doi.org/10.1007/BF02485952.
- Vu, N. A., and R. F. Castel. 2010. “Response of Post-tensioned Concrete Beams with Unbonded Tendons Including Serviceability and Ultimate State.” Engineering Structures 32 (2): 556–569. doi:https://doi.org/10.1016/j.engstruct.2009.11.001.
- Warwaruk, J., M. A. Sozen, and C. P. Siess. 1962. “Investigation of Prestressed Reinforced Concrete for Highway Bridges, Part III: Strength and Behavior in Flexure of Prestressed Concrete Beams.” Engineering Experiment Station Bulletin No. 464.
- Yapar, O., P. K. Basu, and N. Nordendale. 2015. “Accurate Finite Element Modeling of Pretensioned Prestressed Concrete Beams.” Engineering Structures 101: 163–178. doi:https://doi.org/10.1016/j.engstruct.2015.07.018.