
 ?Mathematical formulae have been encoded as MathML and are displayed in this HTML version using MathJax in order to improve their display. Uncheck the box to turn MathJax off. This feature requires Javascript. Click on a formula to zoom.
ABSTRACT
The present paper introduces a practical and convenient artificial intelligence-based design approach for doubly reinforced concrete (RC) beams. Completed designs are automatically obtained from regression models and back-substitution (BS) procedures, which satisfy the preassigned flexural strength, curvature ductility, and calculate serviceability parameters. In addition, regression algorithms are developed by training multiple Gaussian Process Regression models on structural data. Furthermore, feature selections and Chained training scheme with Revised Sequence (CRS) techniques are implemented to enhance the training accuracy, providing acceptable accuracies (less than 0.7% errors) in 91 interpolation designs. First, CRS procedures are employed, improving the regression accuracy by sequentially predicting outputs, using predictions of predecessor steps as inputs for the successor ones. In doing so, the preciseness of models is improved as training continues. Appropriate inputs and reasonable output sequences for CRS are determined using a feature selection-based procedure for obtaining optimal training. This procedure implemented three feature selection methods (F-test, Neighborhood Component Analysis (NCA), and RReliefF) in a greedy algorithm, evaluating relations among design parameters. In summary, a direct design approach of a doubly reinforced concrete beam is presented, which enables engineers to control moment capacities and curvature ductility easily, replacing ineffective iteration-based conventional design procedures.
1. Introduction
1.1. Literature review
During the last two decades, artificial intelligence (AI) has been implemented in various aspects of construction industries, providing evolutionary design, management, and monitoring solutions (Sun, Burton, and Huang Citation2020). A common topic has been structural health monitoring, such as in Rafiei and Adeli (Citation2017), Tibaduiza et al. (Citation2018), Melville et al. (Citation2018), Hoshyar et al. (Citation2020), Al-Rahmani, Rasheed, and Najjar (Citation2013), Kang and Li (Citation2020), Kang et al. (Citation2015), Kang, Li, and Dai (Citation2019), and Hoshyar et al. (Citation2017), where structural damages were detected and safeties were examined using machine learning (ML)-based algorithms, providing convenient evaluation tools for engineers. In addition, pattern recognition-based investigations using Support Vector Machine (SVM) were conducted to evaluate residual capacities of damaged structures in Zhang and Burton (Citation2019), Yan et al. (Citation2014), Shyamala, Mondal, and Chakraborty (Citation2016), and Kohiyama, Oka, and Yamashita (Citation2020), their preciseness was assessed through the mean square errors (MSEs) of the testing datasets. For component design, the authors in Naeej et al. (Citation2013) and Alacalı, Doran, and Akbas (Citation2006) used experimental data to train and test regression models, with an aim to calculate the lateral confinement coefficients of reinforced concrete (RC) columns. Another example is Olalusi and Awoyera (Citation2021), where shear capacities of slender RC beams strengthened by steel fibers were predicted using ML models trained on 326 experimental data sets. On the other hand, it was also common to employ artificial intelligence technologies to discover behaviors of materials, for example, mechanical properties of concrete mixtures using waste foundry sand were simulated in Behnood and Golafshani (Citation2020) using decision tree algorithms based on collected data. In these abovementioned studies, data collection and validation were the major difficulties encountered. Therefore, the authors in Mitropoulou and Papadrakakis (Citation2011), Cai, Pan, and Fu (Citation2020), Dehkordi et al. (Citation2012), Naser (Citation2018), and Hore et al. (Citation2016) used artificial data to construct AI models. For example, the authors in Mitropoulou and Papadrakakis (Citation2011) replaced the fragility analysis of structural systems with a trained Neural Network (NN), reducing the computational efforts of complex buildings. Similarly, for investigating the postfire flexural capacities of RC beams, the authors in Cai, Pan, and Fu (Citation2020) developed an NN optimized by a genetic algorithm as an alternative method of FEM analysis.
1.2. Motivation and significance of this study
This study explored the practical application of AI to structural engineering, where the structural behaviors and designs of doubly RC beams were investigated using multiple regression models. These AI models were trained on artificial data generated using Autobeam. This was an analytical software developed in Nguyen and Hong (Citation2019) based on strain compatibilities and transformed sections. Big data is obtained by analyzing multiple beams with randomly selected input parameters (b, h, ρt, ρc, L, fy, fc’, MD, ML). Hence, reverse designs were directly obtained from trained models instead of being obtained using iterative procedures. This approach provided mathematical optimization based on computational statistics. A mathematical model of structural data was built using regression algorithms to predict structural behaviors and designs. In addition, useful reverse engineering scenarios were established using five Gaussian Process Regression (GPR) models, including five different kernel functions Rational Quadratic, Exponential, Squared Exponential, Matern 5/2, and Matern 3/2 (Mathworks Citation2011). Moreover, overfitting was prevented by applying cross-validation schemes provided by MATLAB in training.
This study implemented five GPR models for beam designs, where appropriate models for each output were selected based on the accuracy represented by MSEs. The GPR models required regression options such as kernel functions, basic functions, and fit methods, to be defined, whereas artificial neural networks required the users to establish the numbers of layers, neurons, and epochs (Hong Citation2019). The training problems caused by insufficient inputs were addressed by applying a Chained training scheme with Revised Sequence (CRS) technique based on a feature selection-based greedy algorithm. The proposed algorithm determined features that significantly affected the outputs for training GPR models using feature selection functions. As the results, the training qualities of the AI models were enhanced, providing structural design based on reverse analysis for engineers. MATLAB provides 23 feature selection methods, among which this study explores F-test, RReliefF, and Neighborhood Component Analysis (NCA), which aid the design of doubly RC beams. The considered design parameters are listed in .
Table 1. Beam parameters
2. Introducing feature selections (for training structural data)
2.1. Evaluation parameters for regression models
The present study adopted Mean Square Errors (MSE) and Coefficient of Determination (R2) calculated from validation datasets as the recommendations from MathWorks (Citation2021a) to evaluate the accuracies of regression models. According to Botchkarev (Citation2019) and Naser and Alavi (Citation2020), MSE and R2 were calculated as (1) and (2).
Where:
Table
Validation datasets are a portion of big data which is used to examine accuracies of fitting models as well as preventing overfitting phenomenon (MathWorks Citation2021b). In the present study, the cross-validation technique was adopted to validate regressions, allowing ML models to use all data for training and testing. The procedures can be conducted using the following steps:
Step 1: Dividing big data into k folds of data named as S1, S2, …, Sk.
Step 2: Training ML models using data from k-1 folds S1, S2, …, Sk-1. This model is, then, tested by data in fold Sk.
Step 3: Training ML models using data from k-1 folds S1, S2, …, Sk-2, Sk. This model is, then, tested by data in fold Sk-1.
…
Step k + 1: Training ML models using data from k-1 folds S2, S3, …, Sk-1, Sk. This model is, then, tested by data in fold S1.
Step k + 2: Testing errors in k steps from Step 2 to Step k + 1 are averaged.
Validation parameters (MSEs) shall be calculated using normalized data due to its scale-dependent characteristics (Naser and Alavi Citation2020). These values provide direct a quantification of fitting degrees, enabling users to assess training easily. However, it should be noted that qualities of a regression model shall be evaluated based on errors in practical designs. These errors represent the mismatches between values of preassigned parameters and those provided by AI-based designs. Therefore, errors need to be controlled strictly, ensuring the usability of designs. Detailed evaluations of AI-based models in designs can be found in Section 3.3.
2.2. Overview of feature selection
2.2.1. Importance of feature selDection
This study evaluated the effects of one parameter on another by using feature scores, thus determining appropriate inputs for each output. Note that the features that significantly affect the outputs should be used, whereas those that are less influential can be omitted without significantly degrading the training quality. Furthermore, nonrelated parameters should be excluded from the input to avoid the generation of unnecessary noise in the mapping procedures. A simple example of the improvements obtained by selecting reasonable inputs is presented below.
Example:
Let us assume the following function:
where
It can be observed that x and y are the most influential parameters in calculating f, whereas z has negligible contribution. Furthermore, f and t are not related. A set of 500 datapoints generated using (3), normalized from 0 to 1 for training, is listed in ). ) illustrates four Matern 5/2 GPR models, which are trained on normalized data, mapping different input combinations to one output (f). The results obtained from the 1st and 2nd models indicate that the accuracy increases when a nonrelevant parameter (t) is removed from the inputs, showing that using more inputs does not guarantee better training. In contrast, the MSEs of the 3rd and 4th models indicate that the training accuracy degrades slightly when a less influencing feature (z) is omitted; however, removing an important index (x) considerably damages the fitting quality.
Table 2. Example of feature selection. (a) 500 randomly generated dataset
2.2.2. F-test algorithm
The importance of features is weighted by the probabilistic values (P-values) of the F-test statistics. The F-test examines two models, where the first model predicts the considered output Y from a constant and the second model maps that output from the same constant and one input X. Then, the effect of X on Y is evaluated from the differences between the MSEs of the two models. X plays a crucial role in calculating Y if the second model shows a significant improvement compared with the first one, and vice versa. The F-test can only capture linear relations between two parameters, ignoring higher-order correlations.
2.2.3. NCA algorithm
NCA is an evaluation method based on the K Nearest-Neighborhood (KNN) analysis. KNN predicts unseen data based on the closest points in big data. Let us consider two datapoints, A () and B (
), where x and y are the inputs, whereas z is the output. Then, a simple distance function between A and B can be derived as (4).
In (2), z feature is omitted as it is outputs. The distances calculated by (4) treat all inputs equally. Therefore, weight factors are added to (5), emphasizing the importance of the key features.
The NCA feature selection algorithm adjusts the weight factors to maximize the probability that the outputs predicted using the closest points match the target values (Navot et al. Citation2005).
2.2.4. RReliefF
The RReliefF algorithm scores the features by investigating the probability of resulting in two different outputs from two nearest inputs. This method is modified using the feature selection procedure of the classification problem, which is suitable for ranking features in distance-based supervised models (Mathworks Citation2011; Robnik-Šikonja and Kononenko Citation1997).
2.3. Feature scores of structural parameters
In , feature selection scores that affect each other among the 12 design parameters are identified based on the F-test and NCA, respectively, determining dominant features in predicting the design parameters, including section dimensions and rebar ratios, based on the F-test, RReliefF, and NCA.
Table 3. Features and their scores of the 12 parameters based on the F-test method
Table 4. Features and their scores of the 12 parameters based on the NCA selection method
shows the selected features and their scores of the 12 parameters obtained for 20,000 structural datasets based on the NCA method, exploring the relations between the indices. For example, the beam dimensions (b and h) can be omitted in predicting both tensile (ρt) and compressive (ρc) rebar ratios due to the low feature selection scores (purple boxes in ). In contrast, rebar ratios should be included as inputs in trainings on section dimensions because of the high feature scores (blue boxes in ). A detailed investigation of the feature scores is presented in Section 3.
Figure 1. Feature selection based on feature scores
compare the feature scores for predicting the section dimensions and rebar ratios using 20,000 datasets based on F-test, NCA, and RReliefF. Some differences are observed, requiring exploration of the most appropriate method for the considered structural datasets.
Figure 2. Training results based on different feature selection algorithms when b is output
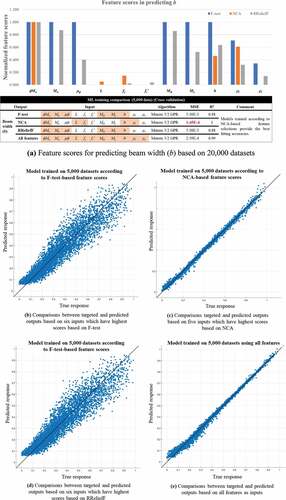
Figure 3. Training results based on different feature selection algorithms when h is output
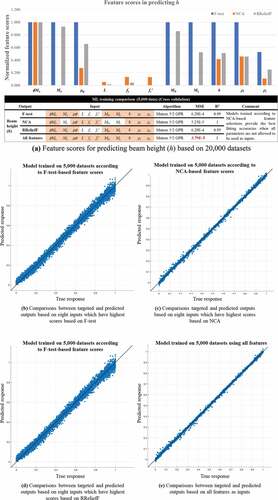
Figure 4. Training results based on different feature selection algorithms when ρt is output
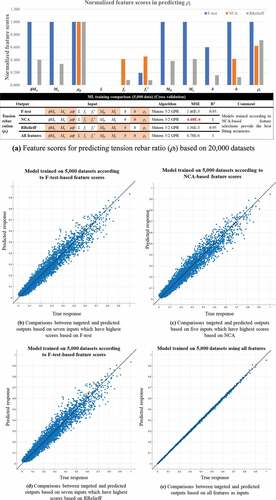
Figure 5. Training results based on different feature selection algorithms when ρc is output
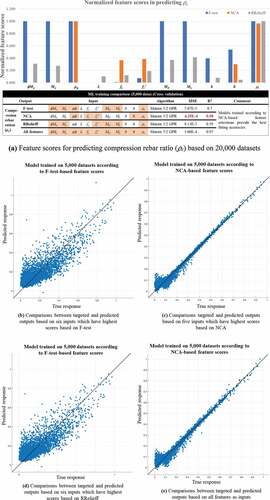
As shown in , the most important features recommended by F-test, NCA, and RReliefF methods are used to train Matern 5/2 GPR models on four outputs (b, h, ρt, ρc). Various GPR models are trained on 5,000 structural data, simultaneously, to select promising models interactively. The diagnostic measures () of the training results are reflected to identify the validated models. The results are compared to identify the most reliable feature selection method for training AI models on structural datasets for the design of doubly RC beams, indicating that NCA is better for training GPR models on structural data than F-test and RReliefF methods in all training results (). In addition, show comparisons between training performed using inputs based on NCA scores and those including all features. NCA captures important indexes, approximating MSE compared with those obtained from training using all features. In this case, the training performed using all 11 features places all parameters as input to predict one output (11 inputs to one output), which is often impossible in reverse scenarios when there is more than one output. Furthermore, NCA-based results demonstrate better accuracy in training on b, ρt, ρc () than those observed when all features are given as inputs.
3. Chained training scheme with Revised Sequence
3.1. Introducing CRS
The CRS concepts are implemented in the present study, with an aim to increase the accuracy of AI-based models by adding features obtained from previous training in the next training. In doing so, this method overcomes the training difficulties incurred by the insufficient input by using features determined from predecessor training as inputs for successor steps. An example is presented to demonstrate the enhancements of training obtained by implementing CRS.
Example: Let us assume the following function:
where
Problem: Given and
, find appropriate values of y and z.
Two Matern 5/2 GPR models are trained using the 500 normalized datasets presented in , where one model is built according to the PTM method and the other is built using the CRS procedure, as shown in .
Table 5. Data for CRS example
Figure 6. Comparisons between PTM and CRS
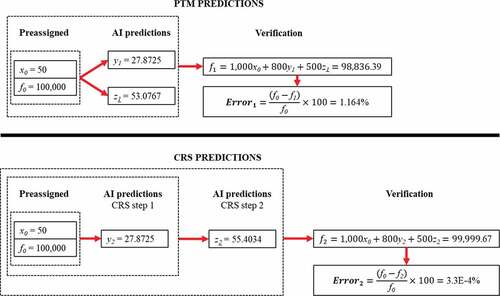
The given problem provides only two known variables ( and
), whereas three knowns are required to determine the exact solutions. A PTM model, therefore, produces an error of 1.164% because its outputs (
and
) are predicted using two preassigned inputs (
and
). In other words, AI results in errors because of the lack of information. In contrast, a CRS model is developed in two steps. First, a value of
is obtained from two knowns (
and
). Then, a value of
is predicted from three knowns, including two preassigned parameters (
and
) and one obtained in the first step (
. A highly precise value of z is obtained, with a negligible error of 3.3E-4%, because AI contains sufficient data (three knowns) to calculate z in the second step. In conclusion, CRS enhances the accuracy of AI-based designs by using the outputs of predecessor steps as inputs of successor steps, adding design constraints to AI as training continues.
3.2. CRS in beam design problems
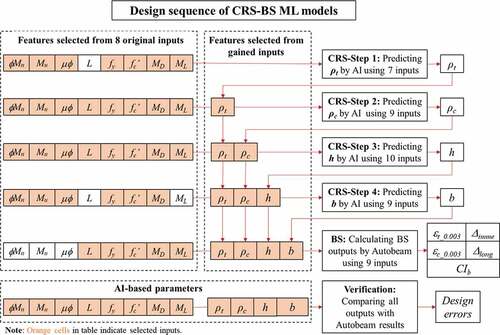
defines the reverse design scenario considered in the present study, where, first, AI determines four design parameters (b, h, ρt, ρc) from eight preassigned inputs (ØMn, Mu, µØ, L, fy, fc’, MD, ML). Then, the parameters controlling the service criteria are calculated by Autobeam using the BS procedure, completing the practical design problem. This scenario requires engineers to directly control the capacities and ductility of beams, which are impractical to be achieved using conventional methods based on iterating forward calculations.
Table 6. Design scenarios
shows the ranges of big data used for training GPR models. The skewness of structural datasets should be avoided to ensure training and design accuracy of regression algorithms. Training is easier if datasets are extracted by similar ranges used for obtaining feature scores.
Table 7. Data ranges
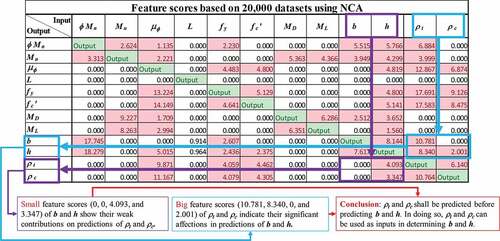
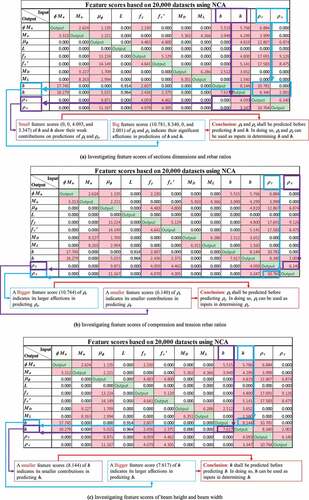
shows the selected features and their scores of the 12 parameters obtained for 20,000 structural datasets based on the NCA feature selection method, exploring reasonable sequences for solving the reverse design scenarios mentioned in . As shown in ), the section dimensions present low scores (purple boxes) in predicting the rebar ratios, whereas high scores of rebar ratios (blue boxes) indicate their significant affections in predictions of section dimensions. Therefore, rebar ratios should be determined first, being employed as inputs for calculating the section dimensions. Similar investigations are presented in , which indicate that ρt must be predicted before ρc and h must be determined before b. Finally, the most appropriate sequence is ρt, ρc, h, b.
Figure 7. CRS sequences based on feature scores
In the present study, a greedy algorithm that automatically simulates the abovementioned investigations for the sequence determinations is developed. Furthermore, the best input combinations and suitable kernel functions for GPR models are determined. The proposed method is applied in the following four steps.
Step 1: Appropriate input combinations and GPR kernel functions are determined by attempting multiple trainings. These trial trainings are conducted using 2,000 datasets to avoid unnecessarily long running time.
Step 1(a): assuming that b is the output for Step 1, eight available inputs (ØMn, Mu, µØ,L, fy, fc’, MD, ML) are scored based on the NCA algorithm ()). These eight combinations are then defined, including one to eight inputs. In each combination, higher score indexes are selected; for example, in the first combination, training uses only one parameter (µØ) with the highest score (6.49), and then the second combination adds the second-highest scored feature (ϕMn – 3.84) to the inputs. Finally, in the eighth combination, all eight parameters are included as inputs.
Step 1(b): each combination defined in Step 1(a) is applied to five different GPR kernel functions (Rational Quadratic, Squared Exponential, Matern 5/2, Exponential, and Matern 3/2), finding the most appropriate training options for each input combination. ) shows the results of tested trainings for the uses of two inputs and seven inputs are used in Step 1. It is noted that test training similar to those in ) or 8(c) shall be repeated eight times to select the most favorable kernel function for each combination of inputs determined in Step 1(a).
Step 1(c): The finest results of from eight combinations of inputs are compared in ), indicating the best training qualities when b is assumed as the output of Step 1.
Step 1(d): Steps 1(a)–1(c) are repeated when h, ρt, and ρc are individually assumed as an output of Step 1. Trainings with these assumptions are presented in .
Step 1(e): compares the best results obtained from , exploring the best output, input combinations, and kernel functions. In this case, ρt is selected as the output for Step 1, six inputs (µØ, fc’, fy, ØMn, ML, MU) are selected, and function Squared Exponential is applied.
Table 8. Trial training for determining the input combination when b is the output of Step 1
Table 9. Trial training for determining the input combination when h is the output of Step 1
Table 10. Trial training for determining input combination when ρt is the output of Step 1
Table 11. Trial training for determining input combination when ρc is the output of Step 1
Table 12. Trial training for determining output for Step 1 (summarizing results of )
Step 2: ρt can be used as an input of Step 2, as it is predicted in Step 1. Thus, Step 2 can use nine parameters (ØMn, Mu, µØ, L, fy, fc’, MD, ML, ρt) as inputs. The feature scores of the inputs, therefore, need to be calculated again using NCA. Then, the procedures individually assume b, h, and ρc as the output of Step 2, testing nine combinations based on feature selections with five different GPR kernel function. summarizes the best training results indicating that the most appropriate output for Step 2 is ρc predicted from nine inputs (ØMn, Mu, µØ, L, fy, fc’, MD, ML, ρt) by the Squared Exponential model.
Table 13. Trial training for determining output for Step 2
Step 3: This step uses 10 parameters (ØMn, Mu, µØ, L, fy, fc’, MD, ML, ρt, ρc) as inputs because ρc is predicted in Step 2. The testing procedures in Steps 1 and 2 are repeated (), indicating that h is the output of Step 3; the most suitable inputs are ØMn, Mu, µØ, L, fy, fc’, MD, ML, ρt, ρc; and function Squared Exponential must be applied.
Table 14. Trial training for determining the output for Step 3
Step 4: this step uses 11 parameters (ØMn, Mu, µØ, L, fy, fc’, MD, ML, ρt, ρc, h) as inputs because h is predicted in Step 3. The testing procedure in Steps 1–3 is repeated, suggesting that ten inputs (ØMn, Mu, µØ, L, fy, fc’, MD, ρt, ρc, h) and the Squared Exponential function must be applied.
The final training scheme is presented in and . The models for the designs are trained on 100,000 datasets using determined training schemes ().
Table 15. Final training scheme for CRS
Table 16. Training results of models for designs
Figure 8. Sequence of CRS-BS ML models
3.3. Design results
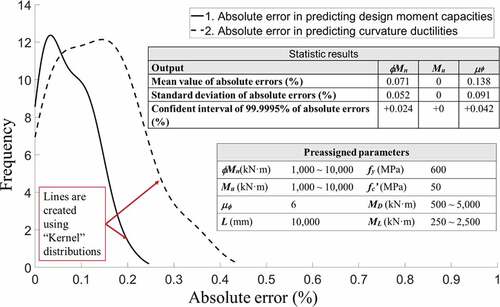
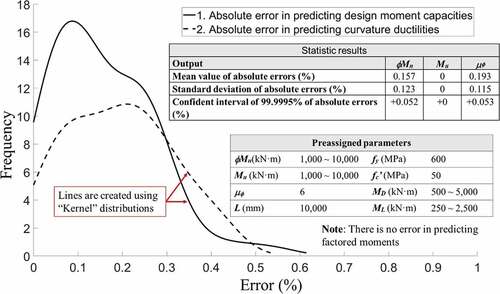
shows four design cases that preassign a safety factor of 1 (Mu = ϕMn) and ductility of 6. The proposed procedures satisfy reverse designs without conducting iterations as those in conventional methods. illustrates beam designed in , it is noted that arranged rebar ratios and section dimensions are rounded up for satisfying constructability. This leads to a slight increasement in a design strength and a curvature ductility. Finally, a beam design is produced using preassigned design strengths and ductility based on (Standard Citation2019). The reliability of AI-based design is proved by a probabilistic investigation (), where 91 designs are conducted, showing that all errors are below 0.5%. In conclusion, accurate predictions of design with reverse parameters can be performed easily and rapidly.
Table 17. Design tables
Figure 9. Illustration of beam designed in (a).
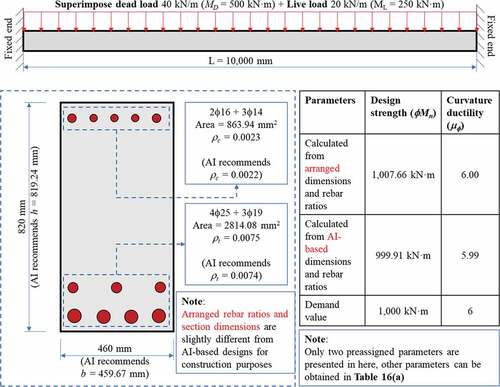
Figure 10. Statistic results of multiple designs
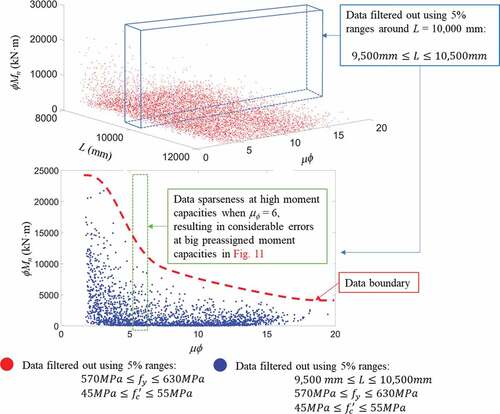
In , significant errors in designs are found for design moment capacity (ϕMn) of 35,000 kN·m, because GPR models are not trained in this range. shows that the smallest errors are generated when the preassigned moment capacities are below 17,000 kN·m. The models start to lose their accuracies rapidly when inputs are placed near the boundaries of big dataset, as shown in (design moment capacity (ϕMn) of 15,000 kN·m). Finally, large errors occur if inputs lie outside the datasets. Considerable errors occur with preassigned values that are not available in the big data. It is necessary to train ML models on extended ranges of structural dataset. However, it needs to be adjusted automatically hierarchically (adjusting inputs to minimize design errors to improve accuracy) when inappropriately preassigned inputs are implemented when cross-relations between inputs are not known.
Table 18. Design using out of ranges moment values
Figure 11. Design errors of AI at various preassigned moment capacities
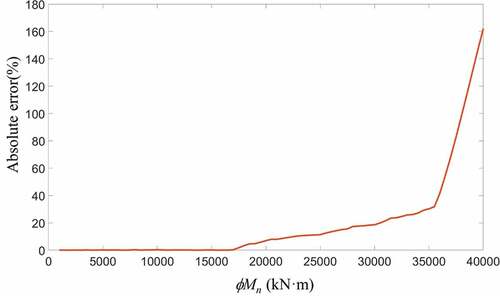
Figure 12. Data sparseness
3.4. Data updating procedures
clearly indicates that performances of AI models heavily rely on training data. Therefore, an AI-based design method shall provide sufficient flexibility for the change of design ranges and regulations because it is impractical to generate a bigdata which cover all ranges of parameters and codes. In the proposed GPR-CRS training and designing procedures, all the modifications in design requirements and parameters must be reflected in training bigdata. Results in show that the introduced processes still provide reliable accuracies (less than 0.7 errors) when design code is changed from ACI 318–19 (Standard Citation2019) to ACI 318–14 (Standard Citation2014).
Figure 13. Statistic results of multiple designs based on ACI 318–14
4. Conclusion
In this study, comprehensive designs of doubly RC beams satisfying preassigned flexural capacity and ductility are provided by CRS-based GPR models and BS procedures. Feature selection algorithms are used in a greedy algorithm to determine reasonable input combinations and output sequences. The results indicate considerable enhancements in training and designing qualities, offering acceptable errors in 91 trial interpolation designs. The following conclusions are drawn.
A practical design problem of doubly RC beams is addressed. Section dimensions and rebar ratios can be directly predicted by GPR regression models according to the preassigned moment capacities and curvature ductility. Furthermore, parameters controlling structural serviceability are calculated by nonlinear beam analyses in BS procedures.
Five different GPR models using different kernel functions are tested for each training, providing the most suitable options for each training.
Three feature selection algorithms (F-test, NCA, and RReliefF) are implemented in structural data, weighing the influences among the design parameters. Low MSE values indicate that most of the important features are captured by NCA, whereas training qualities provided from the inputs suggested by F-test and RReliefF are weaker. In general, accuracies obtained from training using five to seven inputs recommended by NCA are approximately equal to those obtained from training using all 11 inputs. Using all 11 parameters as inputs is impossible in practical designs where there is more than one unknown index.
The CRS technique is implemented in training and design processes, employing outputs of one step as inputs for its successors. In doing so, more constraints are added after each prediction, enhancing the accuracy as training continues.
A greedy algorithm that comprises multiple test trainings based on feature selection scores is proposed, determining the most appropriate input combinations, sequences, and GPR kernel functions for regression models.
The proposed models should not be applied to extrapolation designs as considerable errors are expected when out-of-range inputs are given. In addition, users should also be aware of the input conflicts, which occurs when multiple parameters are preassigned, violating correlations between indexes.
Acknowledgments
This work was supported by the National Research Foundation of Korea (NRF) grant funded by the Korean government (MSIT 2019R1A2C2004965).
Disclosure statement
No potential conflict of interest was reported by the author(s).
Correction Statement
This article has been republished with minor changes. These changes do not impact the academic content of the article.
Additional information
Funding
Notes on contributors
Won-Kee Hong
Dr. Won-Kee Hong is a Professor of Architectural Engineering at Kyung Hee University. Dr. Hong received his Masters and Ph.D. degrees from UCLA, and he worked for Englelkirk and Hart, Inc. (USA), Nihhon Sekkei (Japan), and Samsung Engineering and Construction Company (Korea) before joining Kyung Hee University (Korea). He also has professional engineering licenses from both Korea and the USA. Dr. Hong has more than 30 years of professional experience in structural engineering. His research interests include new approaches to construction technologies based on value engineering with hybrid composite structures. He has provided many useful solutions to issues in current structural design and construction technologies as a result of his research combining structural engineering with construction technologies. He is the author of numerous papers and patents, both in Korea and the USA. Currently, Dr. Hong is developing new connections that can be used with various types of frames, including hybrid steel-concrete precast composite frames, precast frames, and steel frames. These connections would contribute to the modular construction of heavy plant structures and buildings as well. He recently published a book titled “Hybrid Composite Precast Systems: Numerical Investigation to Construction“ (Elsevier).
Tien Dat Pham
Tien Dat Pham received a Master’s degree from Seoul National University of Science and Technology. He is currently enrolled as a Ph.D. student in the Department of Architectural Engineering at Kyung Hee University, Republic of Korea. His research interest includes structural analyses using numerical methods considering material plasticity. Furthermore, his studies also involve developing optimal designing methods based on machine learning and genetic algorithms.
References
- Alacalı, S. N., B. Doran, and B. Akbas. 2006, September. “Predicting Lateral Confinement Coefficient for R/C Rectangular Columns by a Neural Network Model.” In EAEE, First European Conference on Earthquake Engineering and Seismology. Geneva, Switzerland.
- Al-Rahmani, A. H., H. A. Rasheed, and Y. Najjar. 2013. “Intelligent Damage Detection in Bridge Girders: Hybrid Approach.” Journal of Engineering Mechanics 139 (3): 296–304. doi:10.1016/(asce)em.1943-7889.0000536.
- Behnood, A., and E. M. Golafshani. 2020. “Machine Learning Study of the Mechanical Properties of Concretes Containing Waste Foundry Sand.” Construction and Building Materials 243: 118152. doi:10.1016/j.conbuildmat.2020.118152.
- Botchkarev, A. 2019. “A New Typology Design of Performance Metrics to Measure Errors in Machine Learning Regression Algorithms.” Interdisciplinary Journal of Information, Knowledge, and Management 14 (January): 45–76. doi:10.28945/4184.
- Cai, B., G. L. Pan, and F. Fu. 2020. “Prediction of the Postfire Flexural Capacity of RC Beam Using GA-BPNN Machine Learning.” Journal of Performance of Constructed Facilities 34 (6): 04020105. doi:10.1016/(ASCE)CF.1943-5509.0001514.
- Dehkordi, B. Z., R. Abdipour, S. Motaghed, A. K. Charkh, H. Sina, and M. S. Shahid Zad. 2012. “Reinforced Concrete Frame Failure Prediction Using Neural Network Algorithm.” Journal of Applied Sciences 12 (5): 498–501. doi:10.3923/jas.2012.498.501.
- Hong, W. K. 2019. Hybrid Composite Precast Systems: Numerical Investigation to Construction. Cambridge, USA: Elsevier Woodhead Publishing.
- Hore, S., S. Chatterjee, S. Sarkar, N. Dey, A. S. Ashour, D. Balas-Timar, and V. E. Balas. 2016. “Neural-based Prediction of Structural Failure of Multistoried RC Buildings.” Structural Engineering and Mechanics 58 (3): 459–473. doi:10.12989/sem.2016.58.3.459.
- Hoshyar, A. N., S. Kharkovsky, S. Taghavipour, B. Samali, and R. Liyanapathirana. 2017, November. “Structural Damage Detection of a Concrete Based on the Autoregressive All-pole Model Parameters and Artificial Intelligence Techniques.” In Proceedings of the 9th International Conference on Signal Processing Systems (57–61). Auckland, New Zealand. doi:10.1145/3163080.3163120.
- Hoshyar, A. N., B. Samali, R. Liyanapathirana, A. N. Houshyar, and Y. Yu. 2020. “Structural Damage Detection and Localization Using a Hybrid Method and Artificial Intelligence Techniques.” Structural Health Monitoring 19 (5): 1507–1523. doi:10.1177/1475921719887768.
- Kang, F., S. Han, R. Salgado, and J. Li. 2015. “System Probabilistic Stability Analysis of Soil Slopes Using Gaussian Process Regression with Latin Hypercube Sampling.” Computers and Geotechnics 63: 13–25. doi:10.1016/j.compgeo.2014.08.010.
- Kang, F., and J. Li. 2020. “Displacement Model for Concrete Dam Safety Monitoring via Gaussian Process Regression considering Extreme Air Temperature.” Journal of Structural Engineering 146 (1): 05019001. doi:10.1061/(asce)st.1943-541x.0002467.
- Kang, F., J. Li, and J. Dai. 2019. “Prediction of Long-term Temperature Effect in Structural Health Monitoring of Concrete Dams Using Support Vector Machines with Jaya Optimizer and Salp Swarm Algorithms.” Advances in Engineering Software 131 (January): 60–76. doi:10.1016/j.advengsoft.2019.03.003.
- Kohiyama, M., K. Oka, and T. Yamashita. 2020. “Detection Method of Unlearned Pattern Using Support Vector Machine in Damage Classification Based on Deep Neural Network.” Structural Control & Health Monitoring 27 (8): e2552. doi:10.1002/stc.2552.
- Mathworks. 2011. “Introduction to Feature Selection (R2021a).” Accessed 2 April 2021 https://uk.mathworks.com/help/stats/feature-selection.html
- MathWorks. 2021a. “Assess Model Performance in Regression Learner.” Accessed 2 June 2021 https://uk.mathworks.com/help/stats/assess-model-performance-in-regression-learner.html#mw_a8461b28-5e60-468b-93f5-268001183bbe
- MathWorks. 2021b. Select Data and Validation for Regression Problem. Accessed June 2. https://uk.mathworks.com/help/stats/select-data-and-validation-for-regression-problem.html
- Melville, J., K. S. Alguri, C. Deemer, and J. B. Harley.2018April. “Structural Damage Detection Using Deep Learning of Ultrasonic Guided Waves.” AIP Conference Proceedings. Dale E. Chimenti and Leonard J. Bond. (eds.) Vol. 1949, No. 1,230004. AIP Publishing LLC. doi:10.1063/1.5031651.
- Mitropoulou, C. C., and M. Papadrakakis. 2011. “Developing Fragility Curves Based on Neural Network IDA Predictions.” Engineering Structures 33 (12): 3409–3421. doi:10.1016/j.engstruct.2011.07.005.
- Naeej, M., M. Bali, M. R. Naeej, and J. V. Amiri. 2013. “Prediction of Lateral Confinement Coefficient in Reinforced Concrete Columns Using M5′ Machine Learning Method.” KSCE Journal of Civil Engineering 17 (7): 1714–1719. doi:10.1007/s12205-013-0214-3.
- Naser, M. Z. 2018. “Deriving Temperature-dependent Material Models for Structural Steel through Artificial Intelligence.” Construction and Building Materials 191: 56–68. doi:10.1016/j.conbuildmat.2018.09.186.
- Naser, M. Z., and A. Alavi. 2020. “Insights into Performance Fitness and Error Metrics for Machine Learning.” arXiv Preprint arXiv 2006: 00887.
- Navot, A., L. Shpigelman, N. Tishby, and E. Vaadia. 2005. “Nearest Neighbor Based Feature Selection for Regression and Its Application to Neural Activity.” Advances in Neural Information Processing Systems 18: 996–1002.
- Nguyen, N., and H. Hong. 2019. “Part I: The Analytical Model Predicting Post-Yield Behavior of Concrete-Encased Steel Beams considering Various Confinement Effects by Transverse Reinforcements and Steels.” Materials 12 (14): 2302. doi:10.3390/ma12142302.
- Olalusi, O. B., and P. O. Awoyera. 2021. “Shear Capacity Prediction of Slender Reinforced Concrete Structures with Steel Fibers Using Machine Learning.” Engineering Structures 227 (November): 2020. doi:10.1016/j.engstruct.2020.111470.
- Rafiei, M. H., and H. Adeli. 2017. “A Novel Machine Learning‐based Algorithm to Detect Damage in High‐rise Building Structures.” The Structural Design of Tall and Special Buildings 26 (18): e1400. doi:10.1002/tal.1400.
- Robnik-Šikonja, M., and I. Kononenko. 1997, July. “An Adaptation of Relief for Attribute Estimation in Regression.” In Machine Learning: Proceedings of the Fourteenth International Conference (ICML’97) Nashville, Tennessee, USA, (Vol. 5, pp. 296–304).
- Shyamala, P., S. Mondal, and S. Chakraborty. 2016. “Detection of Damage in Beam from Measured Natural Frequencies Using Support Vector Machine Algorithm.” Advance in Dynamics, Vibration and Control 06-310. 306-311.
- Standard, A. A. 2014. Building Code Requirements for Structural Concrete (ACI 318–14). In American Concrete Institute. 38800 Country Club Drive Farmington Hills, MI 48331.
- Standard, A. A. 2019. Building Code Requirements for Structural Concrete (ACI 318–19). In American Concrete Institute. 38800 Country Club DriveFarmington Hills, MI 48331.
- Sun, H., H. V. Burton, and H. Huang. 2020. “Machine Learning Applications for Building Structural Design and Performance Assessment: State-of-the-art Review.” Journal of Building Engineering. doi:10.1016/j.jobe.2020.101816.
- Tibaduiza, D., M. Á. Torres-Arredondo, J. Vitola, M. Anaya, and F. Pozo. 2018. “A Damage Classification Approach for Structural Health Monitoring Using Machine Learning.” Complexity 2018: 1–14. doi:10.1155/2018/5081283.
- Yan, B., Y. Cui, L. Zhang, C. Zhang, Y. Yang, Z. Bao, and G. Ning. 2014. “Beam Structure Damage Identification Based on BP Neural Network and Support Vector Machine.” Mathematical Problems in Engineering 2014. doi:10.1155/2014/850141.
- Zhang, Y., and H. V. Burton. 2019. “Pattern Recognition Approach to Assess the Residual Structural Capacity of Damaged Tall Buildings.” Structural Safety 78: 12–22. doi:10.1016/j.strusafe.2018.12.004.