
ABSTRACT
This study contributes to our understanding of children's development of map-reading skills through a systematic ‘step-by-step approach’. Utilising an ecological research design, we investigated how children perceive and utilise maps in a large-scale outdoor environment. A total of 156 children, aged 5–11 (both boys and girls), participated in the study, tasked with locating ten controls in the terrain using five different types of maps. The study measured accuracy in wayfinding (the number of correctly identified controls) and efficiency in wayfinding (the time spent on the task). The results revealed that children exhibited better mastery of perspective maps compared to symbolic maps, with older children demonstrating significantly greater proficiency with symbolic maps than younger children. Notably, there were no significant differences in performance between boys and girls.
Introduction
To most people using a map appears to be a straightforward and quite natural task, despite map-related pedagogy being poorly developed (Keates Citation1996; Wiegand Citation2005). In primary school, children are supposed to become familiar with maps and learn how to use them for wayfinding, and thereby become skilled map-readers. However, according to Kvaase (Citation1999) and Wiegand (Citation2006), this is an area that has not been given sufficient priority in primary school teaching, despite the requirements and prerequisites of the curriculum. Many teachers mistakenly believe that map-reading is easy for children, but children often struggle with using and reading maps (Wiegand Citation2006; Liben Citation2009).
A study in the Czech Republic found little consistency in the development of map skills, indicating a weak connection between the intended and actual curriculum. The main issue identified was the difficulty in establishing clear learning objectives for specific lessons (Štolcová, Hanus, and Řezníčková Citation2023). In Norway, the development of children's map understanding is implemented in the primary school curriculum: ‘create and use maps to orientate in familiar terrain’ (stages 1–4); and ‘use maps, digital tools, and natural signs to orient themselves in nature and the local environment’ (stages 5–7). The basic skill of being able to map-read includes being able to use simple maps and photos (Norwegian Directorate of Education and Training [NDET]) (Utdanningsdirektoratet Citation2022).
Few studies have undertaken a comprehensive examination of children's varying abilities across different age groups in interpreting a range of map types (Sigurjónsson Citation2007; Bjerva and Sigurjónsson Citation2016). Malinowski and Gillespie (Citation2001) pointed out that little research had been carried out in real-world settings, although the number of studies based on large-scale maps in a real-world setting has increased (Bjerva and Sigurjónsson Citation2016). Wiegand (Citation2006) argues that there is a need for more appropriate practical map research activities. Havelková and Hanus (Citation2019) did a systematic review of map skills in education and divided map skills into reading, analysis, interpretation and drawing. Upon examining the conclusions of this review article, it is noted that ‘ … there are also external factors and factors relating to the map characteristics which also have an effect on map skills (e.g. map skill tested, teaching method and map complexity).’ (Havelková and Hanus Citation2019). This underscores the importance of further research in this domain.
The main purpose of the present study is to shed light on how children read and understand maps and to explore the effectiveness of a progressive learning approach in developing children's map-reading skills. Very few children can demonstrate the most basic orienteering skills and struggle to understand traditional orienteering maps (Mikkelsen and Sætre Citation2022; Liben Citation2009; Bjerva, Græsli, and Sigurjónsson Citation2011). Learning through traditional orienteering maps may therefore discourage children from using them to navigate unfamiliar terrain. An alternative is to use other representations of maps in the context of children's education. This research addresses the existing gap in the field by systematically examining children's abilities to master different map representations and by providing insights into the potential navigational capabilities offered by maps in the context of unfamiliar terrain. Additionally, the study seeks to inform and improve map-related pedagogy in schools by emphasising a step-by-step approach to map-reading skills, tailored to the cognitive developmental stage of learners.
The study investigates the extent to which children aged 5–11 master various types of map representations while locating specific control points within their school area. The following sub-objectives were formulated:
To what extent does the use of different map types affect children’s ability to find a correct control point? and
How much time is spent on the task by those who find the control point?
The study has focus on progressive map-related pedagogy in school and its emphasis on the incremental approach to map understanding and a practical map research activities based on large-scale maps in a real-world setting. This set it apart from other studies in terms of its design and methodology. To our knowledge, this is the first study related to children's map understanding that includes a range of map representations applied in a real-world setting to a large group of schoolchildren, and that is analysed statistically.
A step-by-step approach to maps
A map is a diminished representation of reality that is usually derived from a vertical perspective with an isomorphic spatial representation of reality (Bjerva and Sigurjónsson Citation2016). Symbolic maps are based on given conventions, and it is vital to know and interpret these to understand the map. The map thus becomes an artificial construction of reality that must be decoded to be used as an information source to interpret and understand reality. Utilising and mastering a symbolic map can be very difficult, especially for beginners and those with little prior knowledge and familiarity with the given conventions (Sigurjónsson Citation2007). Although mastering symbols is seen as a universal task, it is not easy to achieve (DeLoache, Pierroutsakos, and Uttal Citation2003).
Relatively little is known about how maps are designed for different skill levels and age groups with varying experience (Wiegand Citation2006). Kimerling et al. (Citation2016) describes a map as ‘a graphical representation of the environment that shows relations between geographic features’. According to www.dictionary.com (Citation2019), a map can be described as ‘a representation, usually on a flat surface, of the features of an area of the earth or a portion of the heavens, showing them in their respective forms, sizes, and relationships according to some convention of representation’. In other words, maps represent physical space, the objects in that space, and the spatial relationship between them (Ottosson Citation1987; Sigurjónsson Citation2007). This last definition and understanding of maps allow for an expansive interpretation that includes a wide range of representations. However, maps are traditionally perceived as symbolic representations, containing abstractions of reality, based on given conventions. Although map education needs to cover symbolic maps using abstract symbols (Sigurjónsson Citation2007; Johansen Citation1999; Kaarby Citation1997), it is important to be aware that interacting with a symbolic map that incorporates particular conventions can be very difficult, especially for beginners (Sigurjónsson Citation2007).
How maps are introduced to children is not uniform across schools, but one common feature is that it takes place in the classroom (Blades and Spencer Citation1986). The reason for this may be a perception that the classroom is the best arena to introduce children to an understanding of the concepts of projection, scale, and symbols, or that it is less resource-intensive for the teacher (Kaarby Citation1997). That said, Ottosson (Citation1988) argued that orientation training should not start with projection, scale, or symbols.
A relevant question concerns the extent to which children perceive, understand, and master a symbolic map. Are such maps adapted to children, or should educators make maps even more concrete and child-friendly? For example, aerial photography may be an appropriate approach to learning symbolic maps (Plester, Blades, and Spencer Citation2003). Traditionally, understanding maps was based on the proviso that a perspective shift is required (Blades and Spencer Citation1987; Bluestein and Acredolo Citation1979), that is, seeing the map as a representation of the landscape in vertical view. Map-reading and map-learning strategies are largely based on maps in vertical view. Ottosson (Citation1987) claimed that a map is not based on a particular perspective view – it is not a picture of the earth taken from above – and a map as it appears is a more direct representation of reality than a picture.
Different viewing points
The viewing point of a map influences the ability to understand maps. There are three different viewing points: ground horizontal (e.g. eye-level photographs), aerial oblique (e.g. sketches or photographs from an oblique angle), and aerial vertical (e.g. sketches or a map from a vertical perspective) ().
Figure 1. The three main viewing points in geospatial images (Kettunen et al. Citation2012. CC BY 4.0).
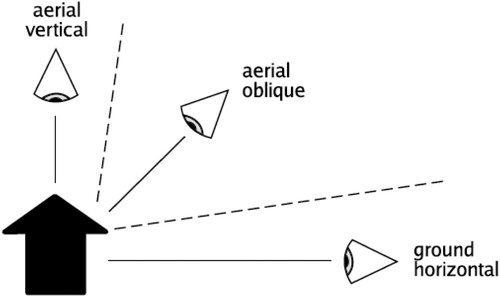
Aerial photography has been used as a type of map for children for both educational and research purposes (Plester et al. Citation2002; Plester, Blades, and Spencer Citation2003; Wiegand Citation2006; Kim, Bednarz, and Kim Citation2012). Although results are somewhat ambiguous, studies generally show that children are able to understand and use large-scale aerial photographs. Plester and colleagues (Citation2002) also investigated the relationship between vertical and oblique points of view and show that children are more likely to use oblique photos before using vertical photos. This finding emphasises that it is overall easier for children to interpret an oblique photograph than a vertical photograph (Downs, Liben, and Daggs Citation1988; Plester et al. Citation2002; Robison and Spodek Citation1967; Sigurjónsson Citation2007). A pictorial map in an oblique perspective largely provides the same information as in the real world (DeLoache, Pierroutsakos, and Uttal Citation2003) and, in conjunction with oblique photography, likely portrays a more realistic representation of the real world, thereby making it easier for children to see the relationship between the map and the terrain. A study conducted by Sigurjónsson, Bjerva, and Græsli (Citation2020) on children's map-reading abilities with maps in different viewing points revealed minimal or no differences in performance between boys and girls. Corresponding studies also show no gender differences when children use large-scale maps with different viewing angles (Catela et al. Citation2019; Heil Citation2019).
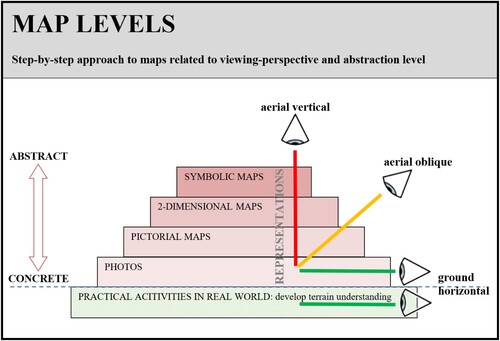
Map levels
The ‘Map levels’ (Sigurjónsson, Græsli, and Bjerva Citation2022), as is a revised model of Bjerva, Græsli, and Sigurjónsson (Citation2010), shows how map-reading skills can be developed systematically and concretely (). The model is based on early experiences and investigations of children's ability to read maps (Sigurjónsson, Bjerva, and Solbakken Citation2008; Sigurjónsson Citation2007; Downs, Liben, and Daggs Citation1988; Liben and Downs Citation1989). The approach contains five steps, where one step should be mastered before progressing to the next.
Figure 2. Map levels. Step-by-step approach to maps (Sigurjónsson, Græsli, and Bjerva Citation2022).
Practical activities in the real world
Practical activities in the real world provide children with experiences of different types of terrain. Through play, they gain understanding and knowledge of various details in the terrain. In the map-reading process, it is crucial to understand how the map corresponds to the real-world reference system. Through practical activities in the immediate area, a good foundation for the use of maps is formed (Wiegand Citation2006; Bjerva, Græsli, and Sigurjónsson Citation2011). For children up to about age 6, activities in the local area can establish the prerequisite concepts for map understanding (Wiegand Citation2006).
The following four steps involve introducing different types of maps, aiming to establish a progression from concrete and logical maps to symbolic and abstract maps, based on adopted conventions (Bruner Citation1966).
Eye-level photographs
The beginning of this hierarchy is eye-level photographs in a horizontal view. Pictures provide much of the same information as a real-world view, so there is no need for special skills to see the relationship between photos and the real world (Gibson Citation2014). However, with more complex pictures, it can be quite challenging for children to achieve a full understanding (DeLoache, Pierroutsakos, and Uttal Citation2003b). It is not complicated to understand a photo of a single detail (e.g. a door, a climbing wall, or a play frame). Studies show that children from 3 years old can navigate to the specified details of a detail photo compared with symbolic maps (Blades and Roberts Citation2000; Sigurjónsson Citation2007). A study of schoolchildren aged 3–11 years shows that they can interpret a detail photo, even though this process is at the very beginning of their learning process (Bjerva, Græsli, and Sigurjónsson Citation2011). Thus, children can decode detail photos directly, and the map-reader can acquire meaningful content with few specific problems (Sigmundsson and Haga Citation2005).
Perspective representation (photos and pictorial maps)
Photos and pictorial maps are views of the terrain from above, but the representation is from an oblique angle of view, which makes recognition of detail in the environment more accessible. In such perspective representation (both photos and sketches), children are presented with a large-scale, concrete map of the environment (DeLoache Citation1995; Sigurjónsson Citation2007). Plester, Blades, and Spencer (Citation2003) used oblique and vertical photographs and oblique sketches as symbolic representations in a study of children aged 5–6 years, where they were tasked with finding controls. The results show that children found controls more easily with oblique photographs than those with a vertical projection. The experiment consistently showed that the children had good abilities to use overview photos and sketches. Early research indicates that it is easier for children to see the environment in an oblique view than to imagine the terrain from a vertical view (Plester, Blades, and Spencer Citation2003; Downs, Liben, and Daggs Citation1988; Robison and Spodek Citation1967). With an oblique view, children can easily recognise particular details on a map. A sketch or a photo may include perspective representation in an oblique projection (Plester et al. Citation2002; Plester, Blades, and Spencer Citation2003). A perspective sketch representation makes it possible to recognise details without further interpretation. Unlike random words, symbols using perspective sketch representation are iconically motivated in the way that some features of the symbol match some features of the referent, as when blue is used to indicate water (Liben and Yekel Citation1996).
Two-dimensional (vertical) maps
Maps are a vertical representation and can be in the form of aerial photos or a hand-drawn map with lifelike colours and concrete symbols (Kastens and Liben Citation2010). In several studies using vertical representations, children are being asked to use aerial photos to identify and find markings (Plester et al. Citation2002; Plester, Blades, and Spencer Citation2003; Kim, Bednarz, and Kim Citation2012). In Stea et al. (Citation2004), children aged 3–5 years using a planar projection map found hidden objects significantly more often than children not using maps. At this level, it is important to give children a representation that is largely similar to the real world. As noted, this can best be achieved using photos or maps that coincide with reality by using concrete symbols and colours that are like the real world.
Symbolic maps
The final step is using maps based on a symbolic representation, e.g. orienteering maps regulated by international conventions related to symbols and colours (International Orienteering Federation Citation2017). Although mastering symbols is a universal competence, it is not straightforward. DeLoache, Pierroutsakos, and Uttal (Citation2003, 115) note: ‘The younger the child, the more he or she tends to focus on the concrete object itself, consequently failing to appreciate its abstract relation to what it stands for’ (i.e. the symbolic map). In particular, young children find symbolic maps in plan form difficult to understand (Liben and Yekel Citation1996).
Through this step-by-step approach, children gradually build up an understanding of how the symbolic map is a representation of the real world.
Materials and methods
Experiment area and participants
An ecological approach was chosen to gain insight into children's ability to use different types of maps for wayfinding in the environment. An ecological approach implies that ‘a phenomenon is observed in its natural social environment’ (Hellevik Citation2002). Regarding the choice between a known or unknown experiment area, Liben (Citation2008, 23) emphasise the following:
It is important to develop children's basic representational and spatial concepts by first using representations of familiar environments in which children live and move, such as the classroom, school and local neighbourhood before turning to representations of distant, large, and unfamiliar environments.
Table 1. Participants.
Research design
Five different types of representations based on ‘Map levels’ were implemented () (Sigurjónsson, Græsli, and Bjerva Citation2022):
Ten different eye-level photographs
oblique photographs
pictorial maps consisted of oblique sketch maps of the school area
2-dimensional maps comprised vertical hand-drawn maps using authentic colours and a mix of abstract and concrete symbols
symbolic maps comprised vertical abstract orienteering maps that used symbols related to established conventions (International Orienteering Federation Citation2017)
Table 2. Different types of representations based on Map Levels. First line represents terms in ‘Map Levels’, while second line represent map-names used in the experiment.
The following steps outline the process for completing the tasks:
Each child received a booklet with five different representations, each containing only one control marked
The order of representations for all children was as follows:Horizontal detail eye-level photographs > Oblique photographs > Oblique sketch maps > Vertical hand-drawn maps > Vertical orienteering maps
Each child started at different controls
Each child performed the task twice, with a new booklet and five new/different controls for the second round
An average of the two observations for each representation was calculated
The controls were placed in specific locations in the school area without any code. A ‘miss’ was defined as when a child failed to find the control or the correct control. Controls were placed in a fan position related to the start/finish point (i.e. the same place). shows the number of observations for each category of gender, age group, and map type.
Table 3. Sample according to independent variables: gender, age group, and map type.
Statistical analyses
Two-way analysis of variance (ANOVA) was performed to analyse statistically (1) the degree to which children found the (correct) control, and (2) the time they took to find the marked control, in relation to age group, gender, and map type. Two distinct ANOVAs were conducted for (1) and (2). In cases where the overall ANOVA test yielded significance, multiple comparison methods were applied to establish pair-wise comparisons. Specifically, the Tukey's Honestly Significant Difference (HSD) post hoc test was used to identify any statistically significant pair-wise differences. All statistical analyses were performed using RStudio, version 1.4.1103 (2021).
Results
Children failing to find the correct control points
The ANOVA results, highlighting challenges in locating correct control points and examining the influence of map types and age on children's success or failure, are detailed in . Although the results indicate no significant gender differences, the ANOVA output shows significant differences between age group and map type. It also shows a significant difference in the interaction term between map type and age group.
Table 4. Analysis of variance: identification of correct and % of missed controls.
Based on the above findings, Tukey's HSD multiple comparisons of means were performed () to find the basis for these significant differences related to age group and map type. graphically presents the percentage of missed controls according to map type and age group.
Figure 3. Percentage of missed controls by map type and age group.
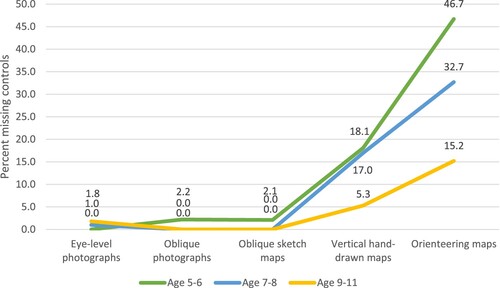
Table 5. Tukey's multiple comparisons of means: identification of correct and % of missed controls.
In exploring the impact of age groups on children's proficiency in locating controls, distinct patterns emerge. As depicted in , the overall mean percentage of missed controls is 9.1%. Examining age-specific breakdowns reveals percentages of 13.9% for children aged 5–6 years, 10.0% for those aged 7–8 years, and 4.4% for children aged 9–11 years.
Narrowing the focus to whether children miss the control points, considering both map type and age, it becomes apparent that age-related differences significantly escalate when transitioning from concrete and logical maps to symbolic and abstract ones. Delving deeper into the details, children's communication with eye-level photographs and their ability in wayfinding using this representation produced relatively equivalent results across groups. Almost all participants understood this kind of representation, and wayfinding using eye-level photographs was successful (just 1.0% overall mean percentage of missed controls).
Perspective representations (oblique photographs and oblique sketch maps) produced similar results, and only a minority of the youngest age group (aged 5–6 years) missed controls. In short, children handle this type of representation well (just 0.6–0.7% overall mean percentage of missed controls).
For the next map level, the vertical hand-drawn maps, the percentage of missed controls increased (13.0% overall mean percentage of missed controls). By age group, the two youngest groups combined (aged 5–8 years) missed 17–18% of controls, whereas only 5.3% of the oldest age group (aged 9–11 years) did so. Statistically significant differences in missed controls were observed between oblique sketch maps and vertical hand-drawn maps, both in the overall analysis and within the two youngest age groups.
For orienteering maps, the overall percentage of missed controls increased sharply to 30.5%. In particular, the youngest children (aged 5–6 years) had problems locating the controls with nearly half of their attempts (46.7%) failing, and in the middle age group (aged 7–8 years), around one-third of their attempts (32.7%) failed. By contrast, in the oldest age group (aged 9–11 years), only 15.2% failed. The differences in percentages of missed controls between the three age groups were statistically significant for this map type ().
Time taken to find control points
Shifting the focus from whether children found the controls (as discussed in the preceding section) to the wayfinding time across the controls in this section, the results remain relatively consistent. displays the ANOVA results for wayfinding time across different controls. While no gender differences were observed, statistically significant variations were identified among age groups and map types.
Table 6. Analysis of variance: time taken to find the control points.
Tukey's HSD multiple comparisons of means were performed to identify the basis for these significant differences (). presents graphically the average time spent to find the control points depending on map type and age group.
Figure 4. Average time (seconds) taken to find control points by map type and age group.
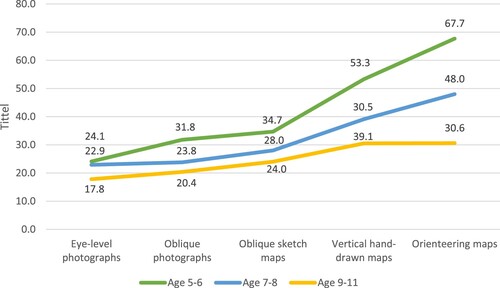
Table 7. Tukey's multiple comparisons of means: time taken to find the control points (in seconds).
indicates that the overall mean time spent to find the control points was 30.5 s. From the oldest to the youngest age groups, there was an increase of 6–8 s: from 24.4 s (aged 9–11 years) to 30.7 s (aged 7–8 years) and 38.7 s (aged 5–6 years). The time spent increased gradually based on the complexity of the map level: the average increases from the oblique sketch maps to the vertical hand-drawn maps were statistically significant ().
There were minor age-related differences in the time spent wayfinding with eye-level photographs, with a mean for all groups of 21.3 s. Oblique photographs produced more obvious differences, and there was an increase in the time spent wayfinding for all groups. Nevertheless, the mean for all groups was less than 32 s: 20.4 s (aged 9–11 years), 23.8 s (aged 7–8 years), and 31.8 s (aged 5–6 years). The time spent wayfinding the controls also increased at the next level, that is, from oblique photographs to oblique sketch maps, with an increase of 3–4 s in each category: 24.0 s (aged 9–11 years), 28.0 s (aged 7–8 years), and 34.7 s (aged 5–6 years). For the vertical hand-drawn maps, in addition to an overall increase in average time spent on wayfinding controls, the results confirm that this increase occurred mainly in the younger age groups: 39.1 s (aged 7–8 years) and 53.3 s (aged 5–6 years), which represents a gap of 18.6 s (aged 5–6 years) and 11.1 s (aged 7–8 years) from the previous level (oblique sketch maps). There was a minor increase in the oldest group of 6.5 s (aged 9–11 years). At the final map level, the orienteering maps, this increasing tendency in time spent wayfinding the controls was further strengthened: 48.0 s (aged 7–8 years) and 67.7 s (aged 5–6 years). The differences between groups at this map level were all statistically significant.
Discussions and concluding comments
Summary of findings
Our analysis of the results from 156 schoolchildren aged 5–11 years, reveals that a child's age significantly impacts their map understanding capabilities, as measured by their ability to find fixed control points and the duration required to accomplish this task. The results also show that the complexity and abstractness of different map types influenced children's wayfinding abilities: Maps that were more symbolic, abstract, and offered vertical viewpoints notably heightened the instances of missed controls and extended the time invested in locating them. Vertical viewpoint maps, especially symbolic maps with the extensive use of symbols, highlighted the clear differences between the age groups. It should be observed that the results do not reveal any discernible differences between boys and girls concerning their map understanding and utilisation capabilities, which is consistent with previous research (Catela et al. Citation2019; Heil, C. 2019; Sigurjónsson, Bjerva, and Græsli Citation2020).
Implications for map education in physical education in primary school
Early studies have consistently indicated that grasping the complexity of an orienteering map can be challenging without prior map knowledge (for instance, see Wiegand Citation2006; Sigurjónsson Citation2007; and DeLoache, Pierroutsakos, and Uttal Citation2003). Our findings align with the foundational principles discussed by Gibson (Citation2014). These principles emphasise that photographs serve as intuitive and immediate representations of the real world, capturing recognisable details essential for fostering initial map comprehension in children. The ability to establish an instant connection with such representations is particularly valuable in overcoming early interpretative challenges faced by children. Our results suggest that prioritising these recognisable and direct elements in the initial stages of children's map education may be highly beneficial.
Plester, Blades, and Spencer (Citation2003) demonstrated that children aged 4–5 years exhibit better performance when presented with representations in perspective rather than vertical projection. In our study, even the youngest children (aged 5-6), who were one year older than the participants in Plester et al.'s study, were considered map novices. Interestingly, these young children demonstrated superior performance on perspective maps compared to vertical projections. This suggests that for these young learners, the ability to directly recognise some real-world features eases the interpretation of the representation. This finding aligns with prior research (Blades and Roberts Citation2000; Sigurjónsson Citation2007; Bjerva, Græsli, and Sigurjónsson Citation2011). Notably, the children in our study exhibited a high level of proficiency in interpreting photos, including both eye-level and oblique photographs, for wayfinding purposes.
The method of using oblique projections as a means of representation not only improves environmental interpretation but also fosters an intuitive recognition of details. Our study's findings, in line with those of Downs, Liben, and Daggs (Citation1988) and Robison and Spodek (Citation1967), underscore the notion that perspective representations serve as a bridge, enabling children to transition seamlessly from a basic to a more nuanced understanding of maps. This approach contributes to the development of a deeper, intrinsic comprehension of spatial representations.
The investigation into the intricacies and abstractions of two-dimensional vertical maps in this study aligns with analytical frameworks proposed by Kastens and Liben (Citation2010) and Plester, Blades, and Spencer (Citation2003). The results obtained clearly indicate that the ability to comprehend map complexity increases with age. This underscores the importance of adopting a gradual and adaptive approach when introducing such maps to children, allowing them to transition progressively from tangible, concrete representations to more abstract, symbolic ones in accordance with their evolving cognitive abilities. A step-by-step teaching strategy, beginning with less complex maps and gradually increasing the complexity level in line with age and skill development, emerges as an effective pedagogical approach. This approach aligns teaching methodologies with the cognitive developmental stage of learners, offering a more tailored and optimised learning experience for the development of robust map comprehension skills. The study's progressive learning approach, which transitions from concrete to abstract concepts and from a horizontal to a vertical perspective, also aligns with early childhood education and care (ECEC policies) that promote healthy development and learning for young children.
In Norway, the primary school curriculum places significant emphasis on the development of map comprehension, with a particular focus on teaching in familiar settings and integration into physical education (Utdanningsdirektoratet Citation2022). Implementing this curriculum in a pedagogically sound manner encourages the use of age-appropriate representations, as suggested by research (Kaarby Citation1997; Sigurjónsson Citation2007; Bjerva, Græsli, and Sigurjónsson Citation2011).
These findings underscore the effectiveness of a gradual and adaptive approach to introducing maps, which enhances children's wayfinding skills. By systematically progressing from simpler to more detailed representations of the world, educators can acknowledge the diverse levels of individual map understanding development, allowing children to advance at their own pace without feeling overwhelmed. The incorporation of consistent control points within the terrain further simplifies the process for teachers, enabling them to provide tailored map education with minimal additional planning and effort.
This individualised, progressive approach not only aligns with curriculum goals but also fosters an enriched learning environment where children can successfully develop their wayfinding skills.
The educational implications of these findings underscore the necessity of incorporating age-appropriate map representations and employing a progressive map-related pedagogy. Although the study was conducted in a Norwegian context, its international relevance stems from the universal nature of children's cognitive development and the applicability of the step-by-step approach to map-reading skills across diverse cultural and educational settings. Therefore, the study's findings can inform and improve global map-related pedagogy and curriculum development, enhancing children's map-reading skills.
Ethical considerations
The study followed the Norwegians Guidelines for Research Ethics (www.forskningsetikk.no). The study is based on voluntary participation and all the participants were free to participate without any pressure or coercion. All participants were free to leave or withdraw from the study at any time without giving any reason, and the participants’ identities were anonymised. The teachers at the various stages gave information about the study to the children's parents. Personally identifiable data were not collected. No approvals were obtained because it was not required by the reasons of privacy.
Disclosure statement
No potential conflict of interest was reported by the author(s).
References
- Bjerva, T., J. A. Græsli, and T. Sigurjónsson. 2010. Kartstigen. Elverum: Hedmark University of Applied Sciences.
- Bjerva, T., J. A. Græsli, and T. Sigurjónsson. 2011. “Barns kommunikasjon med ulike typer kart - en progressiv tilnærming til kartlesing.” Acta Didactica Norge 5 (1), https://doi.org/10.5617/adno.1066.
- Bjerva, T., and T. Sigurjónsson. 2016. “Wayfinding by Means of Maps in Real-World Settings: A Critical Review.” Journal of Navigation 70 (2): 263–275. https://doi.org/10.1017/S0373463316000643.
- Blades, M., and K. P. Roberts. 2000. Children's Source Monitoring. Mahwah: Lawrence Erlbaum.
- Blades, M., and C. Spencer. 1986. “Map Use in the Environment and Educating Children to Use Maps.” Environmental Education and Information 5 (3): 187–204.
- Blades, M., and C. Spencer. 1987. “The use of Maps by 4–6-Year-old Children in a Large-Scale Maze.” British Journal of Developmental Psychology 5 (1): 19–24. https://doi.org/10.1111/j.2044-835X.1987.tb01037.x.
- Bluestein, N., and L. Acredolo. 1979. “Developmental Changes in Map-Reading Skills.” Child Development 50 (3): 691–697. https://doi.org/10.2307/1128934.
- Bruner, J. S. 1966. Toward A Theory of Instruction. Vol. 59. Cambridge: Harvard University Press.
- Catela, D., M. Barroso, A. P. Seabra, R. Figueiredo, and R. Franco. 2019. “Orienteering Using Realistic map (Coloured Aerial Photography) with Kindergarten Children.” Revista da UIIPS 7 (2): 132–135.
- DeLoache, J. S. 1995. “Early Understanding and Use of Symbols: The Model Model.” Current Directions in Psychological Science 4 (4): 109–113. https://doi.org/10.1111/1467-8721.ep10772408.
- DeLoache, J. S., S. L. Pierroutsakos, and D. H. Uttal. 2003. “The Origins of Pictorial Competence.” Current Directions in Psychological Science 12 (4): 114–118. https://doi.org/10.1111/1467-8721.01244.
- dictionary.com. 2019. “Definition – Map.” https://www.dictionary.com/browse/map.
- Downs, R. M., L. S. Liben, and D. G. Daggs. 1988. “On Education and Geographers: The Role of Cognitive Developmental Theory in Geographic Education.” Annals of the Association of American Geographers 78 (4): 680–700. https://doi.org/10.1111/j.1467-8306.1988.tb00238.x.
- Gibson, J. J. 2014. The Ecological Approach to Visual Perception: Classic Edition. New York: Psychology Press.
- Havelková, L., and M. Hanus. 2019. “Map Skills in Education: A Systematic Review of Terminology, Methodology, and Influencing Factors.” Review of International Geographical Education Online 9 (2): 361–401. https://doi.org/10.33403/rigeo.591094.
- Heil, C. 2019, February. “Children’s use of Spatial Skills in Solving two map-Reading Tasks in Real Space.” In Eleventh Congress of the European Society for Research in Mathematics Education, Utrecht University, Utrecht, Netherlands. hal-02402198.
- Hellevik, O. 2002. Forskningsmetode i sosiologi og statsvitenskap. Oslo: Universitetsforlaget.
- International Orienteering Federation. 2017. “ISOM 2017 International Specification for Orienteering Maps.” International Orienteering Federation. http://www.orientering.no/media/filer_public/83/03/830316cf-e5b3-4455-8822-129a9ec41e39/kartnormen_2017-internasjonal.pdf.
- Johansen, B. T. 1999. “Orientering.” In Aktivitetslære, edited by E. Enoksen. Oslo: Gyldendal Undervisning.
- Kaarby, K. M. E. 1997. Barns kartoppfatning: en fenomenografisk analyse av hvordan barn i alderen 6-8 år oppfatter kart. Oslo: Norges Idrettshøgskole.
- Kastens, K. A., and L. S. Liben. 2010. “Children’s Strategies and Difficulties While Using a Map to Record Locations in an Outdoor Environment.” International Research in Geographical and Environmental Education 19 (4): 315–340. https://doi.org/10.1080/10382046.2010.519151.
- Keates, J. S. 1996. Understanding Maps. 2nd Ed. Harlow: Longman.
- Kettunen, P., K. Irvankoski, C. M. Krause, T. Sarjakoski, and L. T. Sarjakoski. 2012. “Geospatial Images in the Acquisition of Spatial Knowledge for Wayfinding.” Journal of Spatial Information Science 2012 (5): 75–106. https://doi.org/10.5311/JOSIS.2012.5.85.
- Kim, M., R. Bednarz, and J. Kim. 2012. “The Ability of Young Korean Children to Use Spatial Representations.” International Research in Geographical and Environmental Education 21 (3): 261–277. https://doi.org/10.1080/10382046.2012.698089.
- Kimerling, A. J., P. Muehrcke, J. O. Muehrcke, and P. Muehrcke. 2016. Map Use: Reading, Analysis, Interpretation. London: ESRI Press Academic.
- Kvaase, A. 1999. “Kart, kompass og orientering.” Kunnskap Om Idrett 4: 81–90.
- Liben, L. S. 2008. “Understanding Maps Is the Purple Country on the Map Really Purple?” Knowledge Quest 36 (4).
- Liben, L. S. 2009. “The Road to Understanding Maps.” Current Directions in Psychological Science 18 (6): 310–315. https://doi.org/10.1111/j.1467-8721.2009.01658.x.
- Liben, L. S., and R. M. Downs. 1989. “Understanding Maps as Symbols: The Development of Map Concepts in Children.” In Advances in Child Development and Behavior 22: 145–201. https://doi.org/10.1016/S0065-2407(08)60414-0.
- Liben, L. S., and C. A. Yekel. 1996. “Preschoolers’ Understanding of Plan and Oblique Maps: The Role of Geometric and Representational Correspondence.” Child Development 67 (6): 2780–2796. https://doi.org/10.2307/1131752.
- Malinowski, J. C., and W. T. Gillespie. 2001. “Individual Differences in Performance on a Large-Scale, Real-World Wayfinding Task.” Journal of Environmental Psychology 21 (1): 73–82. https://doi.org/10.1006/jevp.2000.0183.
- Mikkelsen, R., and P. J. Sætre. 2022. Geografididaktikk for klasserommet. 4. utg. ed. Oslo: Cappelen Damm Akademisk.
- Ottosson, T. 1987. “Map-Reading and Wayfinding.” PhD-Dissertation. Gothoburg: Acta Universitatis Gothoburgensis.
- Ottosson, T. 1988. “What Does it Take to Read a Map?” Scientific Journal of Orienteering 25 (4): 28–35. https://doi.org/10.3138/RH17-M777-H206-1570.
- Plester, B., M. Blades, and C. Spencer. 2003. “Children’s Understanding of Aerial Photographs.” Children's Geographies 1 (2): 281–293. https://doi.org/10.1080/14733280302197.
- Plester, B., J. Richards, M. Blades, and C. Spencer. 2002. “Young Children’s Ability to Use Aerial Photographs as Maps.” Journal of Environmental Psychology 22 (1): 29–47. https://doi.org/10.1006/jevp.2001.0245.
- Robison, H. F., and B. Spodek. 1967. New Directions in the Kindergarten. 1st Edition, 3rd Printing. Columbia University: Teachers College Press.
- Sigmundsson, H., and M. Haga. 2005. Ferdighetsutvikling: Utvikling av grunnleggende ferdigheter hos barn. Oslo: Universitetsforlaget.
- Sigurjónsson, T. 2007. “Barns kartlesing: Et samspill mellom kartleser, kart og terreng.” PhD-dissertation. Oslo: Norwegian School of Sport Sciences.
- Sigurjónsson, T., T. Bjerva, and J. A. Græsli. 2020. “Gender Differences in Children's Wayfinding.” International Journal of Cartography 6 (3): 284–301.
- Sigurjónsson, T., T. Bjerva, and T. Solbakken. 2008. “Spiller det noen rolle hvor barn lærer? – Orientering som eksempel.” Nordic Studies in Education 28 (1): 63–72.
- Sigurjónsson, T., J. A. Græsli, and T. Bjerva. 2022. “Map Levels” Elverum: Inland Norway University of Applied Sciences. https://brage.inn.no/inn-xmlui/handle/11250/2984489.
- Stea, D., D. D. Kerkman, M. F. Piñon, N. N. Middlebrook, and J. L. Rice. 2004. “Preschoolers Use Maps to Find a Hidden Object Outdoors.” Journal of Environmental Psychology 24 (3): 341–345. https://doi.org/10.1016/j.jenvp.2004.05.003.
- Štolcová, K., M. Hanus, and D. Řezníčková. 2023. “Geography Curriculum Fidelity in map-Skills Development: Examining Teachers’ Personal Concepts, Lesson Objectives, and Observed Lessons.” Geografie 128 (4): 397–418. https://doi.org/10.37040/geografie.2023.016.
- Utdanningsdirektoratet. 2022. “Læreplan i kroppsøving (KRO01-05).” Accessed 17 November 2022. https://www.udir.no/Lk20/Kro01-05.
- Wiegand, P. 2005. “The Best of Both Worlds? Complementarity in Educational Cartography.” In Joint ICA Commissions Seminar on ‘Interest-Based Cartographic Teaching and Learning: Atlases, Map Use and Visual Analytics’, Held in Madrid (Spain), July, 6–8.
- Wiegand, P. 2006. Learning and Teaching with Maps. London: Routledge.