
Abstract
The multidimensional graded response model, an item response theory (IRT) model, can be used to improve the assessment of surveys, even when sample sizes are restricted. Typically, health-based survey development utilizes classical statistical techniques (e.g. reliability and factor analysis). In a review of four prominent journals within the field of Health Psychology, we found that IRT-based models were used in less than 10% of the studies examining scale development or assessment. However, implementing IRT-based methods can provide more details about individual survey items, which is useful when determining the final item content of surveys. An example using a quality of life survey for Cushing’s syndrome (CushingQoL) highlights the main components for implementing the multidimensional graded response model. Patients with Cushing’s syndrome (n = 397) completed the CushingQoL. Results from the multidimensional graded response model supported a 2-subscale scoring process for the survey. All items were deemed as worthy contributors to the survey. The graded response model can accommodate unidimensional or multidimensional scales, be used with relatively lower sample sizes, and is implemented in free software (example code provided in online Appendix). Use of this model can help to improve the quality of health-based scales being developed within the Health Sciences.
Introduction
Research in the field of Health Psychology is conducted in a variety of ways. One common method of data collection involves surveys or questionnaires that are used to evaluate health-related constructs. The field has seen the development of several key surveys used to assess different aspects of health. Some examples include the Illness Perception Questionnaire-Revised to assess illness perceptions (Broadbent et al., Citation2015; Moss-Morris et al., Citation2002), and the Perceived Stress Scale to assess perceived stress (Cohen, Kamarck, & Mermelstein, Citation1983).
From a survey-development perspective, it is important to thoroughly examine the psychometric properties of any survey before finalizing the measure for broad use. These properties provide information about the dimensionality of the survey (e.g. whether multiple subscales are present), the reliability of the survey, and performance of the individual items. There are many different methods that can be used to assess the psychometric properties of a survey. For example, reliability coefficients can be used to describe how well each item relates to the total score. In addition, methods such as confirmatory factor analysis (CFA) can be used to test hypotheses about the dimensionality of the survey. These methods are commonly implemented as a first step when examining a new health-based survey (e.g. Conner, Godin, Sheeran, & Germain, Citation2013; de Miranda Azevedo et al., Citation2016; Devine et al., Citation2014). Although these relatively straightforward techniques are helpful in assessing the composition of a new survey, there are other techniques based in the item response theory (IRT) framework that provide a more detailed assessment of the survey items.
In the current article, we detail an IRT method called the multidimensional graded response model that can be used to thoroughly assess new survey items. However, use of this model seldom appears in some of the premier journals publishing health-based inquiries. We conducted a small literature review narrowed to four of the premier journals in the field of Health Psychology. Specifically, we read all titles and abstracts of articles published since 2005 in the following four journals: Psychology, Health, & Medicine, British Journal of Health Psychology, Health Psychology, and Psychology & Health. This search was not meant to be exhaustive of the field’s journals, and it purposefully focused on some of the premier journals in the field of Health Psychology. The purpose of this literature search was to provide insight on the use of these methods in a specific sub-field of the broader health sciences. Specifically, we included these four influential journals in our search to give an example of the frequency that journals publish IRT-based inquires. Of course, journals will vary in the frequency of publishing on a given topic or a given statistical method, but this small literature review was meant to highlight the fact that some of the most influential journals in Health Psychology seldom publish work using IRT methods. We identified 126 articles across the journals that incorporated scale development or assessment (citations provided in the online Appendix).Footnote1 Of these, only five used IRT-based methods, and the remaining used traditional methods (e.g. factor analysis, Cronbach’s alpha, item-total correlation). Of the five IRT-based methods, only two studies implemented the graded response model. Even though IRT-based approaches are more informative during the scale-development and assessment phase, they are scarcely used in the Health Psychology literature. It is possible that IRT-based approaches are underrepresented in these journals because they are perceived as difficult to implement and interpret or require samples sizes that are virtually unattainable in the ‘typical’ health-based research.
Our aim is to provide health psychologists with a user-friendly introduction to an IRT tool that can enhance survey-development and assessment. The intended audience is comprised of health-based researchers who are interested in learning about how IRT approaches, specifically the multidimensional graded response model, can be implemented for scale and item assessment for questionnaires used in the health sciences. The paper is organized as follows. First, we describe the specific benefits of implementing IRT methods in health research. Next, we present the graded response model. An informative resource for learning more about the unidimensional treatment of this model is Edelen and Reeve (Citation2007); we highlight aspects related to the multidimensional version in the current example. To illustrate model application, we use the responses of 397 patients in remission from Cushing’s syndrome to the 12 items of the Cushing quality of life questionnaire (CushingQoL; Webb et al., Citation2008). Although we illustrate this model using a quality of life questionnaire, it is important to recognize that this is just one example of application. We use this example to highlight the benefits of this modeling approach in health-based research, as it is relatively under-used in the health sciences. However, this model approach can benefit areas of research spanning far beyond inquiries surrounding quality of life. Our aim is to provide an extensive example that can then be used as a springboard for researchers looking to implement this tool in a variety of contexts within the health sciences. We have chosen to focus on the multidimensional graded response model because of the benefits it carries with ordered categorical responses in multidimensional scales. For an explanation of other relevant forms of IRT models, we refer the interested reader to Embretson and Reise (Citation2000).
IRT and the graded response model
IRT is a powerful modeling approach used to evaluate the psychometric properties of survey questionnaires with categorical (ordered and unordered) responses (Embretson & Reise, Citation2000; Raykov & Marcoulides, Citation2011). IRT models are similar to factor analytic models in that they both provide information about dimensionality and model fit (i.e. how well a scoring option reflects the data; Kamata & Bauer, Citation2008). A key difference between IRT and factor analytic approaches is how the data are treated. While factor analytic methods examine covariances (or relationships) between the individual items, IRT models examine the overall response patterns across all of the items (Embretson & Reise, Citation2000). As a consequence of evaluating item response patterns, the parameter estimates obtained provide insight into how the items function. This type of information can be particularly useful during the process of developing a survey. In addition, factor analytic approaches construct a linear relationship between the factor score and item response. This contrasts the IRT approach, which constructs a nonlinear relationship between latent traits and item responses.
There are many different forms of IRT models that have been used to aid in survey-development. Perhaps the most common IRT-based approach in Health Psychology has been the Rasch model, which is a special case of IRT that is rather restrictive (Rasch, Citation1993). Some health-based examples implementing the Rasch model include: the Hospital Anxiety and Depression Scale (Pallant & Tennant, Citation2007), the Eating Disorder Examination Questionnaire (Gideon et al., Citation2016), and the Clinical Outcomes in Routine Evaluation-6D (Mavranezouli, Brazier, Young, & Barkham, Citation2011). However, there are other advanced IRT models that are more informative and less restrictive than the Rasch model.
Arguably, one of the more relevant IRT models to health-based research is the graded response model (Samejima, Citation1969, Citation1997). The graded response model is an IRT model that was developed to evaluate surveys that make use of ordinal responses such as ordered Likert-type scales. This model characterizes item functioning via two types of item parameters for each item: the item discrimination and item difficulty parameters (also referred to as a threshold). Discrimination parameters evaluate how well an item discriminates (or differentiates) between individuals scoring high and low on a latent ability (e.g. quality of life [QoL]). However, it may also be the case that items exhibiting relatively lower discrimination provide information over a wider range of the latent trait; in turn, items with larger discrimination parameters may provide information over a relatively narrower range of the latent trait. Item difficulty (or item location) describes how high on a latent trait (e.g. QoL) a subject typically is before they endorse an item (e.g. answer in the affirmative).
The graded response model can be specified to permit multidimensional models, making the comparison of different scoring options feasible (Embretson & Reise, Citation2000). Rasch models require questionnaires to be unidimensional (Rasch, Citation1993) and cannot be used to evaluate multidimensional questionnaires. Furthermore, Rasch models assume all items have the same discrimination parameter. In other words, items are treated exactly the same with respect to how well they discriminate between individuals with high and low levels of the latent construct of interest. This restriction may not be reasonable since different items are likely to contribute to the latent construct to varying degrees. While the graded response model is a more flexible IRT model than the Rasch model, it is scarcely used in health-based research. Further, IRT models in general are used far less than classical approaches, such as scale assessment through traditional reliability coefficients.
Perhaps the main reason IRT models are underused in health-based research is the notion that these methods require very large sample sizes – larger than is feasible for most health inquiries (e.g. sample sizes in the thousands). Forero and Maydeu-Olivares (Citation2009) have found that the graded response model is viable with sample sizes as small as 200, a more feasible sample size for health-based research. However, it is important to note that sample size requirements are directly tied to the complexity of the model. In other words, a ‘large’ sample size with one model may be considered to be ‘small’ for another, more complex, model; it is dependent on the complexity (i.e. number of parameters being estimated) of the model, as well as the amount of noise in the data. However, a researcher cannot be sure if a model will estimate properly with a certain sample size unless a simulation study is conducted first. We recommend that researchers looking to implement the graded response model be mindful to ensure adequate sample sizes are obtained given the specific modeling context; for more information on this topic please see Jiang, Wang, and Weiss (Citation2016), or Forero and Maydeu-Olivares (Citation2009).
The aim of this article is to demonstrate the use of the multidimensional graded response model for evaluating psychometric properties of a survey when relatively large sample sizes are unachievable. Annotated example code for estimating the multidimensional graded response model in the R program mirt is provided in the online appendix. To illustrate the estimation and interpretation of the multidimensional graded response model, a disease-specific health-related QoL questionnaire for patients treated with Cushing’s syndrome is evaluated; however this modeling approach can be used for a wide-range of health-based inquiries spanning beyond the example provided here. Before further description of the multidimensional graded response model, we provide a brief overview of Cushing’s syndrome and how QoL is impaired in these patients. It is important to note that this modeling approach can be applied to any substantive area of health-based survey development, specifically with questionnaires relying on ordered categorical responses (e.g. Likert-type scales).
Cushing’s syndrome and the CushingQoL
Cushing’s syndrome (CS) is a rare hormonal disorder characterized by an overproduction of cortisol (Boscaro, Barzon, Fallo, & Sonino, Citation2001; Newell-Price, Bertagna, Grossman, & Nieman, Citation2006). CS is most common in women, representing 75% of the diagnosed cases (Steffensen, Bak, Zøylner Rubeck, & Jørgensen, Citation2010). CS is typically caused by an adrenocorticotropic hormone secreting pituitary adenoma, but can also result from an ectopic tumor, an adrenal tumor, or prolonged, high-dosed exposure to glucocorticoid steroids (Bertagna, Guignat, Groussin, & Bertherat, Citation2009; Nieman & Ilias, Citation2005). Treatment for CS depends on the cause of the hypercortisolism but includes transsphenoidal surgery, adrenalectomy, pituitary irradiation, or a gradual reduction in the dosage of glucocorticoid steroids (Biller et al., Citation2008; Nieman & Ilias, Citation2005; Sharma, Nieman, & Feelders, Citation2015). Upon remission of CS, symptoms improve, although QoL typically does not return to premorbid levels (Santos et al., Citation2015; van der Klaauw et al., Citation2008). Impairments in QoL are persistent despite long-term remission from CS (Carluccio et al., Citation2015; Lindsay, Nansel, Baid, Gumowski, & Nieman, Citation2006; Valassi et al., Citation2011; Van Aken et al., Citation2005; Wagenmakers et al., Citation2012). Because impaired QoL in patients treated for CS is a prevalent concern despite long-term remission, it is important to be able to adequately measure and track it over time.
The CushingQoL is a disease-specific health-based QoL questionnaire designed to evaluate QoL of patients treated for CS (Webb et al., Citation2008). The CushingQoL was developed using standardized interviews of endocrinologists and focus groups of patients treated for CS. A Rasch analysis and an exploratory factor analysis (EFA) were used to determine that the CushingQoL was unidimensional (i.e. containing no subscales) and consisted of 12 items measured on a 5-point Likert-type scale (Webb et al., Citation2008). The CushingQoL has demonstrated good test-retest reliability (Santos et al., Citation2012), as well as construct validity and high internal consistency (Nelson et al., Citation2013). Additionally, total scores of the CushingQoL have mapped onto scores of established QoL questionnaires such as the SF-6D (Roset, Badia, Forsythe, & Webb, Citation2013) and the EQ-5D (Badia et al., Citation2013). Further analyses using EFA and CFA revealed that the CushingQoL could also be scored with two subscales, reflecting physical problems and psychosocial issues related to QoL (Tiemensma, Depaoli, & Felt, Citation2016). This two-subscale solution better reflects the World Health Organizations recommendation that QoL be represented as a multidimensional construct (WHOQOL Group, Citation1995); and this is the scoring option that we examine in the current application.
Implementation of the CushingQoL typically occurs in a medical office or research lab via pen-and-paper (see for e.g. Webb et al., Citation2008) or via online survey (see for e.g. Tiemensma et al., Citation2016). We felt this was an optimal example for demonstrating the use of the multidimensional graded response model and the types of results obtained when examining properties of items on a survey.
Method
Participants and procedures
Patients were recruited through the Cushing’s Support and Research Foundation’s listserv and Facebook page, where a message was distributed containing a web-link to the study. Patients were eligible for participation if they were over 18 years of age and in remission from CS. Patients were asked to complete the CushingQoL (English Version) and a demographics survey. In the present analysis, a total of 397 patients participated (351 females, 30 males, 16 unknown) with an average age of 49.33 years (SD = 13.10 years). A portion of the patients (n = 341) was previously described and published in Tiemensma et al. (Citation2016). The long-term treatment outcomes for these patients are described in . The Institutional Review Board (IRB) approved the protocol and all patients provided digital informed consent.
Table 1. Clinical characteristics.
CushingQoL questionnaire
The CushingQoL is a disease-specific health-based QoL questionnaire (Webb et al., Citation2008). The CushingQoL consists of 12 items measured on a 5-point Likert-type scale assessing how much (Very Much to Not at All) or how often (Always to Never) each item has been related to the patient’s CS in the previous 4 weeks. The CushingQoL consists of questions reflecting dimensions of QoL related to physical aspects (e.g. ‘I have pain that keeps me from leading a normal life’) and psychosocial aspects (e.g. ‘I feel less like going out or seeing relatives or friends’). The factor structure of the two-subscale scoring solution was specified according to the results from Tiemensma et al. (Citation2016).
Statistical analysis
All data were analyzed in the R programming environment (R Core Team, Citation2016) with the multidimensional item response theory package (mirt; Chalmers, Citation2012) using the full-information maximum likelihood (FIML) estimator. The FIML estimator is recommended when estimating IRT models with relatively small sample sizes (Forero & Maydeu-Olivares, Citation2009). Annotated R code can be found in the online Appendix.
In this example, we use a multidimensional extension of the graded response model (Samejima, Citation1969, Citation1997) to illustrate how to estimate and compare a unidimensional (i.e. single total score) and a multidimensional (i.e. two subscales) model of the CushingQoL. A multidimensional graded response model was used to relax the assumption of unidimensionality of the traditional graded response model. The choice of a multidimensional model can be due to theoretical reasons (i.e. theory dictates multiple latent traits) or empirical (i.e. results indicate the presence of multiple traits). For this example, we draw upon theory to determine the dimensionality of the CushingQoL, and use empirical results to further provide evidence for our decision. Next, we illustrate how to interpret item-level results from the CushingQoL in terms of item discrimination and item difficulty.
The discrimination parameter represents a slope, which refers to how well the item response options discriminate (or differentiate) between those with high and low levels of QoL. If discrimination is high, then the item provides ample information about QoL differences across individuals. If discrimination is low, then the item is not providing much information about QoL differences across individuals and may indicate items that need to be adjusted or removed.
The second parameter is called the item difficulty parameter. This parameter gets its name in the context of educational testing where items categorized as easy, hard, or somewhere in between for the typical test-taker. In relation to a health-based survey, the item difficulty parameter indicates where the item falls on the continuum of the latent trait. The difficulty parameters (i.e. threshold values) are interpreted as how high an individual’s QoL level needs to be in order to have a .5 probability of endorsing that given response category or a higher category. The CushingQoL contains five response options per question and would therefore have four thresholds (difficulty parameters) estimated for each item. The difficulty parameter lends insight into the relationship between the latent trait (e.g. QoL levels) and the specific response categories for the items. For readers interested in the more technical aspects of the graded response model, please see the online appendix.
Reliability of questionnaires can also be described from an IRT perspective. IRT reliability differs from traditional reliability coefficients (i.e. Cronbach’s alpha) in several ways. Most notably, IRT reliability is a ratio of the variance explained in the response patterns to the uncertainty (or error) in the response patterns (Kim & Feldt, Citation2010; Sireci, Thissen, & Wainer, Citation1991). After the models have been estimated, the absolute and relative fit of each model is investigated.
Model fit is typically examined using a variety of measures that convey different aspects of how well the model fit the data. There are several measures that can be used in this context, and some that are specific to IRT-based inquiries. One such measure is the reduced M2, which is a limited-information fit measure that outperforms full-information fit statistics (like the Pearson χ2) when sample sizes are relatively small (Cai & Hansen, Citation2013). The reduced M2 indicates an adequately fitting model when the p-value is greater than .05. Another measure is the root mean square error of approximation (RMSEA), which indicates an adequately fitting model when the confidence interval covers or is below .05 (MacCallum, Browne, & Sugawara, Citation1996). We use these measures to assess overall model fit, and several additional measures to compare fit across two different scoring solutions.
The total score solution was compared to the two-subscale scoring solution (see e.g. Tiemensma et al., Citation2016) using measures including the log-likelihood and various information criteria. Specifically, we used the nested log-likelihood test, Akaike information criterion (AIC), AIC corrected (AICc), Bayesian information criterion (BIC), and the sample size adjusted BIC (saBIC). The nested log-likelihood test is evaluated by comparing two times the differences of the log-likelihoods from each model. The difference is then compared to a χ2 distribution with degrees of freedom (df) equal to the difference in the number of parameters in each model (i.e. one for this analysis). The information criteria identify the most optimal scoring solution as being the model with the lowest values on a specific information criterion (i.e. AIC for model 1 and AIC for model 2 are compared; Sclove, Citation1987).
If the statistical model does not adequately reflect the data, then the next step is to investigate potential sources of model misfit, which include item fit and local dependence (LD; Reise, Citation1990). It is important to note that there are other options for investigating model misfit, but for brevity we focus on the following two. Item fit refers to whether an item of a questionnaire belongs with the questionnaire. One method of evaluating the fit of individual items in IRT models is the generalized S-X2 statistics (Kang & Chen, Citation2008; Orlando & Thissen, Citation2000, Citation2003). The S-X2 is similar to a Pearson’s χ2, but instead it cross-tabulates the response categories for an item against the total score of the subscale for the corresponding item. To control for multiple comparisons, the resulting p-values of the S-X2 were adjusted for the false discovery rate (FDR; Benjamini & Hachberg, Citation1995). The FDR is a correction of multiple comparisons that is better suited in IRT models than the Bonferroni correction. The Bonferroni method has been found to be underpowered when evaluating item fit and LD in IRT models because the amount of comparisons being adjusted for quickly becomes large (Benjamini & Hachberg, Citation1995). Next, LD can be evaluated and violations may point toward the presence of subscales. However, this would require a more thorough examination of item content. LD can be evaluated using the G2 LD index presented by Chen and Thissen (Citation1997), which was deemed appropriate for the current investigation; there are other methods that can also be used to capture LD, and more information can be found on these approaches in Chen and Thissen (Citation1997). Statistically significant values suggest there may be residual covariances between the items and decisions need to be made about whether to keep the items or use an alternative model.
Results
Patient characteristics
Clinical characteristics of patients are presented in . All patients were in remission for at least a year (M = 6.96 yrs, SD = 7.5 yrs).
Model fit
Model fit indices are presented in . The overall picture of model fit is consistent across indices when comparing the two scoring solutions. The nested log-likelihood test indicated that the multidimensional model was a significantly better fit to the data than the unidimensional model, χ2(1) = 142.82, p < .001. The reduced M2 statistic for the unidimensional model was significant, indicating that this model did not reflect the data well, M2 (18) = 31.74, p = .02. However, the reduced M2 was non-significant for the multidimensional model, indicating that it did reflect the data well M2 (17) = 19.25, p = .31. The RMSEA improved from the total score solution (estimate was .04 [C.I.90%: .02, .07]) compared to the 2-Subscale solution (estimate was .02 [C.I.90%: 0, .05]), with a narrowed confidence interval and a decreased upper bound confidence interval value. Evaluation of the information criteria (AIC, AICc, BIC, and saBIC) all revealed that the multidimensional model reflected the data better than the unidimensional model. Due to the consensus across indices, the multidimensional model will be considered for further evaluation.
Table 2. IRT model fit.
Reliability and parameter estimates
Within the IRT framework, both subscales yielded high reliability. The psychosocial subscale has a reliability of .919, and the physical issues subscale had a reliability of .835. IRT parameter estimates for item discrimination (i.e. slope) and item difficulty (i.e. thresholds) are presented in . Discrimination estimates for the items ranged from 1.04 to 3.81, indicating that all items discriminated between low- and high-levels of QoL well (higher values indicate better discrimination).
Table 3. IRT results presented as estimate (S.D.).
Difficulty parameter estimates indicated that patients with low QoL were more likely to agree with the items (i.e. lower score on the items) while patients with higher QoL were more likely to disagree with the items (i.e. higher score on the items). The mirt package provides discrimination (slope) parameters and intercepts. The user must compute difficulty (threshold) values. For example, Cush10 in has a slope of 3.276 and a first intercept of 2.383. To compute the first threshold (difficulty parameter), we implement the above equation and solve −2.383/3.276 = −.727. Each subsequent threshold for this item would be computed and interpreted in a similar fashion. The thresholds can be thought of as being on the same scale as the z-scale, where a normal distribution is centered at zero with a unit standard deviation metric. Each of the difficulty (or threshold) parameters reflects the probability of scoring above or below a given threshold. For example, Item 10 has the following threshold parameters: −.727, −.214, .433, and 1.196. These thresholds represent the cut-points between the five item categories. The first threshold (−.727) corresponds to a z-score value indicating the probability of scoring in the first item response category (coded as 0) vs. scoring in a larger item response category (coded as categories 1–4). In other words, the area under the standard normal curve to the left of −.727 is the probability of endorsing category 0, and the area to the right is the probability of endorsing category 1 and higher. We can also interpret results by comparing threshold values across items. For example, Item 5 has the lowest initial threshold value of −2.119, and Item 12 has the largest initial threshold value of −.338. This result indicated that fewer people endorsed the first item response category for Item 5 compared to Item 12; the smaller threshold value indicates there is less probability mass to the left of the threshold for Item 5 compared to the threshold for Item 12.
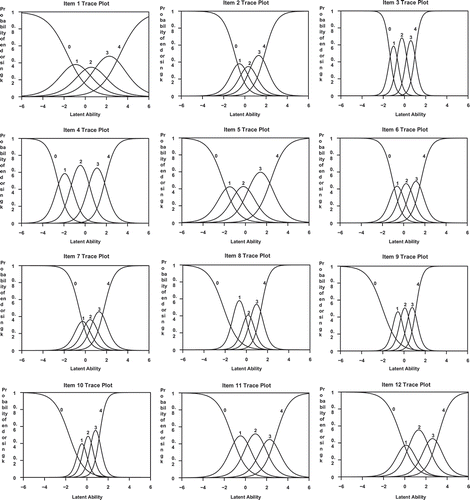
In addition to these results, item trace-plots are included in . These plots show item-level information regarding the performance linked to each response category. The CushingQoL contains 12 items, each with 5 response categories (coded as 0–4 in the plots). Each item-level plot contains five lines corresponding to the individual item response categories, and these lines represent the probability of endorsing an item response category given a certain level on the latent trait (or latent ability) represented by the x-axis of the plot; the latent trait is either physical impairments or psychosocial issues, depending on which factor the corresponding item has loaded on (see ). These plots link directly to the item discriminations provided in . Items with larger discrimination levels tend to provide information about the latent trait in a narrow range. For example, Item 10 had the largest discrimination value of 3.276, and the item categories in corroborate this by showing narrowed probability densities with the density peaks for each response category concentrated over a relatively narrow range of the latent trait values (x-axis) – this item had high discrimination across the latent trait given the different possible responses for the item. In contrast to this, Item 1 had the lowest discrimination value of 1.036, and the response category probability densities in are relatively spread out across the range of latent trait scores – the response categories represent broader ranges of the latent trait and the item has less discrimination overall.
Figure 1. Item traceplots for each item of the CushingQoL questionnaire.
Notes: Each response category is represented by a line with a corresponding number (i.e. 0 reflects the first category, 1 reflects the second category, and so on). The lines reflect the probability of endorsing an item given the level on the latent ability (physical impairments or psychosocial issues, depending on the item). Items with high discrimination (i.e. larger slopes) tend to provide information about the latent trait in a narrow range (for e.g. see Item 10 Trace Plot). In other words, the peaks of the distributions tend to be concentrated over a small range of latent trait values. Alternatively, with low discrimination (e.g. smaller slopes) tend to provide information about the latent trait across a wide range (for e.g. see Item 1 Trace Plot). These items tend to have distributions that cover a wide range of the latent trait.
Item fit and local dependence
After controlling for the FDR, the S-X2 item fit statistic indicated that all of the items fit the questionnaire well. Full results for item fit statistics are presented in .
Table 4. Item fit statistics.
Local dependence was evaluated using the LD G2 statistic. After controlling for the FDR, there were no issues with LD. No additional modeling corrections were required in our example. A full table of p-values for the evaluation of LD between each item is presented in . If a researcher had come across a problem here, then they would want to reconsider whether the items causing the issue would remain in the survey for broad use or use an alternative model.
Table 5. Local dependence G2 p-values.
Comparing the graded response model to classical approaches
Within the 126 articles we identified that incorporated scale development or assessment, 75 used EFA or CFA approaches to do so. Given that implementing EFA or CFA is such a common approach to take within the Health Psychology literature, we have added a comparison of these techniques to the graded response model.
EFA and CFA approaches can be used to answer different questions compared to the graded response model. EFA is typically used to assess the number and composition of potential subscales. This approach is used in an exploratory manner to initially evaluate and identify possible subscales in a questionnaire. This sort of approach can help lay a foundation for a confirmatory inquiry, where a particular subscale solution (i.e. 2 subscales each made up of particular item-sets) is tested or further examined. EFA usually represents the initial phase of subscale assessment.
Once possible subscales are identified, one can implement a more confirmatory approach (on a new set of data) to examine whether a particular subscale solution is statistically viable. CFA is a common approach for examining subscales in this manner. The hypothesized subscales (based on theory, an EFA, or another similar exploratory method) are specified and ‘tested’ using model fit and assessment measures, as well as an assessment of the strength of loading patterns between items and the latent subscales.
includes EFA and CFA results for the CushingQoL for comparison. As an example using EFA, 1- and 2-factor solutions were compared. In the 1-factor solution, all items are loading onto a single factor, indicating no subscales. In the 2-factor solution, items 1, 3, and 4 are loading separately onto a second factor (using a factor loading cutoff of .4). The loading patterns based on item content are consistent with recommendation of the World Health Organization (WHOQOL Group, Citation1995) for scoring this QoL questionnaire with two subscales denoting physical and psychosocial QoL. Likewise, the model fit indices presented indicate that the 2-factor solution is superior to the single factor solution. Given that the EFA presents an exploratory treatment of the factors, the researcher would then move forward with a confirmatory-based investigation using a CFA (or akin) approach. The CFA results in show that all items load strongly onto their respective factors. This approach can provide researchers with evidence that the hypothesized factors are indeed viable to use for subscales.Footnote2
Table 6. Results from an EFA and CFA for comparison to the graded response model.
Discussion
The purpose of this paper was to demonstrate the use of IRT methods in evaluating the psychometric properties of surveys relevant to health-based research, and illustrate how the type of results differs from the classical approaches of EFA and CFA. The CushingQoL was used as an example to highlight how the multidimensional graded response model can be used to detail item performance and the overall questionnaire-structure through an IRT framework. The CushingQoL results should be viewed as an example for how the multidimensional graded response model can be implemented and interpreted. The potential use of IRT-based methods is much broader than the CushingQoL, and our example was meant as a pedagogical example. In fact, this paper could have been focused on any questionnaire, and not just the CushingQoL. This modeling framework can span far beyond the quality of life literature, and potentially benefit a wide range of sub-fields within the broad field of the health sciences.
A comment on IRT vs. factor analytic approaches
The EFA and CFA approaches can be quite useful with respect to scale development and assessment. However, the results obtained through the multidimensional graded response model are far richer with respect to individual item performance. The multidimensional graded response model can be used to assess dimensionality (akin to the EFA approach). However, once a model is selected, this framework also provides detailed information about the individual items and how well they reflect the subscales being measured through the discrimination and difficulty parameters, as well as fit for the individual items. This sort of detail is not as widely available in EFA and CFA approaches.
We can readily see this advantage by comparing the type of results obtained through the graded response model and the factor analytic approaches related to the CushingQoL. The IRT-based approach was able to provide information about individual items, including the ability to discriminate across different levels of the latent trait and the information provided by each response category (see description). This level of detail surrounding the items is far more informative than the factor loading matrix obtained through CFA (). Although the approaches can be used to answer different sorts of inquiries, it is important to recognize the IRT-based approaches as a valuable tool for assessing health-based surveys.
The CushingQoL questionnaire was used as an example for highlighting some of the advantages of the IRT-based approach. Consistent with previous research on the CushingQoL (Tiemensma et al., Citation2016), a multidimensional model consisting of subscales reflecting physical problems and psychosocial issues related to QoL best reflected the data. Model fit was acceptable and there were no issues involving item fit or local dependence. This was the first study to evaluate the psychometric properties of the CushingQoL using the multidimensional graded response model, and these findings illustrate how this statistical model can be used to assess the structure and individual items on a questionnaire. In the current example, item discrimination parameters revealed that all of the items of the CushingQoL discriminate well between patients with high and low QoL, indicating that each item is functioning as desired. These results are far richer regarding the item-level information compared to the factor analytic approach. When selecting between the two statistical approaches, it is important to properly identify the aim of the research question and then build an analytic strategy accordingly. If the aim is centered on an item-level assessment, then the multidimensional graded response model is a viable option for such an inquiry.
Usage and benefits to the IRT-based approaches in the health sciences
IRT-based models, such as the multidimensional graded response model, are not as commonly implemented in health-based research. Typically, psychometric properties and scale-dimensionality are assessed through classical methods and factor analysis (exploratory or confirmatory; Nunnally & Bernstein, Citation1994; Raykov & Marcoulides, Citation2011; Crutzen & Peters, Citation2015). As discussed above, there are some examples of IRT-based questionnaire development or assessment applications, but these examples are still relatively rare in the literature. It is our hope that these methods can be implemented in Health Psychology to an even greater degree. IRT-based models can yield potentially rich and informative results about the survey dimensionality, as well as the performance of individual items, which can be invaluable for new scale development.
The multidimensional graded response model is particularly beneficial for health-based survey development because sample sizes required are attainable for most scenarios in the field. IRT models, born out of necessity in large-scale education testing, have the reputation of requiring very large sample sizes (e.g. many thousands of participants). However, we illustrated how the multidimensional graded response model can be informative under smaller sample sizes. Recent studies have revealed that the graded response model can have as few as 200 subjects and still obtain accurate parameter estimates if the correct estimator is used (Forero & Maydeu-Olivares, Citation2009). Ultimately, sample size requirements are context driven, and this research context (i.e. high-stakes, educational testing) may require larger sample sizes in some cases, especially if the model is relatively complex. It is always important to thoroughly assess sample size issues in the context of the particular model being estimated.
Limitations
The present study has some limitations regarding the participants included in the example. First, we were unable to verify whether all patients actually received a clinical diagnosis of CS given that data were collected online. However, data were collected from a patient association listserv and corresponding Facebook page, which presumably would only attract CS patients, and specific screening questions were used to determine eligibility (e.g. duration of remission, type of treatment, diagnosis, etc.). Second, because not all patients in routine care join patient associations, there is a chance for response bias. Finally, it might be that the most distressed subjects are more likely to participate, known as the concept of symptomatic volunteers. However, it is equally possible that patients who feel worse are less likely to participate. In general, patients have regular check-ups with their health care provider, and this patient population attending regular check-ups represents a wide range of remission duration. Our patient sample contained a great deal of heterogeneity in remission duration, which pointed toward it being a good representation of the overall patient population regarding remission status.
Concluding thoughts
It is our hope to encourage health researchers to implement more modern and flexible tools during scale development and assessment, given the important impact that questionnaire-based research has on the field. We believe the multidimensional graded response model represents a potentially valuable tool for building health-based surveys, especially since it has been shown to work reliably under sample sizes commonly found in health research and provides richer results compared to the classical methods of EFA and CFA.
Supplemental data
Supplemental data for this article can be accessed at https://tandfonline.com/doi/full/10.1080/13548506.2018.1447136.
Disclosure statement
No potential conflict of interest was reported by the authors.
Supplementary_material.zip
Download Zip (561.8 KB)Acknowledgement
We would like to thank the Cushing’s Support and Research Foundation’s (CSRF) and acknowledge Karen Campbell’s support and help in collecting the data. We would also like to thank all patients who participated in this study.
Notes
1. Online Appendix can be found at: https://www.dropbox.com/sh/xs3czj66mly2a0i/AABGsEnlwzVs5fy7YyAcuyXNa?dl = 0.
Material includes: this citation list, a technical document with model details, example syntax code and output for estimating the model, and code for producing the plots presented below.
2. In this example, we used the same data-set to estimate the EFA and CFA results. This decision was made for pedagogical reasons in order to demonstrate what EFA and CFA results would look like. However, in an empirical investigation about scale development or assessment, a separate data sample should be used for each of these models as to avoid ‘double-dipping’ into the same data for both analyses. For an example of data splitting to use different subsections of data for the EFA and CFA models during scale assessment, see Tiemensma et al. (Citation2016).
References
- Badia, X., Roset, M., Valassi, E., Franz, H., Forsythe, A., & Webb, S. M. (2013). Mapping CushingQOL scores to EQ-5D utility values using data from the European Registry on Cushing’s syndrome (ERCUSYN). Quality of Life Research, 22, 2941–2950.
- Benjamini, Y., & Hachberg, Y. (1995). Controlling the false discovery rate: A practical and powerful approach to multiple testing. Journal of the Royal Statistical Society: Series B (Methodological), 57, 289–300. doi:10.2307/2346101
- Bertagna, X., Guignat, L., Groussin, L., & Bertherat, J. (2009). Cushing’s disease. Best Practice & Research Clinical Endocrinology & Metabolism, 23, 607–623. doi:10.1016/j.beem.2009.06.001
- Biller, B. M. K., Grossman, A. B., Stewart, P. M., Melmed, S., Bertagna, X., Bertherat, J., … Boscaro, M. (2008). Treatment of adrenocorticotropin-dependent Cushing’s syndrome: A consensus statement. The Journal of Clinical Endocrinology and Metabolism, 93, 2454–2462. doi:10.1210/jc.2007-2734
- Boscaro, M., Barzon, L., Fallo, F., & Sonino, N. (2001). Cushing’s syndrome. The Lancet, 357, 783–791. doi:10.1016/S0140-6736(00)04172-6
- Broadbent, E., Wilkes, C., Koschwanez, H., Weinman, J., Norton, S., & Petrie, K. J. (2015). A systematic review and meta-analysis of the Brief Illness Perception Questionnaire. Psychology & Health, 30, 1361–1385. doi:10.1080/08870446.2015.1070851
- Cai, L., & Hansen, M. (2013). Limited-information goodness-of-fit testing of hierarchical item factor models. British Journal of Mathematical and Statistical Psychology, 66, 245–276. doi:10.1111/j.2044-8317.2012.02050.x
- Carluccio, A., Sundaram, N. K., Chablani, S., Amrock, L. G., Lambert, J. K., Post, K. D., & Geer, E. B. (2015). Predictors of quality of life in 102 patients with treated Cushing’s disease. Clinical Endocrinology, 82, 404–411.
- Chalmers, P. R. (2012). mirt: A multidimensional item response theory package for the R environment. Journal of Statistical Software, 48, 1–29. doi:10.18637/jss.v048.i06
- Chen, W. H., & Thissen, D. (1997). Local dependence indexes for item pairs using item response theory. Journal of Educational Behavioral Statistics, 22, 265–289. doi:10.2307/1165285
- Cohen, S., Kamarck, T., & Mermelstein, R. (1983). A global measure of perceived stress. Journal of Health and Social Behavior, 24, 385–396. doi:10.2307/2136404
- Conner, M., Godin, G., Sheeran, P., & Germain, M. (2013). Some feelings are more important: Cognitive attitudes, affective attitudes, anticipated affect, and blood donation. Health Psychology, 32, 264–272. doi:10.1037/a0028500
- Crutzen, R., & Peters, G. J. Y. (2015). Scale quality: Alpha is an inadequate estimate and factor-analytic evidence is needed first of all. Health Psychology Review, 28, 1–6. doi:10.1080/17437199.2015.1124240
- de Miranda Azevedo, R., Roest, A. M., Carney, R. M., Denollet, J., Freedland, K. E., Grace, S. L., … de Jonge, P. (2016). A bifactor model of the Beck Depression Inventory and its association with medical prognosis after myocardial infarction. Health Psychology, 35, 614–624. doi:10.1037/hea0000316
- Devine, K. A., Heckler, C. E., Katz, E. R., Fairclough, D. L., Phipps, S., Sherman-Bien, S., … Sahler, O. J. Z. (2014). Evaluation of the psychometric properties of the pediatric parenting stress inventory (PPSI). Health Psychology, 33, 130–138. doi:10.1037/a0032306
- Edelen, M. O., & Reeve, B. (2007). Applying item response theory (IRT) modeling to questionnaire development, evaluation, and refinement. Quality of Life Research, 16, 5–18. doi:10.1007/s11136-007-9198-0
- Embretson, S., & Reise, S. (2000). The new rules of measurement. In Item response theory for psychologist (pp. 13–64). Mahwah: Lawrence Erlbaum.
- Forero, C., & Maydeu-Olivares, A. (2009). Estimation of IRT graded response models: Limited versus full information methods. Psychological Methods, 14, 275–299. doi:10.1037/a0015825
- Gideon, N., Hawkes, N., Mond, J., Saunders, R., Tchanturia, K., & Serpell, L. (2016). Development and psychometric validation of the EDE-QS, a 12 item short form of the eating disorder examination questionnaire (EDE-Q). PLoS ONE, 11, e0152744. doi:10.1371/journal.pone.0152744
- Jiang, S., Wang, C., & Weiss, D. J. (2016). Sample size requirements for estimation of item parameters in the multidimensional graded response model. Frontiers in Psychology, 7, 109.
- Kamata, A., & Bauer, D. J. (2008). A note on the relation between factor analytic and item response theory models. Structural Equation Modeling: A Multidisciplinary Journal, 15, 136–153. doi:10.1080/10705510701758406
- Kang, T., & Chen, T. (2008). Performance of the generalized S-X2 item fit index for polytomous IRT models. Journal of Education Measurement, 45, 391–406. doi:10.1007/s12564-010-9082-4
- Kim, S., & Feldt, L. (2010). The estimation of the IRT reliability coefficient and its lower and upper bounds, with comparisons to CTT reliability statistics. Asia Pacific Education Review, 11, 179–188. doi:10.1007/s12564-009-9062-8
- Lindsay, J. R., Nansel, T., Baid, S., Gumowski, J., & Nieman, L. K. (2006). Long-term impaired quality of life in Cushing’s syndrome despite initial improvement after surgical remission. The Journal of Clinical Endocrinology & Metabolism, 91, 447–453.
- MacCallum, R. C., Browne, M. W., & Sugawara, H. M. (1996). Power analysis and determination of sample size for covariance structure modeling. Psychological Methods, 1, 130–149.
- Mavranezouli, I., Brazier, J. E., Young, T. A., & Barkham, M. (2011). Using Rasch analysis to form plausible health states amenable to valuation: The development of CORE-6D form a measure of common mental health problems (CORE-OM). Quality of Life Research, 20, 321–333. doi:10.1007/s11136-010-9768-4
- Moss-Morris, R., Weinman, J., Petrie, K., Horne, R., Cameron, L., & Buick, D. (2002). The revised illness perception questionnaire (IPQ-R). Psychology and Health, 17, 1–16. doi:10.1080/08870440290001494
- Nelson, L. M., Forsythe, A., McLeod, L., Pulgar, S., Maldonado, M., Coles, T., … Badia, X. (2013). Psychometric evaluation of the Cushing’s Quality-of-Life questionnaire. The Patient-Patient-Centered Outcomes Research, 6, 113–124.
- Newell-Price, J., Bertagna, X., Grossman, A., & Nieman, L. (2006). Cushing’s syndrome. The Lancet, 367, 1605–1617. doi:10.1016/S0140-6736(06)68699-6
- Nieman, L., & Ilias, I. (2005). Evaluation and treatment of Cushing’s syndrome. The American Journal of Medicine, 118, 1340–1346. doi:10.1016/j.amjmed.2005.01.059
- Nunnally, J., & Bernstein, I. (1994). Psychometric theory. New York, NY: McGraw Hill . ISBN -13: 978-0070478497.
- Orlando, M., & Thissen, D. (2000). Likelihood-based item-fit indices for dichotomous item response theory models. Applied Psychological Measurement, 24, 50–64. doi:10.1177/01466216000241003
- Orlando, M., & Thissen, D. (2003). Further investigation of the performance of S-X2: An item fit index for use with dichotomous item response theory models. Applied Psychological Measurement, 27, 289–298. doi:10.1177/0146621603027004004
- Pallant, J. F., & Tennant, A. (2007). An introduction to the Rasch measurement model: An example using the hospital anxiety and depression scale (HADS). British Journal of Clinical Psychology, 46, 1–18. doi:10.1348/014466506X96931
- R Core Team. (2016). R: A language and environment for statistical computing. Vienna: Author. Retrieved from https://www.R-project.org/
- Rasch, G. (1993). Probabilistic models for some intelligence and attainment tests. Chicago, IL: University of Chicago Press . ISBN -13: 978-0226705545.
- Raykov, T., & Marcoulides, G. (2011). Introduction to item response theory. In Introduction to psychometric theory (pp. 247–268). New York, NY: Routledge.
- Reise, S. P. (1990). A comparison of item- and person-fit methods of assessing model-data fit in IRT. Applied Psychological Measurement, 14, 127–137.
- Roset, M., Badia, X., Forsythe, A., & Webb, S. M. (2013). Mapping CushingQoL scores onto SF-6D utility values in patients with Cushing’s syndrome. The Patient-Patient-Centered Outcomes Research, 6, 103–111.
- Samejima, F. (1969). Estimation of latent ability using a response pattern of graded scores. Psychometrika, 34(4, pt. 2). doi:10.1007/BF03372160
- Samejima, F. (1997). Graded response model. In W. van der Linden & R. Hambleton (Eds.), Handbook of modern item response theory (pp. 85–100). New York, NY: Springer. ISBN-13: 978-0387946610.
- Santos, A., Resmini, E., Martinez-Momblan, M. A., Crespo, I., Valassi, E., Roset, M., … Webb, S. M. (2012). Psychometric performance of the CushingQoL questionnaire in conditions of real clinical practice. European Journal of Endocrinology, 167, 337–342.
- Santos, A., Crespo, I., Aulinas, A., Resmini, E., Valassi, E., & Webb, S. M. (2015). Quality of life in Cushing’s syndrome. Pituitary, 18, 195–200. doi:10.1007/s11102-015-0640-y
- Sclove, S. L. (1987). Application of model-selection criteria to some problems in multivariate analysis. Psychometrika, 52, 333–343.
- Sharma, S., Nieman, L., & Feelders, R. (2015). Cushing’s syndrome: Epidemiology and developments in disease management. Clinical Epidemiology, 7, 281–293. doi:10.2147/CLEP.S44336
- Sireci, S. G., Thissen, D., & Wainer, H. (1991). On the reliability of testlet-based tests. Journal of Educational Measurement, 28, 237–247. doi:10.1111/j.1745-3984.1991.tb00356.x
- Steffensen, C., Bak, A. M., Zøylner Rubeck, K., & Jørgensen, J. O. L. (2010). Epidemiology of Cushing’s syndrome. Neuroendocrinology, 92(1), 1–5. doi:10.1159/000314297
- Tiemensma, J., Depaoli, S., & Felt, J. M. (2016). Using subscales when scoring the Cushing’s quality of life questionnaire. European Journal of Endocrinology, 174, 33–40. doi:10.1530/EJE-15-0640
- Valassi, E., Santos, A., Yaneva, M., Toth, M., Strasburger, C. J., Chanson, P., … Tsagarakis, S. (2011). The European registry on Cushing’s syndrome: 2-year experience. Baseline demographic and clinical characteristics. European Journal of Endocrinology, 165, 383–392.
- Van Aken, M. O., Pereira, A. M., Biermasz, N. R., van Thiel, S. W., Hoftijzer, H. C., Smit, J. W. A., … Romijn, J. A. (2005). Quality of life in patients after long-term biochemical cure of cushing’s disease. The Journal of Clinical Endocrinology & Metabolism, 90, 3279–3286.
- van der Klaauw, A. A., Kars, M., Biermasz, N. R., Roelfsema, F., Dekkers, O. M., Corssmit, E. P., … Romijn, J. A. (2008). Disease-specific impairments in quality of life during long-term follow-up of patients with different pituitary adenomas. Clinical Endocrinology, 69, 775–784. doi:10.1111/j.1365-2265.2008.03288.x
- Wagenmakers, M. A. E. M., Netea-Maier, R. T., Prins, J. B., Dekkers, T., den Heijer, M., & Hermus, A. R. M. M. (2012). Impaired quality of life in patients in long-term remission of Cushing's syndrome of both adrenal and pituitary origin: A remaining effect of long-standing hypercortisolism? European Journal of Endocrinology, 167, 687–695.
- Webb, S. M., Badia, X., Barahona, M. J., Colao, A., Strasburger, C. J., Tabarin, A., … Glusman, J. E. (2008). Evaluation of health-related quality of life in patients with Cushing’s syndrome with a new questionnaire. European Journal of Endocrinology, 158, 623–630. doi:10.1530/EJE-07-0762
- WHOQOL Group. (1995). The World Health Organization quality of life assessment (WHOQOL): Position paper from the World Health Organization. Social Science & Medicine, 41, 1403–1409. doi:10.1016/0277-9536(95)00112-K