
ABSTRACT
Low perceived risk of is associated with a low probability of engaging in risk preventive behaviours. Temporal framing has been suggested to make the risk seem higher, as narrower time frames appear to increase perceived risk and intentions to engage in risk-preventive behaviours. In two online experiments, we tested how manipulating risk information about colorectal cancer (CRC) influenced risk perception and preventive behaviours. 902 men and women aged 45–54 were recruited from an English online panel. Study 1 (N = 132) investigated how communicating CRC mortality instead of incidence rates influences risk perception, using both yearly and daily frames. In study 2 (N = 770), CRC incidence was described as occurring yearly, daily or hourly. The primary outcome measures were risk perception, intention to engage in preventive behaviours and whether participants chose to read information about ways to reduce CRC risk or skip it to finish the survey. Study 1 did not find a difference in intentions based on information about the risk of developing vs the risk of dying of CRC. Study 2 found that, while communicating CRC incidence occurring as every day increased information-seeking behaviour compared to every year and every hour (57.4% vs 45.9% vs 45.6%, p = 0.012), individuals in the daily condition were less likely to get all comprehension questions right (69.9% vs 78.2% vs 85.0%, respectively, p = 0.015). Temporal framing had no impact on perceived risk or intentions to engage in risk-reducing behaviours. While manipulating risk information in terms of temporal framing did not increase perceived risk, it may influence people’s decision to engage with the information in the first place.
Introduction
Individuals are confronted with various information about their health risks. The way these risks are perceived influences how individuals react to them (Schmälzle et al., Citation2017). Understanding how health risks are perceived can improve the effectiveness of health messages. Of such efforts, the Construal level theory (CLT) states the psychological distance influences individuals’ cognition and behaviour such that objects that appear closer in time are perceived more concretely (Chandran, & Menon, Citation2004; Trope & Liberman, Citation2003). People weigh proximal risks more than distant risks (Roh et al., Citation2018; Zhao & Peterson, Citation2017). Similarly, shorter time windows should be easier to understand and easier to imagine, so that risk messages presented in narrow time windows are perceived as riskier. Previous studies found such a temporal framing effect on perceived risk when investigating heart disease (Chandran & Menon, Citation2004), healthy eating (Lo et al., Citation2012), virus threat (White, Johnson & Kwan, Citation2014), health advertising messages (Kees, Citation2010), smoking (Kim & Kim, Citation2018). While these results were confirmed in a recent study on heart disease using visual-based infographics (Lee et al., Citation2021), the study also found that similar to Bonner and Newell (Citation2008), that text-based messages were more effective in increasing perceived risk when using a year frame than a day frame. Bonner and Newell (Citation2008) suggested this may have been due to the ratio bias or numerosity heuristic, which is peoples’ tendency to judge a probability by the numerator instead of the overall proportion (Kirkpatrick & Epstein, Citation1992; Pelham et al., Citation1994). Thus, people perceive the event as more likely if it is communicated as a large-numbered ratio, such as 20/100, rather than a smaller-numbered but equivalent ratio, such as 2/10. Similarly, according to the numerosity heuristic, individuals focus on the number rather than the type of unit in which quantitative information is communicated (Pandelaere, Citation2011; Pelham et al., Citation1994). When focusing on the number, the quantity becomes dimensionless and as a result, individuals think that higher numbers imply larger quantities. Bonner and Newell (Citation200) conclude that the temporal framing effect, found in previous studies, was due to their use of verbal quantifiers instead of numerical information.
While all studies suggested some kind of temporal framing effect, they were nevertheless limited by using student populations, small sample sizes and a within-subject design, in which study participants are exposed to more than one condition. It is thus not clear, how temporal frames influence decision making in real-life settings. Especially, as none of the studies used objectively measured behavioural outcomes. Additionally, as these studies communicated health risk presented as either mortality or incidence, it is unclear if there is an interaction.
This question is particularly relevant as temporal frames are used in a journalist’s guide by the UK’s leading bowel cancer charity (‘Bowel Cancer UK’). Specifically, the guide reports incidence of colorectal cancer (CRC) as occurring both every 15 minutes and every year (Bowel Cancer UK, Citation2019). Based on CLT, one would assume that the narrower time frame would lead to higher perceived risk.
CRC is a leading cause of death around the world (National Health Service, Citation2017; Schreuders et al., Citation2015; Sung et al., Citation2021). Survival can be improved through early diagnosis, such as organised screening programmes for early detection (National Health Service, Citation2017; Schreuders et al., Citation2015). Despite the availability of several effective CRC screening tests, uptake is often below of national and international guidelines (e.g., the European Guidelines for Quality Assurance in Colorectal Cancer Screening and Diagnosis, which has a minimum participation rate of 65%, Duffy et al., Citation2017; Von et al., Citation2021). Low uptake has been associated with low perceived risk of developing CRC (Gimeno Garcia, Citation2012; Power et al., Citation2009).
The current research
In this study, we tested the hypothesis that the narrower temporal framing of CRC risk increases individuals’ perception of the risk and interest in learning about preventive behaviours. Specifically, we wanted to compare whether communicating numerical information about CRC risk as occurring ‘every hour’ or ‘every day’ instead of ‘every year’ increases perceived risk of CRC and active interest in preventive behaviours, such as risk testing or participate in CRC screening. To test these temporal frames, we conducted two experimental studies in spring 2019. The gap in research also emerged as no previous study applied temporal framing to the communication of CRC risk.
In Study 1, we investigated whether communicating CRC mortality instead of incidence influences perception of CRC risk. Participants were randomised to either receive information about CRC risk in terms of mortality or incidence and were presented with these risks occurring as both ‘every year’ or ‘every day’ in random order. Participants were asked to state their own perceived risk and that of an average person for each temporal frame.
Study 2 then compared the impact of the three temporal framings on perceived risk, intentions to engage in preventive behaviours and active interest in reading about prevention. Thus, as Study 1 looked at the effect of communicating CRC mortality instead of incidence on risk perception using both ‘every year’ and ‘every day’ simultaneously, Study 2 investigated how temporal frames influence intentions and active interest in reading about preventive behaviours.
We conducted sample size calculations for both experiments before data collection based on estimates obtained from previous literature and pilot studies to have 80% statistical power to detect differences of at least 10% in perceived risk, with an alpha value of 0.05 (Cohen, Citation1988). All statistical analysis was conducted with Stata/SE version 15.1 (StataCorp LP, College Station, TX) and the protocols for both studies were approved by the UCL Research Ethics Committee (approval number 13 439/005). The surveys, data and Stata codes for both experiments are available via OSF: https://osf.io/68awv/?view_only=1569e2253ced42ceaf379f2bc7d77e65.
Study 1 – Comparing incidence and mortality rates
The primary aim of Study 1 was to investigate whether the perceived risk of CRC depends on mortality or incidence being communicated, using both yearly and daily frames in random order.
Methods
An online survey was designed by Survey Monkey and the survey company Dynata invited men and women aged 45–54 living in England from their online panel to take part in the survey. All participants were informed that they would be rewarded with points for completing the survey, which could then be exchanged for money (around £0.50) or donated to charity. The number of points was defined by the length of the questionnaire, for completing the survey.
Once individuals agreed to participate in the survey, we asked them about their medical history. Only participants who had never done a CRC screening test, had no previous diagnosis of bowel cancer or part of their bowel removed were eligible for the survey. Eligible participants were then allocated at random to one of two experimental conditions in which they received information about CRC risk in terms of mortality or incidence. We used information on both mortality and incidence for men and women aged 45 to 54 from the website of Cancer Research UK (Citation2016). The data covered the years 2014 until 2016. Participants in both experimental conditions were presented with the same risk occurring as ‘every year’ (distant condition) and ‘every day’ (proximal condition) in random order. Note that men and women received information about mortality or incidence for their gender and that the values were rounded down to the next integer (see, )
Table 1. CRC incidence and mortality messages presented to men and women in Study 1.
Measures
Participants were asked to state their own perceived risk for each temporal frame using a slider from 0 to 100 with was adapted from Chandran and Menon (Citation2004). Those in the mortality condition were asked their perceived risk of dying from CRC: ‘How likely do you think it is that you would die from bowel cancer in your life from 0 to 100 where 0 not likely at all and 100 means extremely likely?’ In contrast, those in the incidence condition were presented with the question: ‘How likely do you think it is that you would develop bowel cancer in your life from 0 to 100 where 0 not likely at all and 100 means extremely likely?’. Participants were then debriefed about the temporal frames and asked to compare them based on how easy they were to understand and imagine, how motivational they are and whether they should be used for communication to the public with the questions: ‘Given that both messages refer to the same number of men/women being diagnosed/dying with bowel cancer, which one is easier to understand?’, ‘ … which one is easier to imagine?’, ‘ … which one is more motivational to engage in behaviours to prevent bowel cancer?’ and ‘which one should be used by the NHS for communication?’
We further assessed participants’ numeracy skills with the question ‘Which of the following numbers represents the biggest risk of getting a disease?’ with four possible answers ‘1/10’, ‘1/100’, ‘1/1000’, and ‘Don’t know’ (Lipkus et al., Citation2001; Stoffel et al., Citation2019a, Citation2019b). Finally, we collected background information about participants’ exact age, gender, ethnicity employment and living status as well as whether they know somebody who had CRC and information about their healthy lifestyle (i.e. the number of fruit and vegetable portions, frequency of exercising and smoking status).
Participants
Out of the 185 men and women aged 45–54 years who gave consent to participate in the study, 53 were excluded because of ineligibility (either due to wrong age, having a previous diagnosis of bowel cancer or part of their bowel removed) and 2 participants dropped out during the survey, leaving us with a final sample of 132 participants (68 in the mortality and 64 in the incidence condition). Figure S1 in the supplementary file presents the for flow through Study 1 and Table S1 in the supplementary file shows that most participants were aged between 45 and 49 years (N = 70; 53%), female (N = 79; 59.8%), white (N = 123; 92.3%), were in paid employment (N = 91; 68.9%), had formal education (N = 83; 62.9%) and that there were no imbalances in sociodemographic characteristics among the two experimental conditions.
Statistical analysis
As answers to the risk perception questions were not normally distributed (see Figure S2 in supplementary file), we used medians as measures of central tendency and calculated 95% confidence intervals for each risk item using nonparametric bootstraps (Stoffel et al., Citation2019a). Friedman and Wilcoxon signed-rank tests were used to compare perceived risk.
Results
summarises the median values of own and average risk for each experimental condition and temporal frame. Wilcoxon signed-rank sum tests showed no difference in perceived risk across the two conditions (p = 0.986 for the yearly frame and p = 0.714 for the daily frame). Median perceived risk varied between 40 and 45.5. Furthermore, non-parametric Friedman tests of differences among the temporal frames rendered a Chi-square value of 0.756 with p = 0.382 for the incidence condition and a Chi-square value of 0.015 with p = 0.904 for the mortality condition, indicating that there is no evidence that the distributions of risk perceptions were different across the two temporal frames.
Table 2. Effect on own perceived risk of developing CRC in Study 1 (N = 132).
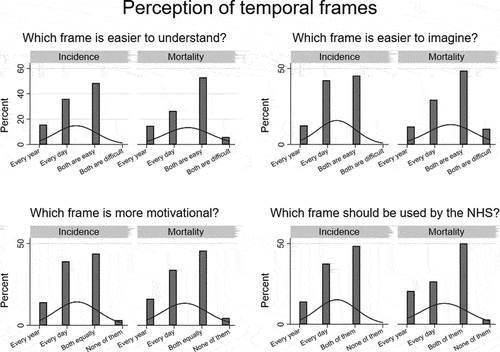
Looking at which temporal frames were perceived as easiest to understand and imagine, and Table S2 in the supplementary file reveal that most participants perceived both temporal frames as equally easy to understand. Fisher’s exact tests showed that the perceived imaginability was independent of the experimental condition. The understandability, however, varied between the conditions, with individuals in the incidence condition being more likely to perceive the daily frame as easier to understand than those in the mortality condition (p = 0.034, Fisher’s exact test). Most participants thought that both temporal frames were equally motivating and can be used for official communication. The daily frame was always the second most frequently chosen option. Only a few participants perceived the yearly frame as easier to understand (N = 20, 15.1%), imagine (N = 16, 12.1%) or more motivational (N = 20, 15.1%) than the daily frame (see Table S2 in supplementary file).
Figure 1. Perception of the every year and every day frames in Study 1 (N = 132).
There was no difference in perceived risk between the mortality and incidence condition. Furthermore, while we did not find any effect of temporal framing on the perceived risk, the results from the comparison question suggest that slightly more individuals perceived the narrower temporal frame as easier to understand or motivational. The next step to better understand the effect of temporal framing would be to examine whether they exert any effect on intentions and active interest in learning more about prevention of CRC in an experiment that features a between-subject design. To this end, Study 2 compared the yearly frame and the daily frame for CRC incidence with an additional even narrower temporal hourly frame. This approach allowed us to test the motivational effect of temporal frames.
Study 2 – Testing different temporal frames
The primary aim of Study 2 was to compare the effects of different temporal framing of CRC incidence on intentions to engage in preventive health behaviours and active interest in reading more about ways to prevent CRC. Using comprehension checks, Study 2 also looked at whether the temporal framing influenced information processing.
Methods
The design of the second experiment followed Study 1 in that we conducted an online survey in SurveyMonkey in which eligible study participants were randomly allocated to different experimental conditions; yearly frame (annual CRC incidence), daily frame (daily CRC incidence) and hourly frame (hourly CRC incidence). Note that the sampling method was identical to that in Study 1 but used a different pool of participants. Again, we provided men and women separate CRC incidence statistics. This time though, the CRC incidence was calculated for men and women aged 45 or older and not 45 to 54. This decision was made to get sufficiently large CRC incidence numbers for the hourly frame and required a change in the framing of the information. Specifically, men in the yearly frame received the information that every year, around 22,600 men aged 45 or older are diagnosed with bowel cancer in the UK. summarises the different frames for men and women. Study participants were then asked a comprehension check about the communicated CRC incidence and could not continue with the survey without correctly identifying the correct incidence rate (Stoffel et al., Citation2019a, Citation2019b).
Table 3. Temporally framed CRC incidence messages presented to men and women in Study 2.
Measures
Participants were asked to state their perceived risk of developing CRC for themselves and an average man/woman using a slider from 0 to 100 (Chandran & Menon, Citation2004). Specifically, they were asked: ‘How likely do you think it is that you would develop bowel cancer (at some point) in your life from 0 to 100 where 0 not likely at all and 100 means extremely likely?’ and ‘How likely do you think it is that a man/woman the same age as you develops bowel cancer in your life from 0 to 100 where 0 not likely at all and 100 means extremely likely?’
Similar to Study 1, participants were asked to indicate how easy it was for them to imagine that x men/women are diagnosed with bowel cancer every year/day/hour and how interesting they found the provided information about bowel cancer and the number of people diagnosed with bowel cancer. Both questions were adapted from Newell et al., Citation2008 and featured 7-point Likert scale response options were 1 meant not at all and 7 very muchCitation2008.
Intentions to engage in preventive behaviours were measured with three separate questions, adapted from previous studies (Stoffel et al., Citation2019a, Citation2019b). The first question asked participants whether they would fill out an online bowel cancer risk form that calculates their risk of developing bowel cancer in the next 10 years based on their age, gender, level of physical activity, eating and drinking habits, smoking, current health problems as well as family history. The second intention question asked them whether they would do a genetic test for bowel cancer, which examines their DNA through a blood sample. The final intention question asked whether they would take up the offer to participate in the NHS Bowel Scope Screening programme once they are invited at the age of 55, which consists of an invasive sigmoidoscopy screening test. All questions featured the same fully labelled 4-point response scale (‘definitely not’, ‘probably not’, ‘probably yes’ and ‘definitely yes’).
Active interest in reading more about CRC prevention was measured with the question: ‘Before continuing with the survey, would you be interested in reading a list about ways to prevent bowel cancer or would you prefer to skip these and finish the survey?’ with response options: ‘I would like to read the list before continuing with the survey’ and ‘I want to skip the list and finish the survey’. Those who chose the second response option were sent to the end of the questionnaire, while others were presented additional information about ways to prevent CRC. Engagement with this information was measured with three comprehension questions (Stoffel et al., Citation2019a, Citation2019b).
The survey finished with questions about the numeracy skills, background information about participants’ exact age, gender, ethnicity employment and living status as well as whether they know somebody who had CRC and information about their healthy lifestyle (i.e. the number of fruit and vegetable portions, frequency of exercising and smoking status).
Participants
We recruited 1295 men and women aged 45–54 years from an online survey sample, we excluded 351 because of unacceptability and lost 74 due to drop-outs, leaving us with a final sample of 770 participants (270 in yearly condition, 237 in the daily condition and 263 in the hourly condition). The flow through Study 2 is presented in Figure S3 in the supplementary file. Table S3 in the supplementary file shows that most participants were aged between 45 and 49 years (N = 398; 51.7%), male (N = 391; 50.8%), white (N = 710; 92.2%), were in paid employment (N = 526; 68.3%), had formal education (N = 433; 56.2%) and that there were no imbalances in sociodemographic characteristics among the two experimental conditions.
Statistical analysis
Our main outcomes were perceived risk, intention to use risk testing or participate in CRC screening, and active interest in reading about CRC prevention after exposure to the CRC incidence rates. We conducted Chi-Square tests of independence for categorical outcome variables (i.e. intentions and active interest) and followed up with multivariable logistic regressions if the univariate analyses suggested a statistical difference between the experimental conditions. As answers to the risk perception questions were not normally distributed (see Figure S4 in the supplementary file), we used medians as measures of central tendency and calculated confidence intervals for each quantifier using nonparametric bootstraps, as responses were not normally distributed. Wilcoxon signed-rank tests were used to compare perceived risk across conditions.
All adjusted regression models included age, gender, ethnicity, education, employment status, numeracy skills, health lifestyle and knowing somebody with CRC (blood-related or not) as covariates. Odds ratios (ORs) for the experimental conditions are presented in the text and full models showing all the covariates in table S4 in the supplementary file.
Results
Effect on perception items
The Kruskal–Wallis tests in show that there were no statistically significant differences in perceived risk across the three temporal frames. Independently, whether participants were asked to indicate the perceived risk for themselves or an average person of the same gender and age, they indicated that the risk was around 50 out of 100. The medians for their own perceived risk, however, were slightly lower than those of the risk of others in all three experimental conditions (varying between 1.0 in the everyday condition and 4.5 in the every year condition, respectively).
Table 4. Effect on the perceived risk of developing CRC in Study 2 (N = 770).
The temporal frame did not affect the way participants perceived the information either. The Kruskal–Wallis tests in revealed that all information about CRC incidence was perceived as interesting and easy to imagine (see Figure S5 in supplementary file).
Table 5. Perception of the temporal frames in Study 2 (N = 770).
Effect on intentions
Chi-square tests of independence reported in shows that the temporal frame did not influence intentions to use risk testing or participate in CRC screening. Independently from the experimental conditions, most study participants indicated that they would probably or definitely use the risk calculator or take part in screening.
Table 6. Intentions according to experimental conditions in Study 2 (N = 770).
Effect on information-seeking behaviour
The logistic regression in and the distribution of the answers in show that study participants were more likely to read information about CRC prevention if they had been randomised to the every day condition compared with the ever year or every hour condition (57.4% vs. 45.9% and 45.6% respectively). The every day condition significantly increased active interest compared with the every year condition (57.4% vs. 45.9%; aOR 1.54; 95% CI: 1.07–2.21, p = 0.020). There was, however, no statistically significant difference between the every year and every hour condition (45.6% vs. 45.9%; aOR 0.69; 95% CI: 0.69–1.39, p = 0.883).
Figure 2. Effect of temporal framing on interest in reading further information about bowel cancer prevention in Study 2.
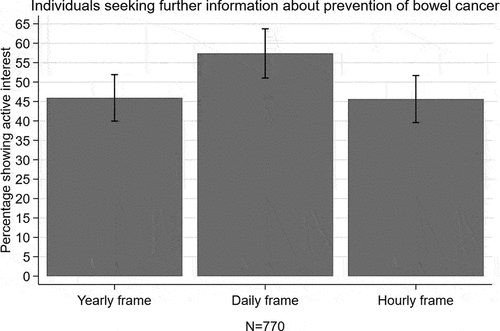
Table 7. Logistic regression models on active interest in reading information about CRC prevention in Study 2 (N = 770).
A Chi-square test revealed that as the every day condition increased interest in reading about prevention, individuals in that condition were less likely to get all three comprehension questions right (χ2 (4) = 9.56, p = 0.048). While around 80% of the participants in the every year and every hour conditions answered all questions correctly, this number decreased to 70% in the every day condition.
Discussion
This is the first study that tested the temporal framing of CRC risks and that extended the temporal frames beyond the typical every year and every day to every hour. While we could not replicate previous findings that narrower time frames increase perceived risk (Chandran & Menon, Citation2004; Lo et al., Citation2012; Kees, Citation2010; Kim & Kim, Citation2018; White, Johnson & Kwan, Citation2014), we found that individuals are more likely to read information about mitigating the risk, if it is presented as occurring every day instead of every year or hour. While the significant effect of every day frame suggests that there may be an optimal temporal frame, future research is needed to test the frames in other contexts. Furthermore, the negative effect of the every day frame on information engagement requires further thought. Temporal framing belongs to nudge-type interventions. Nudges have shown to be effective in motivating individuals in engaging with health behaviours. There are concerns that nudge-type interventions subvert conscious deliberation and ‘lure’ people into making uninformed or misinformed choices (Ploug et al., Citation2012; Banks et al., Citation1995, Sugden, Citation2017).
In line with previous studies, we found in both experiments, which a large share of study participants tended to chose the 50% probability as answer to the questions about their perceived risk (Fischhoff & Bruine De Bruin, Citation1999). This may be caused by the high innumeracy of the study sample and the questions using absolute numerical risk scales (Gigerenzer, Citation2003; Woloshin et al., Citation1999). Around 50% of the study sample in the two experiments got the numeracy question wrong. This high rate may suggest that individuals may have had problems expressing their risk in a precise mathematical form and that numerical risk measures are problematic (Gigerenzer, Citation2003; Woloshin et al., Citation1999). Additionally, in line with previous studies, we found evidence of comparative optimism in Study 2, in that individuals perceived their own risk as lower than those of others in the every year condition (Weinstein, Citation1980).
A major advantage of our study to previous research on temporal framing is that it included a behavioural outcome measure. Previous studies have focused on investigating the effect on perceived risk and intentions to mitigate the risk. The literature on the intention-behaviour gap suggests that although individuals may develop an intention but might not necessarily realize them (Sheeran, Citation2002). This may have also been the case in the present study as around 80% participants stated that they would probably or definitely do the test, while in reality only around 43% attend Bowel Scope Screening in the UK (McGregor et al., Citation2016).
This study has some important limitations, which call for follow-up research. First, our study focuses on CRC risk only, the results can therefore not be generalised to other health issues. Second, our study does not explain why the daily frame was more effective in engaging individuals in reading about CRC prevention, as it did not affect how individuals perceived the communicated risk information. Third, while our experiments contained study participants aged 45–54 years, who are soon eligible for CRC screening, they were recruited from a panel of a commercial survey vendor. Typically, online panels are not representative of the overall population in terms of ethnic composition and educational background. As the survey was self-reported and self-selected, this could have introduced bias from participants with a greater interest in the nature of this research. Thus, future experiments are needed to test whether these findings also hold for the wider population. Additionally, Study 1 featured a relatively small statistical sample, which may have limited the power of the study and increased the margin of error. Finally, while the study included a behavioural outcome measure in form of reading about ways to prevent CRC. Other outcome measures may be better suited.
In conclusion, the present study suggests that communicating CRC incidence as either daily, hourly or yearly frame has little effect on perceptions of CRC risk or intentions to engage in preventative behaviours. However, presenting CRC incidence in daily frame had an effect on the active interest in reading about preventative behaviour, a feature which needs to be carefully considered in health communication. Such investigations could broaden the knowledge of health service providers and help them optimise health messages.
Ethical approval
All procedures performed in studies involving human participants were in accordance with the ethical standards of the institutional and/or national research committee and with the 1964 Helsinki declaration and its later amendments or comparable ethical standards. The protocols for both studies were approved by the UCL Research Ethics Committee (approval number 13439/005)
Supporting information
The supplementary file contains the flow through the experiments, information about demographic characteristics of the study samples, additional description of results, and all outcome measures of the experimental study. (PDF)
Supplemental Material
Download MS Word (471.5 KB)Disclosure statement
No potential conflict of interest was reported by the author(s).
Data availability statement
All data files and materials are publicly available via the Open Science Framework and can be accessed at https://osf.io/68awv.
Supplementary material
Supplemental data for this article can be accessed here
Additional information
Funding
References
- Banks, S. M., Salovey, P., Greener, S., Rothman, A. J., Moyer, A., Beauvais, J., & Epel, E. (1995). The effects of message framing on mammography utilization. Health Psychology, 14(2), 178. https://doi.org/10.1037/0278-6133.14.2.178
- Bonner, C., & Newell, B. R. (2008). How to make a risk seem riskier: The ratio bias versus construal level theory. Judgment and Decision Making, 3(5), 411. https://sjdm.org/journal/8210/jdm8210.html
- Bowel Cancer UK (2019). A journalist’s guide. Retrieved 19 May 2019 from https://www.bowelcanceruk.org.uk/media/
- Cancer Research UK (2016). Bowel cancer statistics. Retrieved 19 May 2019 from https://www.cancerresearchuk.org/health-professional/cancer-statistics/statistics-by-cancer-type/bowel-cancer
- Chandran, S., & Menon, G. (2004). When a day means more than a year: Effects of temporal framing on judgments of health risk. Journal of Consumer Research, 31(2), 375–389. https://doi.org/10.1086/422116
- Chandran, S., & Menon, G. (2004). When a day means more than a year: Effects of temporal framing on judgments of health risk. Journal of consumer research, 31(2), 375–389.
- Cohen, J. (1988). Statistical power analysis for the behavioral sciences–second edition. 12 Lawrence Erlbaum Associates Inc (pp. 13). Routledge. https://doi.org/10.4324/9780203771587
- Directorate-General for Health and Consumers (European Commission) Now known as, Executive Agency for Health and Consumers (European Commission) Now known as, World Health Organization, von, K. L., Patnick, J., & Segnan, N. European guidelines for quality assurance in colorectal cancer screening and diagnosis. Retrieved 15 December 2021 from https://data.europa.eu/doi/10.2772/1458
- Duffy, S. W., Myles, J. P., Maroni, R., & Mohammad, A. (2017). Rapid review of evaluation of interventions to improve participation in cancer screening services. Journal of Medical Screening, 24(3), 127–145. https://doi.org/10.1177/0969141316664757
- Fischhoff, B., & Bruine De Bruin, W. (1999). Fifty–fifty= 50%? Journal of Behavioral Decision Making, 12(2), 149–163. https://doi.org/10.1002/(SICI)1099-0771(199906)12:2<149::AID-BDM314>3.0.CO;2-J
- Gigerenzer, G. (2003). Reckoning with risk: Learning to live with uncertainty. Penguin UK.
- Gimeno Garcia, A. Z. (2012). Factors influencing colorectal cancer screening participation. Gastroenterology Research and Practice, 2012, 1–8. https://doi.org/10.1155/2012/483417
- Kees, J. (2010). Temporal framing in health advertising: The role of risk and future orientation. Journal of Current Issues & Research in Advertising, 32(1), 33–46. https://doi.org/10.1080/10641734.2010.10505273
- Kim, K., & Kim, H. S. (2018). Time matters: Framing antismoking messages using current smokers’ preexisting perceptions of temporal distance to smoking-related health risks. Health Communication, 33(3), 338–348. https://doi.org/10.1080/10410236.2016.1266579
- Kirkpatrick, L. A., & Epstein, S. (1992). Cognitive-experiential self-theory and subjective probability: further evidence for two conceptual systems. Journal of personality and social psychology, 63(4), 534.
- Lee, S., Kim, J., & Sung, Y. H. (2021). When infographics work better: The interplay between temporal frame and message format in e-health communication. Psychology & Health, 1–15. https://doi.org/10.1080/08870446.2021.1912342
- Lipkus, I. M., Samsa, G., & Rimer, B. K. (2001). General performance on a numeracy scale among highly educated samples. Medical Decision Making, 21(1), 37–44. https://doi.org/10.1177/0272989X0102100105
- Lo, S. H., Smith, S. G., Taylor, M., Good, A., & von Wagner, C. (2012). The effect of temporal framing on behavioral intentions, expectations, and behavior: The case of healthy eating. Journal of Applied Biobehavioral Research, 17(3), 202–213. https://doi.org/10.1111/j.1751-9861.2012.00085.x
- McGregor, L. M., Bonello, B., Kerrison, R. S., Nickerson, C., Baio, G., Berkman, L., Rees, C. J., Atkin, W., Wardle, J., & von Wagner, C. (2016). Uptake of bowel scope (flexible sigmoidoscopy) screening in the English National Programme: The first 14 months. Journal of Medical Screening, 23(2), 77–82. https://doi.org/10.1177/0969141315604659
- National Health Service (2017). Bowel cancer. Retrieved 19 May 2019 from: https://www.nhs.uk/conditions/bowel-cancer
- Newell, B. R., Mitchell, C. J., & Hayes, B. K. (2008). Getting scarred and winning lotteries: Effects of exemplar cuing and statistical format on imagining low‐probability events. Journal of Behavioral Decision Making, 21(3), 317–335. https://doi.org/10.1002/bdm.584
- Pandelaere, M. (2011). Fooled by numbers: Why people think that 24 months takes longer than 2 years. Jury Expert, 23(5), 23. https://heinonline.org/HOL/LandingPage?handle=hein.journals/jurexp23&div=75&id=&page=
- Pelham, B. W., Sumarta, T. T., & Myaskovsky, L. (1994). The easy path from many to much: The numerosity heuristic. Cognitive Psychology, 26(2), 103–133. https://doi.org/10.1006/cogp.1994.1004
- Ploug, T., Holm, S., & Brodersen, J. (2012). To nudge or not to nudge: Cancer screening programmes and the limits of libertarian paternalism. Journal of Epidemiol Community Health, 2012, 66, 1193-1196. https://doi.org/10.1136/jech-2012-201194
- Power, E., Miles, A., Von Wagner, C., Robb, K., & Wardle, J. (2009). Uptake of colorectal cancer screening: System, provider and individual factors and strategies to improve participation. Future Oncology, 5(9), 1371–1388. https://doi.org/10.2217/fon.09.134
- Roh, S., Rickard, L. N., McComas, K. A., & Decker, D. J. (2018). Public understanding of one health messages: The role of temporal framing. Public Understanding of Science, 27(2), 185–196. https://doi.org/10.1177/0963662516670805
- Schmälzle, R., Renner, B., & Schupp, H. T. (2017). Health risk perception and risk communication. Policy Insights from the Behavioral and Brain Sciences, 4(2), 163–169. https://doi.org/10.1177/2372732217720223
- Schreuders, E. H., Ruco, A., Rabeneck, L., Schoen, R. E., Sung, J. J., Young, G. P., & Kuipers, E. J. (2015). Colorectal cancer screening: A global overview of existing programmes. Gut, 64(10), 1637–1649. https://doi.org/10.1136/gutjnl-2014-309086
- Sheeran, P. (2002). Intention—behavior relations: A conceptual and empirical review. European Review of Social Psychology, 12(1), 1–36. https://doi.org/10.1080/14792772143000003
- Stoffel, S. T., Goodwin, M., Sieverding, M., Vlaev, I., & von Wagner, C. (2019a). Testing verbal quantifiers for social norms messages in cancer screening: Evidence from an online experiment. BMC Public Health, 19(1), 1–11. https://doi.org/10.1186/s12889-019-6997-5
- Stoffel, S. T., Yang, J., Vlaev, I., von Wagner, C., & Quaife, M. (2019b). Testing the decoy effect to increase interest in colorectal cancer screening. PloS one, 14(3), e0213668. https://doi.org/10.1371/journal.pone.0213668
- Sugden, R. (2017). Do people really want to be nudged towards healthy lifestyles? International Review of Economics, 64(2), 113–123. https://doi.org/10.1007/s12232-016-0264-1
- Sung, H., Ferlay, J., Siegel, R. L., Laversanne, M., Soerjomataram, I., Jemal, A., & Bray, F. (2021). Global cancer statistics 2020: GLOBOCAN estimates of incidence and mortality worldwide for 36 cancers in 185 countries. CA: A Cancer Journal for Clinicians, 71(3), 209–249. https://doi.org/10.3322/caac.21660
- Trope, Y., & Liberman, N. (2003). Temporal construal. Psychological review, 110(3), 403.
- Weinstein, N. D. (1980). Unrealistic optimism about future life events. Journal of Personality and Social Psychology, 39(5), 806. https://doi.org/10.1037/0022-3514.39.5.806
- White, A. E., Johnson, K. A., & Kwan, V. S. (2014). Four ways to infect me: Spatial, temporal, social, and probability distance influence evaluations of disease threat. Social cognition, 32(3), 239–255.
- Woloshin, S., Schwartz, L. M., Black, W. C., & Welch, H. G. (1999). Women’s perceptions of breast cancer risk: How you ask matters. Medical Decision Making, 19(3), 221–229. https://doi.org/10.1177/0272989X9901900301
- Zhao, X., & Peterson, E. (2017). Effects of temporal framing on response to antismoking messages: The mediating role of perceived relevance. Journal of Health Communication, 22(1), 37–44. https://doi.org/10.1080/10810730.2016.1250844