?Mathematical formulae have been encoded as MathML and are displayed in this HTML version using MathJax in order to improve their display. Uncheck the box to turn MathJax off. This feature requires Javascript. Click on a formula to zoom.
ABSTRACT
This paper presents a direct displacement-based design (DDBD) approach for the buckling restrained braces (BRBs) braced glue-laminated timber (glulam) frame (BRBGF) structures. First, the critical design parameters of the DDBD approach were derived for BRBGFs. Then, using experimentally verified numerical models, pushover analyses and nonlinear time-history analyses (NLTHAs) were conducted on a series of one-storey BRBGFs to calibrate the stiffness adjustment factor λ for BRB-timber connections and the spectral displacement reduction factor η. Finally, the DDBD approach was verified as a prospective approach for the seismic design of multi-storey BRBGF buildings by NLTHAs of the case study buildings.
1. Introduction
Multi-storey mass timber buildings have gained immense popularity worldwide due to the development of engineered wood products with enhanced structural performance compared to sawn timber. These timber buildings also hold potential for generalizing climate-change mitigation and preservation (Himes and Busby Citation2020). However, timber has a relatively low elastic modulus compared to other construction materials such as steel and reinforced concrete. In addition, timber members are prone to brittle failure under tension with a limited energy dissipation capacity. Larger member sizes are often needed to satisfy stiffness requirements, and limited ductility is usually assumed for multi-storey mass timber buildings (Kirstein, Siracusa, and Smith Citation2018). In earthquake-prone countries such as New Zealand, seismic considerations usually govern the design of lateral force resisting systems (LFRS) of multi-storey buildings. The limited ductility assumption may result in uneconomical member sizes and increase the amount of LFRS (e.g. shear walls and braces). Excess shear walls or braces may restrict the flexibility of architectural plans and reduce space efficiency.
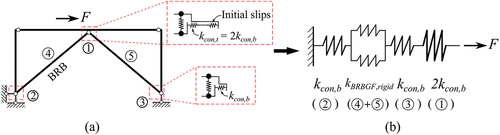
Several new solutions have been proposed to overcome these limitations. One is to introduce hybrid systems that can take advantage of the strengths of different construction materials and provide suitable solutions for LFRS (Brown et al. Citation2021; Dickof et al. Citation2014; Dong et al. Citation2020a; He et al. Citation2014, Citation2018). Quintana Gallo, Carradine, and Bazaez (Citation2021) conducted a comprehensive review of timber-based hybrid LFRS, such as steel frames with infilled cross-laminated timber (CLT) shear walls (Dickof et al. Citation2014), steel frames with light-timber frame shear walls (Luo et al. Citation2021), post-tensioned CLT shear walls with energy dissipators (Brown et al. Citation2021, Citation2022) and timber frames with energy dissipators (Gilbert and Erochko Citation2019; Song et al. Citation2022). The strength, stiffness, ductility and energy dissipation capacity were improved through the hybridisation. However, timber shear walls might be more suitable for residential buildings with fewer demands on open spaces. In addition, the post-tension loss of mass timber buildings during long-term service still requires more investigation (Granello et al. Citation2020). Timber frames with energy dissipators, providing larger open spaces and relatively accessible replacements for dissipators, are still more favoured for many projects. Recently, a new timber-steel hybrid system that integrates buckling restrained braces (BRBs) into glued laminated timber (glulam) frames was proposed and experimentally investigated (Dong et al. Citation2020b). As shown in , dowelled connections with inserted steel plates were used to connect the glulam frame with the gusset plates, and BRBs were connected to the gusset plates by pinned connections. BRBs were designed as the energy dissipating members in the system. All timber members and connections were protected by the capacity design to remain elastic before BRBs reached the maximum designed deformation (Dong et al. Citation2020b). Two full-scale specimens with two different BRB–timber interface connections were tested under cyclic loading. The test results showed that the BRB-braced glulam frames (BRBGFs) significantly increased energy dissipation capacity compared with conventional timber-braced glulam frames. In addition, the damage in the connections and glulam members was minimised as the capacity design approach was followed. As shown in , initial slips were observed on the load-drift curves of the BRBGFs because the specimens used pin-end BRBs (Metelli, Bregoli, and Genna Citation2016) and dowelled connections that required manufacturing tolerances to be installed. The experimental test data were then used to calibrate component-based numerical models in OpenSees and the modelling details are explained in Dong et al. (Citation2021). The influence of connection stiffness and initial slips on the cyclic performance of the system was investigated through parametric studies. It was shown that the connections had a negligible moment-resisting capacity, and the connections designed with a connection relative overstrength factor γ = 1.5 were suitable for engaging the BRBs and protecting the glulam members and connections. In addition, the initial slips caused by the manufacturing tolerances had a negligible impact on the ultimate strength and overall energy dissipation of the BRBGFs under cyclic loading. Further information regarding previous experimental design and numerical studies can be found in Dong et al. (Citation2020b) and Dong et al. (Citation2021), respectively.
Figure 1. BRBGF specimen with the dowelled connections (Dong et al. Citation2020b).
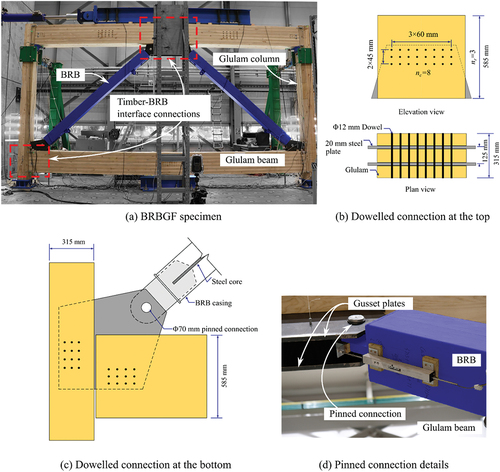
Figure 2. Comparison of BRBGF hysteresis curves (Dong et al. Citation2021).
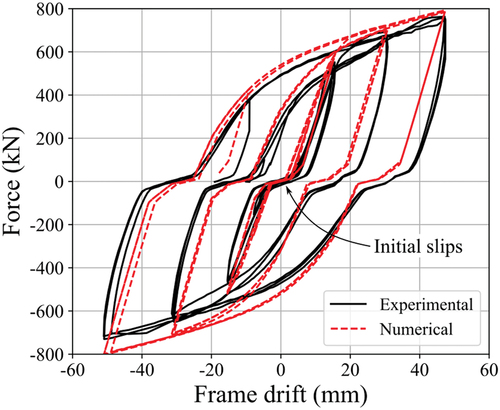
shows that the numerical models of the BRBGFs can accurately predict the cyclic performance. However, the complicated modelling process and lack of necessary design parameters of this hybrid system may still restrict its practical application. In addition, the influence of initial slips under seismic ground motions requires further investigation. This study fills the research gaps for applying a direct displacement-based design (DDBD) approach (Priestley, Calvi, and Kowalsky Citation2007) to the seismic design of BRBGF structures. It provides suitable displacement profiles, stiffness adjustment for timber–steel interface connections and hysteretic modelling for DDBD. In addition, it verifies the suitability of the approach via nonlinear time-history analyses (NLTHAs) of case study buildings, and thus facilitates the application of this hybrid system.
2. Fundamentals of the DDBD Approach
The DDBD approach was first proposed by Kowalsky, Priestley, and MacRae (Citation1994) and further developed by Priestley (Citation1995, Citation2003) to provide an alternative design solution for the traditional force-based design (FBD) approach widely used by modern design standards (e.g. Eurocode 8 (Citation2005a) and NZS 1170.5 (Citation2004)). Previous research (Maley, Sullivan, and Corte Citation2010; Priestley, Calvi, and Kowalsky Citation2007; Sullivan Citation2013) has shown that the FBD approach may have limitations for seismic design. One limitation is that the displacement response, usually directly correlated with building damage levels (Erduran and Yakut Citation2004; Ghobarah, Abou-Elfath, and Biddah Citation1999; Medina and Krawinkler Citation2005), is given only secondary importance. Alternative methods have been developed to address some of the limitations of traditional FBD approaches. For example, in the New Zealand standard NZS 1170.5 (Citation2004), the designer is prompted to satisfy structural and non-structural deformation limits and check that the design ductility is compatible with the expected ductility demands. However, these standards do not require engineers to address all the issues raised by Priestley, Calvi, and Kowalsky (Citation2007). For example, elastic analysis is used to calculate the inelastic force distributions in the FBD approach and the unique force reduction factor for a given structure type may be invalid (Priestley, Calvi, and Kowalsky Citation2007). Previous research has shown that the DDBD approach might benefit some conditions more than the FBD approach for nonlinear seismic design (Salawdeh and Goggins Citation2016; Terán-Gilmore and Ruiz-García Citation2011). Consequently, the DDBD approach has been used in a variety of structural systems, including reinforced concrete structures (Belleri Citation2017; Pennucci, Calvi, and Sullivan Citation2009; Priestley and Kowalsky Citation2000; Sullivan, Priestley, and Calvi Citation2006; Yang and Lu Citation2018), steel structures (Malla and Wijeyewickrema Citation2021; Nievas and Sullivan Citation2015; Roldán, Sullivan, and Della Corte Citation2016; Sahoo and Prakash Citation2019; Sullivan Citation2013; Wijesundara Citation2012) and timber structures (Chen et al. Citation2021; Filiatrault and Folz Citation2002; Hashemi, Zarnani, and Quenneville Citation2020; Li et al. Citation2019; Pang and Rosowsky Citation2009; Thiers-moggia and Málaga-Chuquitaype Citation2021; Zonta et al. Citation2011). A model code for the DDBD approach was also developed for practical design guidelines (Sullivan, Priestley, and Calvi Citation2012). For BRBGF structures, the initial slips, as shown in , may cause difficulty in estimating the initial stiffness and fundamental period essential for the FBD approach. Therefore, the FBD approach may not be well suited to particular cases of BRBGFs. The DDBD approach implicitly assumes that a low initial stiffness will not affect the displacement demands in high-intensity earthquakes by utilising the secant stiffness concept (a hypothesis that will be verified in this work). In this regard, the DDBD approach is developed for the BRBGF structures.
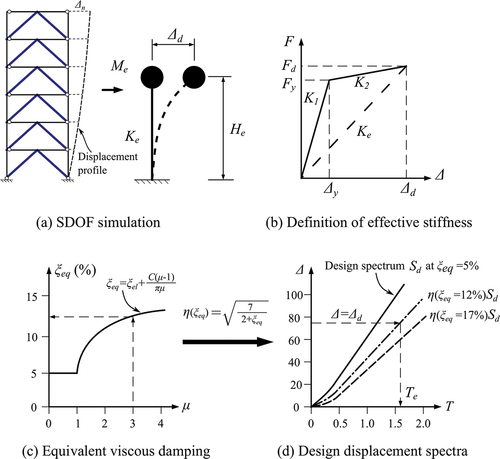
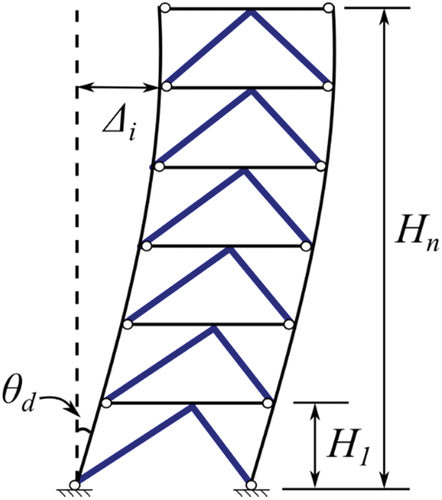
The primary process of the DDBD approach (Priestley, Calvi, and Kowalsky Citation2007) is illustrated in . The first step is to substitute a multi-degree-of-freedom (MDOF) structure with an equivalent single-degree-of-freedom (SDOF) system (). A displacement profile of the MDOF structure under seismic loads is assumed based on the knowledge of the design displacement profile. Therefore, the equivalent SDOF system characterised by its design displacement Δd, effective mass Me, and effective height He can be calculated by EquationEq. 1(1)
(1) -EquationEq. 3
(3)
(3) .
Figure 3. DDBD design approach (Priestley, Calvi, and Kowalsky Citation2007).
where Δi is the storey drift at the i-th storey (mm); mi is the seismic mass at the i-th storey (tons); Hi is the height of the i-th storey from the ground (m); n is the total number of storeys.
The second step is to calculate the equivalent SDOF system ductility demand μ at the design displacement Δd according to EquationEq. 4(4)
(4) , with the design and yield displacement points shown in . To quantify the effects of nonlinear behaviour on the displacement demands, Priestley, Calvi, and Kowalsky (Citation2007) recommended characterising the equivalent SDOF system with an equivalent viscous damping ratio ξeq, which is a function of μ, as shown in . ξeq is computed using an empirical ξeq-μ relationship calibrated to the results of NLTHA, as will be discussed further in Section 3.3. The design displacement spectrum of an SDOF system is scaled to ξeq, as shown in , using the spectral displacement reduction factor η, a function of ξeq. Thus, the required Te for the equivalent SDOF system can be obtained according to Δd. Then, Ke and the design base shear force Vd can be determined using EquationEq. 5
(5)
(5) and EquationEq. 6
(6)
(6) , respectively, when the P–Δ effects are not significant.
The design base shear force Vd for the equivalent SDOF system is also the design base shear force for the MDOF structure, so the third step is to distribute Vd along the height of the structure as storey forces Fi using EquationEq. 7(7)
(7) . These forces are used to design the structural members in MDOF structures, with possible adjustments to the force profile for taller buildings to mitigate higher mode effects (as clarified later in Section 3.2).
3. Extending the DDBD Approach to the BRBGF Structures
To apply the DDBD approach to BRBGF structures, the following knowledge is required: (1) the displacement profile and the design displacement at the performance limit state for BRBGF structures when substituting BRBGFs into an equivalent SDOF system (); (2) μ for BRBGF structures (), requiring estimation of the yield displacement; and (3) the relationship between ξeq and μ to obtain Te (). In this section, the determination of these design parameters is discussed.
3.1. Displacement Profile and Limit State Displacement
The design displacement Δd of the equivalent SDOF system depends on the assumed displacement profile and the limit state displacement of the MDOF structure, as shown in EquationEq. 1(1)
(1) . Past research has shown that the empirical displacement profile for moment-resisting frame (MRF) structures proposed by Priestley, Calvi, and Kowalsky (Citation2007) is also suitable for concentrically braced frame (CBF) structures (Pettinga and Priestley Citation2005; Wijesundara and Rajeev Citation2012). Rajeev et al. (Citation2017) verified the feasibility of the empirical displacement profile based on numerous NLTHAs of steel CBF structures; Maley, Sullivan, and Corte (Citation2010) also found that it worked well for dual BRB-MRF systems. Therefore, the empirical displacement profile shown in was used for BRBGF structures. The first storey has the largest inter-storey drift ratio, so the performance limit state displacement is governed by the first storey design inter-storey drift ratio θd. The empirical design displacement profile can be expressed as a function of θd as shown in EquationEq. 8a
(8a)
(8a) according to Sullivan, Priestley, and Calvi (Citation2012). Suppose more accurate displacement profiles of multi-storey BRBGF structures from shake table testing or building monitoring are available in the future. In that case, the displacement profile assumption can be improved, but the entire process of the DDBD approach presented in this study could remain the same.
Figure 4. Assumed displacement profile.
Previous research illustrated that higher mode effects might increase the peak storey drift demands (Gardiner, Clifton, and MacRae Citation2013). Sullivan (Citation2013) suggested reducing the first mode design displacement profile to account for the additional displacements caused by the higher mode effects. Therefore, the design drift reduction factor ωθ (EquationEq. 8b)(8b)
(8b) adapted by Sullivan, Priestley, and Calvi (Citation2012) was included in the displacement profile to account for the higher mode effects of BRBGF structures.
The design inter-storey drift ratio θd depends on the performance requirements of both structural and non-structural elements. Recent research on low-damage non-structural elements showed that the improved design of these non-structural elements could sustain a 2.0–2.5% drift ratio with minor damage (Dhakal et al. Citation2016). As the performance limits of non-structural elements are out of the scope of this study, the performance limits were determined by the structural elements. The serviceability performance limit of θd was set to 0.33% based on New Zealand engineering practice (Hashemi, Zarnani, and Quenneville Citation2020). The BRBGF tests (Dong et al. Citation2020b) showed that the residual drift ratio could be over 0.5% after loading to a 1.0% drift ratio, and the residual drift ratio of 0.5% was suggested as the permissible residual drift ratio for safety by McCormick et al. (Citation2008), so the repairable damage limit state of θd was set to 1.0%. The ultimate limit state (ULS) drift ratio was set to 2.0% conservatively because the BRBGF tests proved that the BRBGF structures could sustain this drift limit without collapse or significant damage to timber members and connections (Dong et al. Citation2020b). A higher θd may be adopted in the future if it is verified through further research and testing.
3.2. Ductility Factor
The ductility factor μ of the equivalent SDOF system is used to estimate the equivalent viscous damping ξeq, as shown in , before obtaining the effective period Te. The yield displacement Δy is required to determine μ, as shown in EquationEq. 4(4)
(4) . The following sub-sections discuss the determination of Δy and links the ductility factor of each storey of BRBGF structures with its equivalent SDOF system.
3.2.1. Yield Drift of One-storey BRBGFs
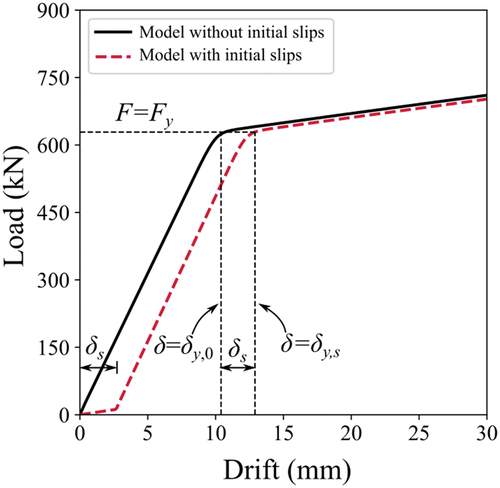
Numerical models of the one-storey BRBGFs with dowelled connections were built in the OpenSees, as shown in . The modelling methods in Dong et al. (Citation2021) was followed and briefly explained below. The experimental tests showed that the BRB–timber interface connections had negligible moment-resisting capacity (Dong et al. Citation2020b), so their rotational stiffness was set to zero. The translational stiffness of the interface connections was modelled using Pinching4 models in OpenSees with ZeroLength elements between nodes 5 and 6, nodes 1 and 7, and nodes 3 and 8. As shown in , the initial slips were simulated by ElasticMultiLinear model in OpenSees as a spring in series between nodes 5 and 6. The stiffness of the ElasticMultiLinear model was low when the drift was smaller than the specified initial slips, but the stiffness would be significantly higher than that of BRBs when the drift exceeded the initial slips. All glulam beams and columns were simulated by elasticBeamColumn model because they were protected by the capacity design. The detailed parameters for the interface connections and the experimental verification process can be found in Dong et al. (Citation2021). Several methods have been used to define the yield drift (Priestley, Calvi, and Kowalsky Citation2007). The definition from Park (Park Citation1989) was used here because it could include the influence of the initial slips that might exist in BRBGF structures. In addition, the two well-defined linear parts of the backbone curves of the BRBGF specimens fitted the definition well (Dong et al. Citation2020b). The yield drift, δy,s, is defined as the lateral displacement corresponding to the yield strength, Fy, calculated using EquationEq. 9(9)
(9) and is equal to the lateral force when both BRBs yield. Pushover analyses were conducted for the one-storey BRBGFs with and without the initial slips; shows the load-drift curves. The curves illustrate that the yield drift with initial slips δy,s was the yield drift without initial slips δy,0 plus initial slips δs, as shown in EquationEq. 10
(10)
(10) .
Figure 5. Numerical model of the one-storey BRBGF.
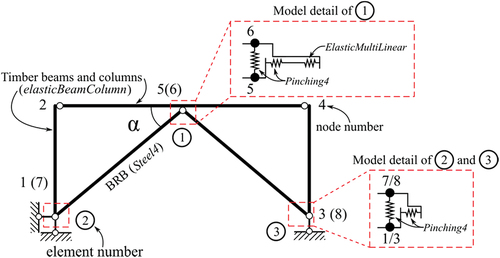
Figure 6. Yield drift definition.
where ϕm is the material overstrength factor for the steel core of BRB; fy is the expected steel yield strength (MPa); Ac is the area of the yield zone of steel core of BRB (mm2); α is the inclination angle of the BRBs as shown in .
3.2.2. Yield Drift of Multi-storey BRBGFs
Past research (Della Corte Citation2006; Maley, Sullivan, and Corte Citation2010; Sullivan, Priestley, and Calvi Citation2012; Wijesundara and Rajeev Citation2012) has illustrated that the inter-storey yield drift at the i-th storey δy,i in a multi-storey building may need to consider the inter-storey drift caused by the BRB deformation δy,i,BRB, and the inter-storey drift caused by the column axial deformation δy,i,col, as shown in . Similar to the one-storey BRBGF, the inter-storey drift contributions of the initial slips δs,i need to be included, so δy,i was calculated using EquationEq. 11(11)
(11) .
Figure 7. Yield drift components (a) the inter-storey drift contribution of the BRB deformation δy,i,BRB; (b) the inter-storey drift contribution of the column axial deformation δy,i,col.
The component δy,i,BRB was estimated using EquationEq. 12a(12a)
(12a) based on research from Sullivan, Priestley, and Calvi (Citation2012). In BRB steel frames, the connections between BRBs and steel frames are usually translationally rigid. The frame lateral stiffness is equal to the lateral stiffness of BRBs, whereas, in BRBGF structures, the connection stiffness should be considered. Stiffness is considered by introducing a stiffness adjustment factor λ, as shown in EquationEq. 12b
(12b)
(12b) . λ defines the lateral stiffness ratio between the BRBGF with translationally semi-rigid dowelled connections and the BRBGF with translationally rigid connections; therefore, λ should be between 0 and 1. The BRBs were modelled by Steel4 model in OpenSees as a truss, as shown in ; thus the stiffness of BRBs was represented by an effective stiffness, Keff,BRB, as shown in EquationEq. 13a
(13a)
(13a) dependent on the geometry of the yield zone, transition zone and elastic zone of BRBs according to Vigh and Zsarnóczay and Balogh (Citation2017). To simplify the calculation, the additional stiffness caused by the transition zone and the elastic zone was considered by a stiffness modification factor fsm that amplified the elastic modulus of steel core Es as shown in EquationEq. 13b
(13b)
(13b) according to Vigh, Zsarnóczay, and Balogh (Citation2017). The detailed parameters for Steel4 can be found in the Appendix of Dong et al. (Citation2021). In terms of that, the yield strain εy in EquationEq. 12a
(12a)
(12a) was calculated using EquationEq. 12c
(12c)
(12c) to include the influence of steel core material (fy,ϕm, and Es) and BRB geometry (fsm).
with
where hi is the storey height of the i-th storey (m); and θy,i,BRB is the inter-storey drift ratio of the i-th storey caused by BRB deformations; εy is the BRB yield strain; fsm is the stiffness modification factor as defined in Eq. 13; Es is the elastic modulus of steel core (GPa).
where Keff,BRB is the BRB effective stiffness (kN/mm); Ac,Atr, and Ae are the area (mm2) of the yield zone, transition zone and elastic zone of the BRB, respectively; lc,ltr, and le are their corresponding length (mm) (Zsarnóczay Citation2013); fy is the expected steel yield strength.
shows a spring analogy model for the BRBGF, similar to the model proposed by Mahjoubi and Maleki (Citation2016). As the top connection carried the load approximately twice as much as the bottom connections in the BRBGFs, the fastener number in the bottom connections was assumed to be half of that of the top connections. In this regard, the translational stiffness of the bottom connection kcon,b was approximately half of that of the top connections kcon.t in the model (i.e. kcon.t = 2kcon.b). To simplify the spring analogy model further, a stiffness ratio ν between kcon,b and the BRB lateral stiffness kBRBGF,rigid is defined as EquationEq. 14a(14a)
(14a) . kBRBGF,rigid represents the BRBGF stiffness with the assumption of translationally rigid connections; kBRBGF can be calculated using EquationEq. 14b
(14b)
(14b) considering the contributions from the translationally semi-rigid top and bottom connections. By comparing EquationEq. 12b
(12b)
(12b) and EquationEq. 14b
(14b)
(14b) , λ is a function of ν, as shown in EquationEq. 14c
(14c)
(14c) .
Figure 8. BRBGF spring analogy.
The component δy,i,col was calculated using EquationEq. 15a(15a)
(15a) assuming that the columns exhibit similar deformations in tension and compression (Wijesundara and Rajeev Citation2012). As it is difficult to determine the timber column strain before choosing the member sizes for BRBs, beams and columns, a strain adjustment factor ρ was used to convert the axial strain of timber column εcol to the yield strain of yield zone of BRB εy, as shown in EquationEq. 15a
(15a)
(15a) . An average strain adjustment factor ρavg along the entire height was empirically assumed as 0.4 to simplify the preliminary design. This value is verified by NLTHAs in Section 4.
where εcol,j is the axial strain of glulam columns at the j-th storey below the i-th storey (i.e. j < i); ρj is the strain adjustment factor between the glulam columns and BRB at the j-th storey; L (= 8 m) is the span of BRBGF; Ac,k (mm2) is the BRB yield zone area at the k-th storey above the j-th storey (i.e. j < k < n); EGL (= 10 GPa) is the glulam column elastic modulus; Acol,j is the glulam column cross-section area (mm2) at the j-th storey.
3.2.3. Ductility Factor of the Equivalent SDOF System μsys
The ductility factor of the equivalent SDOF system μsys is defined by EquationEq. 16a(16a)
(16a) according to Maley, Sullivan, and Corte (Citation2010). Similar to EquationEq. 4
(4)
(4) , the ductility factor for the i-th storey μi is defined by EquationEq. 16b
(16b)
(16b) . Although the base shear force Vbase is initially unknown, EquationEq. 16a
(16a)
(16a) contains the shear force in the numerator and denominator. For the initial design, μsys can be obtained by assuming a total base shear Vbase = 1.0 and recognising that the strength proportions are a design choice. The shear force at the i-th storey Vi was calculated using EquationEq. 16c
(16c)
(16c) . Different from EquationEq. 7
(7)
(7) , Sullivan, Priestley, and Calvi (Citation2012) recommended EquationEq. 16d
(16d)
(16d) to distribute the base shear force over the height of frame systems, where an additional 10% of the base shear force was allocated at the roof level to consider the higher mode effects.
where Fj is the distributed load at the j-th storey:
3.3. Equivalent Viscous Damping ξeq and Spectral Displacement Reduction Factor η
The relationships among the ductility factor μ, equivalent viscous damping ξeq, and spectral displacement reduction factor η of the equivalent SDOF system are required for the DDBD approach, as shown in . ξeq has traditionally been calculated by EquationEq. 17(17)
(17) as the summation of elastic viscous damping ξel and hysteretic damping ξhyst. Traditionally, ξhyst has been calculated using EquationEq. 18a
(18a)
(18a) based on an area-based approach proposed by Jacobsen (Citation1960). However, several studies have indicated that the area-based approach can be inaccurate, especially for systems with a high energy dissipation capacity (Dwairi, Kowalsky, and Nau Citation2007; Grant, Blandon, and Priestley Citation2005). As such, ξhyst was calibrated using the results of NLTHAs and EquationEq. 18b
(18b)
(18b) for different types of hysteretic models (Blandon and Priestley Citation2005; Dwairi, Kowalsky, and Nau Citation2007; Liu et al. Citation2015) and structures (Ghaffarzadeh, Jafari, and Talebian Citation2014; Khan, Kowalsky, and Nau Citation2016; Landi, Diotallevi, and Tardini Citation2012; Loss, Zonta, and Piazza Citation2012; Mazza and Vulcano Citation2014; Sullivan Citation2013; Sullivan and O’Reilly Citation2014; Wijesundara, Nascimbene, and Sullivan Citation2011; Yahyai and Rezayibana Citation2015; Yan, Gong, and Zhang Citation2018) including timber-steel hybrid structures (Bezabeh, Tesfamariam, and Stiemer Citation2016) and BRB steel frames (Sullivan, Priestley, and Calvi Citation2012). Even though expressions for timber and BRB systems exist, the hysteretic behaviour of BRBGFs is different from that of other timber-steel hybrid structures. In addition, ξhyst for BRB steel frames was derived by using the bi-linear hysteretic shape for BRBs (Sullivan, Priestley, and Calvi Citation2012), which might not accurately represent the performance of BRBs because the isotropic and kinematic hardening in tension and compression could be significant (Vigh, Zsarnóczay, and Balogh Citation2017) and the initial slips and semi-rigid connections in BRBGFs might reduce ξhyst.
where Ahyst is the dissipated energy in an entire hysteretic loop (kJ); Fm and Δm are the maximum force (kN) and displacement (mm) for the hysteretic loop, respectively; C is a constant.
In addition to the ductility-dependent equivalent viscous damping expression, an expression is required to scale displacement spectra to different levels of equivalent viscous damping. EquationEq. 19a(19a)
(19a) and EquationEq. 19b
(19b)
(19b) provide equations for the spectral displacement reduction factor η in the previous Eurocode 8 (Citation1998) and current Eurocode 8 (Citation2005a). This factor is used to scale the displacement spectrum based on ξeq and then obtain the required effective period Te, as shown in . However, past research (Grant, Blandon, and Priestley Citation2005; Pennucci, Sullivan, and Calvi Citation2011) has demonstrated that the ξeq-μ relationship is dependent on site seismicity, and this dependency is not explicitly expressed in EquationEq. 18b
(18b)
(18b) . Using EquationEq. 18b
(18b)
(18b) with EquationEq. 19a
(19a)
(19a) and EquationEq. 19b
(19b)
(19b) may result in inconsistent designs at different sites (Pennucci, Sullivan, and Calvi Citation2011). Therefore, Pennucci, Sullivan, and Calvi (Citation2011) suggested combining the two steps in into one step and deriving the relationship between η and μ directly because the η-μ relationship did not show an apparent dependency on the site seismicity. A more detailed explanation on using the form of EquationEq. 20
(20)
(20) over Eq. 19 can be found in Dong (Citation2021). Improved accuracy was observed from numerous NLTHAs by Pennucci, Sullivan, and Calvi (Citation2011). In this study, an attempt was made to establish a direct relationship between η and μ for the BRBGF structures.
shows the comparison between the numerical modelling results of the BRBGF with dowelled connections in and the fitted Takeda fat hysteresis model (rt = 0.05, βt = 0.6 and D = 0.0) in . Although the Takeda fat model is often used to represent the hysteresis loops of concrete frames (Priestley, Calvi, and Kowalsky Citation2007), the comparison shows that it can also provide an approximate fit to the hysteresis loops of the BRBGF. The maximum difference of the total energy dissipation was about 10% (291 kJ versus 261 kJ). The η-μ relationship for the Takeda fat model, given by EquationEq. 20(20)
(20) , was calibrated by Pennucci, Sullivan, and Calvi (Citation2011) with numerous NLTHAs. In this study, we determined whether EquationEq. 20
(20)
(20) could also be applied to BRBGF structures.
Figure 9. Comparison between the component-based model and Takeda fat model.
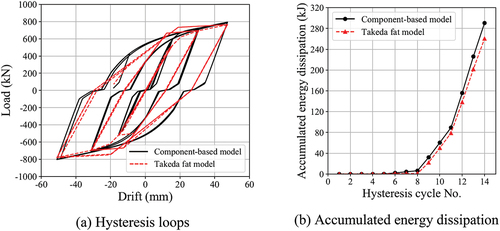
Figure 10. Takeda fat model (Priestley, Calvi, and Kowalsky Citation2007).
3.4. Calibration of Design Parameters
The stiffness adjustment factor, λ (EquationEq. 12b)(12b)
(12b) must be determined and the applicability of the η-μ relationship (EquationEq. 20)
(20)
(20) for BRBGF structures must also be assessed. Pushover analyses and NLTHAs were conducted to determine λ and assess EquationEq. 20
(20)
(20) , respectively, using numerical models of the one-storey BRBGF as shown in .
3.4.1. Numerical Models
A series of one-storey BRBGF models were built in OpenSees. The models had an 8 m span and 3.6 m height with BRBs installed at an inclination angle α = 42°. All BRBs were made of S235 (British Standard Institution (BSI) Citation2005b) steel with a material overstrength ϕm = 1.2 (Sullivan, Priestley, and Calvi Citation2012), elastic modulus Es = 210 GPa and a BRB overstrength factor γBRB = 1.5, i.e. ωβ = 1.5, where ω is the BRB strain hardening adjustment factor, and β is the BRB compression strength adjustment factor (American Institute of Steel Construction (AISC) Citation2016). Three design variables were considered: (1) cross-section of the yield zone in BRBs, (2) stiffness modification factor fsm, and (3) initial slips due to manufacturing tolerances. lists the configurations of the BRBGFs considered. Three cross-sections of BRBs were considered for implementation in the lower, middle and upper storeys of a BRBGF structure (Dong et al. Citation2020b), which corresponded to a lateral design load of 226 kN, 436 kN and 629 kN, respectively. The BRBGF yield load was calculated by EquationEq. 9(9)
(9) . All connections were designed with a connection relative overstrength factor γ = γBRB = 1.5, i.e. the design strength of the connections was 1.5 times the load transferred to the connections when the BRBs yielded (Dong et al. Citation2021). Although fsm depends on the BRB geometry (Aguaguiña, Zhou, and Zhou Citation2019), it typically varies within ± 10% if the same steel grade is used. In this regard, three different values of fsm were included to consider the influence of BRB stiffness. In addition, three different levels of initial slips caused by manufacturing tolerances were considered for ideally tight, medium and maximum allowable manufacturing tolerances in practice (Dong et al. Citation2021). Thus, 27 BRBGF configurations were considered in the simulations; each of them was denoted according to the combination of design variables. For example, “75 × 20–1.22-2.5” represents a BRBGF with 75 mm × 20 mm yield zone of BRBs, fsm = 1.22, and ± 2.5 mm initial slips.
Table 1. Parameters of one-storey BRBGF models.
3.4.2. Analyses of One-storey BRBGF Models
Following the procedure shown in , numerical simulations were conducted on the 27 BRBGF configurations. Pushover analyses were performed first and the system and component stiffness values were evaluated. lists the results for λ which are between 0.70 and 0.74. Therefore, the average λ = 0.72 is used in EquationEq. 12a(12a)
(12a) to calculate the BRBGF drift δy,i,BRB when the BRBs begin to yield. λ = 0.72 also means that the translationally semi-rigid dowelled connections between the BRBs and glulam frames causes a 28% reduction in the system stiffness compared with the BRBGF with the translationally rigid connection assumption.
Table 2. Results of stiffness adjustment factor λ.
Figure 11. Procedure of parameter verification.
NLTHAs were then conducted using ten ground motion records selected by Maley et al. (Citation2013) from the Pacific Earthquake Engineering Research Centre database (PEER Citation2005) and GeoNet (Houtte et al. Citation2017), as listed in . The near-fault effect was not considered in the records. The average acceleration spectra were scaled to match the design acceleration spectra of soil type D in New Zealand seismic load standard NZS 1170.5 (Citation2004). The average acceleration spectra were scaled to an intensity level of 0.23 g with a return period of 25 years, as shown in , ensuring that Te of the equivalent SDOF system mostly fell into the Te > 1.0 s region. Research by Dwairi, Kowalsky, and Nau (Citation2007) and Grant, Blandon, and Priestley (Citation2005) has shown that η is lower for Te < 1.0 s than that for Te > 1.0 s. Additionally, Te for most structures falls into the Te > 1.0 s region (Priestley, Calvi, and Kowalsky Citation2007), so scaling into Te > 1.0 s region will result in more realistic predictions for most structures. The scale factors are denoted as SF1 in . The design acceleration spectrum Sa(T) in are transferred to the design displacement spectrum Sd(T) using EquationEq. 21(21)
(21) to calculate η.
Table 3. Ground motion records and scale factors for NLTHA.
Figure 12. Acceleration spectra scaling process.
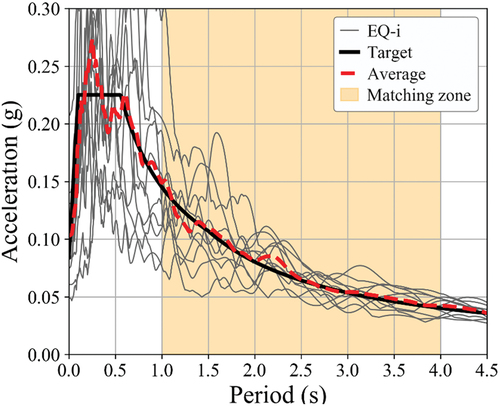
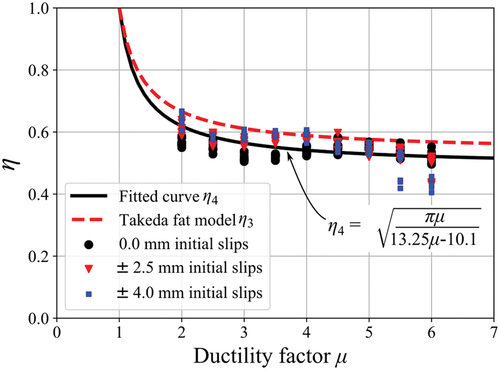
The NLTHAs were conducted for each one-storey BRBGF model from μ = 1.5 to 6.0 with an increment of 0.5, resulting in 270 equivalent SDOF systems. 27 of them fell outside the matching zone in and were discarded. The 243 remaining equivalent SDOF systems were used to calculate η by EquationEq. 22(22)
(22) . The three variables in had a minor influence on the η–μ relationship. For example, the results of η from equivalent SDOF systems with different initial slips are plotted with different symbols in and no significant difference was observed among them. The reason might be that these variables primarily affected the magnitude of the yield drift δy,s, while μ included the influence of δy,s. shows that the best-fitted curve from the 243 equivalent SDOF systems (denoted as η4) was similar to η3 for the Takeda fat model and slightly smaller than η3, that is, on the conservative side. This agrees with the earlier observation in that the Takeda fat model tends to slightly underestimate the energy dissipated by BRBGF structures at large displacements. Therefore, η3 (EquationEq. 20)
(20)
(20) can be used to represent the spectral displacement reduction factor for BRBGF structures conservatively.
Figure 13. Verification of η–μ relationship.
4. Case Studies on the DDBD Approach
The DDBD approach with calibrated parameters was used for the ULS seismic design of case study BRBGF buildings with three, six, and nine storeys. Numerical models of these buildings were established in OpenSees and analysed using real earthquake ground motion records. The analysis results were compared with design values to verify the DDBD approach.
4.1. Case Study Buildings
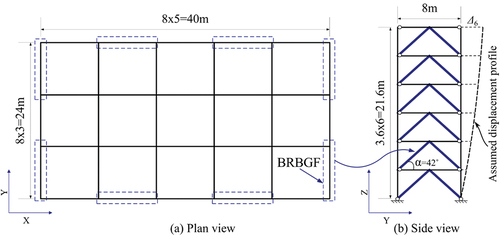
The three BRBGF buildings with three, six and nine storeys were denoted as BRBGF-3, BRBGF-6, and BRBGF-9, respectively. They shared the same floor plans, and BRBGF-6 is shown in as an example. These buildings are located in Christchurch, New Zealand. Continuous glulam columns for every three storeys were used to reduce splice joints of columns and for transportation convenience, which is also a common practice for timber construction. CLT floors and roofs with concrete topping were used with a rigid diaphragm assumption. The weights of the floors and roof were obtained from the CLT manufacturer (XLam NZ Limited Citation2016) and all the loading information is listed in according to NZS 1170.5 (Citation2004). Appendix I provides a design flowchart of the procedure for the extended DDBD approach mentioned in Section 3.
Table 4. Loading information of case study buildings.
Figure 14. BRBGF-6 design example.
4.2. Design Results of the DDBD Approach
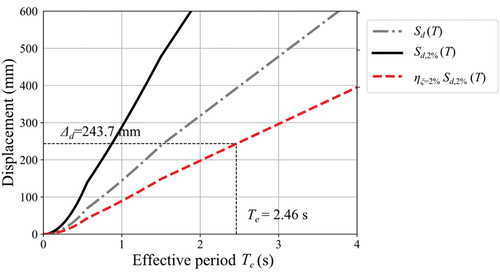
The design information for BRBGF-6 is listed in as an example. Appendix II shows a detailed step-by-step calculation procedure for parameters in . The elastic viscous damping ξel was assumed to be 2% (Hashemi, Zarnani, and Quenneville Citation2020). Pennucci, Sullivan, and Calvi (Citation2011) proposed EquationEq. 23a(23a)
(23a) that uses γ2% to adjust η3 from ξel = 5% to ξel = 2%, which is denoted as ηξ=2%. The corresponding design displacement spectrum at ξel = 2% (denoted as Sd,2% (T)) was first obtained using η2 according to Eurocode 8 (Citation2005a), as shown in EquationEq. 23c
(23c)
(23c) , and then reduced by ηξ=2% to obtain Te, as shown in . Subsequently, Ke and Vd were calculated using EquationEq. 5
(5)
(5) and EquationEq. 6
(6)
(6) , respectively. Furthermore, the design base shear Vbase should include the P–Δ effects using Eq. 24 according to Sullivan, Priestley, and Calvi (Citation2012).
Table 5. Design parameters of BRBGF-6.
Figure 15. Adjusted displacement spectrum.
where VP-Δ is the additional base shear owing to the P–Δ effects; CP-Δ is the P–Δ force adjustment factor; g (= 9.8 m/s2) is the gravitational acceleration.
A similar process was conducted for BRBGF-3 and BRBGF-9, and the design information of the three BRBGF structures is listed in .
Table 6. DDBD information of case study buildings.
4.3. Design BRB and Glulam Members
The base shear Vbase was distributed over the height according to EquationEq. 16d(16d)
(16d) . The shear force at the i-th storey Vi was resisted by two BRBs together, so the BRBs were designed using EquationEq. 25a
(25a)
(25a) and EquationEq. 25b
(25b)
(25b) according to the force equilibrium. Subsequently, glulam beams and columns were designed considering the BRB overstrength factor γBRB (= 1.5). The glulam columns were designed using the maximum axial load. The glulam beams were designed by combining the maximum axial load and corresponding moment caused by the uneven force of the two BRBs at the mid-span (López and Sabelli Citation2004). The member sizes of the three BRBGF structures are listed in .
Table 7. Member size information of BRBGF-3.
Table 8. Member size information of BRBGF-6.
Table 9. Member size information of BRBGF-9.
where Ac,i is the yield zone area of BRB at the i-th storey (mm2); Ni,BRB is the BRB axial load caused by Vi at the i-th storey (kN).
4.4. Verification by NLTHA
4.4.1. Multi-storey BRBGF Models
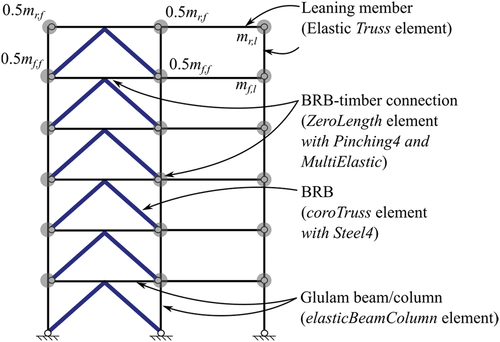
The DDBD approach was verified using NLTHA in OpenSees. The rigid diaphragm assumption was applied, so the seismic load was assumed to be equally distributed among the four BRBGFs in each direction of the buildings. For simplification, only one bay of the BRBGF structures was modelled and the gravity frames were simulated as a leaning column, as shown in , with the BRBGF-6 model as an example. One-fourth of the seismic weight of the entire building was concentrated and added to the top of each storey as shown in . The total seismic weight mtotal was allocated to the BRBGF and the gravity frames according to their tributary areas. The seismic weight of floors and roofs in BRBGFs were calculated using EquationEq. 26(26)
(26) according to NZS 1170.5 (Citation2004) and the load information in , as shown in Appendix II. The tributary area Atributary in the X-direction of was 32 m2 which came up with the seismic weight on floor node mf,f (= 8.7 tons) and roof node mr,f (= 5.1 tons) for the BRBGFs. The remaining mtotal was added to gravity frames, modelled as a leaning column. The seismic weights on floor and roof node were mf,l (= 48.1 tons) and mr,l (= 27.8 tons), respectively.
Figure 16. Six-storey BRBGF OpenSees model.
where Sd,earthquake is the seismic weight (kN); G and Q are the dead load, and live load (kPa), respectively; Atributary is the corresponding tributary area (m2).
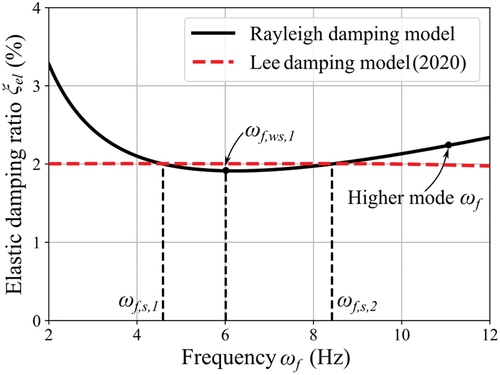
The damping model from Lee (Citation2020a, Citation2020b, Citation2021) was used for the NLTHAs. In the current implementation of the Lee damping model in OpenSees, the damping coefficient matrix Cd is assumed to be proportional to the structural tangent stiffness matrix (Mazzoni et al. Citation2006). The performance and issues of this approach have been discussed by Lee (Citation2022) and some details are briefly provided in Appendix III. The Lee damping model targets a constant elastic damping ratio ξel over an assigned frequency range, as shown in , which complies with the basic assumption in the earthquake dynamics of structures better than Rayleigh damping (Chopra and McKenna Citation2016). The general drawbacks of Rayleigh damping have been discussed in detail (Charney Citation2008; Chopra and McKenna Citation2016). shows ξel at the first natural frequency (ωf,s,1) and the second natural frequency (ωf,s,2) of a six-storey BRBGF structure with 2.5 mm initial slips as well as ξel at the first natural frequency (ωf,ws,1) of a six-storey BRBGF structure without initial slips. The BRBGF structure with initial slips had lower initial stiffness than that without initial slips and thus had a lower first natural frequency ωf,s,1 compared with ωf,ws,1. As shown in , the Rayleigh damping model may slightly underestimate ξel when the slips of BRBGF structures are overcome and significantly overestimate ξel at higher modes compared with the Lee damping model. Therefore, the Lee damping model can avoid unrealistically high damping ratio predictions at higher modes. It also avoids spurious damping forces during the inelastic response (Lee Citation2020a).
Figure 17. Comparison of damping ratio.
4.4.2. Ground Motion Selection
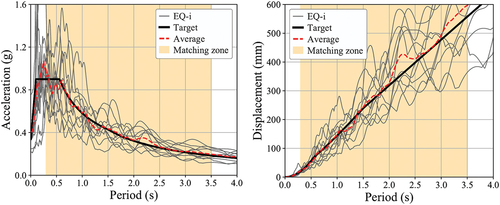
The same ten ground motions listed in were scaled to match the design acceleration and displacement spectra at the ULS with a return period of 500 years. The matching period is from 0.3–3.5 s, as shown in , which is enough to cover the Te of the buildings studied under this case. The scale factors are listed in as SF2.
Figure 18. Acceleration spectrum and displacement spectrum matching.
4.4.3. Displacement and Inter-storey Drift Ratio Response
shows the maximum displacement and inter-storey drift ratio (IDR) under each ground motion EQ-i from the NLTHA of the three BRBGFs compared to the mean and design target values. The mean values of the maximum IDR for BRBGF-6 and BRBGF-9 were 2.0% and 1.7% respectively, which are close to the design drift ratio θd (= 2.0%). The rest of the IDR results were smaller than θd. The DDBD approach provided reasonably accurate and conservative predictions for the maximum displacement and IDR.
Figure 19. Maximum displacement profile and inter-storey drift ratio response. (a) BRBGF-3. (b) BRBGF-3. (c) BRBGF-6. (d) BRBGF-6. (e) BRBGF-9. (f) BRBGF-9.
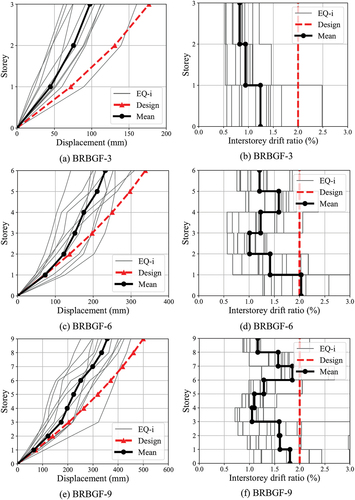
also shows that the IDR of the first storeys agreed better with the DDBD target drift than those of the upper storeys. One reason for this might be the actual shear force distribution along the height could be different from EquationEq. 16d(16d)
(16d) because BRB frames are more sensitive to the formation of a soft storey (Erochko et al. Citation2011). The first storey was designed to have a higher ductility μ1, as listed in , so it was expected to enter the yielding stage early. Once the first storey yielded, the stiffness of the storey decreased significantly. Thus, more deformations tended to concentrate on the first storey. Although the soft storey is a potential issue for BRB frames, the design examples illustrate that the DDBD approach can avoid excessive deformation concentration in one specific storey, and the displacement of BRBGFs is well controlled in general. It is also worth mentioning that the similarity between the actual displacement profile and the assumed profile is essential to ensure a good prediction of the DDBD approach (Priestley, Calvi, and Kowalsky Citation2007). Continuous columns at lower storeys are suggested for BRBGF systems to help avoid excess drift concentration on the first storey, so that the actual displacement profile of BRBGFs is close to the assumed displacement shape. Another reason for the slightly conservative predictions is that the cross-section design of BRBs (EquationEq. 25
(16b)
(16b) ) neglects the strain hardening effect after yielding. As shown in , the DDBD approach is more conservative for BRBGF-3 than for BRBGF-6 and BRBGF-9. The reason is that the average strain adjustment factor ρavg are 0.17, 0.35 and 0.32 for BRBGF-3, BRBGF-6 and BRBGF-9, respectively. The assumption of ρavg = 0.4 for BRBGF-3 overestimated δy,i,col and underestimated μsys. Because the BRBGF structures are more likely to work as LFRS for buildings with more than three storeys, it is suggested to use ρavg = 0.4 for the preliminary design. After the initial designs, further adjustments to ρavg along height can be made to optimise the configurations.
4.4.4. Glulam Member Strength Check
The glulam members were all designed by considering the BRB overstrength factor γBRB = 1.5 to ensure they remained elastic under ULS loads. The maximum moments and axial forces in the columns and beams from the NLTHA were extracted. EquationEquation 27(16d)
(16d) from the New Zealand Timber Structures Standard NZS 3603 (Citation1993) were used to check the beam and column strengths. lists the glulam member sizes in the BRBGFs and the maximum combined strength factors (CSFs). The maximum CSF was 0.87 for columns and 0.69 for beams, so all glulam members satisfied the strength requirement.
Table 10. Combined strength factors of glulam members.
where Nt,mean and Nc,mean are the mean values of the maximum tension and compression loads under ten ground motions (kN), respectively; Mt,mean and Mc,mean are the corresponding moments (kN∙m) at Nt,mean and Nc,mean, respectively; Nnt and Nnc are the nominal strength in tension and buckling (kN), respectively; Mn is the nominal bending strength (kN∙m); ϕGL (= 0.8) is the strength reduction factor for glulam.
It was also observed that the CSFs were primarily smaller than 0.7, and CSFs of the beams were generally smaller than those of the columns at the same storey. This is because the actual overstrength that the BRB reached during the NLTHA was smaller than γBRB (= 1.5). The actual axial deformation of BRBs was smaller than the ultimate deformation; therefore, the loads transferred to the glulam members were smaller than the design loads with γBRB. The beams had a large span (L = 8 m) and the moment load in the beam was proportional to L2, which made the beams more sensitive to the design load level than columns. The member sizes can be optimised by using different γBRB along the height based on μi as suggested by Lopez and Sabelli (Citation2004), which is beyond the scope of this study.
5. Conclusions
This study extended the DDBD approach to a new timber-steel hybrid multi-storey system that consists of glulam frames and BRBs. The design steps following the DDBD approach are discussed and critical design parameters are derived. The DDBD approach was then used to design three case studies of BRBGF structures with three, six, and nine storeys. NLTHAs were conducted for the three buildings to verify the DDBD approach. The main conclusions drawn are as follows:
The inter-storey yield drift of BRBGFs must include the contribution of the BRB deformation, column axial deformation and possible initial slips due to manufacturing tolerances for an accurate prediction of inter-storey yield drifts.
In contrast to BRB steel frames, the stiffness of connections between the BRBs and glulam frames in BRBGFs must be considered. A stiffness adjustment factor λ (=0.72) was verified for the yield drift prediction of the BRBGF structures by pushover analyses.
The relationship between the spectral displacement reduction factor η and ductility factor μ for the Takeda fat model was also suitable for the BRBGF structures. It provided a slightly conservative prediction based on the results of NLTHA. The strength and stiffness of BRBs and initial slips caused by manufacturing tolerances had a negligible influence on the η-μ relationship.
The displacement profile for moment-resisting frames was also suitable for the BRBGF structures and provided relatively conservative predictions. The similarity between the actual displacement profile and the assumed profile is essential to ensure a good prediction of the DDBD approach.
The maximum displacement and inter-storey drift response of the three BRBGF structures agreed reasonably well with the design target drift on the slightly conservative side. A soft-storey issue was not observed although the maximum inter-storey drift was on the first storey and were relarively larger than that of other storeys. Therefore, this study demonstrates that the DDBD approach can be a prospective methodology for the seismic design of BRBGF structures. With the DDBD approach, BRBGFs can be designed and used as an effective LFRS for mid-rise buildings up to nine storeys. Further investigations of the DDBD approach, such as the optimisation design and risk-based evaluation, are recommended for future study.
Acknowledgments
The authors acknowledge the Natural Hazards Research Platform, QuakeCore, University of Canterbury, and Shanghai Research Institute of Materials for sponsoring this project. The authors also appreciate the help of the lab technicians Russell McConchie, Alan Thirlwell, Michael Weavers, Peter Coursey and Dave Carney when preparing the manuscript.
Disclosure Statement
No potential conflict of interest was reported by the author(s).
References
- Aguaguiña, M., Y. Zhou, and Y. Zhou. 2019. Loading protocols for qualification testing of BRBs considering global performance requirements. Engineering Structures 189 (November 2018):440–57. doi:10.1016/j.engstruct.2019.03.094.
- American Institute of Steel Construction (AISC). 2016. Seismic provisions for structural steel buildings. ANSI/AISC 341-16. Chicago, IL: Seismic provisions for structural steel buildings.
- Australia and New Zealand Standards. 2002. ASNZS1170.0: structural design actions - Part 0: General principles. structural design actions. Sydney, Australia/Wellington, New Zealand: Australia and New Zealand Standards for Building Code.
- Australia and New Zealand Standards. 2004. NZS1170.5: structural design actions - Part 5: Earthquake actions-New Zealand. Sydney, Australia/Wellington, New Zealand: Australia and New Zealand Standards for Building Code.
- Belleri, A. 2017. Displacement based design for precast concrete frames with not-emulative connections. Engineering Structures 141: 228–40. doi:10.1016/j.engstruct.2017.03.020.
- Bezabeh, M. A., S. Tesfamariam, and S. F. Stiemer. 2016. Equivalent viscous damping for steel moment-resisting frames with cross-laminated timber infill walls. Journal of Structural Engineering (United States) 142 (1): 04015080. doi:10.1061/(ASCE)ST.1943-541X.0001316.
- Blandon, C. A., and M. J. N. Priestley. 2005. Equivalent viscous damping equations for direct displacement based design. Journal of Earthquake Engineering 9 ( SPEC2): 257–78. doi:10.1142/S1363246905002390.
- British Standard Institution (BSI). 1998. Eurocode 8: Design of structures for earthquake resistance. London: British Standard Institution (BSI).
- British Standard Institution (BSI). 2005a. Eurocode 8: Design of structures for earthquake resistance. London: British Standards Institution (BSI).
- British Standard Institution (BSI). 2005b. Eurocode 3: Design of steel structures: Part 1-1: General rules and rules for buildings, BS EN 1993-1-1. London: British Standards Institution(BSI).
- Brown, J. R., M. Li, A. Palermo, S. Pampanin, and F. Sarti. 2021. Experimental testing of a low-damage post-tensioned C-Shaped CLT Core-Wall. Journal of Structural Engineering 147 (3). doi:10.1061/(ASCE)ST.1943-541X.0002926.
- Brown, J. R., M. Li, A. Palermo, S. Pampanin, F. Sarti, and R. Nokes. 2022. Experimental testing and analytical modelling of single and double post-tensioned CLT shear walls. Engineering Structures 256 (August 2021):114065. doi:10.1016/j.engstruct.2022.114065.
- Chang, T. 2018. Suanpan- an open source, parallel and heterogeneous finite element analysis framework [online].
- Charney, F. A. 2008. Unintended consequences of modeling damping in structures. Journal of Structural Engineering 134 (4): 581–92. doi:10.1061/(ASCE)0733-9445(2008)134:4(581).
- Chen, F., Z. Li, M. He, Y. Wang, Z. Shu, and G. He. 2021. Seismic performance of self-centering steel-timber hybrid shear wall structures. Journal of Building Engineering 43 (April): 102530. doi:10.1016/j.jobe.2021.102530.
- Chopra, A. K., and F. McKenna. 2016. Modeling viscous damping in nonlinear response history analysis of buildings for earthquake excitation. Earthquake Engineering & Structural Dynamics 45 (2): 193–211. doi:10.1002/eqe.2622.
- Della Corte, G. 2006. Vibration mode vs. collapse mechanism control for steel frames. In Proceedings of the 5th international conference on behaviour of steel structures in seismic areas - Stessa 2006, 423–28. Yokohama, Japan.
- Dhakal, R. P., A. Pourali, A. S. Tasligedik, T. Yeow, A. Baird, G. MacRae, S. Pampanin, and A. Palermo. 2016. Seismic performance of non-structural components and contents in buildings: An overview of NZ research. Earthquake Engineering and Engineering Vibration 15 (1): 1–17. doi:10.1007/s11803-016-0301-9.
- Dickof, C., S. F. Stiemer, M. A. Bezabeh, and S. Tesfamariam. 2014. CLT–steel hybrid system: ductility and overstrength values based on static pushover analysis. Journal of Performance of Constructed Facilities 28 (6). doi:10.1061/(ASCE)CF.1943-5509.0000614.
- Dong, H., M. He, C. Christopoulos, and Z. Li. 2020a. Quasi-static tests and parametric simulations of hybrid steel frame and light wood shear walls with frictional dampers. Engineering Structures 228 (1239): 111485. doi:10.1016/j.engstruct.2020.111485.
- Dong, W . 2021. Seismic performance of glulam frames with buckling restrained braces (BRBs). Christchurch, New Zealand: University of Canterbury. https://ir.canterbury.ac.nz/handle/10092/102404
- Dong, W., M. Li, C. Lee, and G. MacRae. 2021. Numerical modelling of glulam frames with buckling restrained braces. Engineering Structures 239: 112338. doi:10.1016/j.engstruct.2021.112338.
- Dong, W., M. Li, C. Lee, G. MacRae, and A. Abu. March 2020b. Experimental testing of full-scale glulam frames with buckling restrained braces. Engineering Structures 222: 111081. doi:10.1016/j.engstruct.2020.111081.
- Dwairi, H. M., M. J. Kowalsky, and J. M. Nau. 2007. Equivalent damping in support of direct displacement-based design. Journal of Earthquake Engineering 11 (4): 512–30. doi:10.1080/13632460601033884.
- Erduran, E., and A. Yakut. 2004. Drift based damage functions for reinforced concrete columns. Computers and Structures 82 (2–3): 121–30. doi:10.1016/j.compstruc.2003.10.003.
- Erochko, J., C. Christopoulos, R. Tremblay, and H. Choi. 2011. Residual drift response of SMRFs and BRB frames in steel buildings designed according to ASCE 7-05. Journal of Structural Engineering 137 (5): 589–99. doi:10.1061/(ASCE)ST.1943-541X.0000296.
- Filiatrault, A., and B. Folz. 2002. Performance-based seismic design of wood framed buildings. Journal of Structural Engineering 128 (1): 39–47. doi: 10.1061/(ASCE)0733-9445(2002)128:1(39).
- Gardiner, S., G. C. Clifton, and G. A. MacRae. 2013. Performance, damage assessment and repair of a multistorey eccentrically braced framed building following the Christchurch earthquake series. Steel Innovations Conference 2013, Christchurch, New Zealand.
- Ghaffarzadeh, H., A. Jafari, and N. Talebian. 2014. Equivalent viscous damping in direct displacement‐based design of steel braced reinforced concrete frames. The Structural Design of Tall and Special Buildings 23 (8): 604–18. doi: 10.1002/tal.1069.
- Ghobarah, A., H. Abou-Elfath, and A. Biddah. 1999. Response-based damage assessment of structures. Earthquake Engineering and Structural Dynamics 28 (1): 79–104. doi: 10.1002/(SICI)1096-9845(199901)28:1<79::AID-EQE805>3.0.CO;2-J.
- Gilbert, C. F., and J. Erochko. 2019. Development and testing of hybrid timber-steel braced frames. Engineering Structures 198 (1): 109495. doi: 10.1016/j.engstruct.2019.109495.
- Granello, G., A. Palermo, S. Pampanin, S. Pei, and J. Van De Lindt. 2020. Pres-lam buildings: state-of-the-art. Journal of Structural Engineering (United States) 146 (6): 1–16.
- Grant, D. N., C. A. Blandon, and M. J. N. Priestley. 2005. Modelling inelastic response in direct displacement-based design. Pavia, Italy: IUSS Press.
- Hashemi, A., P. Zarnani, and P. Quenneville. April 2020. Seismic assessment of rocking timber walls with energy dissipation devices. Engineering Structures 221: 111053. doi: 10.1016/j.engstruct.2020.111053.
- He, M., Z. Li, F. Lam, R. Ma, and Z. Ma. 2014. Experimental investigation on lateral performance of timber-steel hybrid shear wall systems. Journal of Structural Engineering 140 (6): 04014029. doi: 10.1061/(ASCE)ST.1943-541X.0000855.
- He, M., Q. Luo, Z. Li, H. Dong, and M. Li. 2018. Seismic performance evaluation of timber-steel hybrid structure through large-scale shaking table tests. Engineering Structures 175 (June 2017):483–500. doi:10.1016/j.engstruct.2018.08.029.
- Himes, A., and G. Busby. 2020. Wood buildings as a climate solution. Developments in the Built Environment 4 (October): 100030. doi: 10.1016/j.dibe.2020.100030.
- Houtte, C. V., S. Bannister, C. Holden, S. Bourguignon, and G. Mcverry. 2017. The New Zealand strong ground motion database. Bulletin of the New Zealand Society for Earthquake Engineering 50 (1): 1–20. doi: 10.5459/bnzsee.50.1.1-20.
- Jacobsen, L. S. 1960. Damping in composite structures. Tokyo: II WCEE.
- Khan, E., M. J. Kowalsky, and J. M. Nau. 2016. Equivalent viscous damping model for short-period reinforced concrete bridges. Journal of Bridge Engineering 21 (2): 1–12. doi: 10.1061/(ASCE)BE.1943-5592.0000803.
- Kirstein, A., J. Siracusa, and T. Smith. 2018. The new timber von Haast replacement building in Christchurch. In 2018 NZSEE conference, 1–9. Auckland, New Zealand.
- Kowalsky, M. J., M. J. N. Priestley, and G. A. MacRae. 1994. Displacementbased design of RC bridge columns. Proceedings of the Second International Workshop on Seismic Design of Bridges Queenstown, New Zealand.
- Landi, L., P. Diotallevi, and A. Tardini. 2012. Equivalent viscous damping for the displacement-based seismic assessment of infilled RC frames. 15th World Conference on Earthquake Engineering, Lisbon, Portugal.
- Lee, C. L. 2020a. Proportional viscous damping model for matching damping ratios. Engineering Structures 207 (August 2019):110178. doi:10.1016/j.engstruct.2020.110178.
- Lee, C. L. 2020b. Sparse proportional viscous damping model for structures with large number of degrees of freedom. Journal of Sound and Vibration 478: 115312. doi: 10.1016/j.jsv.2020.115312.
- Lee, C. L. 2021. Bell-shaped proportional viscous damping models with adjustable frequency bandwidth. Computers and Structures 244: 106423. doi: 10.1016/j.compstruc.2020.106423.
- Lee, C. 2022. Type 4 bell-shaped proportional damping model and energy dissipation for structures with inelastic and softening response. Computers & Structures 258: 106663. doi: 10.1016/j.compstruc.2021.106663.
- Li, Z., X. Wang, M. He, and H. Dong. 2019. Seismic performance of timber-steel hybrid structures. II: calibration of performance objectives and design method. Journal of Structural Engineering (United States) 145 (10): 04019114.
- Liu, T., T. Zordan, Q. Zhang, and B. Briseghella. 2015. Equivalent viscous damping of bilinear hysteretic oscillators. Journal of Structural Engineering (United States) 141 (11): 1–12.
- López, W., and R. Sabelli. 2004. Seismic design of buckling-restrained braced frames. Moraga, USA: Structural Steel Educational Council.
- Loss, C., D. Zonta, and M. Piazza. 2012. Analytical model to evaluate the equivalent viscous damping of timber structures with dowel-type fastener connections. World Conference on Timber Engineering 2012, WCTE 2012 2 (July): 516–25.
- Luo, Q., M. He, F. Chen, and Z. Li. 2021. Probabilistic seismic performance assessment of timber-steel hybrid structures subjected to mainshock-aftershock sequences. Soil Dynamics and Earthquake Engineering 141 (December 2020):106532. doi:10.1016/j.soildyn.2020.106532.
- Mahjoubi, S., and S. Maleki. 2016. Seismic performance evaluation and design of steel structures equipped with dual-pipe dampers. Journal of Constructional Steel Research 122: 25–39. doi: 10.1016/j.jcsr.2016.01.023.
- Maley, T. J., T. J. Sullivan, and G. D. Corte. 2010. Development of a displacement-based design method for steel dual systems with buckling-restrained braces and moment-resisting frames. Journal of Earthquake Engineering 14 (SUPPL. 1): 106–40. doi: 10.1080/13632461003651687.
- Maley, T., T. J. Sullivan, A. Lago, R. Roldan, and G. M. Calvi. 2013. Characterising the seismic behaviour of steel MRF structures. Pavia, Italy: IUSS Press.
- Malla, N., and A. C. Wijeyewickrema. 2021. Direct displacement-based design of coupled walls with steel shear link coupling beams. Structures 34 (July): 2746–64. doi: 10.1016/j.istruc.2021.09.004.
- Mazza, F., and A. Vulcano. 2014. Equivalent viscous damping for displacement-based seismic design of hysteretic damped braces for retrofitting framed buildings. Bulletin of Earthquake Engineering 12 (6): 2797–819. doi: 10.1007/s10518-014-9601-5.
- Mazzoni, S., F. McKenna, M. H. Scott, and G. L. Fenves. 2006. OpenSees command language manual. Berkeley, USA: Pacific Earthquake Engineering Research (PEER) Center.
- McCormick, J., H. Aburano, M. Ikenaga, and M. Nakashima. 2008. Permissible residual deformation levels for building structures considering both safety and human elements. In The 14th world conference on earthquake engineering, 8. Beijing, China.
- Medina, R. A., and H. Krawinkler. 2005. Evaluation of drift demands for the seismic performance assessment of frames. Journal of Structural Engineering 131 (7): 1003–13. doi: 10.1061/(ASCE)0733-9445(2005)131:7(1003).
- Metelli, G., G. Bregoli, and F. Genna. 2016. Experimental study on the lateral thrust generated by core buckling in bolted-BRBs. Journal of Constructional Steel Research 122: 409–20. doi: 10.1016/j.jcsr.2016.04.004.
- New Zealand Standards. 1993. NZS3603:1993 Timber structures standard.
- Nievas, C. I., and T. J. Sullivan. 2015. Applicability of the direct displacement-based design method to steel moment resisting frames with setbacks. Bulletin of Earthquake Engineering 13 (12): 3841–70. doi: 10.1007/s10518-015-9787-1.
- Pang, W., and D. V. Rosowsky. 2009. Direct displacement procedure for performance-based seismic design of mid-rise wood-framed structures. Earthquake Spectra 25 (3): 583–605. doi: 10.1193/1.3158932.
- Park, R. 1989. Evaluation of ductility of structures and structural assemblages from laboratory testing. Bulletin of the New Zealand Society for Earthquake Engineering 22 (3): 155–66. doi: 10.5459/bnzsee.22.3.155-166.
- PEER. 2005. PEER NGA database [online]. Berkeley: Pacific Earthquake Engineering Research (PEER) Center University of California. Accessed August 12, 2022. http://peer.berkeley.edu/nga/index.html
- Pennucci, D., G. M. Calvi, and T. J. Sullivan. 2009. Displacement-based design of precast walls with additional dampers. Journal of Earthquake Engineering 13 (1 SUPPL. 1): 40–65. doi: 10.1080/13632460902813265.
- Pennucci, D., T. J. Sullivan, and G. M. Calvi. 2011. Displacement reduction factors for the design of medium and long period structures. Journal of Earthquake Engineering 15 (SUPPL. 1): 1–29. doi: 10.1080/13632469.2011.562073.
- Pettinga, J. D., and M. J. N. Priestley. 2005. Designed with direct displacement-based design. Journal of Earthquake Engineering 9 (2): 309–30. doi: 10.1142/S1363246905002419.
- Priestley, M. J. N. 1995. Myths and fallacies in earthquake engineering–conflicts between design and reality. Special Publication 157: 231–54.
- Priestley, M. J. N. 2003. Myths and fallacies in earthquake engineering. Revisited The Ninth Mallet Milne Lecture 2003 (May): 98.
- Priestley, M. J. N., G. M. Calvi, and M. J. Kowalsky. 2007. Displacement-based seismic design of structures. Pavia, Italy: IUSS Press.
- Priestley, M. J. N., and M. J. Kowalsky. 2000. Direct displacement-based seismic design of concrete buildings. Bulletin of the New Zealand Society for Earthquake Engineering 33 (4): 421–44. doi: 10.5459/bnzsee.33.4.421-444.
- Quintana Gallo, P., D. M. Carradine, and R. Bazaez. 2021. State of the art and practice of seismic-resistant hybrid timber structures. European Journal of Wood and Wood Products 79: 5–28. doi:10.1007/s00107-020-01556-3.
- Rajeev, P., K. K. Wijesundara, M. Al-Mashaykhi, M. J. Hashemi, and E. Gad. 2017. Displacement profile for displacement based seismic design of concentric braced frames. 16th World Conference on Earthquake Engineering, Santiago, Chile.
- Roldán, R., T. J. Sullivan, and G. Della Corte. 2016. Displacement-based design of steel moment resisting frames with partially-restrained beam-to-column joints. Bulletin of Earthquake Engineering 14 (4): 1017–46. doi: 10.1007/s10518-016-9879-6.
- Sahoo, D. R., and A. Prakash. 2019. Seismic behavior of concentrically braced frames designed using direct displacement-based method. International Journal of Steel Structures 19 (1): 96–109. doi: 10.1007/s13296-018-0092-0.
- Salawdeh, S., and J. Goggins. 2016. Direct displacement based seismic design for single storey steel concentrically braced frames. Earthquake and Structures 10 (5): 1125–41. doi: 10.12989/eas.2016.10.5.1125.
- Song, X., A. M. Asce, Y. Wu, H. Jiang, and T. Chen. 2022. Lateral performance of glulam timber frames with CFRP confined timber-steel buckling-restrained bracings. Journal of Structural Engineering 148 (2003): 1–16.
- Sullivan, T. J. 2013. Direct displacement-based seismic design of steel eccentrically braced frame structures. Bulletin of Earthquake Engineering 11 (6): 2197–231. doi: 10.1007/s10518-013-9486-8.
- Sullivan, T. J., and G. O’Reilly. 2014. Characterising the seismic behaviour of steel beam-column joints for seismic design.
- Sullivan, T. J., M. J. N. Priestley, and G. M. Calvi. 2006. Direct displacement-based design of frame-wall structures. Journal of Earthquake Engineering 10 (1): 91–124. doi: 10.1080/13632460609350630.
- Sullivan, T. J., M. J. N. Priestley, and G. M. Calvi. 2012. A model code for the displacement-based seismic design of structures DBD12. Pavia, Italy: IUSS Press.
- Terán-Gilmore, A., and J. Ruiz-García. 2011. Comparative seismic performance of steel frames retrofitted with buckling-restrained braces through the application of Force-Based and Displacement-Based approaches. Soil Dynamics and Earthquake Engineering 31 (3): 478–90. doi: 10.1016/j.soildyn.2010.11.003.
- Thiers-moggia, R., and C. Málaga-Chuquitaype. 2021. Performance-based seismic design and assessment of rocking timber buildings equipped with inerters. Engineering Structures 248 (April): 113164. doi: 10.1016/j.engstruct.2021.113164.
- Vigh, L. G., Á. Zsarnóczay, and T. Balogh. 2017. Eurocode conforming design of BRBF – Part I: Proposal for codification. Journal of Constructional Steel Research 135 (May 2016):265–76. doi:10.1016/j.jcsr.2017.04.010.
- Wijesundara, K. K. 2012. Seismic design of steel concentric braced frame structures using direct displacement based design approach. The 2nd international conference on sustainable built environments (ICSBE2012), Sri Lanka.
- Wijesundara, K. K., R. Nascimbene, and T. J. Sullivan. 2011. Equivalent viscous damping for steel concentrically braced frame structures. Bulletin of Earthquake Engineering 9 (5): 1535–58. doi: 10.1007/s10518-011-9272-4.
- Wijesundara, K. K., and P. Rajeev. 2012. Direct displacement-based seismic design of steel concentric braced frame structures. Australian Journal of Structural Engineering 13 (3): 243–57. doi: 10.7158/S11-135.2012.13.3.
- XLam NZ Limited. 2016. Designing With Xlam cross laminated timber.
- Yahyai, M., and B. Rezayibana. 2015. A simplified methodology to determine damping for special concentrically-braced frames. International Journal of Steel Structures 15 (3): 541–55. doi: 10.1007/s13296-015-9003-9.
- Yan, L., J. Gong, and Q. Zhang. 2018. Investigation of global equivalent damping and statistical relationship of displacement between nonlinear static and dynamic analysis of reinforced concrete frame structures. Earthquake Spectra 34 (3): 1311–38. doi: 10.1193/021517EQS031M.
- Yang, B., and X. Lu. 2018. Displacement-based seismic design approach for prestressed precast concrete shear walls and its application. Journal of Earthquake Engineering 22 (10): 1836–60. doi: 10.1080/13632469.2017.1309607.
- Zonta, D., C. Loss, M. Piazza, and P. Zanon. 2011. Direct displacement-based design of glulam timber frame buildings. Journal of Earthquake Engineering 15 (3): 491–510. doi: 10.1080/13632469.2010.495184.
- Zsarnóczay, Á. 2013. Experimental and numerical investigation of buckling restrained braced frames for Eurocode conform design procedure development. Budapest, Hungary: Budapest University of Technology and Economics.
Appendix I
Flowchart of the presented DDBD approach
Appendix
The storey height information is listed in . The mass on each floor and roof (mf and mr) for BRBGF-6 can be calculated according to load information in and NZS 1170.0 (Australia and New Zealand Standards Citation2002).
where D and Q are the dead load (kN) and live load (kN), respectively; Af is the tributary area for each BRBGF (m2).
The storey drift Δi is calculated based on the design drift ratio θd = 2.0% and the displacement profile for MRF as shown in EquationEq. A3(3)
(3) –EquationEq. A10
(9)
(9) . Δi for each floor is listed in .
The inter-storey yield drift contributions of the BRB deformation and the column axial deformation at the i-th storey are calculated by Eq. A4 and Eq. A5, respectively. The inter-storey yield drift for each storey along the height of BRBGF-6 is calculated by Eq. A6, and the results are also listed in . The ductility factor for the i-th storey μi is thus calculated by Eq. A7. Eventually, the shear force at the i-th storey Vi in Eq. A8 can be calculated by assuming Vbase = 1.0.
Appendix
The Lee damping model has a damping matrix CLee and damping ratio ζ in a form of Eq. A9 and Eq. A10, respectively. The damping matrix CLee is symmetric, positive definite or semi-positive definite and possesses classical normal modes. The derivation can be found in (Lee Citation2020b).
where
and M and K are mass and stiffness matrices, respectively; ζpj,ωpj are parameters that control the values and location of the peak.
where N(ω, ωpj) is a bell-shape based function as shown in Eq. A10 and .
and ω is the circular frequency.
shows the relationship between ζ and ω of the Lee damping model with five bell-shape based functions, which provides an almost constant damping ratio within desired frequency range ωp1–ωp5. The formulas for ζpj,ωpj can be found in (Lee Citation2020a) and the configuration of the Lee damping model.
This model has been implemented into a local branch of OpenSees and suanPan (Chang Citation2018) by the authors for the design verification, and will be merged into the main OpenSees repository soon.
Figure 21. Damping ratio-frequency relationship of the Lee damping model