
Abstract
Environmental challenges in sea-based salmon aquaculture limit expansion of this industry. In Norway, the main challenge is sea lice which causes higher mortality, lower harvest weight and a reduction in the quality of harvested fish. The economic consequences for farmers are substantial, so the farmers have incentives to develop new technologies to take advantage of favorable market conditions. One of these is extending the land-based phase in the production: instead of releasing smolts of 100–150 g for on-growing in sea, the land-based phase is lengthened to produce post-smolts of up to 1,000 g before release in sea-water. A longer production period on land means that the sea water phase is correspondingly reduced with less exposure to sea lice. Results indicate that in the case of no lice, on-growing of 100 g smolts is most cost efficient, however, as lice costs are considered, the results clearly show that on-growing of post-smolts on land is profitable. The results presented in the article are supported by developments in the industry where increased production of post-smolts can be observed.
Introduction
Salmon farming is a highly profitable industry (Misund & Nygård, Citation2018) with increasing demand for salmon worldwide (Braekkan, Thyholdt, Asche, & Myrland, Citation2018), but limited production growth (Asche, Misund, & Oglend, Citation2019; Asche, Oglend, & Kleppe, Citation2017). In recent years, there has been limited production growth in both Norway and Chile, the two major producers, due to binding government regulations and environmental challenges in sea-based salmon aquaculture. In Norway, the main problem is sea lice which causes higher mortality, lower harvest weight and a reduction in the quality of harvested fish (Torrissen et al., Citation2013). The economic consequences for farmers are substantial, providing strong incentives to develop new technologies in order to take advantage of favorable market conditions. One of these is land-based salmon farming (Bjørndal & Tusvik, Citation2019). Another is extending the land-based phase: instead of releasing smolts of 100–150 g for on-growing in sea, as has been the norm, so-called post-smolts are produced in land based tanks of up to 1,000 g before release in sea-water (Bjørndal & Tusvik, Citation2018; Hilmarsen, Holte, Brendeløkken, Høyli, & Hognes, Citation2018). Sea lice infections are only an issue in the sea water phase as sea lice cannot migrate into the land-based tanks. A longer production period on land means that the sea water phase is correspondingly reduced with less exposure to sea lice. Hence, the time window for lice infections is reduced, providing an important reason for the current trend toward using larger smolts. Consequently, accumulated mortality and the need for expensive medical treatments are also reduced (Hagspiel, Hannevik, Lavrutich, Naustdal, & Struksnaes, Citation2018). Several authors have estimated the economic costs due to lice infestations, and the costs are substantial (Abolofia, Asche, & Wilen, Citation2017; Bjørndal & Tusvik, Citation2019; Dresdner et al., Citation2019; Iversen, Hermansen, Nystøyl, & Hess, Citation2017).
The purpose of this article is to undertake an economic analysis of on-growing of post-smolts to assess the competitiveness of this mode of production vis-à-vis traditional sea-based farming. The cost analysis is undertaken in a Norwegian context for a sea-based farm with nine production permits equal to a Maximum Permitted Biomass (MTB) of 7,020 tonnes. We compare the release of 500 g and 1,000 g post-smolts with on-growing of 100 g smolts, and account for the productivity reducing effect of salmon lice. Investments, a production plan and a cost analysis are prepared for all three scenarios.
In the first case, cost of production is analyzed for the situation without lice or any lice related costs. Next, biological risk is considered. For all three scenarios we consider the impact of lice in terms of its impact on fish growth and mortality as well as the costs of delousing. This allows us to estimate the cost of sea lice. In addition, there are also indirect costs (reduced quality and harvest, lower weight at harvest) that are quite substantial, some of which are quantified in our analysis. While the cost of sea lice has been estimated by several authors (Abolofia et al., Citation2017; Bjørndal & Tusvik, Citation2018, Citation2019; Iversen et al., Citation2017, Morency-Lavoie, Citation2016), the approach taken in this article, with comparison of different sizes of smolts under various scenarios is novel.
The article is organized as follows. In section one, we consider limitations on the growth of traditional sea-based farming which is largely due to environmental considerations, as this represents one of the main drivers for the development of on-growing of post-smolts. In section two we present some general assumptions that are common for all the scenarios being considered. This will be followed in section three by a detailed analysis of production for on-growing 500 g post-smolts including cost of production. In section four, we consider on-growing of 100 g and 1,000 g smolts and compare the three scenarios. This is followed by an analysis of biological risk in section five. In the final section a summary is provided as well as a discussion about future research.
Background
Since the 1980s, farmed salmon has been one of the fastest growing food industries in the world (Anderson, Asche, & Garlock, Citation2019; Garlock et al., Citation2020). However, global production has leveled off in recent years, at about 2.3 mill tonnes on average per year for 2013–2017. Norwegian production has leveled off since 2012 at about 1.2 mill tonnes per year, or slightly less than 60% of the global production (Bjørndal & Tusvik, Citation2019). In 2017, the most recent year for which statistics are available, world production of salmon was 2.24 million tonnes, with Norway producing 1.24 million tonnes.1
Profitability in salmon farming is good, and the price-cost margin has also increased in recent years despite a fairly substantial increase in cost of production since 2012 (Bjørndal & Tusvik, Citation2019; Misund & Nygård, Citation2018). In this situation, market signals give strong incentives to increase production. The reason this has not happened is due to a combination of environmental constraints limiting expansion in both Norway and Chile and government regulations aiming to limit negative environmental externalities (Asche, Cojocaru, & Sikveland, Citation2018; Hersoug, Mikkelsen, & Karlsen, Citation2019; Iversen, Asche, Hermannsen, & Nystøl, Citation2020).2
Sea lice constitute a major concern for the Norwegian aquaculture industry and, presently, the most challenging environmental issue for the industry. In addition to the impact on farmed salmon, salmon lice originating from sea pens are currently assessed as the main threat to the wild salmon population (Misund, Citation2019). Moreover, wild salmon passing farms with lice problems may be infected. In addition, escaped farmed salmon contribute to the dispersion of the parasite, which in turn may lead to mortality and a decline in the wild salmonid population. Biological sustainability now acts as a significant constraint on increased production (Hersoug et al., Citation2019). In Norway, as in other aquaculture-producing countries, governments seek means of improving the industry and encouraging sustainable operations (Osmundsen, Almklov, & Tveterås, Citation2017). In Norwegian aquaculture regulations, salmon lice are an important indicator and regulatory instrument (Osmundsen, Olsen, & Thorvaldsen, Citation2020).
Sea lice infection on salmon farms has been regulated since 1997 to reduce the harmful effects of lice on farmed and wild fish (Torrissen et al., Citation2013). Regulations set thresholds for the maximum mean number of sea lice per fish (lice count) and a compulsory reporting system is in operation. If the legal lice infection threshold levels, enforced by the Norwegian Food Safety Authority (NFSA), are exceeded it is mandatory for the farmer to medically treat or slaughter their fish within two weeks. The sea lice challenge is addressed in different ways; this includes preventive actions such as wrasses and particular feeds and medical as well as non-medical treatments. A challenge with treatments is that they cause reduced growth, higher mortality and reduced fish quality. While the number of medical treatments has come down, the number of non-medical treatments has increased substantially in the last couple of years.
A new production capacity adjustment system was implemented from October 1, 2017 (Norwegian Government, Citation2017). The intention is to ensure the sustainable growth of the industry, with future growth to be granted based on sustainability indicators, currently sea lice. Labeled the “traffic light system,” the regulatory system divides the country into 13 production areas and assigns the codes green, yellow or red to each area depending on their performance on predefined environmental criteria set by the government (IMR., Citation2015). Based on assigned codes, the companies in each production area may be allowed to increase its production (green light), maintain its production (yellow light) or be required to reduce its production (red light). A region with a green light can increase production by a maximum of 6% for every two-year period—a quantity which is to be distributed between existing and new permits (Norwegian Government, Citation2015). Thus, the producers are jointly carrying the responsibility for the area in which they produce.
Due to regulations, the scope for expansion in sea-based salmon aquaculture is currently limited. A government permit3 is required to operate a fish farm in Norway. Over the years, the production capacity of permits has been regulated in different ways (Hersoug et al., Citation2019). Currently, production is measured in the form of standing biomass per permit with a Maximum Permitted Biomass (MTB). A “standard” permit is 780 tonnes,4 however, due to capacity adjustments following the introduction of the traffic light system, the MTB can be more than 780 tonnes. Regardless of the value, actual biomass must never exceed this value. A company may have several permits and will then be faced with two constraints, one per permit and one for the company. It must also be noted that a company usually has more production sites than permits due to the fact that after some years of use, a site needs to be fallow for a period of time.
Thus, depending on environmental conditions, existing producers may be permitted to increase their capacity. This happened in 2018 with a 6% increase production capacity measured as MTB in “green areas.”5 For a 2% increase in production capacity, the government set a fixed price of NOK 120,000 per tonne MTB which translates into NOK 93.6 million for a “standard” 780 tonnes permit. In addition, another 4% of production capacity were auctioned off at prices varying between NOK 132,000/tonne and NOK 252,000/tonne,6 implying a “standard” permit value between NOK 102,960 and 196,500 million.7 The extra production capacity was mainly used to increase the MTBs of existing permits although some new permits were also issued.8
The cost of sea lice is also high and lice infestation is the main reason for the increase in cost of production from 2012 to the present. Studies indicated damages on average corresponding to 9–13% of revenues (Abolofia et al., Citation2017), representing about 20% of cost of production before harvest (Iversen et al., Citation2017; Morency-Lavoie, Citation2016), while Bjørndal and Tusvik (Citation2018) found examples of even higher costs. An important part of the costs are indirect costs such as reduced quality and growth, and lower weight at harvest.9
As pointed out above, on-growing of post-smolts is one way of reducing production risk due to a shorter sea-phase thus reducing exposure to sea lice and contagious diseases. Until 2012, post-smolt production was not an option for Norwegian farmers, as regulations stated that hatchery-reared salmon should not have a weight exceeding 250 g before being transferred into traditional sea cages. As of 2012, however, holders of hatchery permits have been allowed to produce smolts with a weight of up to 1,000 g (Hagspiel et al., Citation2018). This makes post-smolt production possible: as the smolts are kept in on land longer, time spent in seawater can be significantly reduced. In one of the scenarios considered below, this time is reduced from 17 months to 10 months. This will lead to a reduction in total mortality as the time in seawater is the part of the production cycle that is most prone to lice and disease. A longer land-based phase also means that farms may save one or more costly delousings.
Currently, there are two competing production technologies for smolts, Recirculating Aquaculture Systems (RAS) and flow through systems. The flow-through systems are the traditional system, while most systems introduced after 2005 are RAS (Sandvold & Tveterås, Citation2014). RAS technology is also used for the rearing of other species such as turbot and sole (Bjørndal, Guillen, Imsland, & Øiestad, Citation2015). RAS is a closed loop system for land-based farming that recycles up to 99.5% of the water in the system which enables large-scale farming with minimal water usage. The main advantage is the ability to maintain optimal water quality with less effort than if the water was not recycled (Bjørndal & Tusvik, Citation2019; Hagspiel et al., Citation2018).
An important objective in a firm’s production plan is the optimal use of production capacity. In the current market conditions, the main focus is on maximizing production per permit due to high prices. Use of post-smolts is of interest for two main reasons: reducing production losses (i.e., loss in growth and mortality of fish) and, in certain instances, increasing flexibility if access to sites or coordinated fallow periods represent a binding constraint on the use of the MTB. In this article we focus on the first constraint, i.e., reducing production losses. Use of post-smolts, reducing the length of the production cycle, may lead to an increase in output, an issue we shall return to later.
As constraints and production conditions vary for different farmers, it is challenging to define appropriate general assumptions for production planning. Availability of sites and site specific conditions (temperatures, site-MTB, currents, contagion profile, possible periods for coordinated fallowing etc.) may vary from firm to firm and have an impact on optimal strategy. Nevertheless, in this analysis, we specify a set of general assumptions that we believe largely are representative (with temperatures from Western Norway) which are used in all scenarios so as to facilitate comparison.
General assumptions
This analysis compares production planning and cost of production for sea-based farming based on 100, 500 and 1,000 g smolts respectively. The point of departure is a company with nine farming permits with a total 7,020 tonnes MTB and six production sites. We assume there are four releases of smolts per year in the months of January, April, July and October, and look at investments, production planning and cost of production. As far as possible, underlying assumptions are the same for the different smolt sizes.
The methodology is based on Asche and Bjørndal (Citation2011). Essentially this means analyzing cost of production once the farm has reached steady state, which in this context means the long run production potential. Average cost of production in steady state represents the minimum price that the farm would need to be economically sustainable in the long run. This is an approach that is used in a number of studies of this nature.10 As for harvesting, i.e., production planning, the methodology is inspired by Bjørndal (Citation1988).
It is important to bear in mind that we are analyzing a new mode of production that hitherto has been in use in small scale operations. This means that, to a large degree, empirical data for the analyses are not available. However, the research has been undertaken in close collaboration with industry, including farmers and equipment suppliers. For this reason, all assumptions are made after contact with industry and represent the best available knowledge. summarizes important assumptions underlying the production plan. Growth curves are commonly estimated as a function of temperature and growth rate. One example of this is the thermal growth factor, TGC, which is the basis for this analysis. The weight curve is based on temperature conditions at Bud in Western Norway, measured at a depth of five meters.
Table 1. Assumptions for the production plan.
The production plan is based on an objective to produce about twice the MTB. With nine standard permits and 7.020 tonnes MTB for the company, this translates to a production of 14–15.000 tonnes per year.11 With regular mortality of 8% in sea for one generation, the company will need to release about 3.1 million smolts per year to reach this output with a harvest weight of 5 kg per fish. With four releases per year, this gives about 775.000 smolts per batch.12
It is assumed that smolts are released at given times so that the harvesting pattern are a consequence of this. The harvest volume is determined by standing biomass and the company’s MTB. At every point in time standing biomass is kept as close to MTB as possible, with continual harvesting of monthly growth. The number of production workers is based on averages for the industry as reported by the Directorate of Fisheries and is the same in all the scenarios considered.
Regarding the assumption about yearly release times, it is important to note that due to variations in the growth cycle, temperature and growth over the year and contagion profile/risk at sea, a firm may be able to adjust both release times, size of smolts and number of fish released based on different considerations. These include maximum net growth, desired harvest pattern and time, and possible constraints in relation to harvesting capacity and access to smolts. The analysis uses alternative assumptions regarding smolt size, but otherwise the same set of assumptions are employed in each scenario so as to permit greater comparability between scenarios.
Investments in the on-growing facility are given in . Some investments are per site while others are for the company as a whole. In the three scenarios considered, the number of sites required vary depending on smolt size. Moreover, the number of sea-pens vary per site depending on the size of smolts released. Here each sea-pen is 130 meters in diameter with a pen volume of about 25,000 m3 individually anchored with nets, lighting, sensors, and feed tubes. Each site has a feed barge and a small boat. Moreover, the company has a large boat that can be shared between sites as needed.
Table 2. Investments in on-growing facility.
In addition, there are investments in land and infrastructure such as electricity supply and a quay and office building. The largest investment is in the nine production permits which are valued at the price at NOK 93.6 million each.
lists some of the assumptions for variable and fixed costs that apply to all scenarios. The real interest rate is set at 4% annually13 for investments as well as working capital.
Table 3. Assumptions regarding variable and fixed costs.
Production plans and analysis of cost of production will first be presented without consideration of delousing. Assumptions regarding delousing and impact on production and costs are presented below. One challenge is that the base cases in principle may include costs that in reality include some lice related costs. This is primarily a challenge for other costs, as delousing typically is carried out by independent contractors. The initial estimate for mortality at 0.75% per month, which may be on the high end.
On-growing of 500-g smolts
In the following, we will give a detailed presentation of on-growing of 500 g smolts. The production plan is based on assumptions in . As noted, we envisage a sea-based production with 9 MTB-permissions totaling a standing biomass of 7,020 tonnes and production over six sites. gives weight curves for 500 g smolts released in January, April, July, and October with 1 as the release month. The time to reach a harvest weight of 5 kg will depend on time of release and weight at release.
Figure 1. Weight curves for 500 g smolts.
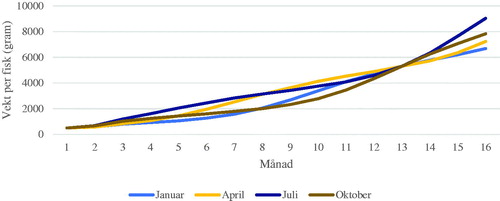
As illustrated in the figure, the weight curves converge after 12 months at sea, i.e., the beginning of month 13, when the fish, regardless of the time of release, have been in the sea all four seasons (see also ). It is important to bear in mind that the growth formula only takes growth into consideration and no other variables that may affect growth such as parasites and risk of infection.
Table 4. Release program and fish weight over time (gram at beginning of the month).
Each batch will thus require a little less than 12 months to reach a harvest weight of about 5 kg. After harvesting each site must lie fallow for a minimum of two months, so that each generation requires a minimum of 14 months per site. If fish are released at a site in January one year, it would be too soon to release a new batch in April the following year. Accordingly, we assume release in January the first year, July the second, January the third, etc. Given four releases of 775,000 smolts per year, the firm will need six sites. illustrates the release plan and growth for the first two years. The firm will be in full production in the second year of operation.
While gives the expected development in fish size per site, gives the development in the number of fish per site on the assumption of a monthly mortality of 0.75%.
Table 5. Release program and number of fish per site over time (number of fish at the beginning of the month given 0.75% monthly mortality).
Next, given the weight per fish per month and number of fish per month, we can estimate the development in biomass for each site and the company (). This allows us to determine a harvest plan. As the company has 7,020 tonnes MTB standing biomass, the harvest plan must be such that the standing biomass never exceeds this limit. As illustrated in , this means the company must start harvesting in October year one so as to prevent the standing biomass from exceeding the MTB at the beginning of November, as the biomass otherwise would exceed 7,300 tonnes (see November, last column).
Table 6. Estimated potential biomass based on and —before harvesting and adapting to MTB-constraint.
Harvesting in October is determined by the potential biomass per 1st November which is estimated at 7,303.8 tonnes, if there is no harvesting. This is 283.8 tonnes more than the MTB of 7,020 tonnes. With a fish weight per 1st November of 4.1 kg for site one, which has the largest fish, there must be a harvest of 69,200 fish so as not to exceed MTB per 1st November (283.8 tonnes/4.1 kg). Harvesting is determined in this way for every month so that the biomass at the beginning of every month is 7,020 tonnes for the company. When harvesting is taken into consideration, the development in biomass over time is as presented in .
Table 7. Development in biomass over time—per site and for the company—adapted to company MTB.
Maximum biomass per site varies from 2,664.8 tonnes (site one) to 3,277.6 tonnes (site three), as shown in . Planned harvesting per month measured as number of fish is shown in (in this model, only fish that survive until the following month will be harvested).
Table 8. Harvest plan in number of fish per site, given planned standing biomass of 7,020 tonnes at the beginning of each month (“steady state” from year 2 onwards).
Harvest quantity can be estimated when it is assumed how harvesting is distributed over the month. This is done in where it has been assumed that the harvest weight is equal to the average weight per fish per month for each site.14
Table 9. Harvest per site and in total per month—based on average monthly weight in kg.
From we can find a harvest quantity for year one of 2,751.2 tonnes. Steady state is reached in year two with a total harvest of 14,901.2 tonnes per year with an average fish weight of 5.28 kg. This is summarized in .
Table 10. Annual steady state production.
Investments
As illustrated in the production plan, with on-growing of 500 g smolts there is a need for six sites. Maximum biomass for a single site is estimated at 3,277.6 tonnes. With maximum density of 25 kg per m3, the need for pen volume per site will be around 131,100 m3 as a minimum. With 130 m sea-pens with a volume of 25.000 m3, six pens per site will be required. Total investments are as given in .
Table 11. Investments in sea-based on-growing facility (on-growing of 500-g smolts).
Total investments amount to NOK 1.089 billion, including NOK 882.4 million for the nine production permits. Annual depreciation and interest charges are estimated according to the annuity principle and represent NOK 65.2 million.
Cost of production
General assumptions regarding variable operating costs are given above. Based on the average number of employees per permit, the company will have 38 production workers. Price per smolt is set at NOK 27.40 a piece (Bjørndal & Tusvik, Citation2018), while feed requirement (feed conversion factor * growth) is estimated at 15,443.9 tonnes.
On this basis, we can establish annual costs as well as costs per kg produced (). Total costs represent NOK 404 million annually in steady state, with 83% and 17% variable and fixed, respectively. The cost of production is NOK 28.90/kg whole fish equivalent (WFE).
Table 12. Total costs per year and per kg (on-growing of 500 g post-smolts).
Comparison: on-growing of 100 g, 500 g, and 1,000 g smolts
We will next compare on-growing of 100 g, 500 g, and 1,000 g smolts. For comparison, we include 100 g smolts as this is what is most common in the industry as of today. While we did a very detailed analysis for 500 g smolts, when it comes to 100 g and 1,000 g smolts we will only present the essentials as the methodology is the same as for 500 g smolts.15
On-growing of 100 g smolts
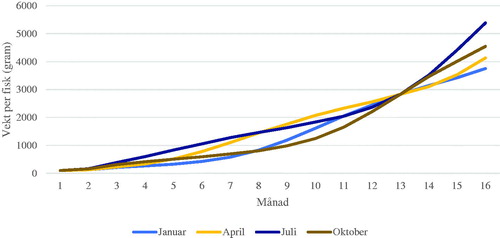
Weight curves for 100 g smolts are illustrated in . Also, in this case, the curves converge after about 12 months when all batches have been through all four seasons of the year, however, the subsequently diverge. A harvest weight of about 5 kg is reached after 15–17 months in sea, depending on time of release.
Figure 2. Weight curves for 100 g smolts.
With four releases per year as before and a somewhat longer production period, eight sites will be needed. The maximum biomass at a single site is estimated at 3,080 tonnes which will necessitate six pens per site. Investments amount to NOK 1,153 million with annual depreciation and interest charges at NOK 74.7 million. The steady state production will be 14,271 tonnes with an average harvest weight of 5.32 kg ().
Table 13. Annual production with 100 g smolt.a
Price per smolt is NOK 12.00 (Bjørndal & Tusvik, Citation2018) and the steady state feed requirement is 16,117.4 tonnes. Other assumptions are as given above. The total cost of production per year and per kg are given in (bear in mind that the harvest quantity, as determined by the production plan, is lower than with larger smolts due to more months with mortality and the same number of smolts released). Total cost of production per year is NOK 375 million, of which 79% variable and 21% fixed. Cost of production is NOK 28.00/kg round weight which is lower than for 500 g smolts.
Table 14. Total costs per year and per kg 100 g smolts.
On-growing of 1,000 g smolts
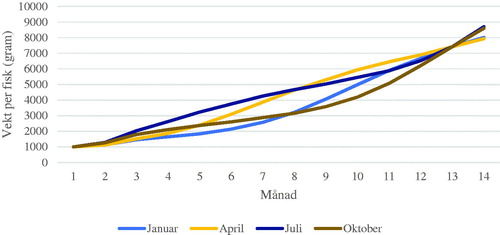
shows weight curves for the release of 1,000 g smolts in January, April, July, and October, respectively. All four release times will give harvestable fish in less than 1 year. It can be seen that after 12 months—when the fish have been exposed to all four seasons regardless of release time—weights converge to about 7.4 kg. As we are considering a harvest weight of about 5 kg, harvesting will commence after less than 1 year in sea so that there will be some differences in fish weight depending on the release time. For example, after 10 months (i.e., at the beginning of month 11 in the figure), the January release will have reached a weight of 5.9 kg, the April release a weight of 6.5 kg, the July release a weight of 5.9 kg while the October release will have a weight of 5.1 kg.
Figure 3. Weight curves for 1,000 g smolt.
As can be seen from , the four releases require eight to 10 months to reach a harvest weight of 5 kg. In addition, for each cycle, the site must be laid fallow after harvesting before the new cohort is released. Therefore, each cycle will take about 1 year. This means that for four releases per year, five sites will be required. This is because after release of smolts in site one this site will not be ready again until January the following year. With these assumptions, release one takes place in site one in January year one, with the next release in April the following year, while the third release will be in July, year three, and so on.
Steady state production with an annual harvest of 15,80 tonnes will be reached in year two (), with monthly harvest varying between 580 tonnes in April and 2,224 tonnes in September. Average harvest weight is 5.5 kg as compared to 5.28 kg for the case of 500 g smolts.
Table 15. Annual harvest with 1,000 g smolts.a
Steady state production with release of 1,000 g smolts is 15,807.1 tonnes or 6% higher than with release of 500 g smolts. Even if the same number of smolts is released, with 1,000 g smolts more fish survive until harvest as the sea phase is shorter. In addition, average harvest weight is higher.
The difference is a result of the assumptions underlying the analysis. In both cases the biomass reaches 7,020 tonnes at the beginning of each month. Harvest quantity is net growth for each month. Net growth is influenced by seasonal harvest profile, temperature profile, and growth as well as development in the number of fish over the year. Differences in quantity for the different scenarios are presumably mainly due to the fact that the number of fish released is the same in all examples, while the number of months with mortality varies. Consequently, the number of fish harvested is different. In addition, release times are the same in all examples. With different release weights and growth periods there are differences in temperature and seasonal exposure, and thereby growth profiles, for the different scenarios.
While six sites are required for the 500 g smolt scenario, in the case of 1,000 g smolts, the production plan is based in five sites. The maximum biomass of an individual site is estimated at 3,673.8 tonnes. With maximum density of 25 kg per m3, a pen volume of minimum 147,000 m3 is required. With the same assumptions regarding pens as above, there is still a need for six pens per site. This gives total investments of NOK 882.4 million with annual depreciation and interest charges at NOK 60,448,655, as compared to NOK 62,469,446 for the 500 g scenario.
As for variable costs, price per smolt is NOK 48.00 (Bjørndal & Tusvik, Citation2018) while feed requirement is estimated at 14,732.9 tonnes. Annual costs of production in steady state and per kg are presented in . Annual costs are NOK 456 million, of which 86% are variable and 14% are fixed. Cost of production is NOK 30.80/kg WFE as compared to NOK 28.90 for the case of 500 g smolts.
Table 16. Total costs per year and per kg 1,000-g post-smolts.
Comparison of 100 g, 500 g, and 1,000 g smolts
The analysis of on-growing of 100, 500, and 1,000 g smolts shows that part of the higher cost for large smolts is offset by the feed cost (reduced on-growing in the sea), reduced investments due to use of fewer sites than for small smolts and higher quantity as a result of a shorter sea phase giving lower mortality. The results are summarized in . The cost of production for the three scenarios is NOK 28.00, 28.90 and 30.80, respectively, per kg Whole Fish Equivalent (WFE). When it comes to cost of production per kg, it should be noted that all costs including smolts are estimated on the basis of harvest quantity without correcting for the incoming weight of the smolts (i.e., based on produced quantity in sea which, for example, is 4.9 kg for a fish harvested at 5 kg with a release weight of 100 g—or 4 kg for a 5 kg harvested fish with a release weight of 1,000 g).
Table 17. Annual steady state production, on-growing of 100, 500 and 1,000 g smolts in open sea-pens.
The Directorate of Fisheries, Norway, undertakes an annual survey of costs and earnings in the salmon aquaculture industry. For 2018, the average cost of production was NOK 30.09/kg WFE.16 These costs are not directly comparable with the results presented in . The Directorate of Fisheries use accounting data in their survey, and due to excellent solidity in the industry, financial costs (accounting costs) are negligible. In our estimates, however, full financial costs are included, not only for the equipment investments but also for permits and the stock of fish. Although we will not go into a further analysis of these issues, the results clearly indicate that post-smolt production will be competitive with traditional sea-based salmon farming. This is in clear contrast to land-based production which have significantly higher costs (Bjørndal & Tusvik, Citation2019), and which only can be justified when prices are very high due to limited access to new production sites.
When comparing the different scenarios, an interesting observation pertains to use of area and sites. The difference in production period implies that with post-smolts production of a certain quantity of fish is possible using a smaller area/fewer sites compared to that required for smaller smolts. This is evidenced by production per site () which varies from 1,783.9 tonnes per site with 100 g smolts for eight sites, compared to 3,161.4 tonnes per site with five sites for 1,000 g smolts (one should possibly adjust for release size if the focus is on on-growing at the site). In our analysis, the release pattern is identical with four releases per year in the same months. The difference could potentially be even larger if there are constraints on the release of 100 g smolts—an example is when temperature conditions do not permit release in January.
Larger production per site is advantageous from an economic point of view. This is true for firms, with regard to investments, and for the industry as a whole, as it would allow for larger production from the aggregate number of sites available for salmon on-growing. The difference is also interesting from an environmental point of view as sites may be laid fallow at shorter intervals, which is advantageous with regard to contagion and natural cleansing of the sea floor.
Biological risk: lice and delousing—consequences for production quantity and quality
Lice represent a biological risk. This involves different kinds of costs due to treatment, reduced growth, and increased mortality. Delousing may also involve quality downgrade of the fish. It is both the size and the timing of the outbreaks of lice that will determine how large these costs are.
Cost of production will be influenced by increased mortality. Quality downgrade, on the other hand, has an impact on revenues rather than costs. Nevertheless, it is possible to estimate the consequences. This income loss is easiest to assess at the company level for a given salmon price. It is more challenging to estimate the income loss at the industry level, as the biomass loss may affect total industry income due to increased price as a consequence of reduced quantity.17 In addition, delousing may cause a reduction in harvest weight per fish. For this reason, harvested fish may end up in lower weight classes with lower prices per kg which is also an income effect.
The analyses undertaken up to now have not included specific consideration of the costs of delousing. “Other variable costs” above include NOK 2.5 million for health and veterinary services, however, this does not include “extraordinary” events but rather “normal” operating conditions. The number of employees has been taken from official statistics and may thus include some costs associated with “extraordinary” situations. The monthly mortality of 0.75% is possibly a bit on the high side and should perhaps be somewhat lower with the level of lice problems one would like to consider as “normal.”
Today, efforts to prevent and treat lice are substantial and affect all operations in a farm (Iversen et al., Citation2017). In the past delousing costs could largely be seen from the increase in “other costs”; however, today more or less all costs are affected by the lice situation. High incidence of lice has in some instances led to harvesting at lower weight—average weight per fish at harvest was reduced from 4.6 kg in 2014 to less than 4.3 kg in 2016 (Iversen et al., Citation2017). Mortality related to delousing has caused an increase in the average weight of dead fish. Combined with lower production, which means costs are allocated over a lower quantity, costs will be affected in many ways (Iversen et al., Citation2017). A lower quantity also results in higher costs per kg when it comes to costs for prevention and treatment. Use of more expensive feed can also increase cost of production.
In this section, we will analyze the magnitude of lice and delousing costs using different production models. As a starting point, we will consider estimates of the number of delousings per generation in the different production models. This may vary geographically and between sites. For 100 g smolts, we consider alternatively five and 10 delousings. This is reduced to three for 500 g smolts and two for 1,000 g smolts.
For 100 g smolts, the first lice treatment is assumed to be in month nine. With five treatments, these take place every second month (months 9, 11, 13, 15 with the final one in month 16), while with 10 treatments they take place every month up to month 18. For 500 g smolts, treatments are in months 7, 9 and 11, while with 1,000 g smolts, in months 7 and 9.18
Cost assumptions for the economic analyses are given in .
Table 18. Assumptions regarding costs and losses due to delousing.
Delousing of 100 g smolts
Initially, we consider five delousings per generation for 100 g smolts. The direct cost is put at NOK 0.50/kg which is an average for the different treatments as specified in (a higher cost will be considered below). At the time of delousing, an additional mortality of 0.5% is assumed, so that mortality in treatment months is 1.25%. Due to starvation of fish and stress, it is assumed that one will lose 4.5 days of feeding in each month with treatment (the growth factor remains unchanged). Delousing is assumed to start in month nine.
The estimated consequence of 4.5 lost days with feeding for each of the five delousings is illustrated in , with each of the four yearly release months in separate columns. Treatment months are given in red (start weight the following month is affected). Two of the releases have a planned harvest for month 16, when the last treatment occurs, while the two others are harvested later.
Table 19. Comparison of estimated development in weight for 100 g smolts before and after five delousings with loss of 4.5 growth days per delousing.
The cost per delousing is estimated based on the biomass per delousing and the per kg cost as given above. Costs per delousing and of four generations per year are given in . In steady state, costs per year will be equal to costs for four generations. With delousing five times per generation, annual costs amount to NOK 18.297 million which increases to NOK 33.635 for the case of delousing 10 times.
Table 20. Costs per delousing and cost of four generations per year in steady state.
To find the impact on cost of production per kg we must estimate change in quantity produced due to mortality and reduced growth. Assuming the same number of smolts released and the same release plan as before, it must be determined whether the harvest plan is to be adjusted because of the loss in biomass. If harvesting is undertaken as before, the standing biomass will be lower than permitted MTB due to reduced growth as a consequence of treatments and mortality. Here, we only present numbers for the scenario with the harvest plan as before, although we acknowledge that farmers may respond by increasing the number of smolts released to still reach the MTB limit. gives production with harvest plan on this assumption.19
Table 21. Production with different scenarios for delousing 100-g smolts.
With five treatments, the cost of production is NOK 31.30/kg WFE as compared to NOK 28.00/kg without lice. With 10 treatments, the cost of production is NOK 33.80/kg.
Another result of the analysis is that the loss in the number of fish in a rather limited degree is influenced by the delousings under the assumption that there is only 0.5% extra mortality per treatment (total mortality 1.25% in treatment months). The additional mortality does not give a large increase in total loss compared to the “base case” with 0.75% monthly mortality, no treatment months and a total loss of 10.4% over a cycle. With five treatments and 100 g smolts, the loss in the number of fish is estimated at 14%, increasing to 16% with 10 treatments. The loss in biomass is 690.9 tonnes without delousing, 845 tonnes with five delousings and 1,012 tonnes with 10 delousings.
Delousing of 500 g and 1,000 g post-smolts-grams
As noted above, the shorter cycle in sea will imply a reduction in the need for delousing with three treatments for 500 g and two for 1,000 g post-smolts. For both scenarios weight loss, mortality and harvesting have been modeled in the same way as for 100 g smolts.
For 500 g post-smolts, direct treatment costs are almost NOK 13 million, with three delousings, while for 1,000 smolts the costs are NOK 11.184 million with two delousings (). The results are sensitive to assumptions regarding time of delousing and fish size at delousing. In this case, larger fish is treated in the 1,000 g scenario than in the 500 g scenario.
Table 22. Costs per delousing and cost of four generations per year in steady state.
In steady state, the cost of production is now NOK 31.00/kg for the case of 500 g smolts as compared to NOK 32.40/kg for 1,000 g post-smolts (). The cost of production is increasing in increasing smolt size. This is because the smolt price is increasing, but the analyses are also affected by the average weight of fish at the times of treatment.
Table 23. Production with different scenarios for delousing, 500 g and 1,000 g smolts.Table Footnotea
Summary: delousing of 100 g, 500 g, and 1,000 g smolts
The analysis of biological risk in sea has illustrated the impact of lice on cost of production. Some results are summarized in . The increase in cost of production due to lice treatment varies between NOK 5.80/kg for 100 g smolts with 10 treatments and NOK 1.60/kg for 1,000 g post-smolts with one treatment. This variation is due to both the number of treatments and the timing of the treatments. NOK 0.80–3.00/kg is represented by the direct cost of treatment. For on-growing of 100 g smolts, the cost of production is estimated at NOK 28.00/kg under “normal” conditions. With five treatment, this increases to NOK 31.30/kg and to NOK 33.80/kg with 10 treatments, given a treatment cost of NOK 0.50/kg.
Table 24. Annual steady state production cost, on-growing of 100 g, 500 g and 1,000 g smolts with delousing.
As can be observed from the table, the cost difference per kg between no treatment and with treatment is substantially higher than the direct treatment cost—the difference may be twice the direct treatment cost. This is due to the loss in production caused by weight loss and mortality which means costs are allocated over a smaller quantity. The loss in production also implies that a lower income will be realized.
For 100 g smolts, the average harvest weight is reduced from 5.32 kg in the “base case” without lice to 4.78 with five treatments and 4.66 kg with 10 treatments. The harvest is reduced from 14, 271.3 tonnes (no treatment) to 12,145.8 tonnes (10 treatments), a reduction of almost 15%. Biomass loss increases from 690.9 tonnes (no treatment) to 1,012.2 tonnes (10 treatments), an increase of 55.5%. Cost of production increases from NOK 28.00/kg to NOK 30.70/kg (five treatments) to NOK 33.80/kg (10 treatments), an increase of NOK 5.00 or 17.4% for the case with 10 treatments. The total cost of production increases by about NOK 10 million. By considering cost of production and quantity it is possible to compare the different alternatives. Considering 100 g smolts with 10 lice treatments, both 500 g and 1,000 g post-smolts with treatments are seen to be favorable, both with regard to cost of production as well as harvest quantity.20
One comment on this analysis is that comparison of delousing costs is demanding, as the model cannot estimate contagion risk and population dynamics of lice. For example, it is not considered if there are differences in season, biomass density, time since last fallow period or other variables that may influence when the need for treatment arises. Without this, we must make assumptions as to when and how often delousing occurs, as have been made above. One problem with this as that the assumptions one otherwise makes about time of delousing and fish size will impact cost of production and the differences between the scenarios.
The cost of sea lice is also high and lice infestation is the main reason for the increase in cost of production from 2012 to the present (Bjørndal & Tusvik, Citation2018). In Norway, it generates damages corresponding to 9–13% of revenues (Abolofia et al., Citation2017), representing about 20% of cost of production before harvest (Iversen et al., Citation2017; Morency-Lavoie, Citation2016), while Bjørndal and Tusvik (Citation2018) find situations with possibly even higher costs. The results presented here indicate costs in the range 5–20% per kg; however, the lowest estimate is for on-growing of 1,000 g post-smolts with only two delousings. Therefore, the results presented here are broadly in line with other results from the literature, even if we have used a different methodology. Nevertheless, it must be noted that revenue effects have not been considered.
Revenue effects
Finally, we will now consider potential loss in revenue due to downgrading and the assumption regarding the treatment cost. We will consider the following, based on 100 g smolts:
Quality downgrading of 2.5% and 8% respectively, of quantity with five lice treatments.
Quality downgrading of 5% and 12% respectively, with 10 lice treatments.
Treatment cost of NOK 1.00/kg (double NOK 0.50 in the base case).
In , a downgrading of 0.5% per lice treatment is mentioned, which would give 2.5% and 5% total downgrading with five and 10 treatments, respectively. According to Senstad and Bolstad (Citation2017) actual figures can be considerably higher—these authors suggest 8% downgrading with five treatments and 12% with 10 treatments. Both these alternatives will be considered her. We assume a price reduction of NOK 12.00/kg for the downgraded fish.21 The revenue reduction due to reduced harvest weight per fish will not be considered.
With these assumptions, potential revenue loss due to downgrading is in the range NOK 4–12.8 million with five treatments and NOK 7.3–17.5 million with 10 treatments (). This is a substantial loss. This analysis is undertaken for 100 g smolts only as the consequences for an increase in cost of production etc. are the greatest for this scenario.
Table 25. Revenue loss due to quality downgrading: 100 g smolts with five and 10 treatments.
The treatment cost also has an important impact on cost of production. If this increases from NOK 0.50/kg to NOK 1.00/kg, the cost of production will increase from NOK 33.80/kg to NOK 36.90/kg WFE for 10 treatments, an increase of almost 10%. This illustrates that both the number of treatments and the cost per treatment has a big impact on costs—NOK 28.80/kg without treatment to NOK 36.80/kg with 10 treatments and NOK 1.00/kg treatment cost.
Summary
This article has compared traditional on-growing of 100 g smolts with on-growing of post-smolts of 500 g and 1,000 g. The results indicate that in the case of no lice, on-growing of 100 g smolts is most cost efficient. However, when lice costs are considered, the results show that production of post-smolts on land is profitable. Sea lice lead to higher mortality and reduced growth as well as considerable treatment costs, all contributing to an increase in cost of production, and this cost increase the longer the fish is kept in sea-pens. Moreover, there is also a revenue effect due to quality degrading and lower prices as fish weight is reduced so that more fish are sold in lower weight classes that fetch lower prices per kg. The results presented in the article are supported by developments in the industry where increased production of post-smolts can be observed.22
For all scenarios, a set of common assumptions have been specified so as to make them comparable. In all cases, the biomass reaches 7,020 tonnes at the beginning of each month, a quantity determined by government regulations. Harvest quantity is net growth for each month. Net growth is influenced by seasonal harvest profile, temperature profile, and growth as well as development in the number of fish over time. Differences in quantity for the different scenarios are mainly due to the fact that the number of fish released is the same in all examples, while the number of months in sea and thus mortality varies. Consequently, the number of fish harvested is different. In addition, release times are the same in all examples.
As constraints and production conditions vary for different farmers and locations, it is challenging to define appropriate general assumptions for production planning. An analysis of production at the firm level may define MTB as a constraint and optimize the production strategy in this context. In this article, this has been done so that a set of basic assumptions relating to release times and numbers, weight curves and production capacity are the same for all scenarios under consideration. This has been done to facilitate comparison between on-growing of traditional smolts and post-smolts. In reality, availability of sites and site specific conditions such as temperatures, site-MTB, currents, contagion profile and possible periods for coordinated fallowing, etc. may vary from firm to firm and have an impact on optimal strategy. Therefore, regarding release times, due to variations in the growth cycle, temperature and growth over the year and contagion profile/risk at sea, a firm may be able to adjust both release times, size of smolts and number of fish released based on different considerations—including maximum net growth, desired harvest pattern and time, and possible constraints in relation to harvesting capacity and access to smolts.
The results also have important policy implications. While mechanical treatment of lice has been criticized because it leads to higher mortalities, chemical sea lice treatments have been severely criticized because of fears of negative environmental effects. The use of post-smolts, with reduced mortalities and need for mechanical or chemical delousings, thus has positive implications for fish welfare and the environmental benefits. These effects are important when it comes to the public perception of aquaculture and will thus have an impact on future growth of the industry.
Acknowledgments
The authors are grateful to two anonymous reviewers and the editor for very insightful comments.
Notes
Additional information
Funding
Notes
1 These figures do not include sea trout and salmon other than Atlantic salmon.
2 It is of interest to note that this has largely stopped the productivity growth that has been a main driver for the production growth (Asche, Citation2008; Kumar & Engle, Citation2016), as shown in Rocha-Aponte and Tveterås (Citation2019) and Roll (Citation2019). Regulations and limited productivity growth are also a major factors hindering production growth in other European countries (Guillen et al., Citation2019).
3 Previously, the government issued salmon farming licenses. The terminology has now changed, with the term permit or permission having replaced license.
4 945 tonnes in the counties of Troms and Finnmark.
5 One could also apply for increases in production capacity in yellow and red areas, however, more stringent rules apply. See Directorate of Fisheries, Norway (Citation2019b).
7 As this price is for an increased production capacity in an already established operation so that set-up and investment costs are probably minimal, this number probably overestimates the price of an entire licence.
8 Capacity adjustment in 2020 has just been announced, see https://lovdata.no/dokument/SF/forskrift/2020-02-04-105.
9 The price/kg increase with the size of the fish (Asche & Guttormsen, Citation2001).
10 Examples include Bjørndal et al. (Citation2015) and Bjørndal and Tusvik (Citation2019). An alternative would be to combine a cost of production analysis with an investment analysis, however, that would go beyond the scope of the current article.
11 According to Dahl and Idsø (Citation2017), production per permit has increased considerably over the past decade. However, the authors suggest the output could be increased even more. Our assumption is in line with current good practice in the industry.
12 The model is formulated with a given mortality per month which is given as a percentage of the number of fish per site. One issue that arises is whether more fish should be released when smaller smolts are released to compensate for greater morality due to a longer sea phase. While this is a pertinent point, in this study each batch is equal regardless of smolt size. The model also deviates from current production practice when smolts are released at about 100g, as there are then no releases in winter, but starting in April and ending in October. We assume the January release is possible due to larger more robust fish.
13 This assumption is based on considerations in NOU 2012:16 (Citation2012); with 3% inflation, this implies a nominal interest rate of 7%. Campo and Zuniga-Jara (Citation2018) estimate the weighted average rate of return (WACC), an average of debt and equity finance, for investments in aquaculture and find a global average of 10.6% over the past 25 years. As this is a nominal interest, it implies a (nominal) risk premium of 3.6%.
14 In months with harvesting from several sites, this might suggest that the weight in the last harvest month of each site is exaggerated as one may well harvest this fish early in the month before harvesting from the next site commences later in the same month.
15 More details are available from the authors on request.
16 See Directorate of Fisheries, Norway (Citation2019a).
17 A parallel to this can be found in disease outbreaks: disease will cause losses for farmers, but if they are of sufficient magnitude, reduced quantity may lead to an increase in price (Aunsmo, Citation2008: Asche et al., Citation2018).
18 Smolts will be released at a site that has been fallow for some months and it will take time for the lice pressure to build up; hence delousing only starts after a period of time. This is also a reason for the use of larger smolts.
19 As an alternative, we could assume harvesting with adjustment to MTB (i.e., standing biomass equal to 7,020 tonnes at the beginning of every month, assuming that the fish at the end of the cycle will continue growing and surviving as before in months without delousing). For the case of five treatments, this would allow a somewhat higher harvest (13,324 tonnes as opposed to 12,707 tonnes with unchanged harvesting) and thus, a somewhat lower cost per kg.
20 The reader is again reminded about the assumptions regarding equal number of fish released and monthly mortality.
21 This assumption is taken from Senstad og Bolstad (Citation2017).
22 A recent example is given by Bremnes Seashore, Grieg Seafood and Vest Havbruk developing a joint facility for production of 700–1,000g smolts to be completed in 2019, among other things, reducing the sea phase to 12 months (Ilaks, Citation2017a).
References
- Abolofia, J., Asche, F., & Wilen, J. E. (2017). The cost of lice: Quantifying the impacts of parasitic sea lice on farmed salmon. Marine Resource Economics, 32(3), 329–349. https://doi.org/https://doi.org/10.1086/691981.
- Anderson, J. L., Asche, F., & Garlock, T. (2019). Economics of aquaculture policy and regulation. Annual Review of Resource Economics, 11(1), 101–123. doi:10.1146/annurev-resource-100518-093750
- Asche, F. (2008). Farming the sea. Marine Resource Economics, 23(4), 527–547. doi:10.1086/mre.23.4.42629678
- Asche, F., & Bjørndal, T. (2011). The economics of salmon aquaculture (2nd ed.) Oxford, UK: Wiley-Blackwell.
- Asche, F., Cojocaru, A.L., & Sikveland, M. (2018). Market shocks in salmon aquaculture: The impact of the Chilean disease crisis. Journal of Agricultural and Applied Economics, 50(2), 255–269. doi:10.1017/aae.2017.33
- Asche, F., Oglend, A., & Kleppe, T. (2017). Price dynamics in biological production processes exposed to environmental shocks. American Journal of Agricultural Economics, 99(5), 1246–1264. doi:10.1093/ajae/aax048
- Asche, F., & Guttormsen, A. G. (2001). Patterns in the relative price for different sizes of farmed fish. Marine Resource Economics, 16(3), 235–247. doi:10.1086/mre.16.3.42629321
- Asche, F., Misund, B., & Oglend, A. (2019). The case and cause of salmon price volatility. Marine Resource Economics, 34(1), 23–38. doi:10.1086/701195
- Aunsmo, A. (2008). Health related losses in sea farmed Atlantic salmon. Oslo: Norwegian School of Veterinary Science.
- Bjørndal, T. (1988). Optimal harvesting of farmed fish. Marine Resource Economics, 5(2), 139–159. doi:10.1086/mre.5.2.42628926
- Bjørndal, T., & Tusvik, A. (2018). Økonomisk analyse av alternative produksjonsfomer innan oppdrett (in Norwegian: An economic analysis of alternative production technologies in aquaculture) (SNF report 07/18). Bergen: SNF.
- Bjørndal, T., & Tusvik, A. (2019). Economic analysis of land-based farming of salmon. Aquaculture Economics & Management, 23(4), 449–475. doi:10.1080/13657305.2019.1654558
- Bjørndal, T., Guillen, J., Imsland, A., & Øiestad, V. (2015). Sole: Production and markets. Globefish Research Programme, Vol. 118, 72 p. Rome: FAO.
- Braekkan, E. H., Thyholdt, S. B., Asche, F., & Myrland, Ø. (2018). The demands they are a-changin. European Review of Agricultural Economics, 45(4), 531–552.
- Campo, S. R., & Zuniga-Jara, S. E. (2018). Reviewing capital cost estimations in aquaculture. Aquaculture Economics & Management, 22(1), 72–93. doi:10.1080/13657305.2017.1300839
- Dahl, R., & Idsø, J. (2017). Biomassereguleringane i norsk lakseoppdrett. Verkemåte, tilpassingar, verknader og konsekvensar (in Norwegian: The biomass regulation in Norwegian salmon farming). Høgskulen på Vestlandet, Naerregion Sogn og Fjordane N-NR 6/2017.
- Directorate of Fisheries, Norway (2019a). https://www.fiskeridir.no/Akvakultur/Tall-og-analyse/Loennsomhetsundersoekelse-for-laks-og-regnbueoerret/Matfiskproduksjon-laks-og-regnbueoerret
- Directorate of Fisheries, Norway (2019b). https://www.fiskeridir.no/Akvakultur/Tildeling-og-tillatelser/Kapasitetsjustering-trafikklyssystemet
- Directorate of Fisheries, Norway (2016). Resultat pr. tillatelse (in Norwegian: Result per permission). Aquaculture Statistics. Retrieved from https://fiskeridir.no/content/download/20013/283305/version/13/file/lon-mat15-pr-tillatelse.xlsx
- Dresdner, J., Chávez, C., Quiroga, M., Jiménez, D., Artacho, P., & Tello, A. (2019). Impact of Caligus treatments on unit costs of heterogeneous salmon farms in Chile. Aquaculture Economics & Management, 23(1), 1–27. doi:10.1080/13657305.2018.1449271
- Garlock, T., Asche, F., Anderson, J., Bjørndal, T., Kumar, G., Lorenzen, K., … Tveterås, R. (2020). A global blue revolution: Aquaculture growth across regions, species, and countries. Reviews in Fisheries Science & Aquaculture, 28(1), 107–116. doi:10.1080/23308249.2019.1678111
- Guillen, J., Asche, F., Carvalho, N., Fernández Polanco, J. M., Llorente, I., Nielsen, R. … (2019). Aquaculture subsidies in the European Union: Evolution, impact and future potential for growth. Marine Policy, 104, 19–28. doi:10.1016/j.marpol.2019.02.045
- Hagspiel, V., Hannevik, J., Lavrutich, M., Naustdal, M., & Struksnaes, H. (2018). Real options under technological uncertainty: A case study of investment in a post-smolt facility in Norway. Marine Policy, 88, 158–166. doi:10.1016/j.marpol.2017.11.020
- Hersoug, B., Mikkelsen, E., & Karlsen, K. M. (2019). Great expectations-allocating licenses with special requirements in Norwegian salmon farming. Marine Policy, 100, 152–162. doi:10.1016/j.marpol.2018.11.019
- Hilmarsen, Ø., Holte, E. A., Brendeløkken, H., Høyli, R., & Hognes, E. S. (2018). Konsekvensanalyse av landbasert oppdrett av laks – matfisk og post-smolt (in Norwegian: Consequenses of land-bases salmon farming) (Sintef report OC2018 A-033). Trondheim: Sintef.
- Holan, A. B., Roth, B., Breiland, M. S. W., Kolarevic, J., Hansen, Ø. J., & Iversen, A. (2017). Beste praksis for medikamentfrie metoder for lakseluskontroll (in Norwegian: Best practices for lice control without chemical treatment) (Nofima report 10/2017). Tromsø: Nofima.
- Ilaks. (2017a). https://ilaks.no/grieg-og-bremnes-satser-300-mill-pa-storsmolt/
- Ilaks. (2017b). Den gjennomsnittlige slaktevekten har gått ned med en halv kilo (in Norwegian: The average harvest weight has been reduced by one half kilo). News press, article by Nodland, E., 01.02.2017. Retrieved from http://ilaks.no/den-gjennomsnittlige-slaktevekten-har-gatt-ned-med-med-en-halv-kilo/
- IMR. (2015). Foreslår å dele kysten i 11-13 produksjonsområder (in Norwegian: Proposing a division of the coast into 11-13 production areas). Norwegian Institute of Marine Research. News archive, published by Sunnset, A., 23.03.2015. Retrieved from http://www.imr.no/nyhetsarkiv/2015/mars/foreslar_a_dele_kysten_i_11-13_produksjonsomrader/nb-no
- Iversen, A., Asche, F., Hermannsen, Ø., & Nystøl, R., (2020). Production cost and competitiveness in major salmon farming countries 2003–2018. Aqaculture, 522, 735089.
- Iversen, A., Hermansen, Ø., Nystøyl, R., & Hess, E. J. (2017). Kostnadsutvikling i fiskeoppdrett (in Norwegian: Cost development in in fish farming) (Nofima report 24/12). Tromsø: Nofima.
- Kumar, G., & Engle, C. (2016). Technological advances that led to growth of shrimp, salmon, and tilapia farming. Reviews in Fisheries Science & Aquaculture, 24(2), 136–152. doi:10.1080/23308249.2015.1112357
- Misund, A. U. (2019). From a natural occurring parasitic organism to a management object: Historical perceptions and discourses related to salmon lice in Norway. Marine Policy, 99, 400–406. doi:10.1016/j.marpol.2018.10.037
- Misund, B., & Nygård, R. (2018). Big fish: Valuation of the world's largest salmon farming companies. Marine Resource Economics, 33(3), 245–261.
- Morency-Lavoie, F. (2016). Spatial externalities in salmon aquaculture: Salmon lice management in Norway. Presentation at IIFET Scotland July 11–15, 2016. Abstract Reference: 0296.
- Norwegian Government. (2015). Bærekraftig og forutsigbar vekst for laks (in Norwegian: Sustainable and predictable growth for salmon). Press release, 20.03.2015. Retrieved from https://www.regjeringen.no/no/aktuelt/barekraftig-og-forutsigbar-vekst-for-laks/id2401801/
- Norwegian Government. (2017). Produksjonsområdeforskriften: Forskrift om ny vekstmodell i norsk oppdrett (in Norwegian: Production area regulation: Regulation on a new growth model in Norwegian aquaculture). Retrieved from https://www.regjeringen.no/contentassets/e7d6c0c57c7a487c83f6b4205fd1157c/forskrift-til-fastsettelse-prodomrader.pdf
- NOU 2012:16. (2012). Cost-benefit analysis. Review from a committee appointed by Royal Decree of 18 February 2011. Submitted to the Ministry of Finance on 3 October 2012. Official Norwegian Reports NOU 2012:16.
- Osmundsen, T. C., Almklov, P., & Tveterås, R. (2017). Fish farmers and regulators coping with the wickedness of aquaculture. Aquaculture Economics & Management, 21(1), 163–183. doi:10.1080/13657305.2017.1262476
- Osmundsen, T. C., Olsen, M. S., & Thorvaldsen, T. (2020). The making of a louse – Constructing governmental technology for sustainable aquaculture. Environmental Science & Policy, 104, 121–128. doi:10.1016/j.envsci.2019.12.002
- Rocha-Aponte, F., & Tveterås, S. (2019). On the drivers of cost changes in the Norwegian salmon aquaculture sector: A decomposition of a flexible cost function from 2001 to 2014. Aquaculture Economics & Management, 23(3), 276–291. doi:10.1080/13657305.2018.1551438
- Roll, K. H. (2019). Moral hazard: The effect of insurance on risk and efficiency. Agricultural Economics, 50(3), 367–375. doi:10.1111/agec.12490
- Sandvold, H. N., & Tveterås, R. (2014). Innovation and productivity growth in Norwegian production of juvenile salmonids. Aquaculture Economics & Management, 18(2), 149–168. doi:10.1080/13657305.2014.903313
- Senstad, K., & Bolstad, H. (2017). Postsmolt utan RAS anlegg på land (Vol. 42, No. 12, pp. 30–34). Norsk Fiskeoppdrett.
- Torrissen, O., Jones, S., Guttormsen, A., Asche, F., Horsberg, T. E., Skilbrei, O., Jackson, D., & Nilsen, F. (2013). Salmon lice – Impact on wild salmonids and salmon aquaculture. Journal of Fish Diseases, 36(3), 171–194. doi:10.1111/jfd.12061