
Introduction
Evidence suggests that the proportion of the human population living in cities will continue to grow, to the point where over 90% of the world’s population will be living in one form of city or another by the end of this century (Batty Citation2018a). The largest cities are complex and dynamic but suffer from numerous problems associated with their high densities and intensity of activity: traffic congestion, crime, rapidly rising rents, air pollution, and urban heating, to name but a few of the more obvious. Yet despite these problems, large cities benefit from massive economies of scale, allowing the kinds of services to be provided to their populations that might be impossibly expensive at lower densities in rural areas and in smaller cities.
Today, information is indispensable to the successful management and operation of cities. Information is more abundant than ever before, due in part to the widespread adoption of computers, communication networks, and sensors. Computational power is also more abundant, as is the capacity to store digital data; and in this era of big data, it has become possible to acquire, distribute, and process data in close to real time. It is not surprising, therefore, that in this new world of abundant digital resources, the minds of city managers, corporations, and even individuals have turned to ways in which the city might be made ‘smarter’. In short, a ‘smart city’ might be defined as a city that exploits digital technology in the interests of improving its operation and management, and addressing the problems that afflict the modern city. In turn, the drive toward a smart city may itself be helping to stimulate the adoption of ever more computers, communication networks, and sensors.
What role might geographic information science and systems (GIS) play in this effort to ‘smarten’ the city? Cities are complex agglomerations of houses and buildings, streets and roads, parks, neighborhoods, shopping centers, and industrial plants. Cities benefit from short distances between their various parts, even in instances such as Los Angeles with its seemingly endless sprawl. What happens at one location in a city is related to what happens in nearby areas and also to other attributes of that location. Location, land-use patterns, distances, and interactions are core concepts of a geospatial approach, suggesting that GIS is essential to city management and the ideas of a smart city. In proposing and announcing this Special Section, we are convinced that GIS, operating in or close to real time, is an essential element of any comprehensive approach to the smart city. The remainder of this editorial reviews the state of the art in five dimensions of real-time GIS. It is followed by four research papers on various topics within this broad umbrella.
A real-time paradigm for a GIS-enabled smart city
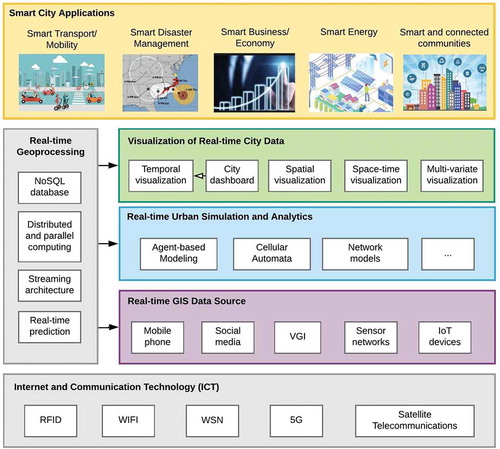
illustrates a paradigm for the smart city enabled by real-time GIS, which is an emerging platform that is designed for the acquisition, storage, analysis, and visualization of geospatial data in real time. Different from traditional GIS platforms, real-time GIS emphasizes the provision of high throughput and high-speed processing of GIS data streams. These streams are location-sensitive, of high temporal granularity, and are being generated continuously from sensing devices that collectively comprise the Internet of Things (IoT). Below we provide an overview of the progress of each key dimension of a real-time GIS in the context of smart cities.
Figure 1. A smart city enabled by real-time GIS.
Information and communication technologies (ICT)
ICT is the backbone technology that allows data collected from smart-city devices, such as smart-house devices and mobile phones, to be efficiently transferred back to a data center and easily shared and exchanged among connected devices (Hashem et al. Citation2016). For instance, RFID (radio-frequency identification) is a technology used for the identification and localization of a moving object based on electromagnetic fields. An RFID tag can be embedded into virtually any object, ranging from industrial goods to animals to human beings, for both outdoor and indoor tracking purposes. RFID finds many applications in smart cities, such as in real-time waste management (Chowdhury and Chowdhury Citation2007), smart parking (Tsiropoulou et al. Citation2017) and transportation collision detection and avoidance (Fahmy et al. Citation2019).
WiFi is a short-range wireless technology used to provide end users with high-speed remote access to the Internet. Compared to the standard cable networks, a wireless communications network empowered by Wifi provides better flexibility and mobility for smart-city users. Soundararaj et al. (Citationin press) describe an interesting use of Wifi ‘probe requests’ to understand levels of pedestrian activity in retail centers across Great Britain. Wifi probe requests are generated from mobile devices when in the presence of a Wifi access point (AP), such as a wireless router. The location information of a mobile device can be obtained through triangulation by multiple APs. In dense urban environments where there is Wifi coverage almost everywhere, this probe for requesting data becomes a valuable source for collecting real-time consumer data, such as the duration of a visit to a retail store, or a count of pedestrians in crowds that flock around various facilities. Many smart business applications can benefit from such low-cost, high-availability techniques, such as evaluation of business rates on properties or estimating unit rental values (Golderzahi and Pao Citation2018, Sahni et al. Citation2018). Wifi-based real-time indoor positioning technology can also be used in other smart-city applications, such as mapping urban population (Kontokosta and Johnson Citation2017), human movement analytics (Zhang et al. Citation2016), and automatic control of smart-home devices (Guo et al. Citation2018).
A wireless sensor network (WSN) is the building block of the Internet of Things (IoT) and has become widely deployed in cities to sense and collect data from the environment such as temperature, humidity, and air-pollution levels. Sensors can also be attached to mobile agents, such as patients or drivers, to monitor their physical condition in real time. A WSN has the advantages of low cost and low energy consumption, and is easily deployed and scaled (Rawat et al. Citation2014). To ensure the scalability of the network, dynamic routing schemes are needed to ensure efficient transfer of data among the sensor nodes (Prabhu et al. Citation2013). WSN technology is often integrated with RFID and GPS (the Global Positioning System) to provide concurrent sensing, locating, and object identification (Adame et al. Citation2018).
Two challenges for WSN are (1) signal weakening due to noise and obstacles in the urban environment and (2) a bottleneck in communication bandwidth between the sensor nodes and the gateway nodes (Rashid and Rehmani Citation2016). 5G, the next generation of wireless technology, offers new opportunities to overcome these problems. 5G provides a platform that has the capability of connecting over 100 billion devices and achieving a bandwidth at 10 Gbps (gigabits per second) with a low latency (Hashem et al. Citation2016). Other advanced technologies include satellite telecommunication, Zigbee, and Bluetooth. They all contribute to reliable and rapid data exchange and the acquisition of real-time city data.
Real-time geospatial data in cities
Cities are producing many kinds of real-time geospatial data. Traffic-flow data were among the first to be automatically collected by digital devices (Batty et al. Citation2012). In recent years, traffic congestion and traffic-correlated pollution has become a severe problem not only causing significant economic losses but also negatively affecting the quality of life of city residents. Therefore, building an intelligent traffic management system becomes essential to increase the efficiency and safety of urban transportation. Sensing technology and WSN have been found to be of tremendous value in monitoring real-time traffic in this area. Kafi et al. (Citation2012) described the use of sensors mounted on road lampposts, under pavements, and on vehicles to gather the location, speed, and moving directions of vehicles as well as weather and other traffic-flow conditions. These data are then aggregated to dynamically control traffic lights at intersections for the smooth flow of vehicles and to reduce average waiting time. To alleviate traffic congestion and provide in-time vehicle routing, Sivanandam et al. (Citation2012) have developed an Advanced Traveler Information System (ATIS) to collect real-time travel data by positioning GPS devices on city buses and installing video cameras on heavy-traffic roads. Park et al. (Citationin press) used similar real-time vehicle location data in combination with fine-resolution public transit schedules to assess the performance of public transit.
Real-time traffic data is a form of big data that captures human movements to provide a better understanding of human mobility (Gonzalez et al. Citation2008), spatial-social structures (Deville et al. Citation2016), and hidden patterns within human trajectories and daily activities (Bazzani et al. Citation2011). Early human-mobility research relied heavily on Population and other Census data, which is expensive to collect, infrequently updated, and limited in amount and coverage (Zhou et al. Citation2018). Recently, crowdsourcing, which generates locational data continuously from ubiquitous mobile devices such as smart phones, has yielded massive amounts of mobility data at unprecedented spatial and temporal scales (Stojanovic et al. Citation2016). Typical spatiotemporal human mobility data sources include Call-Detail Records (CDR), Wifi AP Records, GPS traces, geotagged social media, and smart-card records from public transit. CDR captures the communication between mobile phone and nearby cellular towers; compared to other sources, it is massive because of the large number of mobile phone users, but sparse in time because a record is only generated when there is an active use of the phone. GPS, on the other hand, provides more accurate positioning and better temporal continuity for moving agents. In recent years, GPS on board public vehicles, such as taxis and share-ride bikes, enables the collection of GPS traces for quantifying activity-based human mobility (Hu et al. Citation2014), generating origin-destination matrices (Ge and Fukuda Citation2016), and delineating urban functional zones, among many other urban applications (Zhang et al. Citation2018). Smart-card data provide another measure of urban mobility by recording the time and station at which a passenger enters and exits a public transportation service. These data often have a fine temporal resolution. To give an example, London’s Oyster card system generates 9 million transactions daily for train usage alone (Zhong et al. Citation2016), that is, over 100 transactions per second. These real-time data allow urban analytics across multiple temporal scales (Batty et al. Citation2012) thus enabling a new research paradigm that can barely be achieved using traditional data.
The broad coverage of CDR, GPS traces, and smart-card data enables city-scale human mobility research. However, these sources cannot serve the purpose of building-level movement analysis. Wifi AP records obtained through probe requests, in comparison, would address this limitation. The work by Soundararaj et al. (this issue) used such data to promote smart business. Although these data contain rich location and time stamps, they lack information on social perception, such as the opinions and emotional reactions of urban citizens (Doran et al. Citation2016). However, online social media provide a platform to allow opinion sharing as well as social interactions of people in a digital world.
VGI (volunteered geographic information) (Goodchild Citation2007) relies on ‘citizen sensors’ to create geographic information voluntarily, and allows them to make use of their own local knowledge. VGI data are extremely helpful in mapping time-critical events, such as disasters, at a very fine level of detail and immediacy (Brynielsson et al. Citation2018). Subasinghe et al. (Citationin press) describe a scenario of using simulated citizen update streams to create event maps for the 2018 Montecito Creek mudslide in California. Their results show that the accuracy of the mapped events is heavily dependent on the rate of public participation; the greater the public participation, the more accurate the event map. Besides disaster mapping, VGI is a valuable source for providing a timely update on traffic congestion, road hazards, outbreaks of infectious diseases, and other unusual situations that might threaten a city and its operations (Sui et al. Citation2012).
These data, collected by means of both physical and social sensing, together with modern remote-sensing technologies, define what are being increasingly called the “digital twin” of a city and are thus essential ingredients to making a city smart (Batty Citation2018b).
Real-time urban simulation
Once data are acquired or made available by streaming, it is important to make sense of them, and to analyze and interpret them in the interests of advancing human knowledge and making cities smarter. The continuous flow of real-time city data requires that traditional urban simulation models be renovated towards more accurate, cross-scale, and in-time predictions. Cities are complex systems which involve interconnected spatial, social, economic, and physical processes of dynamic temporal change, and the way they function is continually being modified by human actions and the extensive use of information technology. Agent-based modeling (ABM), cellular automata (CA), microsimulation, and network models are popular techniques to simulate urban dynamics from the perspective of complex systems science (Batty Citation2007, Lomax and Smith Citation2017, Sengupta Citation2017).
ABM is a computational model to simulate individualized, behavioral entities – the agents – in an attempt to reveal overall system behavior and to make predictions about the patterns and evolution of complex phenomena (Clarke Citation2018). Heuristic rules are defined to guide and bound an agent’s behavior and how it will respond to the environment and interact with other agents. ABM has been widely applied to model consumer behavior (Gaud et al. Citation2008), urban transport (Waddell Citation2002), emergency evacuation (Chen and Zhan Citation2008), and infectious disease transmission (Parker and Epstein Citation2011). Subasinghe et al. (Citationin press) developed a Citizen Disaster Reaction Multi-Agent Simulation (CDR-MAS) model to investigate the role of citizen-update streams in providing a first-hand, accurate, and real-time mapping of natural disasters. The agents in this model have different social profiles (age, movement speed, health level, etc.) and can take different actions, to shelter (stay put) or to escape (move), in the presence of a natural disaster. A status update, such as ‘risk’ or ‘hazard,’ is continuously reported by the agent. The citizen update streams containing the agent’s location, time of report, and status information are clustered to map the disaster region and risk level in real time. Simulations were performed based on different citizen participation and movement scenarios. Results show that (1) the mapped event region will be larger as more agents choose to move away from the disaster, and (2) increased public participation and a well-designed model will lead to a significant increase in the accuracy of event prediction in real time.
CA (cellular automata) can be regarded as a particular form of ABM in which key agents – the cells – remain fixed but a change in state from time period to time period. However, CA differs from ABM in its modeling process. In ABM, agents can move in space and interact with each other, while in a CA, the modeling entities are static grid cells partitioning a region. What is changing is their status as processes move across or over them. This characteristic of CA makes it more suitable for modeling dissipative processes such as land-use change or urban expansion (Clarke Citation2018). Simulations of CA start from an initial condition which provides the state of each cell in the system, and the change of the cells is triggered by the state of neighborhood cells, or when its property value reaches some predefined threshold. Esser and Schreckenberg (Citation1997) developed a CA-based traffic simulation tool to model urban traffic dynamics. Real-time traffic data, such as turn counts at intersections, are integrated with road network data to perform the simulation. Li et al. (Citation2015) developed a real-time flood simulation system using CA. Real-time observation data are utilized in the modeling process to provide reliable estimates of flood parameters.
Similar to ABM and CA, microsimulation is also an individual-based approach to emulating population dynamics and urban processes at a disaggregated level (Ballas et al. Citation1999). The micro-data at an individual or household level is an important input for urban simulation models such as UrbanSim (Waddell Citation2002) and MATSim (Bae et al. Citation2016). However, due to privacy concerns and the high cost of collecting census data, such micro-data is often not available (Müller and Axhausen Citation2010). Small-area estimation of micro-data from multi-source information becomes the goal of microsimulation. In general, microsimulation models fall into two classes: static and dynamic. Static microsimulation uses statistical techniques, such as iterative proportional fitting, to estimate attribute values at a finer detail, for example, from age group to single year of age at a micro-unit level (Lomax and Smith Citation2017). Dynamic microsimulation introduces time into the modeling process. By taking a base dataset as input and applying a rate of change (e.g. birth or mortality rates), dynamic microsimulation offers projections of the same characteristics at a future time. Because microsimulation maintains fewer states and interdependencies than macrosimulation models, it can more easily achieve near real-time simulation by leveraging the massive computing power available today. Compared to ABM, which emphasizes interactions and feedback among individuals, microsimulation models individual behavior utilizing richly detailed data. In recent years, the trend has been to integrate microsimulation into agent-based models to simulate urban land use, transportation, and micro-level population dynamics (Bae et al. Citation2016, Batty Citation2016).
Network modeling is another approach which encapsulates the complexity of a city (Sengupta Citation2017). Formally different from CA or ABM in that the focus is usually on relationships between spatial objects, network models define elements and their relationships using network graphs. Nodes in a graph represent an entity such as a transit stop, and the edges connecting two nodes represent the strength of the connection, such as the distance or cost between two consecutive stops on a transit route. Park et al. (this issue) apply this modeling principle to develop a transit-delay propagation network to uncover transit delay patterns in Columbus, Ohio. The scheduled arrival time and the actual arrival time collected in real-time are compared. Measures such as transit route-based network length, total propagating delay time, and distance decay are developed to analyze stop-specific cascaded delays in the transit network. This network-based analysis helps to identify critical stops at which delays are initiated or propagated. The temporal variation of the delay patterns is also illustrated. The authors anticipate that by combining this with more real-time data such as traffic conditions, the driving factors of the transit delay can be further revealed.
Real-time visualization of city-data
Visualization is an important means to convey the urban design to planners, stakeholders, and decision-makers (Goodchild Citation2010, Hudson-Smith and Batty Citation2014). It has been increasingly used in smart-city projects to perform real-time monitoring of critical city infrastructure (e.g. the power and water systems), and by government agencies to communicate open government data with the general public, to promote cities, and to increase transparency (Mellouli et al. Citation2014). In addition, visualization is a key to scientific discovery; by providing an effective and intuitive way of visualizing big, sometimes chaotic data, the complex, hidden patterns underlying a phenomenon or process can be visually inspected (Li and Wang Citation2017).
Here we focus our overview of data visualization techniques on the data collected in real-time from IoT sensors within the city. According to the sensor type used in data collection (mobile or fixed sensors), these data can be placed into two general classes: (1) trajectory data in which both the location and attributes of an object change over time, and (2) temporal data collected at fixed locations. In the latter case, only time-stamp and value changes for an observation. Compared to traditional data sources, these data are often unstructured or semi-structured, containing multiple variables for each observation, and are continuously streamed from a remote sensor. To capture the multi-faceted nature of the data, the visualization can correspondingly focus on different aspects: temporal, spatial, spatio-temporal, and multi-variate (Chen et al. Citation2015).
The dashboard is becoming a popular smart-city technology for providing dynamic and graphic-based visualization to present critical real-time city data in a single view (Rivard and Cogswell Citation2004). Although many dashboard projects have been launched, such as the London city dashboard (http://citydashboard.org/london/), Boston dashboard (https://www.cityofboston.gov/mayorsdashboard/), and Toronto transit dashboard (http://totransit.ca), little research has described the real-time visualization challenges in this area. Stehle and Kitchin’s work (Citationin press) opens up this discussion by providing a systematic evaluation of strategies used in visualizing real-time spatial data in a dashboard. The authors identify two key challenges – change blindness and variability in time and space – and propose strategies to overcome them. Specifically, change blindness occurs when rapid changes occur simultaneously in multiple components in a city dashboard, which makes the visual detection of change difficult. It can also occur when old values are replaced by new ones and users then lose the view of the old values as an important reference or benchmark. Solutions to overcome this issue include allowing manual change of timescale for more controlled data display, providing indicators during the refreshing of the display so users can anticipate the change, and synchronization of different time zones.
A second challenge lies in the detection of temporal patterns. The authors argue here that real-time data are less interpretable without comparisons with historical trends. Hence, visual analytics of archived data, either within a single observation site or across different sites, is important for dashboard visualization. Although multiple methods have been developed for temporal visualization, such as a radial layout (Pu et al. Citation2013), a line chart representing linear time (Ferreira et al. Citation2013), and storylines (Ogawa and Ma Citation2010), they may not all be suitable in a city dashboard environment because of the complexity of information presentation in these methods. Hence, it is vital to consider user interest and needs in future dashboard design.
With the above dashboard visualization centered on temporal visualization, the presentation of spatial information (location of sensors, for example) is through a simple rendering of dot locations on the map. This approach is advantageous because it provides exact location information for each object; however, when the amount of data becomes large, the map will become very cluttered. This dot-based spatial visualization capability also needs to be extended when dealing with data on movement in real time, for example, taxi trajectories. Line-based and region-based map visualizations will compensate for this limitation (Chen et al. Citation2015). Line-based visualization is suitable for presenting flow or trajectory information over a large region on a map. To overcome the complexity of the data, the trajectories can be clustered, or further mined, or transformed from the geographic space to an abstract space to allow different patterns to appear. For instance, Crnovrsanin et al. (Citation2009) used a 2D line chart to display location and time information simultaneously. The x-axis refers to the temporal dimension, and the y-axis displays the attribute value at some location. Locations on the chart are placed according to their proximity. This transformation not only helps reveal different patterns, such as spatial concentration, trends, and fluctuation, but it also helps to integrate temporal information into spatial visualization. Region-based techniques are another form of spatial visualization method in which information is aggregated into different regions for better exposure of macro patterns in the data.
In addition to decoupled spatial and temporal visualization, researchers have also dealt with spatio-temporal visualization. The space-time cube is a common technique to present movement data in a 3D space, in which the two horizontal dimensions are latitude and longitude and the vertical dimension is time (Kraak Citation2003). Space-time visualization may encounter multivariate data; for example, a mobile sensor may collect data about temperature, humidity, and air pollution. In this case, additional multivariate visualization techniques, such as the parallel coordinate plot (PCP; Wang et al. Citation2014) need to be integrated to allow visual reasoning about the multiple attributes associated with an object.
Real-time GIS processing
Urban data are typical of big data, and their huge volume makes it impossible to perform analysis on a single computer due to limited memory and computing capability. A popular solution is to scale out the system by connecting multiple distributed computers through a high-speed communication network to form what is known as a cloud-computing platform (Botta et al. Citation2016). Then, by performing a task or partitioning data using MapReduce (Dean and Ghemawat Citation2008) or the Hadoop software (Shvachko et al. Citation2010), tranches of big data can be distributed onto different compute nodes. Analytical tasks can also be decomposed into smaller jobs run on these nodes in parallel, to speed up the overall geoprocessing. The Hadoop system stores big data in a large-distributed file; its parallel computation involves substantial data exchange between memory and the hard-drive for data loading from the distributed file system, causing negative performance impact. To address this issue, Apache Spark (Zaharia et al. Citation2016) introduces strategies of in-memory computing, which makes batch processing more efficient than Hadoop.
However, to achieve real-time visualization and urban analytics, a GIS must go beyond traditional big-data analytics in which data size is the main concern and batch processing is the key. Instead, a real-time GIS needs to have both high throughput and low latency in receiving, storing, and handling streaming data that arrive in real-time. Throughput addresses the ‘velocity’ and ‘volume’ challenges of real-time big data. A system that has high throughput will be capable of handling voluminous data at a very high speed. Latency is a measure for the timeliness of geoprocessing. A low-latency GIS requires spatial queries or analytics to be conducted and the results to be returned within a very short period of time. Thus, NoSQL (Non-relational) database and streaming architecture has emerged as the cutting edge in real-time geoprocessing.
Traditional relational databases, such as PostGreSQL, face significant scalability challenges when querying massive geospatial datasets, especially semi- or un-structured data from IoT devices or social media sites. JSON (JavaScript Object Notation), which has a key-value structure, has been adopted for achieving light-weight data exchange and transfer (Ngu et al. Citation2016). Real-time storage of big streaming data can be achieved by combining with NoSQL databases, which provide support for a key-value structure, scale easily to a cluster and cloud-based storage, and support fast queries on non-relational data.
Above real-time storage lies the streaming architecture to provide real-time streaming data processing. Lambda architecture (Marz and Warren Citation2015) is a novel solution which provides scalable, fault-tolerant, low-latency reads, update, and analytics of real-time big data. This architecture is comprised of three layers: the batch layer, the speed layer, and the serving layer. The batch layer stores and processes massive historical data using batch processing. The batch layer may have high latency in updating results, but it is executed less frequently and can process massive archived data. The Hadoop or Map Reduce models (see above) can be used in this layer for data processing. The speed layer, also known as the stream layer, deals only with the new data and uses stream processing such as Spark streaming (Zaharia et al. Citation2012) or Storm (Cardellini et al. Citation2016) to process the data in real time. The serving layer will combine results from the batch layer, which provides a context for the analytics using more data, and the speed layer, which provides a real-time view of the most recent data, to generate a robust result with a low latency. This streaming architecture has been implemented in smart-city projects to support real-time forecasting of energy demand (Strohbach et al. Citation2015), intelligent urban data monitoring (Panagiotou et al. Citation2016), and detection of anomalies such as crime (Chen et al. Citation2017), among others.
Another exciting prospect of the multi-layer Lambda architecture is its integration with machine learning (ML) and spatiotemporal data mining to increase smartness, in addition to real-time responsiveness in urban analytics. In a supervised learning paradigm, for example, the time-consuming model training step can be executed in the batch layer, and then the well-trained model can be loaded into the speed layer for real-time or near real-time prediction on the upcoming data. In a broader sense, future smart cities will be increasingly powered by artificial intelligence (AI) and real-time processing for automation and better provision of city services (Batty Citation2018c), as well as enhanced city governance, equity, and sustainability (Allam and Dhunny Citation2019).
Concluding remarks
As we noted at the outset, real-time GIS for smart cities has become an enormous topic, and this Special Section has explored only the tip of the topic’s iceberg. The Section has certainly raised far more questions than it has answered, and we hope it will stimulate the reader to develop his or her own research program in this area. The city of the future will certainly be very different from the city of today, and none of us can fully anticipate the changes that are coming. We know that connected and autonomous vehicles will present many opportunities for real-time GIS; that major changes are underway in our systems of retailing because of the shift to online services; that economic markets of many kinds are being transformed by new digital technologies; and that climate change will impact many aspects of urban life, especially in parts of the world where supplies of food, energy, and water are already approaching critical levels. A changing global demography as well as rapid advances in health care will dominate our future and all these will create endless opportunities for specialists in GIS.
Additional information
Funding
References
- Adame, T., et al., 2018. CUIDATS: an RFID–WSN hybrid monitoring system for smart health care environments. Future Generation Computer Systems, 78 (2), 602–615. doi:10.1016/j.future.2016.12.023.
- Allam, Z. and Dhunny, Z.A., 2019. On big data, artificial intelligence and smart cities. Cities, 89 (2019), 80–91. doi:10.1016/j.cities.2019.01.032.
- Bae, J.W., et al., 2016. Combining microsimulation and agent-based model for micro-level population dynamics. Procedia Computer Science, 80 (2016), 507–517. doi:10.1016/j.procs.2016.05.331.
- Ballas, D., Clarke, G., and Turton, I. 1999, July. Exploring microsimulation methodologies for the estimation of household attributes. In: J. Diaz, Ed. In: 4th International Conference on GeoComputation, Mary Washington College. Virginia, USA: GeoComputation CD-ROM.
- Batty, M., 2007. Cities and complexity: understanding cities with cellular automata, agent-based models, and fractals. Cambridge, MA: The MIT Press, 565.
- Batty, M., 2016. Classifying urban models. Environment and Planning B: Planning and Design, 43 (2), 251–256. doi:10.1177/0265813516630803.
- Batty, M., 2018a. Inventing future cities. Cambridge, MA: The MIT Press, 282.
- Batty, M., 2018b. Digital twins. Environment and Planning B: Urban Analytics and City Science, 45 (5), 817–820. doi:10.1177/2399808318796416.
- Batty, M., 2018c. Artificial intelligence and smart cities. Environment and Planning B: Urban Analytics and City Science, 45 (1), 3–6. doi:10.1177/2399808317751169.
- Batty, M., et al., 2012. Smart cities of the future. The European Physical Journal Special Topics, 214 (1), 481–518. doi:10.1140/epjst/e2012-01703-3.
- Bazzani, A., et al. 2011, May. Now casting of traffic state by GPS data. The metropolitan area of Rome. In: 2011 Proceedings of the 34th International Convention MIPRO. Opatija, Croatia: IEEE, 1615–1618.
- Botta, A., et al., 2016. Integration of cloud computing and internet of things: a survey. Future Generation Computer Systems, 56 (2016), 684–700. doi:10.1016/j.future.2015.09.021.
- Brynielsson, J., et al., 2018. Informing crisis alerts using social media: best practices and proof of concept. Journal of Contingencies and Crisis Management, 26 (1), 28–40. doi:10.1111/jccm.2018.26.issue-1.
- Cardellini, V., Nardelli, M., and Luzi, D. 2016, July. Elastic stateful stream processing in storm. In: 2016 International Conference on High Performance Computing & Simulation (HPCS). IEEE, 583–590. doi:10.1177/1753193415600670.
- Chen, N., et al., 2017. Smart city surveillance in fog computing. In: C. X. Mavromoustakis, G. Mastorakis and C. Dobre, eds. Advances in mobile cloud computing and big data in the 5G era. Cham: Springer, 203–226.
- Chen, W., Guo, F., and Wang, F.Y., 2015. A survey of traffic data visualization. IEEE Transactions on Intelligent Transportation Systems, 16 (6), 2970–2984. doi:10.1109/TITS.2015.2436897.
- Chen, X. and Zhan, F.B., 2008. Agent-based modelling and simulation of urban evacuation: relative effectiveness of simultaneous and staged evacuation strategies. Journal of the Operational Research Society, 59 (1), 25–33. doi:10.1057/palgrave.jors.2602321.
- Chowdhury, B. and Chowdhury, M.U. 2007. RFID-based real-time smart waste management system. In: 2007 Australasian Telecommunication Networks and Applications Conference. doi:10.1109/atnac.2007.4665232.
- Clarke, K.C., 2018. Cellular automata and agent-based models. In: M.M. Fisher and P. Nijkamp, eds. Handbook of regional science. Berlin, Heidelberg: Springer, 1–16. doi:10.1007/978-3-642-36203-3_63-1.
- Crnovrsanin, T., et al. 2009, October. Proximity-based visualization of movement trace data. In: 2009 IEEE Symposium on Visual Analytics Science and Technology. IEEE, 11–18. doi: 10.1007/s10877-008-9158-4.
- Dean, J. and Ghemawat, S., 2008. MapReduce: simplified data processing on large clusters. Communications of the ACM, 51 (1), 107–113. doi:10.1145/1327452.
- Deville, P., et al., 2016. Scaling identity connects human mobility and social interactions. Proceedings of the National Academy of Sciences, 113 (26), 7047–7052. doi:10.1073/pnas.1525443113.
- Doran, D., et al., 2016. Social media enabled human sensing for smart cities. AI Communications, 29 (1), 57–75. doi:10.3233/AIC-150683.
- Esser, J. and Schreckenberg, M., 1997. Microscopic simulation of urban traffic based on cellular automata. International Journal of Modern Physics C, 08 (05), 1025–1036. doi:10.1142/S0129183197000904.
- Fahmy, A., et al. 2019, March. Role of RFID technology in smart city applications. In: 2019 International Conference on Communications, Signal Processing, and their Applications (ICCSPA). Sharjah, United Arab Emirates: IEEE, 1–6.
- Ferreira, N., et al., 2013. Visual exploration of big spatio-temporal urban data: A study of new york city taxi trips. IEEE Transactions on Visualization and Computer Graphics, 19 (12), 2149–2158. doi:10.1109/TVCG.2013.226.
- Gaud, N., et al., 2008. Holonic multilevel simulation of complex systems: application to real-time pedestrians simulation in virtual urban environment. Simulation Modelling Practice and Theory, 16 (10), 1659–1676. doi:10.1016/j.simpat.2008.08.015.
- Ge, Q. and Fukuda, D., 2016. Updating origin–destination matrices with aggregated data of GPS traces. Transportation Research Part C: Emerging Technologies, 69 (2016), 291–312. doi:10.1016/j.trc.2016.06.002.
- Golderzahi, V. and Pao, H.K. 2018, July. Understanding customers and their grouping via WiFi sensing for business revenue forecasting. In: International Conference on Machine Learning and Data Mining in Pattern Recognition. Cham: Springer, 56–71.
- Gonzalez, M.C., Hidalgo, C.A., and Barabasi, A.L., 2008. Understanding individual human mobility patterns. Nature, 453 (7196), 779. doi:10.1038/nature06958.
- Goodchild, M.F., 2007. Citizens as sensors: the world of volunteered geography. GeoJournal, 69 (4), 211–221. doi:10.1007/s10708-007-9111-y.
- Goodchild, M.F., 2010. Towards geodesign: repurposing cartography and GIS? Cartographic Perspectives, 66 (2010), 7–22. doi:10.14714/CP66.93.
- Guo, L., et al., 2018. HuAc: human activity recognition using crowdsourced WiFi signals and skeleton data. Wireless Communications and Mobile Computing, ID 6163475, 1–15. doi:10.1155/2018/6163475
- Hashem, I.A.T., et al., 2016. The role of big data in smart city. International Journal of Information Management, 36 (5), 748–758. doi:10.1016/j.ijinfomgt.2016.05.002.
- Hu, X., An, S., and Wang, J., 2014. Exploring urban taxi drivers’ activity distribution based on GPS data. Mathematical Problems in Engineering, 2 (2014), 1–13.
- Hudson-Smith, A. and Batty, M., 2014. Visual analytics for urban design. Urban Design, 132 (2014), 38–41.
- Kafi, M.A., et al., 2012. A study of wireless sensor network architectures and projects for traffic light monitoring. Procedia Computer Science, 10, 543–552. doi:10.1016/j.procs.2012.06.069
- Kontokosta, C.E. and Johnson, N., 2017. Urban phenology: toward a real-time census of the city using Wi-Fi data. Computers, Environment and Urban Systems, 64, 144–153. doi:10.1016/j.compenvurbsys.2017.01.011
- Kraak, M.J. 2003, August. The space-time cube revisited from a geovisualization perspective. In: Proc. 21st International Cartographic Conference: Cartographic Renaissance, Durban, South Africa. 1988–1996.
- Li, W. and Wang, S., 2017. PolarGlobe: A web-wide virtual globe system for visualizing multidimensional, time-varying, big climate data. International Journal of Geographical Information Science, 31 (8), 1562–1582. doi:10.1080/13658816.2017.1306863.
- Li, Y., et al., 2015. Real-time flood simulations using CA model driven by dynamic observation data. International Journal of Geographical Information Science, 29 (4), 523–535. doi:10.1080/13658816.2014.977292.
- Lomax, N. and Smith, A.P., 2017. Microsimulation for demography. Australian Population Studies, 1 (1), 73–85.
- Marz, N. and Warren, J., 2015. Big data: principles and best practices of scalable real-time data systems. New York: Manning Publications Co., Shelter Island, NY, 301.
- Mellouli, S., Luna-Reyes, L.F., and Zhang, J., 2014. Smart government, citizen participation and open data. Information Polity, 19 (1,2), 1–4. doi:10.3233/IP-140334.
- Müller, K. and Axhausen, K.W., 2010. Population synthesis for microsimulation: state of the art. Arbeitsberichte Verkehrs-und Raumplanung, 638 (2010), 1–11.
- Ngu, A.H., et al., 2016. IoT middleware: A survey on issues and enabling technologies. IEEE Internet of Things Journal, 4 (1), 1–20. doi:10.1109/JIOT.2016.2615180.
- Ogawa, M. and Ma, K.L. 2010, October. Software evolution storylines. In: Proceedings of the 5th International Symposium on Software Visualization. Salt Lake City, UT: ACM, 35–42.
- Panagiotou, N., et al. 2016, September. Intelligent urban data monitoring for smart cities. In: Joint European conference on machine learning and knowledge discovery in databases. Cham: Springer, 177–192. doi:10.1177/1753193415610529.
- Park, Y., et al., in press. Assessing public transit performance using real-time data: spatiotemporal patterns of bus operation delays in Columbus, Ohio, USA. International Journal of Geographical Information Science.
- Parker, J. and Epstein, J.M., 2011. A distributed platform for global-scale agent-based models of disease transmission. ACM Transactions on Modeling and Computer Simulation (TOMACS), 22 (1), 2. doi:10.1145/2043635.2043637.
- Prabhu, S.B., et al., 2013. Mobility assisted dynamic routing for mobile wireless sensor networks. International Journal of Advanced Information Technology, 3 (1), 9. doi:10.5121/ijait.2013.3102.
- Pu, J., et al. 2013, June. T-Watcher: A new visual analytic system for effective traffic surveillance. In: 2013 IEEE 14th International Conference on Mobile Data Management (Vol. 1). Milan, Italy: IEEE, 127–136.
- Rashid, B. and Rehmani, M.H., 2016. Applications of wireless sensor networks for urban areas: A survey. Journal of Network and Computer Applications, 60, 192–219. doi:10.1016/j.jnca.2015.09.008
- Rawat, P., et al., 2014. Wireless sensor networks: a survey on recent developments and potential synergies. The Journal of Supercomputing, 68 (1), 1–48. doi:10.1007/s11227-013-1021-9.
- Rivard, K. and Cogswell, D., 2004. Are you drowning in bi reports? using analytical dashboards to cut through the clutter. Information Management, 14 (4), 26.
- Sahni, Y., Cao, J., and Shen, J., 2018. Challenges and opportunities in designing smart spaces. In: B. Di Martino, K.C. Li, L. T. Yang and A. Esposito, eds. Internet of everything. Singapore: Springer, 131–152.
- Sengupta, U., 2017. Complexity Science: the urban is a complex adaptive system. In: defining the Urban. Routledge. In: D. Iossifova and C.D. Gasparato, eds. Defining the urban: interdisciplinary and professional perspectives. London: Routledge, 249–265.
- Shvachko, K., et al., 2010, May. The hadoop distributed file system. In: A. Amer and S. Coleman, eds. MSST (Vol. 10). Incline Village: Nevada, 1–10.
- Sivanandam, R., et al. 2012. Advanced Traveller Information System (ATIS) for Indian cities. Available from: https://coeut.iitm.ac.in/umcsp/pdfweb/v2iitm_ATIS%20For%20indian%20cities_v2.pdf
- Soundararaj, B., Cheshire, J., and Longley, P., in press. Estimating real-time high-street footfall from Wi-Fi probe requests. International Journal of Geographical Information Science.
- Stehle, S. and Kitchin, R., in press. Real-time and archival data visualisation techniques in city dashboards. International Journal of Geographical Information Science.
- Stojanovic, D., Predic, B., and Stojanovic, N. 2016. Mobile crowd sensing for smart urban mobility. In: Capineri, C., Haklay, M., Huang, H., Antoniou, V., Kettunen, J., Ostermann, F., and Purves, R., (Eds). European Handbook of Crowdsourced Geographic Information. London: Ubiquity Press, 371–382.
- Strohbach, M., et al., 2015. Towards a big data analytics framework for IoT and smart city applications. In: F. Xhafa, L. Barolli, A. Barolli and P. Papajorgji, eds. Modeling and processing for next-generation big-data technologies. Cham: Springer, 257–282.
- Subasinghe, I. et al., in press. Real-time mapping of natural disasters using citizen update streams. International Journal of Geographical Information Science, 1–29.
- Sui, D., Elwood, S., and Goodchild, M., Eds., 2012. Crowdsourcing geographic knowledge: volunteered geographic information (VGI) in theory and practice. Dordrecht, The Netherlands: Springer Science & Business Media.
- Tsiropoulou, E.E., et al., 2017. RFID-based smart parking management system. Cyber-Physical Systems, 3 (1–4), 22–41. doi:10.1080/23335777.2017.1358765.
- Waddell, P., 2002. UrbanSim: modeling urban development for land use, transportation, and environmental planning. Journal of the American Planning Association, 68 (3), 297–314. doi:10.1080/01944360208976274.
- Wang, F., et al. (2014, October). A visual reasoning approach for data-driven transport assessment on urban roads. In: 2014 IEEE Conference on Visual Analytics Science and Technology (VAST). IEEE, 103–112. doi:10.3389/fchem.2014.00103.
- Zaharia, M., et al. (2012, June). Discretized streams: an efficient and fault-tolerant model for stream processing on large clusters. In: Proceedings of the 4th USENIX conference on Hot Topics in Cloud Computing. Boston, MA: USENIX Association, 10.
- Zaharia, M., et al., 2016. Apache spark: a unified engine for big data processing. Communications of the ACM, 59 (11), 56–65. doi:10.1145/2934664.
- Zhang, J., et al. 2016, May. Wifi-id: human identification using wifi signal. In: 2016 International Conference on Distributed Computing in Sensor Systems (DCOSS). Washington, DC: IEEE, 75–82.
- Zhang, X., et al., 2018. Identifying urban functional zones using public bicycle rental records and point-of-interest data. ISPRS International Journal of Geo-Information, 7 (12), 459. doi:10.3390/ijgi7120459.
- Zhong, C., et al., 2016. Variability in regularity: mining temporal mobility patterns in London, Singapore and Beijing using smart-card data. PloS One, 11 (2), e0149222. doi:10.1371/journal.pone.0149222.
- Zhou, Y., et al., 2018. Understanding urban human mobility through crowdsensed data. IEEE Communications Magazine, 56 (11), 52–59. doi:10.1109/MCOM.2018.1700569.