
Abstract
Identifying users’ place of residence is an important step in many social media analysis workflows. Various techniques for detecting home locations from social media data have been proposed, but their reliability has rarely been validated using ground truth data. In this article, we compared commonly used spatial and Spatio-temporal methods to determine social media users’ country of residence. We applied diverse methods to a global data set of publicly shared geo-located Instagram posts from visitors to the Kruger National Park in South Africa. We evaluated the performance of each method using both individual-level expert assessment for a sample of users and aggregate-level official visitor statistics. Based on the individual-level assessment, a simple Spatio-temporal approach was the best-performed for detecting the country of residence. Results show why aggregate-level official statistics are not the best indicators for evaluating method performance. We also show how social media usage, such as the number of countries visited and posting activity over time, affect the performance of methods. In addition to a methodological contribution, this work contributes to the discussion about spatial and temporal biases in mobile big data.
Introduction
Social media data, among other mobile big data, have become widely used for geographic knowledge discovery in the social sciences (Kitchin Citation2014, Kitchin and McArdle Citation2016, Silm et al. Citation2020). Social media refer to web-based services that allow users to interact and share content online (McCay-Peet and Quan-Haase Citation2017). Data from location-based social media platforms, such as geotagged tweets from Twitter or photographs from Flickr and Instagram, provide rich information about human activities and mobility (Sui and Goodchild Citation2011, Hawelka et al. Citation2014). Spatial information from social media data has previously been used to study traffic flows (Lenormand et al. Citation2014), population distribution (Steiger et al. Citation2015), urban inequalities (Shelton et al. Citation2015), segregation (Wang et al. Citation2018), natural hazards (Crooks et al. Citation2013), the use of urban green spaces (Heikinheimo et al. Citation2020) and national parks (Tenkanen et al. Citation2017), to name just a few examples.
Despite the growing use of social media data for studying society and human behaviour, different types of bias inherent to social media data limit the use of such data for scholarly research (Olteanu et al. Citation2019). One source of bias is the lack of socio-demographic information, which causes conceptual and methodological challenges (Ruths and Pfeffer Citation2014). Not knowing or ignoring the socio-demographic background of social media users can result in biased outcomes, which are propagated in both interpretation of the results and subsequent policy recommendations. Although methods have been developed to assess and improve the representativeness of social media data in terms of age, gender, language and other demographics (Sloan et al. Citation2013, Citation2015, Longley et al. Citation2015), we need a deeper understanding of the users responsible for creating the social media data. One fruitful approach for achieving this is making big data small and meaningful (Poorthuis and Zook Citation2017). In this way, different elements of social media data, including spatial and temporal information, can enrich our understanding of the users (Toivonen et al. Citation2019).
Place of residence is an essential socio-demographic characteristic for any social media analysis. By “place of residence”, we generally refer to the place or region a person resides in. Depending on the research objectives, information about social media users’ place of residence may need to be determined on different spatial scales, such as country (Hawelka et al. Citation2014), region (Jiang et al. Citation2019), and neighbourhood (Wang et al. Citation2018). Determining the place of residence is often one of the first steps in more complicated big data analysis workflows. For example, information about the place of residence is crucial for separating locals from visitors in urban studies and tourism research (Kádár Citation2014, García-Palomares et al. Citation2015).
Detecting the place of residence is of decisive importance for the meaningfulness of the entire analysis. Previous research has proposed and applied a range of approaches to detecting places of residence, while also comparing the performance of commonly used methods (Bojic et al. Citation2015, Ghermandi Citation2018, Zheng et al. Citation2018). However, the evidence of the validity of the methods used for detecting place of residence from social media data remains limited. Most importantly, previous work has not evaluated these methods at the level of individuals, that is, against ground truth information available separately for each user. Instead, evaluation has been limited to the aggregate level only (Bojic et al. Citation2015, Ghermandi Citation2018, Zheng et al. Citation2018).
In this study, by making social media data small and meaningful (Poorthuis and Zook Citation2017), we have made two contributions to research on extracting place of residence information from social media data. First, we have provided an overview of existing methods for detecting place of residence from location-based social media data. Second, we have systematically compared the performance of existing methods for detecting country of residence at both individual and aggregate levels. More specifically, we conducted an empirical study to detect the country of residence using Instagram data. Here our objectives are: (1) to evaluate how different methods perform in detecting country of residence based on social media data; (2) to assess the impact of spatial and temporal biases inherent in social media data on method performance; and (3) to examine the performance of these methods in individual- and aggregate-level comparisons.
Related work
Approaches to detecting places of residence
Detecting places of residence is a common task for scholars working with mobile big data. Mobile phone data may reveal users’ residence country based on mobile subscription (Ahas et al. Citation2008); data from bike-sharing systems can reveal places of residence at the neighbourhood level (Zhang et al. Citation2018); and precise data from GPS-tracked sports applications can reveal the building a person resides in (Oksanen et al. Citation2015). Compared to other sources of mobile big data, social media data are rich in content and inherently global in terms of its geographical extent, thus making it a relevant source for studying international movements and activities (Hawelka et al. Citation2014, Toivonen et al. Citation2019).
Methods for inferring locations of social media users and the content they create have developed rapidly since the emergence of these platforms in the 2000s (Graham et al. Citation2014, Ajao et al. Citation2015). The various elements of social media data such as geotags, timestamps, content and voluntarily added profile information can provide valuable background information about the users (Toivonen et al. Citation2019). The information available for location detection also depends on the platform. Previous research on Twitter has found that most users (over 70%) reported a home located in their public profile (Graham et al. Citation2014, Hasnat and Hasan Citation2018). Using the self-reported home location is the most straightforward approach. However, self-reported home location is not always available, true or up-to-date (Compton et al. Citation2015). In contrast to Twitter, Instagram does not have a specific field for reporting a home location, but the users can mention their place of residence in their profile.
Previous studies have used various aspects of social media data to detect users’ place of residence by applying a range of spatial, Spatio-temporal and content-based methods. Overall, geotags, timestamps, visual and textual content, as well as the social network and even the user name may reveal information about the place of residence or nationality (Toivonen et al. Citation2019).
A commonly used spatial approach assumes the country or region with a maximum number of posts per user (max posts) as the place of residence (Hawelka et al. Citation2014, Bojic et al. Citation2016, Longley and Adnan Citation2016, Yuan and Medel Citation2016, Heikinheimo et al. Citation2017). Existing studies have used the max posts approach as such or in combination with other methods. For example, Bojic et al. (Citation2016) determined the home country of a user based on the maximum number of Flickr photos and the maximum number of days per country, whereas Yuan and Medel (Citation2016) used the max posts approach to determine the residence country of a Flickr user if the user had not provided this information in their profile.
Various centrality measures based on the spatial distribution of geotagged posts are also commonly used to estimate the place of residence. Mean centre (also; centre of mass) is the average (or a weighted average) of the x- and y- coordinates. Median centre minimises the distance to all points and smooths the effect of outlying points compared to the mean. Standard deviational ellipse (SD ellipse) captures the geographic spread of the data and accounts for directional bias. The centroid of the ellipse may be taken as the place of residence. Xu et al. (Citation2013) demonstrated the application of these centrographic measures on Twitter data and compared the detected centres to self-reported home locations. Blanford et al. (Citation2015) defined the centre of mass of a user’s tweet locations as the home location, which they then used to calculate the radius of gyration as a measure of the user’s mobility. Other studies have used the median location of social media posts as the ground truth for evaluating home-location estimations based on the user’s social network (McGee et al. Citation2013, Compton et al. Citation2015).
Several studies have also used clustering methods to detect meaningful locations from social media data. The DBSCAN (density-based spatial clustering of applications with noise) algorithm (Ester et al. Citation1996) has been used for neighbourhood-level residence detection (Wang et al. Citation2018) detecting the activity centres of users (Luo et al. Citation2016), and tourist destinations (Li et al. Citation2018). DBSCAN performs well with various shapes (spatial distributions) and does not require a pre-defined number of clusters (such as K-means clustering does; see Hu et al. (Citation2015) for a comparison of DBSCAN and K-means). DBSCAN has also been used to smooth the data so that a cluster of points is treated as a single point, thus reducing noise in social media data (Boeing Citation2018).
Temporal information can also be used for determining the place of residence from social media data. Previous studies have used a pre-defined maximum time period (max period) (∼5–30 days for tourists) for distinguishing between residents and visitors in a given area (Girardin et al. Citation2008, Li et al. Citation2013, Kádár Citation2014, García-Palomares et al. Citation2015, Su et al. Citation2016, Manca et al. Citation2017, Jiang et al. Citation2019). Studies using the maximum period approach often focus on the binary classification of locals and tourists without specifying their country of origin. Other commonly used Spatio-temporal approaches consider the maximum number of posts over the longest time interval (max timedelta) (Belyi et al. Citation2017), or the maximum number of unique days (max days), weeks (max weeks) or months (max months) or even hours (Hu et al. Citation2016) in each area. Bojic et al. (Citation2016) determined the country of residence based on the agreement of max posts and max days approaches. It is also common to define locals based on their night-time activity (e.g. between 12 a.m. and 6 a.m.) in combination with other approaches, which assumes that people are at home at night (Luo et al. Citation2016, Hasnat and Hasan Citation2018). Other studies have also defined the potential home locations or ethnicity by enriching information in the user profiles (Longley et al. Citation2015, Longley and Adnan Citation2016, Coats Citation2019). For example, Coats (Citation2019) matched the self-reported locations with a list of place names in the study region, whereas Longley et al. (Citation2015) used first and last names from Twitter to infer the ethnicity of the users.
The level of detail for deriving the place of residence varies from the micro-level (e.g. a building or city block level) to neighbourhoods and administrative regions at different scales, partly due to quality of data (e.g. data volume, spatial accuracy, temporal extent). For example, Hu et al. (Citation2016) detected the place of residence within 100 m × 100 m squares in New York and the Bay Area in the United States.
The source of data plays an important role in selecting a suitable residence detection method. Bojic et al. (Citation2015) showed how several simple home-location detection methods applied to Flickr data and bankcard transaction data yield different results and highlight the importance of considering what methods are appropriate to each data source. Social media platforms are designed and used for a range of purposes (for example, social activities) that influence how data are created and distributed both geographically and temporally (Steiger et al. Citation2015, Tenkanen et al. Citation2017). Thus, the spatial and temporal characteristics of each data source influence the ways in which meaningful locations can be inferred from the data. However, social media platforms share many common Spatio-temporal characteristics, which allows the application of the same spatial methods on data from different platforms. Sometimes users also share the same content across multiple platforms. Recent studies show that a major part of geotagged content on Twitter come from other applications, such as Instagram (Hu and Wang Citation2020).
Social media data are often sporadic in space and time and detecting meaningful locations from this kind of irregular data can be challenging. One way to overcome this issue is to simplify the spatial scale and use a spatially hierarchical approach to zoom in, first detecting the most probable continent of residence, followed by the most probable country. Mahmud et al. (Citation2014) show how this stepwise hierarchical approach improves determining the place of residence.
Reliability of different methods
Reliability and representativeness are a well-known challenge in big data research, as often no ground truth data are available to evaluate the validity of the findings. Previous studies have compared the results of detecting place of residence with tourism statistics (Hawelka et al. Citation2014, Su et al. Citation2016, Heikinheimo et al. Citation2017), census data (Longley et al. Citation2015), and migration statistics (Bojic et al. Citation2016, Belyi et al. Citation2017). These exemplify aggregate-level evaluation, but an individual-level evaluation remains rare. Given the representativeness issues of social media data at a country level and across cultures (Tufekci Citation2014), it is even more crucial to evaluate any method applied against ground truth data at the individual level.
Some studies have evaluated home location detection approaches by using the user-reported home location on social media as the ground truth (Hasnat and Hasan Citation2018). However, using self-reported home-locations as the only ground truth can be problematic (Compton et al. Citation2015). To our knowledge, Hu et al. (Citation2016) have provided a rare exception here by using a crowdsourcing platform (Amazon Mechanical Turk) for a manual expert assessment, but they focused on evaluating the geographical locations of tweets based on their textual content. Overall, more information about the validity of used approaches for detecting the place of residence from social media data is needed.
Case study: detecting the country of residence of visitors to Kruger national park
We applied the methods described in the literature to detect the country of residence of Instagram users who visited Kruger National Park (KNP) in South Africa during 2014. In other words, we used the KNP as the criterion for selecting our study sample. The KNP is a popular destination for wildlife tourism that attracts international and national visitors who actively share their national park experience on social media (Hausmann et al. Citation2018). The South African National Parks (SANParks) organisation systematically collects information about visitors who enter the park. All visitors need to provide personal identification and relevant background information (age; gender; nationality) when entering the park. In 2014, over 1.6 million people visited the KNP, and just over half of these visitors (52%) were from South Africa. We chose the country of residence as the scale of analysis due to the information available in the official visitor statistics, as well as the likelihood of users to report or indicate their place of residence (Graham et al. Citation2014, Hasnat and Hasan Citation2018).
Material and methods
Social media data
We used data from Instagram, which is a popular platform for sharing nature-based experiences from the KNP study area (Hausmann et al. Citation2018). Earlier studies indicate the suitability of Instagram data compared to other sources for estimating visitor rates to national parks at an aggregated level (Tenkanen et al. Citation2017). We collected data from the Instagram Application Programming Interface (API) in Spring 2016 following the approach outlined in previous studies (Heikinheimo et al. Citation2017, Tenkanen et al. Citation2017, Hausmann et al. Citation2018). The data collection had two main steps: 1) identifying users who had publicly shared geo-located posts in the case study area during the study period; 2) searching the full history of public geo-located posts of these social media users on a global scale.
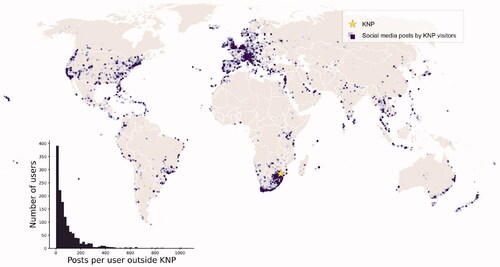
The final data set contained geotagged content from all users who shared publicly at least one geotagged photo from Kruger National Park in 2014. The data contained an anonymised user ID, a timestamp, and a geo-location (latitude and longitude coordinates representing points-of-interest). We excluded posts located inside the national park from all users in the final analysis to avoid false positives for South Africa. The final data set contained 132,400 posts uploaded between 2010 and 2016 from 1375 users who had posted at least once from the KNP in 2014 ().
Figure 1. Map and histogram of geo-located social media posts by Instagram users who visited Kruger National Park (KNP) in 2014. The darker the colour on the map, the more posts from the same location.
Expert assessment
Two experts (the lead author and a research assistant) assessed the presumed country of residence for a sample of the users to establish a ground truth for evaluating the residence detection methods. We took a 33% (n = 430) sample of the users who had shared at least three posts for the expert assessment. The experts examined the following information in public user profiles and posts: user profile description (biography), external websites linked to the user profile, the textual and visual content of posts, languages used, and the locations associated with geotagged posts. The experts gave priority to self-reported country of residence if stated. Otherwise, the experts manually examined the available information for more information. Each expert recorded the presumed country of residence and the criteria for their choice, independent of each other. Optionally, experts could also define a second country of residence or denote the user as a global citizen.
We then measured agreement between the two experts using Cohen’s kappa (κ; Cohen Citation1960), which corrects observed agreement for the possibility that the experts might agree by chance. The theoretical range for κ runs from −1, which indicates perfect disagreement, to 1 for perfect agreement, while 0 indicates random agreement. Measuring agreement on the primary country of residence between the two experts returned a κ score of 0.835 (95% CI: (0.795, 0.876); SE: 0.02; prevalence-corrected κ: 0.744; all calculated using PyCM (Haghighi et al. Citation2018), which indicates substantial agreement. This suggests that the judgements made by the experts about the country of residence were reliable and could be used as ground truth for evaluating residence detection techniques. We only included users on whom both experts agreed in the final ground truth (n = 375). Additional details on evaluating the agreement can be found in the Supplemental Material (S2).
Methods evaluated
Based on the literature review, we selected a set of commonly applied methods for detecting place of residence for the evaluation (). We applied each technique using two approaches related to the scale of analysis: (1) a basic approach in which the method detects the country of residence directly from the user’s global posts, and (2) a hierarchical approach in which the method first detects the continent of residence, followed by a subregion on the continent, and finally the most probable residence country within this subregion. We used a modified version of the Database of Global Administrative Areas (GADM Citation2019) for defining regions and countries (see, Supplemental Material S1). We conducted a spatial join between Instagram data and the administrative area layer so that each post was linked to the intersecting country, or to the nearest country if a post was located off-land. Methods were implemented in the Python programming language (Python 2.7 for scripts using the ArcPy module, and Python 3.8 for other scripts).
Table 1. Techniques for detecting the place of residence based on social media data.
For spatial approaches, we used geographic coordinates as inputs. The max posts method simply calculates the number of posts per user per country, and the country with the most posts is determined as the country of residence. Centrographic measures mean centre, median centre, and SD circle centroid and SD ellipse centroid were implemented using the standard tools available in ArcMap 10.3. Centroids were calculated using projected coordinates (azimuth equidistant projection) due to software limitations. We then identified the intersecting region and country for each centroid. In cases in which the centroid was located off-land, we considered the nearest polygon (based on geodesic distances) as the country of residence.
For clustering methods, the location of the most central point in the largest cluster determines the country of residence. The DBSCAN clustering method determines the number of clusters using two input parameters: 1) epsilon (eps) – the maximum distance between two samples to be considered as neighbours (i.e. the search radius) and 2) the minimum number of points per cluster. We applied the DBSCAN method using the ball tree algorithm and haversine (great-circle) distance (following Boeing Citation2018), as implemented in the scikit-learn Python library (Pedregosa et al. Citation2011). We set the minimum number of points to one, which treats outlying points as meaningful locations (Boeing Citation2018). This allows the inclusion of users with a low number of posts in the result. We selected the suitable eps value iteratively: We repeated the analysis with several settings ranging from 1 km to 1,000 km, while keeping the minimum number of points per cluster to one and compared the results to the expert assessment of the country of residence to determine the most suitable eps value. Based on this assessment, we set eps to 500 km for the basic approach. For the hierarchical approach, we set eps to 725 km at the continent level, to 210 km at the sub-region level and to 500 km at the country level. The parameter selection process is described in the Supplemental Material (S3).
For Spatio-temporal methods, we used the timestamp of the social media post as input. Max timedelta determined the country of residence based on the longest time difference between the first and last post per country. For the max days, max weeks and max months methods, we first cross-tabulated the number of unique days/weeks/months per person in each country. Max posts were used as an additional condition if the Spatio-temporal methods suggested multiple countries.
Evaluating the performance of used methods
We evaluated the performance on two levels of the methods selected: (1) at an individual level, using the expert assessment as the ground truth, and (2) at an aggregate level, based on the official visitor statistics from 2014. Although local visitors (who have a higher probability of visiting the KNP), may influence the outcomes, we separately examined the performance of each method for domestic visitors only (i.e. residents of South Africa) and for international visitors only (i.e. excluding domestic visitors).
We used the F1 score to evaluate each method against the expert-annotated ground truth. F1 score is a widely-used measure of accuracy in research on information retrieval (Ajao et al. Citation2015), which is defined as the harmonic mean of precision (e.g. what proportion of home countries were detected correctly) and recall (e.g. what proportion of users from a given country of residence in the ground truth were detected correctly). Macro-average calculates the unweighted mean of precision, recall and F1 score for each country, regardless of the potentially imbalanced distribution of users by country of residence. We calculated F1 scores using the scikit-learn Python package (Pedregosa et al. Citation2011). We used the Spearman rank-order correlation for comparing the results of each method to the official visitor statistics and plotted maps for comparing the countries of residence visually.
Assessing the influence of social media use on method performance
Given that the heterogeneity and Spatio-temporal variation in social media use may influence the outcome of the analysis, we used binary logistic regression modelling implemented in the SPSS software to evaluate whether characteristics of social media use influence the ability of a method to determine the country of residence. We used each method as a dependent variable to evaluate whether a given method detected the user’s country of residence correctly based on expert evaluation or not. We used independent variables to characterise several aspects of social media use ().
Table 2. Variables characterising social media usage were calculated for each individual user, which was used as independent variables in binary logistic regression modelling.
Results
Comparing methods against the expert assessment
Macro-averaged F1 scores () show that measuring users’ posting activity over months (the max months method, in particular) allows the country of residence to be detected the most accurately. Overall, Spatio-temporal methods perform best when compared to expert assessment. When taking a macro average over the ground truth without users from South Africa, performance decreases slightly for all methods (). For South Africa only, all methods achieved high scores, which indicates that all methods perform relatively well in identifying local visitors.
Table 3. F1 scores, precision (Pr) and recall (Re) for each method were evaluated against the ground truth.
For Spatio-temporal- and clustering-based methods, the F1 scores are relatively high and balanced between precision and recall. Balanced scores mean that these methods detect the countries of residence correctly and cover most users present in the ground truth. Spatial methods are the weakest performers, except for the hierarchical version of the median centres method. The hierarchical approach improves performance significantly for all spatial methods, but only the median centres method approaches the level of Spatio-temporal methods. Spatial methods work well for detecting domestic visitors, especially when using the hierarchical approach. Interestingly, the hierarchical approach does not affect or even slightly decreases the performance of Spatio-temporal methods.
Influence of social media use on detecting the country of residence
Social media usage patterns influenced how well the methods detected the correct country of residence (, see also Supplemental Material S5 for more details). Overall, the diversity of a user’s spatial mobility and the consistent use of social media over time had an impact on determining the country of residence. In addition, the absolute length of a posting time series and the long-term variation of a user’s social media use between months (e.g. seasonality) affected the accuracy of the detection. More specifically, the increase in all three characteristics – count of countries visited (country_n), the absolute length of posting time series (time_active), and the long-term variation of social media use (month_cv) – eventually decrease the odds of detecting the country of residence correctly (Supplemental Material, Table S3). In contrast, the increase in the months with social media activity (months_n) increases the odds of determining the correct country. On the other hand, characteristics of social media use such as the total count of posts (posts_n), the number of posts per day (posts_avg) and the short-term variation of a user’s social media use between days (day_cv) did not influence the analysis (Supplemental Material, Table S3).
Table 4. The characteristics of social media use that affect the country of residence detection for each method according to binary logistic regression model analysis.
From the perspective of comparing methods, most methods are affected similarly by the same characteristics, but the magnitude of the impact varies (Supplemental Material, Table S3). The only systematic difference occurs for three spatial methods (mean centres, ellipse centroids, circle centroids) and whether a method was applied using the basic or hierarchical approach. If the basic approach was used, the long-term variation of social media use (month_cv) and the total count of posts (posts_n) affected the detection. In the case of the hierarchical approach, these variables become non-significant, whereas the number of months with social media activity affects the performance instead.
Comparing method performance to official visitor statistics
Most methods have relatively strong correlation coefficients when compared to the rank-order of countries derived from the official visitor statistics, although we did not expect a complete match due to the known biases in social media data. The rank of countries based on the hierarchical median centres method corresponded the most to the official visitor statistics (rho = 0.79, ). For other methods, the results were slightly different, if all users were considered or only those included in the expert assessment (). Based on the correlations between the official visitor statistics and the expert assessment sample (n = 375), hierarchical max timedelta performed equally well with the hierarchical median centres method. Basic approaches to other spatial methods (circle centroids, ellipse centroids, mean centres) resulted in the weakest correlations (rho < =0.35). All other methods had a correlation coefficient >0.70 regardless of the approach (basic/hierarchical) or the sample (all users/users in the ground truth).
Table 5. Spearman rank-order correlation between the countries of residence from official visitor statistics and different residence detection methods for two samples: all users included (left) and a subsample of those users whose country of residence is agreed by both experts (right).
When comparing the basic and hierarchical approaches, the findings are similar to the results of the expert assessment: the hierarchical approach improves the correlation, especially for the spatial methods. For example, the correlation for the median centres method improved from 0.72 to 0.79 with the hierarchical approach, whereas mean centre improved from 0.25 to 0.61. For other methods, the hierarchical method did not yield systematic improvement.
The two comparisons presented in this article (individual-level comparison against expert-annotated ground truth and aggregated-level comparisons with official visitor statistics) suggest different methods for detecting the countries of residence of visitors from a global social media data set. illustrates the distribution of countries of residence based on the best methods and official statistics. The results show that the inclusion of the temporal dimension yields good results (hierarchical max months; hierarchical max timedelta). illustrates the countries of residence detected by the best-performing methods for ground truth data (max months) and official statistics (median centres; max timedelta), as well as the distribution of residence countries based on the official visitor statistics.
Figure 2. Country of residence of visitors to Kruger National Park based on (a) official visitor statistics, (b) hierarchical max months (maximum number of unique months), (c) hierarchical max timedelta (maximum time difference between first and last post), (d) hierarchical median centre.
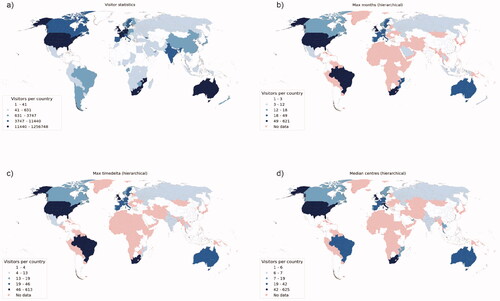
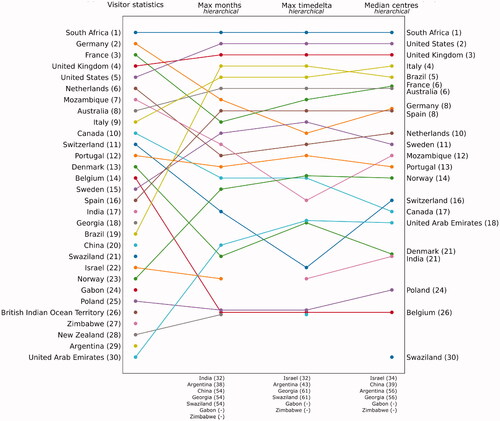
Figure 3. Top 30 countries of residence based on official visitor statistics and the best-performing methods: hierarchical max months, hierarchical max timedelta and hierarchical median centres. Countries with equal rank are plotted with a little offset to allow visibility. Countries included in the top 30 official visitor statistics but excluded from the top 30 detected countries by the methods are listed below the graph.
All methods evaluated in this study identified South Africa correctly as the main country of residence for visitors to KNP, which confirms that all methods can accurately detect local visitors ( and ). However, the choice of the method matters when detecting the country of residence of international visitors ().
Discussion
A global Instagram data set from users who had visited Kruger National Park and the official visitor statistics provided an excellent setting for evaluating the performance of currently used methods in detecting social media users’ place of residence at the country level. In comparison to previous studies, assessing the performance of different measuring techniques (Bojic et al. Citation2015, Ghermandi Citation2018), we also evaluated the performance of each home location detection method against a manual expert assessment at the level of individuals.
Based on our expert assessment findings at the individual level, the methods using the temporal duration of the stay (max months method in particular) performed best in detecting the residence country correctly. While many studies (e.g. Hawelka et al. Citation2014) have relied solely on the number of posts per region (i.e. max posts approach), our results indicate that the simple addition of unique days or months would improve the results. Furthermore, all Spatio-temporal methods detected domestic visitors (from South Africa) with high accuracy (). These results suggest that integrating temporal information to spatial analysis can improve detecting place of residence and studying human mobility more broadly (Kwan Citation2013).
Methods based solely on the spatial distribution provide a twofold outcome. First, DBSCAN clustering and median centres yielded the best results among spatial approaches, whereas other centrographic methods performed worst among all tested methods. Second, the performance of spatial distribution methods increases significantly when applying a hierarchical approach. For example, the performance of median centres improves close to the level of the spatio-temporal methods. Interestingly, a hierarchical approach does not improve the performance of spatio-temporal methods. Further research should investigate the inclusion of other features, such as enriching the spatial analysis with information about the languages used.
Furthermore, we showed how different social media usage patterns influence the correct detection of residence country, and how this tends to vary between methods. For most methods, the ability to detect the country of residence was affected by spatial and temporal posting patterns of the users. It is difficult to pinpoint only one country of residence for globally active users and transnational people based on their posting behaviour, as they are mobile and often living in several countries at once (Dahinden Citation2010, Järv et al. Citation2021). Monthly variation in social media use reflects the fact that people have different posting habits over time. Some users only use social media while travelling abroad (Tasse et al. Citation2017) which prevents capturing one’s country of residence. On the contrary, detecting the country of residence was most reliable for local users who do not travel abroad. Thus, method selection is more important, especially when focusing on international visitors.
The reliability of different methods for detecting the place of residence is likely to depend on the data set used, as different data sources capture different aspects of mobility (Bojic et al. Citation2015) and social activities (Tasse et al. Citation2017). Our case study focused on Instagram data and the methods that could perform differently for other platforms, such as Twitter. Thus, a method comparison by social media platform ought to have top priority in future research on residence detection methods. However, this study is a step in that direction by providing valuable insights that are generally applicable to research based on any social media platform. The performance in detecting the place of residence correctly depends on the method used, and method performance is clearly affected by the user’s social media usage patterns regardless of social media platform. Moreover, the evaluation of methods should be conducted at the individual level, based on ground truth data, rather than on aggregate-level official statistics.
Perhaps the most important finding is the fact that the best-performing method for individual-level ground truth assessment – max months – does not provide the strongest correlation with the official statistics but yields an average correlation coefficient in comparison to the other methods. This suggests two things. First, correlating results with official, yet aggregated, statistics (e.g. visitor or residential data) does not indicate how well a given method detects individuals’ place of residence. Second, this shows how inherent biases of social media data, such as platform popularity by country and socio-demographic population segment, affect the research findings at the aggregate level, if these are not accounted for (e.g. weighted) in the analysis.
One of these biases is evident in our comparisons against the official visitor statistics: social media platforms do not capture visitors from all geographic regions equally, and in the case of Instagram, it largely excludes or underrepresents the Global South, probably due to technological accessibility and different preferences in the choice of social media platforms. The only other African country captured by the methods we used was the neighbouring country of Mozambique ().
This study focused on detecting place of residence at the country level, which is a relevant scale of analysis for many applications in the field of tourism and international mobility studies (Ahas et al. Citation2008, Hawelka et al. Citation2014). We recognise that methods could perform differently on more accurate spatial scales such as regional, city and neighbourhood levels. Such scales could even benefit from more nuanced methods, such as considering the hours of the day (Ahas et al. Citation2010) and ensembles of different approaches using multiple algorithms (Chen and Poorthuis Citation2021).
However, it is common that ground truth data are available only on coarser scales as in our case study. Official tourism statistics are often only available at a country level, and self-reported locations of residence in social media platforms are most often on a country or regional scale (Graham et al. Citation2014). That said, comparing the performance of methods on different spatial scales is certainly needed, especially in urban studies, and using more comprehensive ground truth data.
Finally, this study showcases important challenges of using big data in research and practice, namely access to data and ethical use (Boyd and Crawford Citation2012, Ruths and Pfeffer Citation2014, Zook et al. Citation2017). Continuous access to data can be a major limitation of using social media data in research (Freelon Citation2018, Toivonen et al. Citation2019), as this study has shown. The Instagram API underwent major changes starting from spring 2016 and closed the API, which made it impossible to conduct our research over a longer period and to collect data as we had initially planned. We also had to revise ethical and privacy-related aspects when conducting a manual expert assessment based on social media content to uncover the ground truth about the residence of Instagram users (Poorthuis and Zook Citation2017).
Conclusion
One of the main challenges in using social media data in research and decision-making is the question of representativeness: who is represented by the data and how to tackle the inherent biases of social media. Knowledge about users’ place of residence is of decisive importance in the meaningfulness of the entire analysis based on big data. This study contributes to research on social media data by evaluating the performance of residence detection methods against ground truth data at the individual level. Our findings showed how the performance in detecting place of residence from social media data varies between different methods, and how this is affected by biases inherent to social media data, such as varying patterns of social media use by people, and the popularity of social media platforms by country. Most importantly, we showed that individual ground truth data are crucial for evaluating the actual performance of residence detection methods and aggregated official statistics do not necessarily indicate how well a method performs. Our discussion addresses several future avenues for improving research based on social media data more generally.
TGIS_2044484_Supplementary_Material
Download PDF (476.2 KB)Acknowledgements
All authors would like to thank the Kone Foundation for supporting the Social Media Data for Conservation Science – project (grant number 86878) for supporting the research and South African National Parks for the visitor data. O.J. thanks the Kone Foundation (grant number 201608739) and the Academy of Finland (grant number 331549) for support. All authors also thank Emil Ehnström for participating in the data analysis.
Disclosure statement
The authors report there are no competing interests to declare.
Data and codes availability statement
The data and code that support the findings of this study are available with the identifier(s) at https://doi.org/10.6084/m9.figshare.12504773.
The original input data cannot be made public because of the terms and conditions of the social media platform and to protect the privacy of individual users. Mock data and intermediate results are shared alongside the code to demonstrate how the code works.
Additional information
Funding
Notes on contributors
V. Heikinheimo
This article was a joint effort by researchers from the Digital Geography Lab, University of Helsinki, Finland:
Vuokko Heikinheimo completed her PhD at the Digital Geography Lab, University of Helsinki, Finland and currently works as a Senior Researcher at the Finnish Environment Institute SYKE. Her research interests include combining approaches from geographic information science and sustainability science in the context of sustainable land-use planning.
O. Järv
Olle Järv is an Academy Research Fellow at the Digital Geography Lab, University of Helsinki. His research interest focuses broadly on human mobilities and their extraction from big data to understand social processes and phenomena, including cross-border interactions, functional regions, transnationalism, multilocality, socio-spatial inequality and segregation.
H. Tenkanen
Henrikki Tenkanen is Assistant Professor in Geoinformation Technology at The Department of Built environment, Aalto University, Finland. His research interests include advancing geographic information science and geocomputation for studying sustainable mobility and accessibility.
T. Hiippala
Tuomo Hiippala is Assistant Professor in English Language and Digital Humanities at the University of Helsinki, Finland. His current research interests include computational analysis of multimodal communication and applications of language technology.
T. Toivonen
Tuuli Toivonen is Professor in Geoinformatics and leads the Digital Geography Lab at the Department of Geosciences and Geography, University of Helsinki, Finland. Her research explores the possibilities of using mobile big data and other novel data sources to support spatial planning and decision-making towards fair and sustainable societies.
References
- Ahas, R., et al., 2008. Evaluating passive mobile positioning data for tourism surveys: an Estonian case study. Tourism Management, 29 (3), 469–486.
- Ahas, R., et al., 2010. Using mobile positioning data to model locations meaningful to users of mobile phones. Journal of Urban Technology, 17 (1), 3–27.
- Ajao, O., Hong, J., and Liu, W., 2015. A survey of location inference techniques on Twitter. Journal of Information Science, 41 (6), 855–864.
- Belyi, A., et al., 2017. Global multi-layer network of human mobility. International Journal of Geographical Information Science, 31 (7), 1381–1402.
- Blanford, J.I., et al., 2015. Geo-located tweets. Enhancing mobility maps and capturing cross-border movement. PLOS One, 10 (6), e0129202.
- Boeing, G., 2018. Clustering to reduce spatial data set size. SSRN Electronic Journal. Available at SSRN: http://dx.doi.org/10.2139/ssrn.3145515
- Bojic, I., et al., 2016. Scaling of foreign attractiveness for countries and states. Applied Geography, 73, 47–52.
- Bojic, I., et al., 2015. Choosing the right home location definition method for the given dataset. In: T.-Y. Liu, C.N. Scollon, W. Zhu, eds. Social Informatics. SocInfo 2015. Lecture Notes in Computer Science, vol 9471. Cham: Springer International Publishing, 194–208.
- Boyd, d., and Crawford, K., 2012. Critical questions for big data: provocations for a cultural, technological, and scholarly phenomenon. Information, Communication & Society, 15 (5), 662–679.
- Cesario, E., et al., 2017. SMA4TD: a social media analysis methodology for trajectory discovery in large-scale events. Online Social Networks and Media, 3–4, 49–62.
- Chen, Q., and Poorthuis, A., 2021. Identifying home locations in human mobility data: an open-source R package for comparison and reproducibility. International Journal of Geographical Information Science, 30 (7), 1425–1448.
- Coats, S., 2019. Language choice and gender in a Nordic social media corpus. Nordic Journal of Linguistics, 42 (01), 31–55.
- Cohen, J., 1960. A coefficient of agreement for nominal scales. Educational and Psychological Measurement, 20 (1), 37–46.
- Compton, R., Jurgens, D., and Allen, D., 2015. Geotagging one hundred million Twitter accounts with total variation minimization. In: Proceedings – 2014 IEEE International Conference on Big Data, IEEE Big Data 2014. IEEE, 393–401.
- Crooks, A., et al., 2013. # Earthquake: Twitter as a distributed sensor system. Transactions in GIS, 17 (1), 124–147.
- Dahinden, J., 2010. The dynamics of migrants’ transnational formations: between mobility and locality. In: R. Bauböck and T. Faist, eds. Diaspora and Transnationalism – Concepts, Theories and Methods. Amsterdam: Amsterdam University Press.
- Ester, M., et al., 1996., A density-based algorithm for discovering clusters in large spatial databases with noise. In: Kdd. 226–231.
- Freelon, D., 2018. Computational research in the post-API age. Political Communication, 0 (0), 1–4.
- GADM 2019., Database of Global Administrative Areas.
- García-Palomares, J.C., Gutiérrez, J., and Mínguez, C., 2015. Identification of tourist hot spots based on social networks: a comparative analysis of European metropolises using photo-sharing services and GIS. Applied Geography, 63, 408–417.
- Ghermandi, A., 2018. Integrating social media analysis and revealed preference methods to value the recreation services of ecologically engineered wetlands. Ecosystem Services, 31, 351–357.
- Girardin, F., et al., 2008. Digital footprinting: uncovering tourists with user-generated content. IEEE Pervasive Computing, 7 (4), 36–43.
- Graham, M., Hale, S.A., and Gaffney, D., 2014. Where in the world are you? Geolocation and language identification in Twitter. The Professional Geographer, 66 (4), 568–578.
- Haghighi, S., et al., 2018. PyCM: Multiclass confusion matrix library in Python. Journal of Open Source Software, 3 (25), 729.
- Hasnat, M.M., and Hasan, S., 2018. Identifying tourists and analyzing spatial patterns of their destinations from location-based social media data. Transportation Research Part C: Emerging Technologies, 96, 38–54.
- Hausmann, A., et al., 2018. Social media data can be used to understand tourists’ preferences for nature-based experiences in protected areas. Conservation Letters, 11 (1), e12343.
- Hawelka, B., et al., 2014. Geo-located Twitter as proxy for global mobility patterns. Cartography and Geographic Information Science, 41 (3), 260–271.
- Heikinheimo, V., et al., 2017. User-generated geographic information for visitor monitoring in a national park: a comparison of social media data and visitor survey. ISPRS International Journal of Geo-Information, 6 (3), 85.
- Heikinheimo, V., et al., 2020. Understanding the use of urban green spaces from user-generated geographic information. Landscape and Urban Planning, 201, 103845.
- Hiippala, T., et al., 2019. Exploring the linguistic landscape of geotagged social media content in urban environments. Digital Scholarship in the Humanities, 34 (2), 290–309.
- Hu, T. r., et al., 2016. Home location inference from sparse and noisy data: models and applications. Frontiers of Information Technology & Electronic Engineering, 17 (5), 389–402.
- Hu, Y., and Wang, R.-Q., 2020. Understanding the removal of precise geotagging in tweets. Nature Human Behaviour, 4 (12), 1219–1221.
- Hu, Y., et al., 2015. Extracting and understanding urban areas of interest using geotagged photos. Computers, Environment and Urban Systems, 54, 240–254.
- Huang, Q., and Wong, D.W.S., 2016. Activity patterns, socioeconomic status and urban spatial structure: what can social media data tell us? International Journal of Geographical Information Science, 30 (9), 1873–1898.
- Järv, O., et al., 2021. The impact of COVID-19 on daily lives of transnational people based on smartphone data: Estonians in Finland. Journal of Location Based Services, 15 (3), 169–129.
- Jiang, Y., Li, Z., and Ye, X., 2019. Understanding demographic and socioeconomic biases of geotagged Twitter users at the county level. Cartography and Geographic Information Science, 46 (3), 228–242.
- Kádár, B., 2014. Measuring tourist activities in cities using geotagged photography. Tourism Geographies, 16 (1), 88–104.
- Kitchin, R., and McArdle, G., 2016. What makes big data, big data? Exploring the ontological characteristics of 26 datasets. Big Data & Society, 3 (1), 205395171663113.
- Kitchin, R., 2014. Big data, new epistemologies and paradigm shifts. Big Data & Society, 1 (1), 205395171452848–205395171452812.
- Kwan, M., 2013. Beyond space (as we knew it): toward temporally integrated geographies of segregation, health, and accessibility. Annals of the Association of American Geographers, 103 (5), 1078–1086.
- Lenormand, M., et al., 2014. Tweets on the road. PLOS One, 9 (8), e105407.
- Li, D., Zhou, X., and Wang, M., 2018. Analyzing and visualizing the spatial interactions between tourists and locals: a Flickr study in ten US cities. Cities, 74, 249–258.
- Li, L., Goodchild, M.F., and Xu, B., 2013. Spatial, temporal, and socioeconomic patterns in the use of Twitter and Flickr. Cartography and Geographic Information Science, 40 (2), 61–77.
- Longley, P.A., and Adnan, M., 2016. Geo-temporal Twitter demographics. International Journal of Geographical Information Science, 30 (2), 369–389.
- Longley, P.A., Adnan, M., and Lansley, G., 2015. The geotemporal demographics of Twitter usage. Environment and Planning A: Economy and Space, 47 (2), 465–484.
- Luo, F., et al., 2016. Explore spatiotemporal and demographic characteristics of human mobility via Twitter: a case study of Chicago. Applied Geography, 70, 11–25.
- Mahmud, J., Nichols, J., and Drews, C., 2014. Home location identification of twitter users. ACM Transactions on Intelligent Systems and Technology, 5 (3), 1–21.
- Manca, M., et al., 2017. Using social media to characterize urban mobility patterns: state-of-the-art survey and case-study. Online Social Networks and Media, 1, 56–69.
- McCay-Peet, L., and Quan-Haase, A., 2017. What is social media and what questions can social media research help us answer. In: L. Sloan and A. Quan-Haase, eds. The SAGE handbook of social media research methods. London, UK: SAGE, 13–26.
- McGee, J., Caverlee, J., and Cheng, Z., 2013. Location prediction in social media based on tie strength. International Conference on Information and Knowledge Management, Proceedings, 459–468.
- Oksanen, J., et al., 2015. Methods for deriving and calibrating privacy-preserving heat maps from mobile sports tracking application data. Journal of Transport Geography, 48, 135–144.
- Olteanu, A., et al., 2019. Social data: biases, methodological pitfalls, and ethical boundaries. Frontiers in Big Data, 2, 13.
- Pedregosa, F., et al., 2011. Scikit-learn: machine learning in python. Journal of Machine Learning Research, 12, 2825–2830.
- Pontes, T., et al., 2012., Beware of what you share: Inferring home location in social networks. In: Proceedings - 12th IEEE International Conference on Data Mining Workshops, ICDMW 2012. IEEE, 571–578.
- Poorthuis, A., and Zook, M., 2017. Making big data small: strategies to expand urban and geographical research using social media. Journal of Urban Technology, 24 (4), 115–135.
- Ruths, D., and Pfeffer, J., 2014. Social media for large studies of behavior. Science, 346 (6213), 1063–1064.
- Shelton, T., Poorthuis, A., and Zook, M., 2015. Social media and the city: rethinking urban socio-spatial inequality using user-generated geographic information. Landscape and Urban Planning, 142, 198–211.
- Silm, S., Järv, O., and Masso, A., 2020. Tracing human mobilities through mobile phones. In: Handbook of Research Methods and Applications for Mobilities. Cheltenham, UK: Edward Elgar Publishing.
- Sloan, L., et al., 2015. Who tweets? Deriving the demographic characteristics of age, occupation and social class from twitter user meta-data. PLoS One, 10 (3), e0115545.
- Sloan, L., et al., 2013. Knowing the Tweeters: deriving sociologically relevant demographics from Twitter. Sociological Research Online, 18 (3), 74–84.
- Steiger, E., et al., 2015. Twitter as an indicator for whereabouts of people? Correlating Twitter with UK census data. Computers, Environment and Urban Systems, 54, 255–265.
- Su, S., et al., 2016. Characterizing geographical preferences of international tourists and the local influential factors in China using geo-tagged photos on social media. Applied Geography, 73, 26–37.
- Sui, D., and Goodchild, M., 2011. The convergence of GIS and social media: Challenges for GIScience. International Journal of Geographical Information Science, 25 (11), 1737–1748.
- Tasse, D., et al., 2017., State of the geotags: Motivations and recent changes. In: Eleventh International AAAI Conference on Web and Social Media.
- Tenkanen, H., et al., 2017. Instagram, Flickr, or Twitter: Assessing the usability of social media data for visitor monitoring in protected areas. Scientific Reports, 7 (1), 17615.
- Toivonen, T., et al., 2019. Social media data for conservation science: A methodological overview. Biological Conservation, 233, 298–315.
- Tufekci, Z., 2014. Big Questions for Social Media Big Data: Representativeness, Validity and Other Methodological Pitfalls. Eighth International AAAI Conference on Weblogs and Social Media.
- Wang, Q., et al., 2018. Urban mobility and neighborhood isolation in America's 50 largest cities. Proceedings of the National Academy of Sciences of the United States of America, 115 (30), 7735–7740.
- Xu, C., Wong, D.W., and Yang, C., 2013. Evaluating the ‘geographical awareness’ of individuals: An exploratory analysis of twitter data. Cartography and Geographic Information Science, 40 (2), 103–115.
- Yuan, Y., and Medel, M., 2016. Characterizing international travel behavior from geotagged photos: A case study of Flickr. PLoS One, 11 (5), e0154885.
- Zhang, Y., et al., 2018. Mining bike-sharing travel behavior data: An investigation into trip chains and transition activities. Computers, Environment and Urban Systems, 69, 39–50.
- Zheng, X., Han, J., and Sun, A., 2018. A survey of location prediction on Twitter. IEEE Transactions on Knowledge and Data Engineering, 30 (9), 1652–1671.
- Zook, M., et al., 2017. Ten simple rules for responsible big data research. PLoS Computational Biology, 13 (3), e1005399.