
Abstract
The emergence of crowdsourced geographic information (CGI) has markedly accelerated the evolution of land-use and land-cover (LULC) mapping. This approach taps into the collective power of the public to share spatial information, providing a relevant data source for producing LULC maps. Through the analysis of 262 papers published from 2012 to 2023, this work provides a comprehensive overview of the field, including prominent researchers, key areas of study, major CGI data sources, mapping methods, and the scope of LULC research. Additionally, it evaluates the pros and cons of various data sources and mapping methods. The findings reveal that while applying CGI with LULC labels is a common way by using spatial analysis, it is limited by incomplete CGI coverage and other data quality issues. In contrast, extracting semantic features from CGI for LULC interpretation often requires integrating multiple CGI datasets and remote sensing imagery, alongside advanced methods such as ensemble and deep learning. The paper also delves into the challenges posed by the quality of CGI data in LULC mapping and explores the promising potential of introducing large language models to overcome these hurdles.
1. Introduction
Land-use and land-cover (LULC) mapping is indispensable for capturing the spatiotemporal characteristics and changes of the land surface at both global and local scales (Fyleris et al. Citation2022, Meng et al. Citation2017). It plays a crucial role in addressing some of the most pressing challenges faced by humanity, such as global warming (Manley and Egoh Citation2022, Berke et al. Citation2021), urban expansion (Yu et al. Citation2018), ecological degradation (Tenerelli et al. Citation2016), and massive population migration (Kunze and Hecht Citation2015). Therefore, the timely production of precise LULC maps is essential.
Remote sensing imagery has been the primary data source for LULC mapping in numerous studies (Malinverni et al. Citation2011, Sheeja et al. Citation2011, Ran et al. Citation2012, Martínez and Mollicone Citation2012, Wang et al. Citation2014, Elagouz et al. Citation2020). The broad coverage, extensive temporal range, and detailed spectral data provided by remote sensing technologies have continuously improved LULC mapping over time. With the growing demand for efficient and sustainable land-use, there is an increasing need for LULC mapping at a finer scale, so as to deliver more precise land-use information. Nevertheless, the task of identifying specific land attributes, such as residential or commercial areas, based on just the spectral and textural information from remote sensing images, remains a significant challenge (Cao et al. Citation2020). Despite the increasing accessibility of high-resolution imagery for LULC extraction, its high cost limits its application in mapping efforts, especially across extensive or global regions (Hu et al. Citation2016).
The introduction of Web 2.0 technology has sparked a profound data revolution, enabling the public to generate and update spatial information at any time and from anywhere. Over the past two decades, various terms such as ‘citizen science’ , ‘user-generated content’ , and ‘crowdsourcing’ have been proposed by researchers. The term ‘crowdsourcing’ , first defined by Howe (Citation2006), initially described the outsourcing of a business task to the crowd. In geography, Goodchild (Citation2007) introduced a concept to capture geographic information voluntarily generated by individuals or groups, which is called ‘volunteered geographic information’ (VGI). It has since been widely applied in geographic studies (Elwood Citation2008, Hagenauer and Helbich Citation2012, Foody and Boyd Citation2013, Foody et al. Citation2015, Wu et al. Citation2021). With advancements in data acquisition technologies, new sources of geospatial data have emerged, such as social media, taxi tracking, and mobile phone signal data, generated by citizens for personal needs but collected for scientific research. This kind of geo-crowdsourced data, from the perspective of data users, is regarded as passive crowdsourced geographic information (CGI). Later, new terms such as ‘involuntary geographic information’ (iVGI) (Fischer Citation2012) and ‘ambient geographic information’ (AGI) (Stefanidis et al. Citation2013) have been proposed. A review of 25,338 articles from 1990 to 2015 by See et al. (Citation2016) identified 28 crowdsourcing-related terms and introduced CGI as a comprehensive term covering both actively and passively generated geographic information by the public.
Recently, CGI has emerged as a valuable data source for LULC mapping (Yan et al. Citation2019, Andrade et al. Citation2020, Anugraha et al. Citation2020, Li Citation2021, Ju et al. Citation2022), offering significant advantages over traditional land surveys or census data. It is dynamically generated and updated, providing a more current reflection of land attributes, while also being more time-saving and cost-effective (Brown et al. Citation2014, Foody and Boyd Citation2013, Arsanjani et al. Citation2013). Importantly, CGI contains rich information on human activities, providing valuable supplementary data to the social and economic attributes lacking in remote sensing images (Schepaschenko et al. Citation2015a). Therefore, CGI enhances the potential for detailed and efficient LULC mapping through the integration of data using automatic or semi-automatic approaches (Fonte et al. Citation2017, Zhang et al. Citation2017, Li et al. Citation2021a). Indeed, many researchers have either solely used CGI or integrated it with remote sensing images and other auxiliary data for large-scale or accurate LULC mapping in recent years (Zhou et al. Citation2022, Dell’Acqua et al. Citation2018, Leinenkugel et al. Citation2019, Du et al. Citation2020, Liu et al. Citation2020a).
Efforts have been made to synthesize the research advancements in applications related to CGI across various domains. To explore the popularity of VGI, Yan et al. (Citation2020) reviewed 346 journal articles on VGI within GIScience over a decade, examining the contributions, contributors, and main application fields of VGI. Alialy et al. (Citation2018) and Niu and Silva (Citation2020) respectively reviewed the applications of crowdsourcing in human pathology and urban activities, showcasing the substantial advantages of crowdsourced data. Fonte et al. (Citation2015) analysed VGI's types and main platforms, assessing their utility as reference data for land-cover map validation. Su et al. (Citation2020) addressed the challenges and prospects of satellite image analysis in collaborative mapping through crowdsourcing. Yin et al. (Citation2021) examined the integration strategies of remote sensing and geospatial big data for urban land-use mapping. While informative, these studies primarily focused on the subtopics of using CGI for LULC mapping or on specific areas of CGI application, indicating a gap in a comprehensive review of CGI’s contribution to LULC mapping.
This study aims to fill this gap by reviewing the literature on CGI applications in the domain of LULC mapping from 2012 to 2023. The structure of this review is as follows: Section 2 describes the literature search methods and analyses prominent researchers and the distribution of study areas. Section 3 summarizes the sources and types of CGI. Section 4 investigates the current methods and various levels of LULC mapping based on CGI. Section 5 explores the challenges and opportunities presented by CGI. Section 6 concludes the paper, highlighting its contributions and suggesting directions for future research.
2. Literature search and analysis
2.1. Literature search method and results
Relevant studies published between 2012 and 2023 were selected from the web of science (WoS) core database, focusing exclusively on journals listed in the science citation index expanded (SCIE) and social sciences citation index (SSCI). The literature search identified two primary concepts: CGI (Concept I), encompassing crowdsourced data, VGI, and social sensing, and LULC mapping (Concept II), including terms such as land-use mapping, land-cover mapping, and refined land-use classification. To ensure a comprehensive and accurate retrieval of relevant literature, the search initially used detailed terms pertinent to both concepts. The final search query was formulated as follows: (TS = (crowdsourcing OR crowdsourced OR social sensing OR social media OR CGI OR VGI OR volunteered geographic information OR OSM OR OpenStreetMap OR PPGIS OR PGIS OR points of interest (POI) OR citizen science) AND TS = (land-use mapping OR land-cover mapping OR land-use classification OR urban functional zone recognition OR change detection)) AND PY = (2012–2023). The search results were then refined to exclude studies that did not meet specific criteria: (1) only research articles were considered; (2) the research topic was about how to conduct LULC mapping, including mapping of entire LULC types or certain features, rather than on applications based on LULC datasets such as city management or urban vibrancy; and (3) CGI data were involved in the process of LULC mapping.
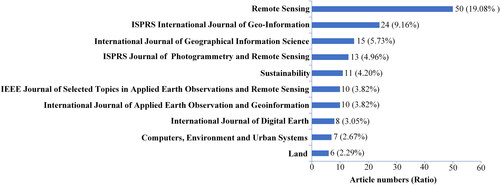
Finally, 262 papers from 79 international refereed journals were selected based on these criteria (See the list of selected papers at https://figshare.com/s/ed84a8b09221c388991c). An increasing trend in publications was noted, with the number of papers increasing from 1 in 2012 to 42 in 2023 (), indicating an increasing interest in LULC mapping using CGI since 2012. Remote Sensing emerged as the leading journal, contributing approximately 20% of the selected papers, followed by ISPRS International Journal of Geo-Information and International Journal of Geographical Information Science (IJGIS), as shown in . As the first journal to publish a CGI-related paper on LULC mapping in 2012, IJGIS has consistently published articles on this topic over the past decade. The top-10 journals together published 154 papers, with each journal contributing at least six papers. In contrast, 108 papers were published across 69 other journals, indicating the global appeal and applicability of CGI for LULC mapping across various research fields.
Figure 1. Proliferation of CGI for LULC mapping articles during 2012–2023.
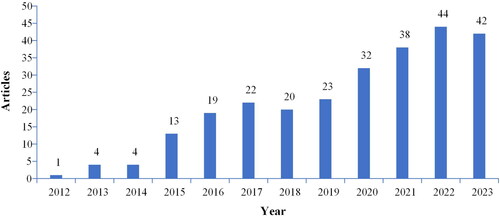
Figure 2. Top-10 journals publishing CGI for LULC mapping papers during 2012–2023.
2.2. Key researchers and domains
A bibliometric analysis revealed that 1,152 distinct authors contributed to the 262 papers selected for this study. By using VOSviewer software, 72 authors who published three or more articles were extracted and divided into several clusters based on the co-occurrence of authors in the selected papers. Notably, authors who published at least 3 papers were all retained in the collaborative network (), whether they were connected or clustered with any other author. In this network map, each node represents an author, with the node size indicating the number of papers. Lines between nodes indicates the collaborative relationship, with thicker lines indicating stronger collaborations. To further delineate these clusters, we explored the backgrounds, research interests, and expertise of the authors by reviewing their profiles on university or research institution websites, ResearchGate, and other sources, as summarized in .
Figure 3. Network map of co-authors who published at least three papers among 262 selected papers.
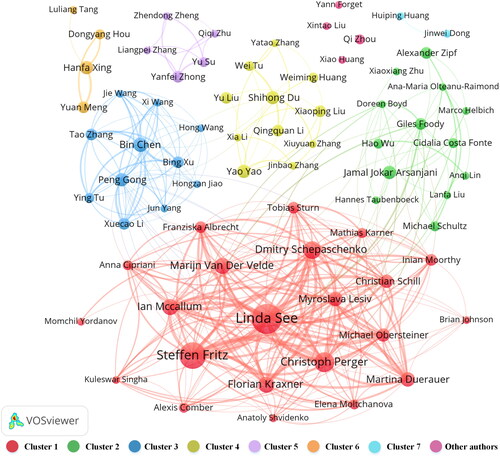
Table 1. Key researchers, maximum number of publications, and research interests in CGI-related LULC mapping.
As the most mainstream cluster, Cluster1 includes 22 researchers mostly from the International Institute for Applied Systems Analysis (IIASA), such as Steffen Fritz, Linda See, Dmitry Schepaschenko, and Christoph Perger. Their work encompasses collecting large-scale land-cover reference data via the Geo-Wiki platform, gathering in-situ LULC data through citizen science, estimating agricultural crops, and mapping forest cover using hybrid approaches. Cluster 2 comprises 13 researchers, such as Giles Foody, Jamal Jokar Arsanjani, Alexander Zipf, Michael Schultz, and Hao Wu. With backgrounds in Geoinformatics and GIScience, this group focused on the use of various CGI sources, such as OSM datasets, POIs, and social sensing data, to advance urban land-use mapping and building function classification. Cluster 3 includes 11 researchers, such as Peng Gong, Bin Chen and Xuecao Li, who have introduced novel deep learning approaches for efficient, fine- and large-scale land-use mapping by integrating CGI with other geospatial big data, including remote sensing data, street-view images, and census data. Cluster 4 also comprises 11 researchers, such as Shihong Du, Qingquan Li, Xia Li, Xiaoping Liu, and Yu Liu, who have made significant strides in linking human activities to urban land-use types or building functions using CGI data, facilitating detailed urban land-use mapping at a micro-level. In Cluster 5, five researchers specialize in information extraction and feature detection of ground objects from remote sensing images, utilizing VGI as auxiliary data. Clusters 6, 7, and other authors form smaller groups compared to the previous five clusters, with no dominant research interest observable from their contributions. They have also integrated various CGI data sources into urban and regional land-use or land-cover mapping, actively promoting this research field.
2.3. Spatial distribution of the study areas
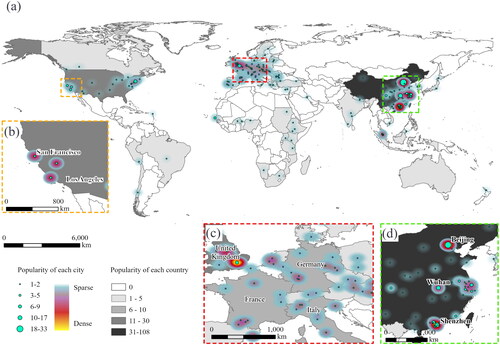
This study explored the spatial distribution of CGI-related LULC mapping research across 262 selected papers. For a more structured statistical analysis, we first excluded articles with a global scope or those that covered areas larger than a single country. Subsequently, we quantified the research focus on specific locations by counting the number of articles associated with each city and the country of the study area, thus determining the ‘popularity’ of each city and country in CGI-related LULC mapping research. A total of 190 cities across 55 countries were identified as study area for LULC mapping (). Specifically, Europe exhibited the highest density of CGI-related LULC mapping research, encompassing over 80 cities. China emerged as the leader in research intensity, with 45 cities featured in 108 articles, followed by the United States, the United Kingdom, Malaysia, and other European countries, especially Germany, Italy, France, and Spain. Conversely, the use of CGI for LULC mapping has been limited in countries such as Chile, Japan, Singapore, and India. A significant number of cities in other countries also remained unexplored in CGI-based LULC mapping from 2012 to 2023. This observation may correlate with the geographic locations of key researchers and highlights the variable accessibility and popularity of CGI in different countries. To provide a more detailed view, the study highlighted three hotspot clusters located in the Southwestern United States, Central Europe, and Southeast China (as shown in , c, and d, respectively). Economically advanced cities such as Beijing, Shenzhen, Wuhan, London, San Francisco, and Los Angeles have become focal points for CGI-related LULC mapping, reflecting the global interest and varied application of CGI in LULC research.
Figure 4. (a) Spatial distribution of study areas across globe. (b)–(d) Insets showing an enlarged view of city distribution in United States, European countries, and China. Heatmap symbology has been enabled for number of articles per city, using ArcGIS pro 2.5 (ESRI Products, Redlands, CA) to show spatial density.
3. Sources and types of CGI for LULC mapping
3.1. An overview of CGI for LULC mapping
With more and more crowdsourced data mining being used in LULC mapping, the typical data types, data sources, and relevant terms of CGI have regularly attracted the attention of many scholars. summarizes the main keywords and CGI data sources referenced across 262 articles, with the keyword size reflecting its prevalence—the larger the size, the more frequently the term is mentioned. To ensure accuracy, each word was counted once per paper, regardless of multiple mentions.
Figure 5. (a) Keywords and (b) CGI source analysis for 262 selected papers.
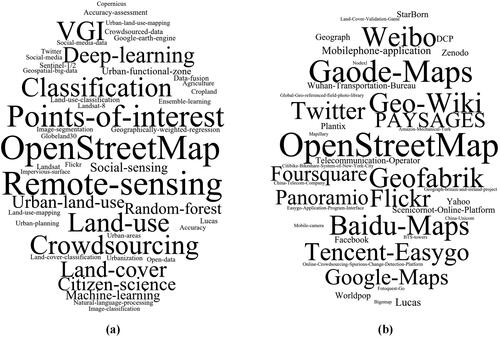
OpenStreetMap (OSM) stands out as the most prominent CGI platform, leading both in keyword mention and as a data source. In terms of the keywords such as remote sensing, POIs, VGI, crowdsourcing, classification, and land-use have also drawn strong attention (). This trend underscores the relevance of combining crowdsourcing and remote sensing technologies in land-use classification studies. Specifically, POIs, which denote specific locations or landmarks marked on maps to communicate places of interest or significance (Psyllidis et al. Citation2022), are among the highlighted keywords. Additionally, terms such as urban functional zones, citizen science, random forest, machine learning, deep learning, and land-cover indicate the critical role of current artificial intelligence (AI) algorithms and platforms in CGI applications for LULC mapping. shows various CGI data sources used in LULC mapping. Gaode Maps and Baidu Maps, as the leading electronic map operators in China, provide extensive and regularly updated POIs to the public, ranking them as the second most popular CGI data sources after OSM. Geofabrik and Geo-Wiki also feature prominently in , the former serves as a reliable resource for downloading OSM data free of charge, while the latter is one of the most popular applications for the collection of reference data by citizens/volunteers. Social media platforms such as Weibo, X (formerly known as Twitter), and Flickr, known for hosting geotagged text, photographs, and videos, have also captured scholarly attention. These platforms allow users to not only share their feelings and experiences of particular objects or activities but also disclose their locations upon publishing. In addition, Tencent EasyGo data emerges as a novel and increasingly favored source of CGI data for LULC mapping, marking a significant development in the field.
According to See et al. (Citation2016), CGI can be divided into active and passive types, depending on the method of data acquisition. Active CGI involves data voluntarily contributed by users, who not only independently determine the content of the data but also collaboratively engage online in its creation, update, and maintenance. Examples of active CGI include contributions from platforms such as OpenStreetMap, Geo-Wiki, and the degree confluence project (DCP). Passive CGI refers to data generated by the public for purposes other than LULC mapping. The content of this data, typically hosted on platforms, includes geotagged texts, photographs, mobile phone signaling, online maps, and videos from sources such as Yahoo, Weibo, Facebook, AirSage, Gaode Maps, and Baidu Maps. Ethical concerns surrounding the use of passive CGI have garnered significant attention, prompting stringent anonymization practices at the source. For instance, entities such as Gaode and Baidu implement anonymization by removing personal identification information such as names, addresses, and contact numbers. In addition, when researchers use passive CGI data, including mobile phone signal data and geotagged social media data for LULC mapping, they ensure and declare in their studies that the data have been anonymized to address privacy concerns (Pei et al. Citation2014, Mao et al. Citation2017, Tu et al. Citation2017, Ratti et al. Citation2006). An extensive overview of the utilization of CGI in LULC mapping is provided in .
Table 2. An overview of the CGI types and main data sources for LULC mapping.
While a variety of CGI types have been widely used in LULC mapping, their application differs between land-cover and land-use mapping due to their different focuses and objectives. Land-cover mapping mainly targets the natural landscape of the Earth’s surface, including features such as grasslands, rivers, and bare land (See et al. Citation2015, Hadi et al. 2022, Zhu et al. Citation2021). In contrast, land-use mapping concentrates on the human-driven alteration and utilization of land, identifying areas with specific functional properties such as urban parks, residential buildings, and schools (Yang et al. Citation2023b, Cao et al. Citation2021, Chen et al. Citation2023a). Therefore, the differences in mapping methods and the CGI data used for these two purposes are significant and warrant further discussion in following sections.
3.2. Active CGI for LULC mapping
3.2.1. Web-based collaborative mapping data
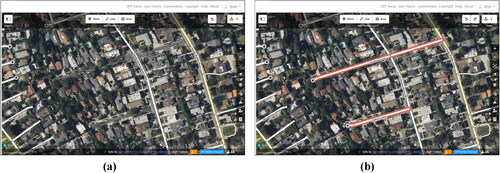
Web-based collaborative mapping, the primary method for generating CGI, involves the collective creation of online maps by volunteers. Contributors can register on mapping websites and create, annotate, or modify LULC information based on remotely sensed images, including points, lines, and polygon features. For example, OSM, initiated in 2004 and now boasting over 5 million users worldwide, has emerged as one of the most successful projects of this kind. It features four types of data—nodes, ways, relations, and tags—that are continually edited and updated by different users (). Another typical online platform that involves citizens in collecting reference data for LULC mapping is Geo-Wiki, developed by Fritz et al. (Citation2012). Users can utilize very high-resolution (VHR) satellite imagery from Google Earth, which allows hybrid and more accurate global land cover maps to be created. Other examples of web-based collaborative mapping platforms or tools include SeaSketch, Open Foris Collect Earth, and MapLine. The rich geographic information generated from web-based collaborative mapping and other data collection platforms is widely employed as training, testing, or reference data to map land-cover and land-use patterns (Olteanu-Raimond et al. Citation2020, Luo et al. Citation2019, Grippa et al. Citation2018). However, due to the open nature of these platforms, maintaining data quality is challenging since anyone can access and edit the information without strict restrictions or professional skills. Additionally, contributions from volunteers are often more substantial in densely populated areas, leading to a spatial imbalance that raises concerns about the usability of such data for LULC mapping in specific regions.
Figure 6. Examples of web-based collaborative mapping using OSM: (a) before editing, (b) after editing.
3.2.2. Crowdsourced in-situ data
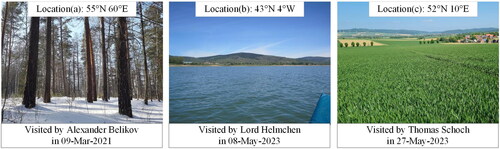
Traditionally, professionals collect in-situ data, such as the land/use cover area frame survey (LUCAS), an authoritative source conducted every three years by trained personnel across European Union member countries, which is a costly ground-truth data collection exercise (Laso Bayas et al. Citation2020). However, the rapid evolution of the internet and location-based mobile technologies has ushered in a new era for in-situ data collection, enabling citizens to easily contribute and share geographic information about their surroundings via handheld devices. For instance, the DCP organizes efforts to visit and photograph each latitude and longitude integer degree intersection, with the results—over 133,000 photographs from 195 countries—shared publicly on the DCP platform (), enriching large-scale ground-truth data sources for land-cover mapping (Foody and Boyd Citation2013). Additional CGI platforms or applications such as the Global Geo-Referenced Field Photo Library, iNaturalist, StarBorn, and PAYSAGES, collect in-situ photographs from the public These data have been used to address the lack of ground-truth data for validation, especially in land-cover mapping where field visits incur high costs (Lee et al. Citation2022). While in-situ data collection with photographs provides robust evidence for data reliability, it usually requires additional image interpolation to identify land-cover or land-use types. Meanwhile, its application has been limited due to the low density and incomplete coverage of data collection locations.
Figure 7. Examples of in-situ pictures taken in latitude and longitude integer degree intersections by different visitors, which have been shared through DCP platform.
3.3. Passive CGI for LULC mapping
3.3.1. Geotagged social media data
Social media data, such as check-in data, tweets, and posts, are generated or contributed by citizens on platforms, including Flickr, X (formerly Twitter), Foursquare, Weibo, and Mapillary, include a vast array of text, photos, places, and videos tagged with geolocations, referred to as ‘geotagged social media data’ in this article. For example, Weibo, the largest microblogging platform in China, reported 582 million active users in June 2022, with mobile users comprising 95% of this base. Geotagged social media data have shown considerable potential for applications in land-use classification, change detection, and validation, especially for detailing urban land-use patterns (Antoniou et al. Citation2016, Soliman et al. Citation2017). In addition, the integration of geotagged social media data with other geospatial data has expanded the scope of land-use mapping studies (Zhang et al. Citation2017, Häberle et al. Citation2022). The rich insights into human social activities captured through massive volumes of geotagged social media data can significantly aid in identifying urban land functions at finer spatiotemporal resolutions. However, obtaining geotagged social media data can be challenging, often requiring advanced programming skills, such as Python-based crawlers, for automated data acquisition, and extensive data processing and mining are essential for extracting latent land-use information from these data.
3.3.2. Online map data
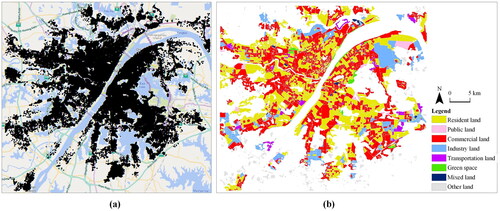
Online maps such as Google Maps, Baidu Maps, and Gaode Maps are invaluable tools not only for locating destinations, planning travel routes, and navigation but also for providing intelligent recommendations related to nearby food, accommodations, entertainment, and other amenities. When people use these maps, they contribute real-time location information, which the map platforms collect and standardize into a unified data format, thus generating CGI such as migration data and POIs. As one of the most widely used CGI data sources in land-use mapping, POIs are rich in attribute information, including place names, categories, geographical locations, detailed addresses, and postcodes. These attributes effectively represent the spatial distribution of urban functional zones as well as the intensity of socioeconomic activities. Moreover, with their high update frequency, ease of access, broad coverage, and substantial data volume, POIs have become crucial in extracting land-use information, whether as a standalone data source or in conjunction with other data, especially for identifying urban functional zones () (Zhang et al. Citation2020, Yang et al. Citation2022). For online map data, POIs are one typical data type, and the uneven distribution of POIs across various categories such as business, residential, and industrial can introduce biases in identifying major land-use types. To enhance the accuracy of land-use mapping, it is imperative to conduct a more in-depth analysis that goes beyond merely considering POI density (Huang et al. Citation2022b).
Figure 8. Example of refined land-use classification based on POIs. (a) POIs distribution in Wuhan, China. (b) Refined land-use classification results based on POIs and OSM road network data at street level in core urban area of Wuhan, China.
3.3.3. Trajectory data
Trajectory data, serving as a direct proxy for individual activities, includes data such as taxi or bicycle trajectories and bus card payment records. This data not only records the start and end times of a citizen’s journey but also the specific locations of these movements. The regularity in people’s daily travel in a city—high-density areas of daytime and nighttime origins on workdays typically reflect commercial and industrial land uses, while nighttime destinations and daytime origins are related to residential areas. Trajectory data thus provides insights into urban social functions related to individual life patterns, which are beneficial for inferring urban land-use (Liu et al. Citation2016, Anugraha et al. Citation2020). As more trajectory data become available from commercial operators, these datasets reflect daily human activities, facilitating the identification of land-use patterns. Nonetheless, because land-use information is not inherently present in trajectory data, it is essential to correlate it with human activities that signify various land-use types.
3.3.4. Mobile phone signal data
With the increasing ubiquity of mobile communication technology, mobile phone signal data have become prevalent in urban environments, mainly comprising mobile internet access data and call detail records. These data are automatically recorded by nearby base stations when users engage in daily communication activities with their mobile phones, typically showing higher density in urban centers compared to suburbs. To safeguard privacy and ensure data protection, mobile phone signal data are usually aggregated and anonymized by mobile communication operators or companies such as China Unicom, China Telecom, SingTel, AirSage, and Telefónica. Mobile phone data provide valuable insights into the spatiotemporal interactions between citizens and the urban environment, offering a rich source of information that can deepen our understanding of urban spatial structures (Pei et al. Citation2014, Frias-Martinez et al. Citation2014, Calabrese et al. Citation2013). However, the public cannot freely access mobile phone signal data due to business confidentiality and privacy concerns. Additionally, it is a complex and challenging task to extract useful features from the vast amounts of raw data for mapping purposes (Sun et al. Citation2022, Song et al. Citation2022, Mao et al. Citation2017, Shi et al. Citation2019, Zong et al. Citation2020, Nie et al. Citation2022).
4. LULC mapping progress using CGI
4.1. Methods of LULC mapping from CGI
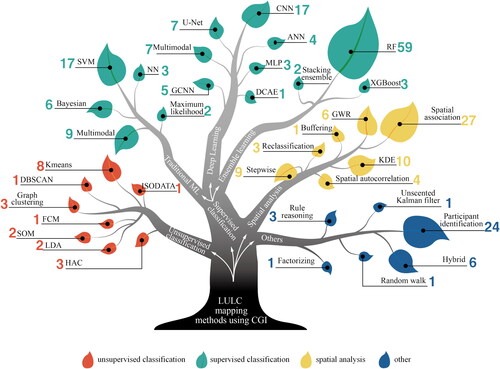
LULC mapping methods using CGI can be categorized into four main types: (1) spatial analysis, (2) supervised classification, (3) unsupervised classification, and (4) other methods. As shown in , these methods are represented by 262 papers and are visually distinguished using four different coloured leaves: red for unsupervised classification, green for supervised classification, yellow for spatial analysis, and blue for other methods. Among these, supervised classification methods (green leaves) comprise the largest segment at 55% and are further divided into three subtypes: traditional machine learning, deep learning, and ensemble learning.
Figure 9. Categories of LULC mapping methods using CGI.
4.1.1. Spatial analysis-based methods
Spatial analysis-based methods, utilized in 23% of the studies (yellow leaves in ), represent the most straightforward approach among the four categories. In this method, the labels and geometry of the CGI data are directly applied to LULC mapping without additional processing or data mining. Notably, CGI data labels include both social and natural elements (Jarvis et al. Citation2016), facilitating comprehensive studies on land-use and cover. The basic method involves extracting attribute information from CGI data, which is then spatially associated with specific parcels or pixels to interpret or update land-use or cover types. For example, POIs, buildings, and parcel units are overlaid, and dominant POI types within these units are analyzed to deduce the functions of buildings and define urban functional zones (Liu and Long Citation2016, Lin et al. Citation2021). Attributes from OSM data or photographs are extracted and overlaid onto land-cover products such as GlobeLand30 and Globcover to generate updated maps (Fonte et al. Citation2017, Qian et al. Citation2020a). While spatial association is effective for extracting LULC information, its applicability is limited to areas covered by CGI data (Arsanjani and Vaz Citation2015). Moreover, more advanced spatial analysis methods such as kernel density estimation (KDE), buffering, and stepwise methods have been developed to achieve 100% identification of LULC parcels. The KDE method transforms CGI data, including POIs and social media data with LULC labels, into a continuous surface to identify multiple or single LULC types (Ye et al. Citation2020, Iranmanesh et al. Citation2022, Liu et al. Citation2022). Buffering analysis is applied to reference water datasets to generate natural water bodies of various widths (Zhou and Jing Citation2022). Furthermore, stepwise methods that combine KDE, category ratio indices, and buffering methods have been generated for mapping urban building functions (Du et al. Citation2021).
Regression-based models, such as spatial autocorrelation and geographically weighted regression (GWR), have been effectively employed for LULC mapping with CGI. Spatial autocorrelation measures the similarity between neighboring spatial observations to evaluate differences between actual LULC scenes and CGI mapping result. For example, Zhang et al. (Citation2021) used global Moran’s I and local indicators of spatial association to analyze visits to various park types. The GWR method, which accommodates nonstationary variables by allowing regression parameters to vary spatially, has proven beneficial for integrating multiple LULC products. For instance, See et al. (Citation2015) used CGI data from Geo-Wiki as reference data and combined three global land-cover products (GLC2000, MODIS, and GlobCover) to create highly accurate hybrid land-cover maps. Additionally, the GWR method facilitated the development of a forest cover map by combining existing land-cover and forest products (GLC2000, GlobCover, GlobLand30) with crowdsourced forest cover data from the Geo-Wiki project (Schepaschenko et al. Citation2015a, Schepaschenko et al. Citation2015b, Lesiv et al. Citation2016). Comber et al. (Citation2016) utilized the GWR model to compare crowdsourced land-cover maps from various sources and generate a high-precision, mosaicked LULC map.
While regression-based methods improve the reliability of LULC mapping by integrating multiple data sources, their effectiveness is contingent on the availability of known LULC information from CGI or remote sensing images. In other words, spatial analysis-based methods struggle to deduce LULC information if the CGI data do not directly provide such information.
4.1.2. Supervised classification based methods
Approximately 55% of the publications reviewed (represented by green leaves in ) used supervised methods to integrate VGI into LULC mapping. Supervised classification, often supported by machine learning, constructs a predictive model that correlates features with predefined LULC types, requiring both training and validation process. Utilizing CGI data—including their locations, geometries, and attributes as labels—eliminates the need for manual labeling, significantly reducing the workload and facilitating the production of LULC maps (Arsanjani et al. Citation2013, Xu et al. Citation2020). Beyond this direct application, additional CGI processing techniques have been employed to enhance LULC mapping using traditional machine learning, ensemble learning, and deep learning approaches.
Traditional machine learning methods leverage a single CGI source, with or without remote sensing images, to generate LULC maps. However, various traditional machine learning methods, such as maximum likelihood, Bayesian, and SVM, are employed using a single source of CGI data, such as POIs or geotagged images, to delineate cultivated lands and urban functional zones (Bogaert and Gengler Citation2018, Yang et al. Citation2023b, Yang et al. Citation2023a, Jiang et al. Citation2015). However, SVM, particularly popular in this category, is often used to extract semantic information from POIs or geotagged photographs for classifying artificial surfaces or urban functional zones (Sun et al. Citation2023, Xing et al. Citation2017b, Liu et al. Citation2017, Huang et al. Citation2022a).
In contrast to traditional machine learning, ensemble learning combines high-dimensional features from CGI and remote sensing images, including POIs, OSM data, Tencent user locations, and check-in data, to construct complex nonlinear models for inferring LULC types (Gong et al. Citation2020, Zong et al. Citation2020, Sun et al. Citation2020, Lin et al. Citation2024b). Random Forest (RF) is one of the most utilized models within ensemble learning, commonly applied to combine multiple data sources—such as remote sensing imagery, Baidu POIs, nighttime light images, and Tencent location data—to accurately outline urban functions (Li et al. Citation2021b). XGBoost, another ensemble learning method, uses a diverse array of features including high-resolution satellite images, street-view images, building footprints, POIs, and social media check-in data for urban functional zone classification (Huang et al. Citation2020). Additionally, a stacking ensemble learning framework employs two base classifiers and one meta-classifier to analyze morphological and socioeconomic features extracted from multiple CGI data points within each block, providing probabilities that indicate the block’s membership in various functional regions (Yang et al. Citation2022). Overall, ensemble learning, which harnesses the strengths of multiple weak learners, generally outperforms traditional machine learning in handling high-dimensional information for LULC mapping (Wu et al. Citation2023).
Deep learning methods utilize multilayered neural networks to extract information from image-based CGI and remote sensing images, facilitating the generation of LULC maps by interpreting complex information. Image-based CGI, including street-view images and photos taken by volunteers (Huang et al. Citation2023, Zhang et al. Citation2023b, Kang et al. Citation2018, Wang et al. Citation2020), is employed to extract semantic representations of scenes or building facades for applications such as urban functional zone mapping, building classification, and crop-type mapping. Deep learning also excels in integrating VHR remote sensing images with CGI data for comprehensive LULC mapping. CGI data have been effectively combined with Gaofen-2 (Li et al. Citation2021a), WorldView-2 (Saralioglu and Gungor Citation2022), WorldView-3 (Bao et al. Citation2020), Sentinel-2 (Li et al. Citation2021a, Chen et al. Citation2021), and Google Earth images (Li et al. Citation2020) to train deep learning models such as U-Net, CNN, and MLP. These models address diverse LULC elements, including surface water, urban surfaces, urban green spaces, and urban functional areas. The frequent updates of CGI data, when integrated with VHR images and deep learning techniques, also enhance land-use change mapping. For instance, using OSM data as a ground-truth dataset across different years, CNN and transfer learning have been integrated to detect changes in LULC types such as houses, forests, and water across various time periods, using aerial images from three distinct intervals (Fyleris et al. Citation2022). Additionally, a multibranch fusion network was utilized to train VHR images and kernel density maps of POIs to detect functional changes at the scene level over time (Fang et al. Citation2023).
Despite deep learning’s widespread application in combining remote sensing images and CGI for LULC mapping, direct application of deep learning to CGI data, particularly for interpreting LULC objects from images, remains limited. There is substantial potential to expand the use of deep learning methods to process CGI in other data formats, such as geometries, text, and even videos, for more nuanced LULC mapping.
4.1.3. Unsupervised classification based methods
In contrast, unsupervised classification methods (the red leaves in ), represented by approximately 8% of the publications reviewed, are commonly used to process passive CGI data without LULC labels, such as data derived from social media, trajectories, and mobile phone signals. Unsupervised classification methods are utilized to identify patterns, generate clusters, and analyse these to define LULC classes, providing valuable insights into areas where structured labelling is unavailable.
K-means clustering, hierarchical agglomerative clustering (HAC), and graph clustering are popular unsupervised learning methods for LULC mapping. These methods identify and generate clusters by analyzing the internal structure or statistical patterns of features without human supervision. For instance, Wang et al. (Citation2016) applied k-means clustering with social media data to categorize land-use in Beijing, China, into seven types: residential areas, university dormitories, commercial areas, work areas, transportation hubs, and two types of mixed-use areas. Tu et al. (Citation2017) used HAC to discern urban functions by integrating social media and mobile phone positioning data, classifying land-use in Shenzhen, China into seven categories: in-home, working, shopping, schooling, transportation, recreation, and entertainment. Hughes et al. (Citation2019) utilized graph clustering to refine LULC mapping by combining existing land-cover products, such as GlobeLand30 and OSM data, to produce more accurate results. Other unsupervised learning methods, such as density-based spatial clustering of applications with noise (DBSCAN), latent Dirichlet allocation (LDA), and self-organizing maps (SOM), have also been applied to enhance LULC mapping in conjunction with CGI data. Liu (Citation2021) improved the DBSCAN model and used OSM polygon density data to identify three distinct land-use clusters: residential, commercial, and public. Yu et al. (Citation2022) implemented LDA topic modelling and used POI tags to generate hidden topic probabilities, classifying urban functions into four types. Song et al. (Citation2022) integrated aggregated mobile phone data with a SOM neural network to automatically segment urban functional zones into nine cluster types, including residential, business, combined business/socializing, shopping mall/residential, educational/residential, socializing/educational, a mix of socializing/business/shopping mall, industrial, and industrial/residential. However, the use of unsupervised classification methods introduces significant uncertainty regarding the type and number of clusters, which can complicate alignment with national land-use classification standards (Lin et al. Citation2024a). The inconsistent results produced by unsupervised classification can also hinder its utility in urban planning by official agencies.
4.1.4. Other methods for LULC mapping
Other methods (indicated by blue leaves in ) for LULC mapping using CGI data, accounting for 14% of publications, include participant identification, hybrid approaches, and some less-common methods. Participant identification, featured in 31 publications, utilizes various web and app platforms such as Flickr (Antoniou et al. Citation2016), StarBorn (Baer et al. Citation2019), and land loss lookout (Spatharioti et al. Citation2022). These platforms mainly serve to generate LULC products, assess their accuracy, and gather input data for LULC mapping. Hybrid approaches merge supervised and unsupervised classification techniques, tailored to specific geographic areas. For instance, Donchyts et al. (Citation2016) applied a nonparametric unsupervised method to detect water in flat regions and used supervised classification to refine the water mask in hilly areas. Moreover, a few less-common methods have been employed in CGI-based LULC mapping. These include specific theories and concepts such as the unscented Kalman filter (Boucher and Noyer Citation2017), random walk (Guo et al. Citation2016), and factorization (Mao et al. Citation2017), all aimed at enhancing the accuracy and efficiency of the mapping process.
4.2. LULC mapping at different levels
4.2.1. Macro-level LULC mapping
Macro-level LULC mapping typically involves the creation of large-scale land-cover and land-use maps with spatial resolutions greater than 100 m (). Various global land-cover products have been developed, such as the global rural-urban mapping project (GRUMP) with a resolution of 1 km, global land-cover 2000 (GLC2000) also at 1 km, MODIS land-cover type product (MCD12Q1) at 500 m, and global land-cover product for 2005–2006 (GlobCover) at 300 m. These products are widely used in numerous LULC studies but often suffer from high uncertainty due to their low spatial resolutions.
With ongoing advancements in AI technology and the integration of CGI, an increasing number of global, national, and regional LULC maps have been produced, offer greatly improved accuracy and efficiency. For example, at the global level, See et al. (Citation2015) produced the first hybrid global land-cover map using GLC2000, MODIS, and GlobCover, using crowdsourced training data from Geo-Wiki at a 300-m resolution. Fritz et al. (Citation2017) detailed global LULC reference datasets generated by four campaigns utilizing the Geo-Wiki crowdsourcing platform. Using OSM data as a training set, Parekh et al. (Citation2021) proposed a deep learning model to automatically detect global impervious surfaces from Landsat 8 images, achieving an accuracy of 92.46%. At the national scale, Xia et al. (Citation2019) mapped urban areas in China by combining multisource features from remote sensing and Tencent location request density (LRD) data with the RF classifier. Moreover, at the regional scale, Liu et al. (Citation2016) proposed an unsupervised method employing a new type of place signature to determine land-use types in Shanghai, China, using a 500-m grid. These achievements, facilitated by the incorporation of CGI data into macro-level LULC mapping, have proved invaluable in enhancing our understanding of urbanization processes and in guiding rational development across different scales (Lee and Son Citation2023, Zhao et al. Citation2023, Jiao et al. Citation2023).
4.2.2. Meso-level LULC mapping
In the past, medium spatial resolution remote sensing images (greater than 10 m and up to 100 m) were commonly adopted as the primary data source for meso-level LULC mapping. For example, global LULC products such as GlobeLand30, global human built-up and settlement extent (HBASE), and global urban land were all derived from Landsat thematic mapper (TM)/enhanced thematic mapper plus (ETM+) data, which have a spatial resolution of 30 m. Recently, CGI has opened new opportunities to meso-level LULC mapping. By combining remote sensing with CGI, some studies have obtained more accurate meso-level LULC maps based on regular grids ranging from 10 to 100 m. In addition, extensive LULC mapping studies have been conducted using irregular spatial units, such as parcels or blocks (Liu et al. Citation2020b, Qian et al. Citation2020b, Zhang et al. Citation2023b, O'driscoll et al. 2023).
Over the past three years, there has been several explorations of urban land-use patterns at the meso-level using one or more types of CGI. It has become a research hotspot to conduct meso-level LULC mapping studies that combine CGI with high-resolution remote sensing images, nighttime light data, street-view data, and statistical socioeconomic data. For example, Forget et al. (Citation2021) proposed an automated, cost-effective mapping approach by integrating multi-sensor satellite images and OSM, mapping the urban expansion of 45 urban areas at a 30-m resolution. To map refined urban land-use types effectively and accurately, Bao et al. (Citation2020) implemented a DFCNN strategy to recognize urban functional zones at the parcel-level using VHR images, POIs, and OSM road network data in central Shenzhen, China, achieving an accuracy of 97.8% for classifying areas such as industrial districts, public services, and residential districts. Xie et al. (Citation2022) developed a multimodal deep learning method with an attention mechanism to combine multisource features from remote sensing images, CGI, and other geolocation datasets to identify meso-level urban functional zones in Ningbo, China, with an accuracy exceeding 90%. In addition, the fusion of CGI with other multisource data presents a promising approach for large-scale, refined urban land-use mapping at the meso-level (Gong et al. Citation2020). These improvements in accuracy and efficiency, achieved by integrating CGI with other data sources for parcel-level urban land-use mapping, are significant. Deep learning algorithms, in particular, are showing greater promise for achieving higher accuracy in meso-level mapping compared to classic machine learning algorithms such as RF, SVM, and the artificial neural network (ANN).
4.2.3. Micro-level LULC mapping
Traditionally, micro-level LULC mapping (≤10 m) has relied on identifying ground object features such as geometry, spectrum, texture, and size from VHR remote sensing imagery. Techniques such as supervised classification or object-based image analysis are used to categorize urban land into homogeneous objects such as built-up areas, impervious surfaces, water bodies, and green spaces. These approaches are widely applied in land-cover mapping (Schmidt and Barron Citation2020, Ju et al. Citation2022, Huang et al. Citation2022c, Olteanu-Raimond et al. Citation2020). While novel deep learning algorithms have been proposed to extract detailed land-use information from VHR satellite imagery, it remains challenging to discern intricate urban land-use functions using only remote sensing data.
In recent years, the surge in CGI has introduced socioeconomic and human activity attributes to land-use analysis, opening new avenues for micro-level LULC mapping, especially for detailed urban land-use (Zhong et al. Citation2023, Bai et al. Citation2023, Hoffmann et al. Citation2023). For instance, Shi et al. (Citation2019) combined multisource remote sensing images and WeChat user density maps to classify LULC into 10 types—residential, industrial, commercial, educational, vegetation, roads, water, greenhouses, bare land, and urban villages—using object-based image analysis, decision trees, and RF, achieving an overall accuracy of 91.55%. Several studies have utilized various types of CGI, such as Tencent LRD data, POIs, taxi trajectory data, and mobile signaling data to perform detailed mapping at the individual building scale, often combining multiple data sources or integrating CGI with VHR remote sensing imagery (Chen et al. Citation2017, Liu et al. Citation2018, Zhuo et al. Citation2019, Lin et al. Citation2021, Deng and He Citation2022, Häberle et al. Citation2022, Song et al. Citation2022, Nie et al. Citation2022, Yan et al. Citation2023). Although these studies have shown good accuracy, they are generally limited to the small, inner-core areas of urban areas. There is also a growing trend in mapping detailed urban land-use at the object level by combining object- and parcel-based approaches with VHR satellite imagery and CGI. For example, Dong et al. (Citation2020) adopted a multiscale image segmentation algorithm to classify urban land-use using GF-2 images initially and then overlaid the object-based classification results with OSM road network data to generate a refined micro-level urban land-use map with high accuracy. The integration of CGI has thus enabled the development of new mapping strategies that improve micro-level LULC mapping in terms of accuracy and practicality, providing detailed and reliable land-use information crucial for urban planners and governmental policy-making in urban land management.
Table 3. The spatial granularity and spatial extent of LULC mapping at different levels.
5. Discussion
5.1. The challenges of CGI data quality for LULC mapping
Similar to other types of user-generated content, CGI data are primarily collected by nonprofessional volunteers or generated from various data sources without uniform quality standards, resulting in inherent quality issues (Goodchild and Li Citation2012). As new technologies for generating CGI data have advanced, quality issues have become more prominent, posing significant challenges to the accuracy and reliability of LULC mapping (Zhou et al. Citation2022, Chen et al. Citation2023b).
The ISO 19113 standard (ISO Citation2002) outlines five standardized quality elements for spatial data that are commonly used to assess the usefulness and reliability of CGI data: completeness, positional accuracy, logical consistency, temporal accuracy, and thematic accuracy. Completeness, the primary quality element for spatial accuracy, is crucial for understanding omission and commission errors within CGI data. Incomplete CGI data often fail to accurately reflect the ground-truth, leading to spatial heterogeneity in LULC mapping quality, particularly evident when comparing active CGI data in urban and rural areas. Urban areas, with more frequent human activity, tend to generate more complete CGI data (Barrington-Leigh and Millard-Ball Citation2017). Due to these limitations, studies often prefer using CGI data in large cities for land-use mapping (Lu et al. Citation2022, Pei et al. Citation2014). Positional accuracy measures whether the geometry accurately represents the ground-truth at the correct location. This accuracy can be significantly affected by the positional error of the location device, as seen with the uncertain locations of geotagged social media data such as Flickr and panoramic images, which can lead to challenges in accurately classifying land-cover types (Zielstra and Hochmair Citation2013). Logical consistency assesses the consistency in topology, structure, and format of CGI data, where topological errors often occur in web-based collaborative mapping data due to the fusion of numerous data sources, impacting land-use mapping when different layers overlap. Thematic accuracy involves evaluating the accuracy of the attributes or labels of mapped features within the CGI data, addressing the quality of the data’s content. Temporal accuracy, encompassing both spatial and attribute accuracy at a specific time, is crucial for mapping LULC changes and must be carefully monitored. Addressing quality issues in CGI is complex and cannot be fully addressed using general spatial data quality assessments. This difficulty arises because authoritative data sources are not always available or directly comparable to CGI data (Keßler and De Groot, 2013). Proxy indicators such as economic development, education level of participants, population density, and revision frequency of CGI data have been developed to assess CGI quality in specific study areas (Neis et al. 2010, Camboim et al. Citation2015, Barrington-Leigh and Millard-Ball Citation2017, Truong et al. Citation2019). Furthermore, CGI data are collected in various formats beyond unified spatial data, with formats such as text and pictures not adhering to general spatial data standards (Senaratne et al. Citation2017), further complicating quality assessments.
It was observed that the majority of the 262 selected papers acknowledged the impact of CGI quality on LULC mapping, though they addressed quality issues in different ways. Some studies confirmed the reliability of CGI data by referencing previous quality assessments, a common approach in studies using OSM for LULC mapping (Dorn et al. Citation2014; Liu, X et al. 2015; Chang et al. Citation2020; Liu et al. Citation2021). To investigate the impact of CGI quality on LULC mapping, a popular way involves comparing CGI-based LULC maps with alternative mapping products (Arsanjani et al. Citation2013, Vaz & Arsanjani Citation2015, Baer et al. Citation2019). Additionally, some researchers preprocess CGI data to improve its quality before using in LULC mapping. A conservative approach involves filtering the data according to specific rules (Greg Brown, Citation2013, Zhang et al. Citation2020). In cases where studies integrate multiple CGI data sources or encounter divergent opinions from volunteers at the same location, data fusion methods such as naive Bayes, logistic regression, and GWR have been used to improve the reliability of LULC maps (M. Lesiv et al. Citation2016). Notably, some studies chose not to process or assess CGI data before mapping. Instead, they focus on evaluating the accuracy of LULC maps with ground-truth samples to validate their methods, regardless of the CGI data quality (Fan and Thakur Citation2023, Xu et al. Citation2022, Cui et al. Citation2022).
Despite the quality issues associated with CGI data, it is undeniable that these data have significantly enriched the resources available for land-use mapping, especially in providing semantic information that reflects urban functions. A possible solution for mitigating the uncertainty of CGI data involves integrating different data sources in LULC mapping (Liu et al. Citation2021; Chen et al. Citation2022). The cross validation can be performed for CGI quality assessment if corresponding data with higher quality is available. Otherwise, the proxy indicators are alternative to estimate the reliability of CGI data for LULC mapping (Comber et al. Citation2016, Zhou et al. Citation2022).
5.2. Potential opportunities for CGI in LULC mapping
The rapid development of AI technology has unleashed the vast potential of crowdsourced geographic data, opening new opportunities in the field of LULC mapping.
Many scholars have embraced AI technology in the field of geographical science, leading to the emergence of geographic AI (Geo-AI). By integrating CGI with AI techniques such as machine learning, deep learning, and computer vision, Geo-AI offers robust tools for processing and analyzing geospatial problems (Gao Citation2020). In the realm of LULC mapping, Geo-AI enhances the identification and understanding of text from geographical entities, thereby inferring potential land-use and cover types and improving the availability of LULC data (Xing et al. Citation2017a). Additionally, Geo-AI can harness multisource geographic data, including CGI, to perform comprehensive analyses. Geo-AI is particularly adept at automatically recognizing and extracting detailed geographic features, LULC types, and object classifications with higher accuracy and comprehensiveness (Wang and Li Citation2021, Zhang et al. Citation2023a, Hoffmann et al. Citation2023). For example, by integrating building and POI data, Yang et al. (Citation2022) designed a stacking ensemble model that automatically classified urban functional regions, achieving an accuracy of 86.83%. However, the application of Geo-AI in LULC mapping is not without limitations. Training and modeling with Geo-AI require extensive data that is accurately labelled with LULC domain-specific information, as well as significant geographic expertise. These requirements pose challenges to the development and deployment of effective Geo-AI models, particularly in terms of data sufficiency and the need for specialized knowledge.
The emergence of large language models (LLMs) such as OpenAI's ChatGPT-4 and Google’s LaMDA has sparked widespread discussion in the GIS community (Zhu et al. Citation2024). In the context of LULC mapping using CGI, LLMs offer several advantages over traditional Geo-AI models. First, LLMs understand the grammar, semantics, and context of natural language in CGI data through extensive pretraining (Veres Citation2022). For example, social media posts such as ‘It’s a beautiful day. Let’s enjoy the sunshine outside’, ‘This place is ideal for a picnic’, and ‘Perfect place for kids playing soccer here’, allow LLMs to not only identify the LULC type as likely grassland but also gauge the popularity of these venues. This deeper understanding enriches LULC interpretation. Second, LLMs go beyond simple ‘fill-in-the-blank’ models by leveraging their vast exposure to online data, allowing them to reason and infer common sense (Singhal et al. Citation2023). For instance, provided with a POI labeled ‘golf course’, LLMs can infer the presence of buildings, grasslands, and artificial lakes, easing the task of feature extraction for LULC mapping. Third, LLMs can process multiple data formats, not just text, enabling them to generate comprehensive LULC information from CGI (Tian et al. Citation2023). For example, when a tourist shares an image on a CGI website of fishing activities near a log-cabin hotel, LLMs can identify the presence of a water body and relevant signage, aiding in locating the photograph. By integrating both visual and textual data, LLMs develop a comprehensive understanding of the geographical context, providing valuable insights for LULC mapping using CGI. Fourth, LLMs constantly improve themselves through user interaction and continuous input, gradually enhancing their performance without the need for retraining the entire model. This adaptability allows them to quickly adjust to different LULC mapping tasks (Choi Citation2023). In scenarios involving dynamic land-use types such as farmland, which undergo seasonal changes, LLMs might initially misclassify them as bare land, particularly in the absence of visible vegetation. However, through continuous user interactions, exposure to images and language generated at different times that display crop growth stages, LLMs are able to iteratively refine their understanding of the scene. This adaptive process enables LLMs to enhance their proficiency in comprehending diverse LULC mapping tasks without necessitating complete model retraining.
In summary, integrating LLMs with GIS significantly enhances LULC mapping using CGI. The abilities of LLMs to understand natural language, apply reasoning of common sense, process diverse data formats, and self-learning autonomously provide valuable insights into LULC mapping tasks. While still in the early stages, the integration of LLMs in LULC mapping holds promise for further advancements in AI technology and interdisciplinary collaboration.
6. Conclusions and future directions
This review has explored the increasing interest in applying CGI for LULC mapping, delving into several key features identified in 262 selected papers. We have highlighted the leading researchers, study areas, popular CGI data sources, mapping methods, and the various levels at which LULC studies are conducted. The benefits and drawbacks of different CGI data sources and mapping methods were addressed, alongside discussions on challenges and future opportunities. The main conclusions are as follows:
Europe and China are leading in CGI-related LULC mapping research density and intensity, respectively, indicating the widespread accessibility and popularity of CGI in these areas.
OSM data and POIs from online maps are the most favored CGI data sources for LULC mapping, prized for their accessibility and ease of use.
Key methods for LULC mapping with CGI include spatial analysis, supervised classification, and unsupervised classification. Techniques such as ensemble learning and deep learning, within supervised classification, are particularly effective for extracting latent features and modeling nonlinear relationships in LULC mapping.
LULC mapping can be conducted at macro-, meso-, and micro-levels, reflecting the scope of spatial granularity. The greater the spatial granularity, the larger the extent of the LULC mapping. The combination of CGI with high-resolution remote sensing imagery has led to new mapping techniques.
There is promising potential in enhancing the use of CGI for LULC mapping by leveraging the capabilities of LLMs in natural language comprehension, common sense reasoning, multi-format data processing, and autonomous learning.
Despite significant contributions from existing studies on CGI-based LULC mapping, future research needs to address several challenges:
Exploring vertical LULC mapping is crucial as urban development increasingly features high-rise buildings and vertical mixed-use spaces, which are pivotal for optimizing space efficiency, convenience, accessibility, and fostering community interaction. The potential of CGI data, aided by Geo-AI, to analyze geometric profiles or vertical land-use information remains largely untapped.
CGI-based LULC mapping in small cities and rural areas. While studies utilizing CGI for LULC mapping in small cities and rural areas is less frequent than in large urban centers, despite the critical need for detailed LULC information in these regions. Rural areas and small towns often possess unique cultural, historical, and environmental characteristics vital for local communities to preserve. Accurate and current LULC mapping can identify areas of significance, such as heritage sites, farmlands, green spaces, and natural habitats, warranting further exploration.
Disclosure statement
No potential conflict of interest was reported by the author(s).
Data and codes availability statement
The data and codes that support the findings of this study are available at https://doi.org/10.6084/m9.figshare.24619077.
Additional information
Funding
Notes on contributors
Hao Wu
Hao Wu is currently a Professor at the College of Urban and Environmental Sciences, Central China Normal University. His research interests focus on land use change, environment monitoring and simulation, and volunteer geographic information. He contributed to conceptualization of the research idea, supervision and editing.
Yan Li
Yan Li received her Master’s degree from Wuhan University of Technology. She is currently pursuing the PhD degree at the Central China Normal University. Her research interests include land use mapping with VGI data, land use change and ecological modelling, spatial scale effect analysis. She contributed to writing, investigation and data analysis.
Anqi Lin
Anqi Lin is currently an associate professor at Central China Normal University, Wuhan, China. She received her PhD degree in geographic information system from Central China Normal University. Her research interests include spatial big data mining, land use mapping, and VGI quality assessment. She contributed to writing and data validation.
Hongchao Fan
Hongchao Fan is currently a Professor at Department of Civil and Environmental Engineering, Norwegian University of Science and Technology. His research interests focus on 3D city modeling, Spatial data mining and knowledge discovering by using crowdsourcing data. He contributed to conceptualization of the research idea and supervision.
Kaixuan Fan
Kaixuan Fan received his Master’s degree in Geographic information science from South China Normal University. He is currently pursuing the PhD degree at the Central China Normal University. His research interests include 3D urban modelling using street view images, GeoAI analysis on urban environment. He contributed to data analysis and visualization.
Junyang Xie
Junyang Xie received his Master’s degree in Geographic information science from Chengdu University of Technology. He is currently pursuing the PhD degree at the Central China Normal University. His research interests include object detection using remote sensing images, and deep learning algorithm. He contributed to data analysis and visualization.
Wenting Luo
Wenting Luo received her Master’s degree in Geographic information science from the Central China Normal University. Her research interests are big data analysis and land use simulation. She contributed to data analysis and visualization.
References
- Alialy, R., et al., 2018. A review on the applications of crowdsourcing in human pathology. Journal of Pathology Informatics, 9 (1), 2.
- Andrade, R., Alves, A., and Bento, C., 2020. POI mining for land use classification: a case study. ISPRS International Journal of Geo-Information, 9 (9), 493.
- Antoniou, V., et al., 2016. Investigating the feasibility of geo-tagged photographs as sources of land cover input data. ISPRS International Journal of Geo-Information, 5 (5), 64.
- Anugraha, A.S., Chu, H.-J., and Ali, M.Z., 2020. Social sensing for urban land use identification. ISPRS International Journal of Geo-Information, 9 (9), 550.
- Arsanjani, J.J., et al., 2013. Toward mapping land-use patterns from volunteered geographic information. International Journal of Geographical Information Science, 27 (12), 2264–2278.
- Arsanjani, J.J., and Vaz, E., 2015. An assessment of a collaborative mapping approach for exploring land use patterns for several European metropolises. International Journal of Applied Earth Observation and Geoinformation, 35, 329–337.
- Baer, M.F., Wartmann, F.M., and Purves, R.S., 2019. StarBorn: towards making in-situ land cover data generation fun with a location-based game. Transactions in GIS, 23 (5), 1008–1028.
- Bai, L., et al., 2023. Geographic mapping with unsupervised multi-modal representation learning from VHR images and POIs. ISPRS Journal of Photogrammetry and Remote Sensing, 201, 193–208.
- Bao, H., et al., 2020. DFCNN-based semantic recognition of urban functional zones by integrating remote sensing data and POI data. Remote Sensing, 12 (7), 1088.
- Barrington-Leigh, C., and Millard-Ball, A., 2017. The world’s user-generated road map is more than 80% complete. PLoS One, 12 (8), e0180698.
- Berke, P., et al., 2021. Using a resilience scorecard to improve local planning for vulnerability to hazards and climate change: an application in two cities. Cities, 119 (12), 103408.
- Bogaert, P., and Gengler, S., 2018. Bayesian maximum entropy and data fusion for processing qualitative data: theory and application for crowdsourced cropland occurrences in Ethiopia. Stochastic Environmental Research and Risk Assessment, 32 (3), 815–831.
- Boucher, C., and Noyer, J.-C., 2017. A general framework for 3-D parameters estimation of roads using GPS, OSM and DEM Data. Sensors, 18 (1), 41.
- Brown, G., 2013. Relationships between spatial and non-spatial preferences and place-based values in national forests. Applied Geography, 44, 1–11.
- Brown, G., Kelly, M., and Whitall, D., 2014. Which 'public’? Sampling effects in public participation GIS (PPGIS) and volunteered geographic information (VGI) systems for public lands management. Journal of Environmental Planning and Management, 57 (2), 190–214.
- Calabrese, F., et al., 2013. Understanding individual mobility patterns from urban sensing data: a mobile phone trace example. Transportation Research Part C: Emerging Technologies, 26, 301–313.
- Camboim, S.P., Bravo, J.V.M., and Sluter, C.R., 2015. An investigation into the completeness of, and the updates to, OpenStreetMap data in a Heterogeneous area in Brazil. ISPRS International Journal of Geo-Information, 4 (3), 1366–1388.
- Cao, R., et al., 2020. Deep learning-based remote and social sensing data fusion for urban region function recognition. Isprs Journal of Photogrammetry and Remote Sensing, 163, 82–97.
- Cao, S., et al., 2021. Functional classification of urban parks based on urban functional zone and crowd-sourced geographical data. ISPRS International Journal of Geo-Information, 10 (12), 824.
- Chang, S., et al., 2020. Mapping the essential urban land use in Changchun by applying random forest and multi-source geospatial data. Remote Sensing, 12 (15), 2488.
- Chen, D., et al., 2022. A hierarchical approach for fine-grained urban villages recognition fusing remote and social sensing data. International Journal of Applied Earth Observation and Geoinformation, 106, 102661.
- Chen, Y., et al., 2021. Automatic mapping of urban green spaces using a geospatial neural network. Giscience & Remote Sensing, 58 (4), 624–642.
- Chen, Y., et al., 2023a. Mapping urban functional areas using multi-source remote sensing images and open big data. IEEE Journal of Selected Topics in Applied Earth Observations and Remote Sensing, 16, 7919–7931.
- Chen, Y., et al., 2023b. Quality assessment of global ocean island datasets. ISPRS International Journal of Geo-Information, 12 (4), 168.
- Chen, Y.M., et al., 2017. Delineating urban functional areas with building-level social media data: a dynamic time warping (DTW) distance based k-medoids method. Landscape and Urban Planning, 160, 48–60.
- Choi, W., 2023. Assessment of the capacity of ChatGPT as a self-learning tool in medical pharmacology: a study using MCQs. BMC Medical Education, 23 (1), 864.
- Comber, A., et al., 2016. Crowdsourcing: it matters who the crowd are. The impacts of between group variations in recording land cover. PLoS One, 11 (7), e0158329.
- Cui, L., et al., 2022. The verification of land cover datasets with the geo-tagged natural scene images. ISPRS International Journal of Geo-Information, 11 (11), 567.
- Dell’acqua, F., et al., 2018. A novel strategy for very-large-scale cash-crop mapping in the context of weather-related risk assessment, combining global satellite multispectral datasets, environmental constraints, and in situ acquisition of geospatial data. Sensors, 18 (2), 591.
- Deng, Y., and He, R., 2022. Refined urban functional zone mapping by integrating open-source data. ISPRS International Journal of Geo-Information, 11 (8), 421.
- Donchyts, G., et al., 2016. A 30 m resolution surface water mask including estimation of positional and thematic differences using Landsat 8, SRTM and OpenStreetMap: a case study in the Murray-Darling Basin, Australia. Remote Sensing, 8 (5), 386.
- Dong, X., et al., 2020. Exploring impact of spatial unit on urban land use mapping with multisource data. Remote Sensing, 12 (21), 3597.
- Dorn, H., Vetter, M., and Höfle, B., 2014. GIS-based roughness derivation for flood simulations: a comparison of orthophotos, LiDAR and crowdsourced geodata. Remote Sensing, 6 (2), 1739–1759.
- Du, S., et al., 2020. Large-scale urban functional zone mapping by integrating remote sensing images and open social data. Giscience & Remote Sensing, 57 (3), 411–430.
- Du, Z., Sui, H., and Wang, J., 2021. A novel semantic recognition framework of urban functional zones supporting urban land structure analytics based on open-source data. Transactions in GIS, 25 (3), 1460–1484.
- Elagouz, M.H., et al., 2020. Detection of land use/cover change in Egyptian Nile Delta using remote sensing. The Egyptian Journal of Remote Sensing and Space Science, 23 (1), 57–62.
- Elwood, S., 2008. Volunteered geographic information: key questions, concepts and methods to guide emerging research and practice. GeoJournal, 72 (3-4), 133–135.
- Fan, J., and Thakur, G., 2023. Towards POI-based large-scale land use modeling: spatial scale, semantic granularity, and geographic context. International Journal of Digital Earth, 16 (1), 430–445.
- Fang, H., et al., 2023. Scene-level change detection by integrating VHR images and POI data using a multiple-branch fusion network. Remote Sensing Letters, 14 (8), 808–820.
- Fischer, F., et al., 2012. VGI as big data: a new but delicate geographic data source. GeoInformatics, 3, 46–47.
- Fonte, C.C., et al., 2015. Usability of VGI for validation of land cover maps. International Journal of Geographical Information Science, 29 (7), 1269–1291.
- Fonte, C.C., et al., 2017. Generating up-to-date and detailed land use and land cover maps using OpenStreetMap and GlobeLand30. ISPRS International Journal of Geo-Information, 6 (4), 125.
- Foody, G., et al., 2015. Accurate attribute mapping from volunteered geographic information: issues of volunteer quantity and quality. The Cartographic Journal, 52 (4), 336–344.
- Foody, G.M., and Boyd, D.S., 2013. Using volunteered data in land cover map validation: mapping west african forests. IEEE Journal of Selected Topics in Applied Earth Observations and Remote Sensing, 6 (3), 1305–1312.
- Forget, Y., et al., 2021. Mapping 20 years of urban expansion in 45 urban areas of Sub-Saharan Africa. Remote Sensing, 13 (3), 525.
- Frias-Martinez, V., et al., 2014. Consensus clustering for urban land use analysis using cell phone network data. International Journal of Ad Hoc and Ubiquitous Computing, 17 (1), 39–58.
- Fritz, S., et al., 2012. Geo-Wiki: an online platform for improving global land cover. Environmental Modelling & Software, 31, 110–123.
- Fritz, S., et al., 2017. A global dataset of crowdsourced land cover and land use reference data. Scientific Data, 4 (1), 170075.
- Fyleris, T., et al., 2022. Urban change detection from aerial images using convolutional neural networks and transfer learning. ISPRS International Journal of Geo-Information, 11 (4), 246.
- Gao, S., 2020. A review of recent researches and reflections on geospatial artificial intelligence. Geomatics and Information Science of Wuhan University, 45 (12), 1865– 1874.
- Gong, P., et al., 2020. Mapping essential urban land use categories in China (EULUC-China): preliminary results for 2018. Science Bulletin, 65 (3), 182–187.
- Goodchild, M.F., 2007. Citizens as sensors: the world of volunteered geography. GeoJournal, 69 (4), 211–221.
- Goodchild, M.F., and Li, L.N., 2012. Assuring the quality of volunteered geographic information. Spatial Statistics, 1, 110–120.
- Grippa, T., et al., 2018. Mapping urban land use at street block level using OpenStreetMap, remote sensing data, and spatial metrics. ISPRS International Journal of Geo-Information, 7 (7), 246.
- Guo, Z., Du, S., and Habib, A., 2016. An extended random walker approach for object extraction by integrating VGI data and VHR image. IEEE Journal of Selected Topics in Applied Earth Observations and Remote Sensing, 9 (5), 1854–1863.
- Häberle, M., Hoffmann, E.J., and Zhu, X.X., 2022. Can linguistic features extracted from geo-referenced tweets help building function classification in remote sensing? Isprs Journal of Photogrammetry and Remote Sensing, 188, 255–268.
- Hagenauer, J., and Helbich, M., 2012. Mining urban land-use patterns from volunteered geographic information by means of genetic algorithms and artificial neural networks. International Journal of Geographical Information Science, 26 (6), 963–982.
- Hoffmann, E.J., Abdulahhad, K., and Zhu, X.X., 2023. Using social media images for building function classification. Cities, 133, 104107.
- Howe, J., 2006. The rise of crowdsourcing. Wired Mag, 14 (6), 1–4.
- Hu, T., et al., 2016. Mapping urban land use by using landsat images and open social data. Remote Sensing, 8 (2), 151.
- Huang, W., et al., 2022b. Estimating urban functional distributions with semantics preserved POI embedding. International Journal of Geographical Information Science, 36 (10), 1905–1930.
- Huang, X., et al., 2022c. Mapping 10 m global impervious surface area (GISA-10m) using multi-source geospatial data. Earth System Science Data, 14 (8), 3649–3672.
- Huang, X., et al., 2023. Land cover mapping via crowdsourced multi-directional views: the more directional views, the better. International Journal of Applied Earth Observation and Geoinformation, 122, 103382.
- Huang, Z., et al., 2020. An ensemble learning approach for urban land use mapping based on remote sensing imagery and social sensing data. Remote Sensing, 12 (19), 3254.
- Huang, L., Xiang, S., and Zheng, J., 2022a. Fine-scale monitoring of industrial land and its intra-structure using remote sensing images and POIs in the Hangzhou Bay Urban Agglomeration, China. International Journal of Environmental Research and Public Health, 20 (1), 226.
- Hughes, L.H., et al., 2019. A cluster graph approach to land cover classification boosting. Data, 4 (1), 10.
- Iranmanesh, A., Cömert, N.Z., and Hoşkara, ŞÖ., 2022. Reading urban land use through spatio-temporal and content analysis of geotagged Twitter data. GeoJournal, 87 (4), 2593–2610.
- ISO 2002. ISO 19113: 2002. Geographic information—quality principles. Geneva: ISO.
- Jarvis, R.M., et al., 2016. Identifying diverse conservation values for place-based spatial planning using crowdsourced voluntary geographic information. Society & Natural Resources, 29 (5), 603–616.
- Jiang, S., et al., 2015. Mining point-of-interest data from social networks for urban land use classification and disaggregation. Computers Environment and Urban Systems, 53, 36–46.
- Jiao, H., Huang, S., and Zhou, Y., 2023. Understanding the land use function of station areas based on spatiotemporal similarity in rail transit ridership: a case study in Shanghai, China. Journal of Transport Geography, 109, 103568.
- Ju, Y., Dronova, I., and Delclòs-Alió, X., 2022. A 10 m resolution urban green space map for major Latin American cities from Sentinel-2 remote sensing images and OpenStreetMap. Scientific Data, 9 (1), 586.
- Kang, J., et al., 2018. Building instance classification using street view images. Isprs Journal of Photogrammetry and Remote Sensing, 145, 44–59.
- Keßler, C., and De Groot, R. T. A., 2013. Trust as a proxy measure for the quality of volunteered geographic information in the case of OpenStreetMap. In: Vandenbroucke, D., Bucher, B. and Crompvoets, J. eds. Geographic Information Science at the Heart of Europe. Cham: Springer International Publishing, 21–37.
- Kunze, C., and Hecht, R., 2015. Semantic enrichment of building data with volunteered geographic information to improve mappings of dwelling units and population. Computers Environment and Urban Systems, 53, 4–18.
- Laso Bayas, J.C., et al., 2020. Crowdsourcing LUCAS: citizens generating reference land cover and land use data with a mobile app. Land, 9 (11), 446.
- Lee, J.Y., et al., 2022. Mapping sugarcane in central India with smartphone crowdsourcing. Remote Sensing, 14 (3), 703.
- Lee, S., and Son, Y., 2023. Mapping of user-perceived landscape types and spatial distribution using crowdsourced photo data and machine learning: focusing on Taeanhaean National Park. Journal of Outdoor Recreation and Tourism, 44, 100616.
- Leinenkugel, P., et al., 2019. The potential of open geodata for automated large-scale land use and land cover classification. Remote Sensing, 11 (19), 2249.
- Lesiv, M., et al., 2016. Comparison of data fusion methods using crowdsourced data in creating a hybrid forest cover map. Remote Sensing, 8 (3), 261.
- Li, H., et al., 2020. RSI-CB: a large-scale remote sensing image classification benchmark using crowdsourced data. Sensors, 20 (6), 1594.
- Li, H., et al., 2021a. Automatic mapping of national surface water with OpenStreetMap and Sentinel-2 MSI data using deep learning. International Journal of Applied Earth Observation and Geoinformation, 104, 102571.
- Li, W., 2021. Mapping urban land use by combining multi-source social sensing data and remote sensing images. Earth Science Informatics, 14 (3), 1537–1545.
- Li, X., et al., 2021b. Mapping essential urban land use categories in Beijing with a fast area of interest (AOI)-Based method. Remote Sensing, 13 (3), 477.
- Lin, A., et al., 2021. Identifying urban building function by integrating remote sensing imagery and POI data. IEEE Journal of Selected Topics in Applied Earth Observations and Remote Sensing, 14, 8864–8875.
- Lin, A., et al., 2024a. An MIU-based deep embedded clustering model for urban functional zoning from remote sensing images and VGI data. International Journal of Applied Earth Observation and Geoinformation, 128, 103689.
- Lin, A., et al., 2024b. How does urban heat island differ across urban functional zones? Insights from 2D/3D urban morphology using geospatial big data. Urban Climate, 53, 101787.
- Liu, D., et al., 2020a. Annual large-scale urban land mapping based on Landsat time series in Google Earth Engine and OpenStreetMap data: a case study in the middle Yangtze River basin. Isprs Journal of Photogrammetry and Remote Sensing, 159, 337–351.
- Liu, H., et al., 2020b. Recognizing urban functional zones by a hierarchical fusion method considering landscape features and human activities. Transactions in GIS, 24 (5), 1359–1381.
- Liu, L., et al., 2021. A data fusion-based framework to integrate multi-source VGI in an authoritative land use database. International Journal of Digital Earth, 14 (4), 480–509.
- Liu, R., et al., 2022. Feature recognition of urban industrial land renewal based on POI and RS data: the case of Beijing. Frontiers in Environmental Science, 10, 890571.
- Liu, X., et al., 2016. Incorporating spatial interaction patterns in classifying and understanding urban land use. International Journal of Geographical Information Science, 30 (2), 334–350.
- Liu, X., et al., 2017. Classifying urban land use by integrating remote sensing and social media data. International Journal of Geographical Information Science, 31 (8), 1675–1696.
- Liu, X.P., et al., 2018. Characterizing mixed-use buildings based on multi-source big data. International Journal of Geographical Information Science, 32 (4), 738–756.
- Liu, Z., 2021. Identifying urban land use social functional units: a case study using OSM data. International Journal of Digital Earth, 14 (12), 1798–1817.
- Liu, X., and Long, Y., 2016. Automated identification and characterization of parcels with OpenStreetMap and points of interest. Environment and Planning B: Planning and Design, 43 (2), 341–360.
- Lu, W., et al., 2022. A unified deep learning framework for urban functional zone extraction based on multi-source heterogeneous data. Remote Sensing of Environment, 270, 112830.
- Luo, N., et al., 2019. Fusing high-spatial-resolution remotely sensed imagery and OpenStreetMap data for land cover classification over urban areas. Remote Sensing, 11 (1), 88.
- Malinverni, E.S., et al., 2011. Hybrid object-based approach for land use/land cover mapping using high spatial resolution imagery. International Journal of Geographical Information Science, 25 (6), 1025–1043.
- Manley, K., and Egoh, B.N., 2022. Mapping and modeling the impact of climate change on recreational ecosystem services using machine learning and big data. Environmental Research Letters, 17 (5), 054025.
- Mao, H., et al., 2017. Improving land use inference by factorizing mobile phone call activity matrix. Journal of Land Use Science, 12 (2-3), 138–153.
- Martínez, S., and Mollicone, D., 2012. From land cover to land use: a methodology to assess land use from remote sensing data. Remote Sensing, 4 (4), 1024–1045.
- Meng, Y., Hou, D., and Xing, H., 2017. Rapid detection of land cover changes using crowdsourced geographic information: a case study of Beijing, China. Sustainability, 9 (9), 1547.
- Neis, P., Zielstra, D., and Zipf, A., 2013. Comparison of volunteered geographic information data contributions and community development for selected world regions. Future Internet, 5 (2), 282–300.
- Nie, W., et al., 2022. Building function type identification using mobile signaling data based on a machine learning method. Remote Sensing, 14 (19), 4697.
- Niu, H.F., and Silva, E.A., 2020. Crowdsourced data mining for urban activity: review of data sources, applications, and methods. Journal of Urban Planning and Development, 146 (2), 04020007.
- O’driscoll, C., et al., 2023. Measuring land-use mixing across the republic of Ireland: source data comparisons. Journal of Maps, 19 (1), 2214165.
- Olteanu-Raimond, A.M., et al., 2020. Use of automated change detection and VGI Sources for identifying and validating urban land use change. Remote Sensing, 12 (7), 1186.
- Parekh, J.R., et al., 2021. Automatic detection of impervious surfaces from remotely sensed data using deep learning. Remote Sensing, 13 (16), 3166.
- Pei, T., et al., 2014. A new insight into land use classification based on aggregated mobile phone data. International Journal of Geographical Information Science, 28 (9), 1988–2007.
- Psyllidis, A., et al., 2022. Points of interest (POI): a commentary on the state of the art, challenges, and prospects for the future. Computational Urban Science, 2 (1), 20.
- Qian, T., et al., 2020a. Analyzing the uncertainty of degree confluence project for validating global land-cover maps using reference data-based classification schemes. Remote Sensing, 12 (16), 2589.
- Qian, Z., et al., 2020b. Identification of urban functional areas by coupling satellite images and taxi GPS trajectories. Remote Sensing, 12 (15), 2449.
- Ran, Y.H., et al., 2012. Large-scale land cover mapping with the integration of multi-source information based on the Dempster-Shafer theory. International Journal of Geographical Information Science, 26 (1), 169–191.
- Ratti, C., et al., 2006. Mobile landscapes: using location data from cell phones for urban analysis. Environment and Planning B: Planning and Design, 33 (5), 727–748.
- Saralioglu, E., and Gungor, O., 2022. Semantic segmentation of land cover from high resolution multispectral satellite images by spectral-spatial convolutional neural network. Geocarto International, 37 (2), 657–677.
- Schepaschenko, D., et al., 2015a. Development of a global hybrid forest mask through the synergy of remote sensing, crowdsourcing and FAO statistics. Remote Sensing of Environment, 162, 208–220.
- Schepaschenko, D., et al., 2015b. Estimation of forest area and its dynamics in Russia based on synthesis of remote sensing products. Contemporary Problems of Ecology, 8 (7), 811–817.
- Schmidt, S., and Barron, C., 2020. Mapping impervious surfaces precisely-a GIS-based methodology combining vector data and high-resolution airborne imagery. Journal of Geovisualization and Spatial Analysis, 4 (1), 14.
- See, L., et al., 2015. Building a hybrid land cover map with crowdsourcing and geographically weighted regression. Isprs Journal of Photogrammetry and Remote Sensing, 103, 48–56.
- See, L., et al., 2016. Crowdsourcing, citizen science or volunteered geographic information? The current state of crowdsourced geographic information. ISPRS International Journal of Geo-Information, 5 (5), 55.
- Senaratne, H., et al., 2017. A review of volunteered geographic information quality assessment methods. International Journal of Geographical Information Science, 31 (1), 139–167.
- Sheeja, R.V., et al., 2011. Land use and land cover changes over a century (1914-2007) in the Neyyar River Basin, Kerala: a remote sensing and GIS approach. International Journal of Digital Earth, 4 (3), 258–270.
- Shi, Y., et al., 2019. Urban land use and land cover classification using multisource remote sensing images and social media data. Remote Sensing, 11 (22), 2719.
- Singhal, K., et al., 2023. Large language models encode clinical knowledge. Nature, 620 (7972), 172–180.
- Soliman, A., et al., 2017. Social sensing of urban land use based on analysis of Twitter users’ mobility patterns. PLoS One, 12 (7), e0181657.
- Song, Z., et al., 2022. Building-level urban functional area identification based on multi-attribute aggregated data from cell phones-a method combining multidimensional time series with a SOM neural network. ISPRS International Journal of Geo-Information, 11 (2), 72.
- Spatharioti, S.E., et al., 2022. An effective online platform for crowd classification of coastal wetland loss. Conservation Science and Practice, 5 (1), e12844.
- Stefanidis, A., Crooks, A., and Radzikowski, J., 2013. Harvesting ambient geospatial information from social media feeds. GeoJournal, 78 (2), 319–338.
- Su, W., Sui, D., and Zhang, X.D., 2020. Satellite image analysis using crowdsourcing data for collaborative mapping: current and opportunities. International Journal of Digital Earth, 13 (6), 645–660.
- Sun, J., et al., 2020. Mapping essential urban land use categories in Nanjing by integrating multi-source big data. Remote Sensing, 12 (15), 2386.
- Sun, Z., et al., 2022. Deep convolutional autoencoder for urban land use classification using mobile device data. International Journal of Geographical Information Science, 36 (11), 2138–2168.
- Sun, Z., et al., 2023. Recognizing urban functional zones by GF-7 satellite stereo imagery and POI data. Applied Sciences, 13 (10), 6300.
- Tenerelli, P., Demšar, U., and Luque, S., 2016. Crowdsourcing indicators for cultural ecosystem services: a geographically weighted approach for mountain landscapes. Ecological Indicators, 64, 237–248.
- Tian, D.Z., et al., 2023. The role of large language models in medical image processing: a narrative review. Quantitative Imaging in Medicine and Surgery, 14 (1), 1108–1121.
- Truong, Q.T., De Runz, C., and Touya, G., 2019. Analysis of collaboration networks in OpenStreetMap through weighted social multigraph mining. International Journal of Geographical Information Science, 33 (8), 1651–1682.
- Tu, W., et al., 2017. Coupling mobile phone and social media data: a new approach to understanding urban functions and diurnal patterns. International Journal of Geographical Information Science, 31 (12), 2331–2358.
- Vaz, E., and Arsanjani, J.J., 2015. Crowdsourced mapping of land use in urban dense environments: an assessment of Toronto. Canadian Geographies / Géographies Canadiennes, 59 (2), 246–255.
- Veres, C., 2022. Large language models are not models of natural language: they are corpus models. IEEE Access., 10, 61970–61979.
- Wang, S., et al., 2020. Mapping crop types in southeast India with smartphone crowdsourcing and deep learning. Remote Sensing, 12 (18), 2957.
- Wang, Y., et al., 2016. Mapping dynamic urban land use patterns with crowdsourced geo-tagged social media (sina-weibo) and commercial points of interest collections in Beijing, China. Sustainability, 8 (11), 1202.
- Wang, Y.J., et al., 2014. Using a remote sensing driven model to analyze effect of land use on soil moisture in the Weihe River Basin, China. IEEE Journal of Selected Topics in Applied Earth Observations and Remote Sensing, 7 (9), 3892–3902.
- Wang, S., and Li, W., 2021. GeoAI in terrain analysis: enabling multi-source deep learning and data fusion for natural feature detection. Computers, Environment and Urban Systems, 90, 101715.
- Wu, H., et al., 2021. Identifying core driving factors of urban land use change from global land cover products and POI data using the random forest method. International Journal of Applied Earth Observation and Geoinformation, 103, 102475.
- Wu, H., et al., 2023. SALT: A multifeature ensemble learning framework for mapping urban functional zones from VGI data and VHR images. Computers Environment and Urban Systems, 100, 101921.
- Xia, N., Cheng, L., and Li, M., 2019. Mapping urban areas using a combination of remote sensing and geolocation data. Remote Sensing, 11 (12), 1470.
- Xie, L., et al., 2022. Identification of urban functional areas based on the multimodal deep learning fusion of high-resolution remote sensing images and social perception data. Buildings, 12 (5), 556.
- Xing, H., et al., 2017a. Exploring point-of-interest data from social media for artificial surface validation with decision trees. International Journal of Remote Sensing, 38 (23), 6945–6969.
- Xing, H., et al., 2017b. Employing crowdsourced geographic information to classify land cover with spatial clustering and topic model. Remote Sensing, 9 (6), 602.
- Xu, S., et al., 2020. A new remote sensing images and point-of-interest fused (RPF) model for sensing urban functional regions. Remote Sensing, 12 (6), 1032.
- Xu, X., et al., 2022. Fine-resolution mapping of the circumpolar arctic man-made impervious areas (CAMI) using sentinels, OpenStreetMap and ArcticDEM. Big Earth Data., 6 (2), 196–218.
- Yan, J., et al., 2023. Identification of secondary functional areas and functional structure analysis based on multisource geographic data. Geocarto International, 38 (1), 2191995.
- Yan, Y., et al., 2020. Volunteered geographic information research in the first decade: a narrative review of selected journal articles in GIScience. International Journal of Geographical Information Science, 34 (9), 1765–1791.
- Yang, M., et al., 2022. Classifying urban functional regions by integrating buildings and points-of-interest using a stacking ensemble method. International Journal of Applied Earth Observation and Geoinformation, 108, 102753.
- Yang, X., Bo, S., and Zhang, Z., 2023a. Classifying urban functional zones based on modeling POIs by deepwalk. Sustainability, 15 (10), 7995.
- Yang, X., Yang, Y., and Zheng, X., 2023b. Classifying urban functional zones by integrating POIs, Place2vec, and LDA. Journal of Urban Planning and Development, 149 (4), 04023034.
- Yan, Y., Schultz, M., and Zipf, A., 2019. An exploratory analysis of usability of flickr tags for land use/land cover attribution. Geo-Spatial Information Science, 22 (1), 12–22.
- Ye, Y., et al., 2020. Land use classification from social media data and satellite imagery. The Journal of Supercomputing, 76 (2), 777–792.
- Yin, J.D., et al., 2021. Integrating remote sensing and geospatial big data for urban land use mapping: a review. International Journal of Applied Earth Observation and Geoinformation, 103, 102514.
- Yu, Y., et al., 2018. Urban impervious surface estimation from remote sensing and social data. Photogrammetric Engineering & Remote Sensing, 84 (12), 771–780.
- Yu, Z., Xiao, Z., and Liu, X., 2022. A data-driven perspective for sensing urban functional images: place-based evidence in Hong Kong. Habitat International, 130, 102707.
- Zhang, H., et al., 2021. Using social media to measure and map visitation to public lands in Utah. Applied Geography, 128, 102389.
- Zhang, X., et al., 2020. A New approach to refining land use types: predicting point-of-interest categories using weibo check-in data. ISPRS International Journal of Geo-Information, 9 (2), 124.
- Zhang, X.C., et al., 2023a. Inferring building function: a novel geo-aware neural network supporting building-level function classification. Sustainable Cities and Society, 89, 104349.
- Zhang, Y., et al., 2017. The combined use of remote sensing and social sensing data in fine-grained urban land use mapping: a case study in Beijing, China. Remote Sensing. Remote Sensing, 9 (9), 865.
- Zhang, Y., Liu, P., and Biljecki, F., 2023b. Knowledge and topology: a two layer spatially dependent graph neural networks to identify urban functions with time-series street view image. ISPRS Journal of Photogrammetry and Remote Sensing, 198, 153–168.
- Zhao, Y., et al., 2023. Multi-type features embedded deep learning framework for residential building prediction. ISPRS International Journal of Geo-Information, 12 (9), 356.
- Zhong, Y., et al., 2023. Global urban high-resolution land-use mapping: from benchmarks to multi-megacity applications. Remote Sensing of Environment, 298, 113758.
- Zhou, Q., and Jing, X., 2022. Evaluation and comparison of open and high-resolution LULC datasets for urban blue space mapping. Remote Sensing, 14 (22), 5764.
- Zhou, Q., Wang, S.Z., and Liu, Y. M., 2022. Exploring the accuracy and completeness patterns of global land-cover/land-use data in OpenStreetMap. Applied Geography, 145, 102742.
- Zhu, J., et al., 2024. A flood knowledge-constrained large language model interactable with GIS: enhancing public risk perception of floods. International Journal of Geographical Information Science, 38 (4), 603–625.
- Zhu, L., et al., 2021. Using eco-geographical zoning data and crowdsourcing to improve the detection of spurious land cover changes. Remote Sensing, 13 (16), 3244.
- Zhuo, L., et al., 2019. Identifying building functions from the spatiotemporal population density and the interactions of people among buildings. ISPRS International Journal of Geo-Information, 8 (6), 247.
- Zielstra, D., and Hochmair, H.H., 2013. Positional accuracy analysis of Flickr and Panoramio images for selected world regions. Journal of Spatial Science, 58 (2), 251–273.
- Zong, L., et al., 2020. Detailed mapping of urban land use based on multi-source data: a case study of lanzhou. Remote Sensing, 12 (12), 1987.