
Abstract
Measuring organisational culture is important for detecting the values and practices that increase organisational risk (e.g., unethical conduct). Self-report methods (e.g., surveys) are mostly used to study culture: however, due to reporting biases and sampling limitations, and the rapid advance of digital data, researchers have proposed unobtrusive indicators of culture (UICs; e.g., drawn from social media, company reports, executive data) as a supplementary methodology for identifying organisations at risk of failure. A UIC is a single measure of organisational culture drawn from data collected without engaging employees, and research using UICs is in its nascent stage. Although various data sources have been established for studying culture unobtrusively, researchers have yet to explore the application of multiple UICs drawn from different data sources. To investigate this, we developed an experimental battery of 83 UICs drawn from seven data sources (e.g., company earnings calls, employee online reviews, executive data), applying diverse analyses (e.g., natural language processing, quantitative analysis of behavioural data) to measure eight dimensions of culture (e.g., governance, integrity). We then applied the battery to assess 312 large European companies. We found that the UICs could distinguish between companies and different industries, and one dimension (customer focus) was associated with an outcome variable commonly used in culture research (Return on Capital Employed). However, we were not able to establish a coherent set of statistically reliable dimensions due to the clustering of UICs by data source. This clustering likely occurred because data sources reflected the values and practices of different stakeholders (e.g., employees, managers), which underscores a conceptualisation of culture that is focused less on shared values across an institution, and more on the values, priorities, and practices experienced by different sub-groups. Future research could structure UICs according to data sources and apply UICs to examine the causes of organisational failure.
Organisational culture refers to the shared assumptions, values, and beliefs that characterise an organisation and influence behaviour (Schneider, Ehrhart, and Macey Citation2013). Research and theory have identified organisational culture as a key indicator of the organisational practices that lead to institutional failures (e.g., bankruptcies, scandals, accidents, strikes) (Leaver and Reader Citation2019; Ring et al. Citation2016; Sims and Brinkmann Citation2003). As such, organisations across many sectors apply culture measurement to identify and understand their risks, and to facilitate culture change. Surveys have become the predominant approach to studying organisational culture and are used to benchmark organisations in order to determine good practice and potential problems (Jung et al. Citation2009).
Increasingly, however, researchers have been turning to digital data (e.g., online company reports, social media, executive data) to study organisational culture. The measures generated using these sources are termed ‘unobtrusive’ because they draw on naturally occurring data without having to engage employees (Reader et al. Citation2020). Unobtrusive culture measurements potentially address the limitations of self-report data (e.g., requiring institutional access, reporting biases), which become more pronounced in a poor culture. Therefore, such measures are potentially useful for risk research, for instance, to identify companies with problems in ethical conduct, employee management, or governance. However, to date, research using unobtrusive data to study culture has been disparate and piecemeal; the measures have been diverse, generated in different contexts, drawn from different data sources, studied in isolation rather than in combination, and rarely considered in terms of providing a conceptually coherent or valid assessment of culture.
To explore this approach further, in the current study, we developed and tested an experimental battery of unobtrusive indicators for investigating organisational culture.
Organisational culture and risk
Definitions of organisational culture have focused on the values, norms, and practices that are commonplace, shared, and significant in an organisation (Schneider, Ehrhart, and Macey Citation2013). Schein’s seminal framework underpins the research and theory on organisational culture, and consists of three levels: 1) artefacts, which refer to the rituals, language, systems, procedures, stories, and arrangement of space within an organisation; 2) espoused values, which are the ‘strategies, goals, and philosophies (espoused justifications)’ that guide behaviour (Schein Citation1999, 21); and 3) underlying assumptions, which are the ‘unconscious, taken for granted beliefs, perceptions, thoughts, and feelings… (ultimate source of values and action)’ that are non-confrontable and non-debatable, and that guide group members’ perceptions, thoughts, feelings, and behaviour (Schein Citation1999, 21).
Approaches to studying and theorising organisational culture differ according to the discipline, with models variously focusing on systems of shared values, the transmission and construction of culture, and the ways in which culture shapes behaviour and propagates itself (Giorgi, Lockwood, and Glynn Citation2015). This diversity of methods reflects the long-standing distinction between qualitative and quantitative traditions of culture research (Morris et al. Citation1999). Qualitative methods (e.g., ethnographies, interviews) have adopted a native-view paradigm to explore how beliefs and assumptions emerge in an organisation, are experienced, and become embedded in institutional processes. Quantitative methods, mostly survey-based, have adopted a functionalist perspective to outline and measure the universal value systems of organisations, and to predict behaviour and performance.
In recent years, surveys have become the predominant approach to culture measurement (Jung et al. Citation2009). This preference is due to the validity and robustness of surveys, the potential to use them at scale (e.g., across institutions and staff groups), and the ability to associate them with other measures (e.g., outcome data). Therefore, research on culture has mostly focused on the layer of ‘espoused values’, with culture conceptualised in terms of ‘the values, beliefs, and assumptions that are held by members of an organisation’ (Denison, Nieminen, and Kotrba Citation2014, 146). Researchers have developed various reliable and robust culture surveys (Chatman and O’Reilly Citation2016), and established associations between culture (e.g., values for customer orientation, adaptability, mission) and organisational outcomes such as sales (Boyce et al. Citation2015), revenue (Chatman et al. Citation2014), and market-to-book ratios (Kotrba et al. Citation2012). However, through measuring shared norms, the widespread use of surveys has arguably reinforced a conceptualisation of organisational culture as shared values, and scholars have contested this model due to the often fragmented nature of culture (e.g., in sub-groups) and the contrasting value systems that can co-exist within an organisation (Howard-Grenville, Lahneman, and Pek Citation2020; Martin Citation1992). Indeed, considering the richness of phenomena (e.g., implicit beliefs, practices, stories, ergonomics, language) enveloped by the concept of organisational culture (Jahoda Citation2012; Schein Citation1999), its conceptualisation as shared values measured by surveys seems somewhat narrow.
Research on organisational culture has influenced the risk research literature through its focus on how a poor or ineffective culture can create risk for an organisation. Where an organisation’s norms and values are negative or weak (e.g., in terms of governance, ethical conduct, workforce management), it is susceptible to poor management, unethical behaviour, risk-taking, and corporate scandals, which can harm stakeholders and jeopardise the organisation’s existence (Ehrenhard and Fiorito Citation2018; Paté‐Cornell 1993; Sims and Brinkmann Citation2003). Examples include the collapse of Carillion due to the unnecessary debt accumulated by the senior management team, the Enron scandal due to the misreporting of financial data, or the manipulation of vehicle emissions data at Volkswagen because of the pressure put on staff. In such cases, the culture established institutional norms whereby senior management were negligent in their duties, fraud was incentivised and encouraged, and staff were pressured to take risks. Furthermore, as illustrated by the research on safety culture and risk culture, values related to organisational risk (e.g., norms for engaging in risky behaviour, management commitment to safety, risk control systems) underlie accidents and failures in risk management (Reader and O’Connor Citation2014; Ring et al. Citation2016).
Given that organisational culture can explain the conditions under which institutional failures occur, scholars have debated over how to effectively measure the values and practices that create risk for organisations. As in the wider organisational culture literature, surveys have been considered a useful approach, for instance, in settings such as banking (Cottrell Citation2018), energy (Mearns, Whitaker, and Flin Citation2001), aviation (Reader et al. Citation2015), and healthcare (Mannion, Konteh, and Davies Citation2009). This is because surveys can capture the perceptions of cultural values across an organisation, which can then be used to identify problematic norms (e.g., speaking-up in teams: Edmondson Citation1999) or groups (Hofstede et al. Citation1990). Despite these qualities, however, survey approaches present significant limitations in detecting the cultural values and practices that create risk.
A key issue is that the cultural conditions that lead to organisational failure – for instance, poor governance, unethical norms, blame and scapegoating, or poor treatment of employees – may influence data collection (Reason Citation2000). Institutions with problematic practices may be unlikely to facilitate access, and, especially if there is minimal trust, staff may be unwilling to participate in culture surveys. Even when access can be secured, other problems emerge. Survey responses may be shaped by impression management, where survey participants attempt to present themselves and their organisation in the best possible light (e.g., to avoid scrutiny) (Bolino et al. Citation2008). Additionally, responses may not be accurate in cases where there is pressure to maintain ‘organisational silence’ (Morrison and Milliken Citation2000, 706) or fear over reporting honestly on the culture. Adding to the complexity, researchers have observed that participant responses to culture surveys are themselves a product of shared norms (McSweeney Citation2002). Consequently, poor practices (e.g., rule-breaking) may be normalised (Vaughan Citation1999) or viewed as necessary (Ramamoorti Citation2008), and therefore not reported as such.
Other issues, such as the timing of surveys, are also important considerations when using self-report data to identify cultural properties that present a risk to organisations. Culture surveys tend to be administered annually or bi-annually. Therefore, it is unclear the extent to which the surveys can reflect dynamic changes in culture (e.g., rapid or slow deterioration). For instance, safety research has shown that even if culture surveys are taken prior to accidents, they do not necessarily capture the problems identified as causal in post-hoc analyses (e.g., incident reporting) (Antonsen Citation2009). Furthermore, as illustrated in rogue trading scandals (e.g., at Barings Bank or Société Générale) (Gilligan Citation2011) or failures in corporate governance (e.g., Carillion, Enron) (Bhaskar and Flower Citation2019), problems may lie in the values and practices of small groups (e.g., senior management). Due to the limited size of the group involved (e.g., senior traders) and lack of awareness of the problems beyond that group, organisation-wide culture surveys may not be sensitive enough to pick up on signals of risk.
Unobtrusive measures
The widespread use of self-report measures for studying psychological phenomena in organisations is largely grounded in the research techniques available to scholars in the late 20th century (e.g., where data on culture was difficult to access without directly engaging staff), and the limitations of these methods have been widely recognised (Donaldson and Grant-Vallone Citation2002). Furthermore, scholars have considered the potential of ‘unobtrusive measurements’ as an alternative approach to using self-report, observations, and experiments in organisational research (Hill, White, and Wallace Citation2014). Unobtrusive measures involve the analysis of data collected without having to directly engage or elicit responses from participants (e.g., speeches, reports, archival data) (Webb et al. Citation1966). The purpose is to overcome the limitations of self-report measures wherein ‘the processes involved in measurement affect the value obtained for the variable’ (Sechrest and Phillips Citation1979, 3).
Unobtrusive measures are considered useful for overcoming reporting biases (e.g., through analysing extemporaneous and naturally occurring data), providing insight into organisations that are difficult to access (e.g., using publicly available executive data), enabling dynamic data collection (e.g., social media data), supporting longitudinal research (e.g., archive review), and ensuring greater measurement diversity in research (e.g., reducing reliance on self-report data). Although the potential of using unobtrusive measures in organisational research has long been acknowledged, their application to date has been quite limited (Hill, White, and Wallace Citation2014; Webb and Weick Citation1979). However, recent developments in data accessibility (e.g., social media, archives, behavioural data) and data science (e.g., natural language processing) have led to a rapid growth in the number of studies using unobtrusive data (Knight Citation2018; Short, McKenny, and Reid Citation2018; Tonidandel, King, and Cortina Citation2018). These advances are particularly beneficial for the field of organisational culture (Reader et al. Citation2020). For instance, analyses of naturally occurring language enable the study of culture through the mediums (i.e., language, behaviour) in which organisational values are communicated and instantiated. In effect, researchers can study the actual (rather than reported) behaviours, practices, and events that enact and reinforce culture (Cremer, Garicano, and Prat Citation2007; Elahi and Monachesi Citation2012; Schein Citation1999; Tonidandel, King, and Cortina Citation2018).
Unobtrusive measures may be particularly useful for risk researchers investigating organisational culture given that the limitations of self-report measures (i.e., sampling, response biases) are especially acute when studying the values and practices that create risks for organisations (e.g., conduct problems). We build on this idea in the current study, and report on the development of an experimental battery of measurements that could be used to unobtrusively study organisational culture and detect threats to governance, integrity, and other key aspects of corporate functioning.
Unobtrusive indicators of culture for organisations
To synthesise the many different data sources and measurements that can be used to study organizational culture unobtrusively, and capture their conceptual value and distinctness, Reader et al. (Citation2020) describe the construct of an unobtrusive indicator of culture (UIC) for organizations. A UIC refers to ‘a single measure of organizational culture based on naturally occurring data collected without engaging employees’ (Reader et al. Citation2020, 636). The emerging literature using UICs has drawn on a range of heterogeneous data sources, including employee online reviews (Moniz Citation2015), employee emails (Srivastava et al. Citation2018), executive data (Davidson, Dey, and Smith Citation2015), company documents (Erwin Citation2011), financial data (Hoi, Wu, and Zhang Citation2013), and legal data (Hutton, Jiang, and Kumar Citation2015). These data sources are analysed to indicate values and practices within an organisation, for instance, using natural language processing (e.g., in employee online reviews, company reports) to reveal cultural values (e.g., towards results); measuring financial data (e.g., tax practices) to study commitment to social responsibility; or analysing board data (e.g., independence) to test values towards governance and integrity. The UICs generated can be understood in terms of Schein’s description of organisational artefacts, with culture being indicated through the language, behaviours, systems, processes, and rituals within an organisation, which reflect the beliefs and values held by employees and managers.
Research using UICs is in its nascent, exploratory stage, and represents only a small fraction of the culture literature. In general, UICs using natural language processing to analyse textual data have been shown to have better construct validity (e.g., in terms of measurement properties, associations with outcomes) than those using more behavioural forms of data (Reader et al. Citation2020). Furthermore, UICs have typically been developed in isolation from single data sources, and there is currently no battery of UICs available to researchers that combines diverse data sources and measures to unobtrusively study culture. Such a battery of UICs would be highly valuable in detecting the cultural conditions that heighten risk to organisations by offering a diversity of data sources, greater access to organisations, flexibility to study different timeframes, and mitigation of reporting biases. In addition, a multi-source approach to investigating organisational culture and risk, with activities reflecting different stakeholder groups (e.g., employees, managers), would avoid over-reliance on a single method and provide a more holistic assessment of culture (i.e., drawing on different perspectives).
Given the vast number of studies that have been undertaken to develop survey-based measures of organisational culture, significant work is required to develop a comparably deep and well-established set of unobtrusive measures. To contribute to this endeavour, this study reports on the development and evaluation of an experimental battery of UICs designed to measure culture across companies in different industries. Using new and established data sources and UICs, we developed and tested a set of UICs, conceptualised to measure dimensions of organisational culture commonly researched in the literature. The aim was to expand the range and variety of UICs that might be developed to explore organisational culture, to see whether they could be synthesised into a coherent battery of measures, and to consider how they could be used to identify potential risks to organisations.
Current study
Our research consists of two phases. First, in terms of method, we developed an experimental battery of UICs designed to provide insights into organisational culture, drawn from multiple data sources (e.g., annual reports, social media). We used data sources representing different perspectives on culture (e.g., management, employees, other stakeholders), as the problems and risks associated with culture may be more apparent from some stakeholder perspectives (e.g., employees delivering front-line services) than from others (e.g., managerial decision-makers). The measures encompass culture dimensions that have been commonly researched in the literature in order to provide a comprehensive analysis of culture that cuts across the core dimensions (). We then applied the UIC battery to a sample of companies (n = 312) in the MSCI Europe Index (which represents 85% of market capitalisation in Europe). The MSCI Index represents some of the largest equities in Europe and covers different sectors (e.g., consumer discretionary, consumer staples, financials, healthcare, industrials, information technology, materials).
Table 1. Dimensions of culture studied through unobtrusive measures (Reader et al. Citation2020).
Second, for the analysis and results, we examined descriptive data from each UIC’s application to the MSCI Europe Index. We then explored whether, at a dimension level (where individual and normalised UIC scores were combined), the UIC battery could distinguish between companies and industries. Furthermore, we undertook a factor analysis to examine whether the UICs were clustered according to the underlying dimension or data source. Lastly, we considered the relationship between the culture dimensions and Return on Capital Employed (ROCE), a measure that has commonly been used to explore the validity of unobtrusive measurement tools (Reader et al. Citation2020).
Method
Developing the unobtrusive indicators of culture
To develop a battery of UICs, we drew on data sources commonly suggested for unobtrusively investigating organisational culture (Reader et al. Citation2020). Data sources were required to be publicly available for the companies sampled in the study so that cultures could be benchmarked and compared. In , we outline the data sources and consider their advantages and disadvantages for measuring culture (data was collected for 2017). It is noticeable that some data sources represent certain stakeholders (e.g., employee online reviews represent employees). Furthermore, while some data sources can be utilised to study a wide range of culture dimensions (e.g., using natural language processing), others provide a relatively narrow focus (e.g., Twitter, which primarily relates to interactions between companies and their customers).
Table 2. Data sources underlying the UIC battery.1
Unobtrusive indicators of culture: development
Based on the data sources outlined in , we developed a set of experimental UICs. These built on prior literature (Reader et al. Citation2020) through informal discussions with investors, regulators, and senior company managers regarding the indicators they thought were important for evaluating corporate culture. The UICs drew on a mixture of textual and behavioural data.
Textual UICs (e.g., from annual reports, company earnings calls, the employee review website Glassdoor) were calculated based on the concentration of words related to a given topic in the textual data source, for example, words related to professionalism. Texts were parsed using machine learning in order to identify sentences, tokens, and grammatical structure. These parsed texts were then filtered (e.g., only sentences with the future tense) and/or grouped (e.g., all text by the CEO) for specific analyses. We performed several specific analyses, including searching for text patterns (single words up to five-word phrases) among specific groups (employees, management); measuring repetition, vagueness, and sentiment; comparing sentences about the past, present, and future; and comparing topics and sentiment between groups (i.e., investors and management). To create the dictionaries underlying the textual UICs, prototypical words and phrases for each construct (e.g., employee focus) were identified and sense-checked in the context of the texts. Then, using word embeddings based Common Crawl (2.6 unannotated billion web pages; 840 billion occurrences of 2.2 million unique tokens or words) and OntoNotes 5 (2.9 million annotated words), lists of similar words were generated for each concept. These new words were then sense-checked in context to produce final dictionaries of words and phrases. Finally, the ability to view each word and phrase that produced a match in context has been built into the software for developing UICs. Using this functionality, we manually examined all of the textual matches for four companies, removing poorly fitting words and terms from the pattern files.
We also used data from Google Trends to develop UICs, with these data sources revealing the external perceptions of companies, and interactions between companies and consumers. The Google Trends data were calculated by taking the number of searches for the company name as the baseline and then calculating the relative frequency of searches about the company plus key words (e.g., ‘company X’ vs ‘company X strike’).
Finally, we drew on data from CAPIQ, company websites, Boardex, and the European Patent Office to develop a range of UICs. These sources provided insight into company activities, for example, shareholder engagement, company spend, and board composition, that have been conceptualised as being indicative of corporate culture (e.g., governance, adaptability). We collected and analysed the raw data from these data sources.
Initially, we assembled a list of over 200 UICs. Based on feasibility and initial considerations of construct validity, we reduced this number to 108 UICs, which were operationalised into the study data. Of these, 25 had significant amounts of missing data and thus a battery of 83 UICs was developed, covering the culture dimensions listed in . The number of UICs generated per dimension varied according to the distribution of the UICs used to investigate the different culture dimensions in the literature (e.g., integrity, results focus, employee focus, and governance are most commonly studied through UICs), and according to the focus and flexibility of different data sources for investigating organisational culture. A sample of the UICs is reported in , and the full battery is available in an online supplementary file. The number of UICs per dimension and data source can be observed in and , respectively.
Table 3. Example UICs for each dimension.
Scoring for each UIC had four steps. First, the data for negative UICs (e.g., on ‘Complaint searches’ about a company) were reversed so that they could be scaled similarly to positive UICs (e.g., employees writing about their company ‘Valuing professionalism’). Second, the data for each UIC were re-scaled, with 0 being the worst score and 1 being the best score. Third, culture dimensions scores were calculated by averaging the re-scaled scores for the UICs within each dimension. The overall UIC battery score was the average of all the re-scaled UIC scores.
Data collection
We collected data from a representative sample of 312 companies in the MSCI Europe Index. Companies were grouped into three broad sectors: consumer (53 consumer discretionary; 33 consumer staples; 24 financials; 9 real estate), industry (11 energy; 63 industrials; 41 materials; 18 utilities), and technology (31 healthcare; 17 information technology; 12 telecommunications services). We also collected data on ROCE for the year after data collection.
Analysis
For each company, we generated an overall profile of UICs, along with a profile for each culture dimension. UICs were not weighted; each contributed equally to the culture dimensions. However, the distribution of each UIC score was normalised using an ordered quantile transformation. This entails a rank mapping to the normal distribution that, depending on ties, produces normally distributed data centred with a mean around 0 and a standard deviation of about 1. For each UIC, we examined the completeness of data (i.e., missing data), and the skewness, kurtosis, and completeness of data. We then explored the structure of the UIC battery through the following analyses.
A descriptive analysis of the UICs
We examined the UICs in terms of mean scores, standard deviations, skewness, and kurtosis.
UIC profiles by industrial sector
We clustered the UICs into dimensions and then examined them in terms of variations (at the dimension level) between the different industries included in the MSCI Europe Index.
A factor analysis of the UIC
For the factor analysis, we used a generalised low rank model (GLRM) instead of principal component analysis (PCA) because of the heterogeneity of our data. Accordingly, we expected that PCA would cluster the UICs in terms of the data sources or perspectives being represented (e.g., managers vs employees) rather than in terms of the latent culture dimensions. GLRMs are an extension of PCA that can ‘handle arbitrary data sets consisting of numerical, Boolean, categorical, ordinal, and other data types’ (Udell et al. Citation2016, 1). The GLRM starts by assuming that the optimum number of ‘archetypes’ (factors) is the number of observable variables (i.e., no unobserved latent variables). The goal of GLRMs and PCA is to reduce the dimensions of the data by finding the lowest archetype number for the highest amount of explained variance. The cumulative variance explained (CVE) is used to calculate the minimum number of ‘archetypes’ (i.e., principal components) we would need to explain a threshold of the variance set at 0.75. Given the high number of independent data sources, different dimensions examined, and different perspectives/behaviours underlying the data (e.g., employees, managers, stakeholders), the likelihood of developing a factor structure capable of emulating the dimensions outlined in was considered low. Previous research on unobtrusive data, and textual analysis in particular, has argued that factor analysis is not suited for testing the structure of non-questionnaire organisational data (due to the lack of mono-methodological bias and use of different data sources to collect diverse data). Instead, correlations of less than 0.4 between factors indicate independence of psychometric dimensions (McKenny, Short, and Payne Citation2013). We used these as additional criteria to evaluate the battery.
Correlations between the UIC dimensions and ROCE
We examined correlations between the UIC dimensions, while investigating the association with ROCE (using ordered quantile transformation). These were examined through Spearman’s rank-order correlations and multiple regressions with revenue and sector (consumer, industry and technology as binary variables) as controls.
Results
Descriptive data
reports the overall descriptive data for the companies included in the sample. Descriptive data for each UIC is reported in the online supplementary spreadsheet (alongside the full suite of UICs). Data for most of the UICs had a normal distribution, although some had high skewness (e.g., CEO share ownership, which indicates commitment to the company, and governance) and high kurtosis (e.g., words used by employees to report abuses of power, which indicates integrity). Due these characteristics, we normalised all UIC data using an ordered quantile transformation to enable comparison.
Table 4. Descriptive data for companies.
UIC profiles by industrial sector
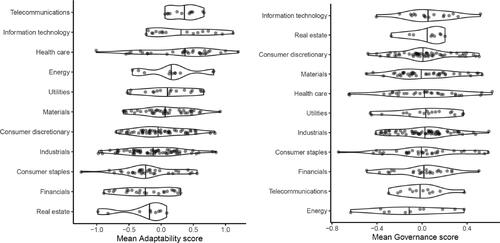
UIC battery profiles were generated for the companies included in the sample. We examined whether corporate culture profiles varied by industry for each dimension. Kruskal-Wallis tests were conducted to examine differences between sectors in terms of each of the culture dimensions. We found the most significance difference for adaptability (Chi square = 50.553, p < .001, df = 10) and the least difference for governance (Chi square = 3.012, p = 0.981, df = 10) (see ). It can be seen that telecommunications, information technology, and healthcare companies generally scored higher than other sectors on adaptability, whereas materials and industrials scored lowest. This result is to be expected, as information technology and healthcare companies must continually adapt their products and services according to technological advances and market demands. Governance showed the least variance, as might be expected given the legal requirements around corporate governance.
Figure 1. UIC battery scores for adaptability and governance for companies in the MSCI Europe Index. Companies are clustered by sector, with horizontal lines showing the mean score for each sector and dots representing individual companies.
A factor analysis of the UICs
presents the outcome of using GLRM to reduce the dimensionality of the data. Beginning with each UIC as a separate archetype yielded a CVE of 1 (as expected) and suggested a reduction to 32 archetypes. Inputting 32 dimensions into the model yielded a CVE of 0.96 and suggested a further reduction to 17 archetypes. However, 17 archetypes yielded a CVE of 0.63, which was below the threshold (0.75). The high dimensionality of the data suggests that the data are very heterogeneous (even after being normalised) and do not yield powerful latent dimensions. A visual inspection of the loadings for the archetypes revealed that the majority of clustering was based on data source. For example, there were clusters of Glassdoor data, Google search data, textual data (factual & numeric text; vague, evasive, & discrepant text). Given the heterogeneity of the data sources, it is not surprising that the culture dimensions were not more salient in the clusters. Three potential clusters were identified within the archetypes (for integrity, employee focus, and results focus). However, this finding is likely because these dimensions are drawn from fairly limited data sources (e.g., employee focus is mostly drawn from employee online reviews).
Table 5. Dimensionality reduction using GLRM.
Correlations between UIC dimensions and ROCE
With the exception of planning and governance, the dimensions did not correlate above 0.5 using Spearman’s rank-order correlations (see ). This indicates that, although a clear latent structure for the UICs could not be ascertained (with factor analysis revealing data source and data type to be primary drivers of clustering), the conceptually derived dimensions being measured were distinct from each other.
Figure 2. Associations between UIC battery culture profiles and Return on Capital Employed and Total Shareholder Return. The lower-left cells are pairwise Spearman’s rank correlations (*p < 0.05, **p < 0.01, ***p < 0.001). The upper-right cells are pairwise scatterplots with linear models overlaid. Boxes facilitate identifying the scatterplot that corresponds to statistically significant correlations: dotted (p < 0.05), dashed (p < 0.01), and solid (p < 0.001). The diagonal displays the distribution of each variable with density plots.
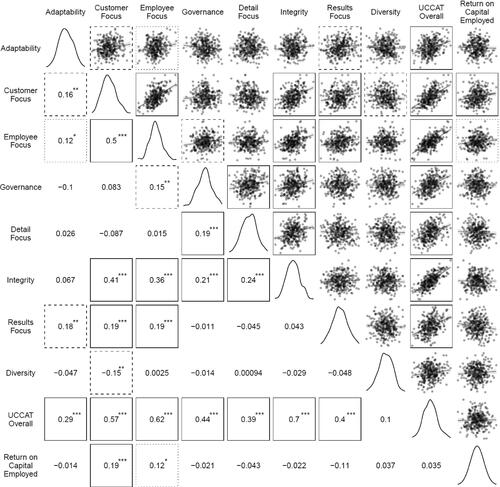
To test the wider validity of the UIC battery, we correlated overall UIC battery scores and ROCE for companies on the MSCI Europe Index (see ). This revealed significant correlations between ROCE and the culture dimensions of customer focus (r = 0.19, p < 0.001) and employee focus (r = 0.12, p < 0.05). Closer examination of the customer focus UICs revealed the individual UICs of ‘industry focus’ (r = 0.288, p < 0.001) and ‘C-suite customer focus’ (r = 0.145, p < 0.05) to correlate strongly with ROCE. To investigate whether the UIC battery was associated with ROCE, we used a stepwise multiple regression (). Model 1 tested the control variables of revenue (a proxy for company size) and company sector (with two binary variables ‘consumer’ and ‘industry’, with a 0 for both indicating the ‘technology’ sector). Model 2 added the average normalised score of all the UICs to the model. Model 3 replaced the average normalised score for all UICs with the average for only UICs pertaining to customer focus. Model 1 found that a linear regression with controls was significant (r2 = 0.043, F(3, 308) = 4.645, p = 0.003). Model 2 found that the average score for all the normalised UICs was also significant (r2 = 0.046, F(4, 307) = 3.736, p = 0.005), but not a meaningful improvement over Model 1 (adjusted r2 change < 0.001, p = 0.316). However, Model 3, which examined only the UICs pertaining to customer focus, created a regression equation (r2 = 0.07, F(4, 307) = 5.733, p < 0.001) that was a significant improvement over Model 1 (adjusted r2 change < 0.023, p = 0.004). This is not surprising given that several of the proposed dimensions (e.g., integrity, employee focus) are not expected to be associated with ROCE.
Table 6. Regression model testing the relationship between the UIC battery culture dimensions and Return on Capital Employed.
Discussion
Organisational culture is often identified as a risk factor contributing to organisational failures. In many domains, for instance finance (FCA 2018), culture measurement is seen as a way to identify conduct problems. Where the organisational culture is poor, the stability and future of the organisation are at risk. Traditionally, surveys have been used to study culture, but this approach may not be optimal due to access limitations, normalisation of poor practices, social desirability, or the requirement for benchmark data. To address these limitations, unobtrusive measures have been suggested for identifying cultures that create risk for organisations. To begin to explore this idea, we tested an experimental battery of 83 UICs, drawn from eight data sources and indicating eight dimensions of culture. We applied the battery to measure culture in 312 of the largest companies in Europe, analysing many millions of words and data points. The purpose was to develop a diverse – in terms of stakeholder perspectives, culture dimensions, and data sources – battery of culture indicators for gauging organisational risk.
We found the majority of individual UICs to be reliable and distributed in a way that distinguished between organisations and sectors. At the dimension level, measures had face validity in terms of variations between sectors, although these variations were not so extreme as to preclude grouping all companies. We were unable to identify a coherent factor structure in the UICs due to the diversity of data sources and stakeholder perspectives. The UICs tended to be clustered according to data source. Although some of the overlap between dimensions and data sources was high (e.g., employee focus and employee online reviews), we did not observe a coherent psychometric model. Dimensions were not highly associated with each other, indicating their distinctiveness. Integrity was the dimension most associated with other dimensions. This finding appears logical, as companies that do not support their employees, focus on customers, or prioritise governance might be expected to also be low in integrity. To test the validity of the UIC battery, we explored the association with ROCE and observed an association between customer focus and ROCE, thus lending some validity to the measurement battery. It was perhaps unsurprising that no other associations were observed, considering the time lag between culture measurement and performance, and the practices represented by other dimensions (e.g., integrity, adaptability, governance).
Theoretical and practical considerations
The study findings present valuable insight into the potential of using unobtrusive data sources for studying organisational culture and risk. On the positive side, it appears possible to use naturally occurring data to develop a broad and diverse range of cultural indicators, which can collectively be used to benchmark culture at a mass scale and potentially detect signs of concern. Distinct culture dimensions could be conceptually developed from the UICs and used to distinguish between industries and company performance (for customer focus); however, the GLRM could not establish a coherent, statistically singular model of culture.
On a less positive note, the absence of a coherent factor structure indicates that an aspect of the UIC battery that we conceptualised as a strength may also be a key weakness. The UIC battery uses diverse data sources to collate different stakeholder perspectives on organisational culture to avoid over-reliance on one perspective or group. We theorise that the problems in a culture that are not apparent to one group (e.g., managers or investors) may be apparent to others (e.g., employees, the public) or emergent across multiple data sources. For instance, problems in ethics and integrity may be more apparent to employees (e.g., concerns being ignored) and the public (e.g., being mis-sold products) than to managers. Indeed, a divergence of perspectives (e.g., on whether the organisation is collaborative) might itself be an indicator of a poor culture. However, in the GLRM analysis, UICs were clustered according to data source, and even though we could identify possible factors (e.g., for integrity, employee focus), these were still linked to the data sources. This difficulty could indicate that it may not be possible to develop a psychometrically valid battery of unobtrusive measures – or at least, reliable and valid in terms of the criteria set for surveys, which rely on a single source of data and, from the outset, are designed with construct validity in mind (e.g., in writing question sets). Alternatively, it could support the idea that it is somewhat reductive to view organisational culture primarily in terms of shared values; rather, ‘practices and beliefs that define a culture are frequently unevenly shared across diverse pockets of an organisation, and are sometimes rife with contradictory elements’ (Howard-Grenville, Lahneman, and Pek Citation2020, 31). While employees may subscribe to a broader vision within an organisation, their values and practices may vary according to the problems they face, the activities they engage in, and the characteristics of a sub-group (Bertels, Howard-Grenville, and Pek Citation2016). The conceptualisation of culture as shared values works well for surveys, which are designed to reveal group norms; however, when measured using talk and behaviour, culture may appear more fragmented and contradictory (e.g., on beliefs around moral behaviour, or what compliance means).
Going forward, there are five options for addressing the UIC battery’s lack of a clear factor structure. First, new UICs may be developed or existing ones amended in order to generate measures that cluster together. Second, culture assessments could explicitly focus on distinct data sources (e.g., only textual), developing and triangulating internally coherent factors. Third, the sample of companies used may have been too small to test the factor structure, and future research may expand the sample to identify more stable factors. Fourth, data sources could be mapped onto different culture dimensions (e.g., customer perspectives in order to assess customer focus) in order to create singular measures with a nomological framework of culture. Finally, a more limited set of culture dimensions could be examined through UICs. Specifically, we found UICs to potentially form three coherent dimensions (integrity, employee focus, results focus), and future research may focus only on these. A combination of the latter two above options appears to be most promising, with UICs being used to investigate a narrower set of dimensions that show clear value for being studied unobtrusively and that can reveal operational risks. For instance, one could analyse employee-generated UICs (e.g., online reviews) to identify problems in integrity and employee focus that might be difficult to report through surveys; analyse management UICs (e.g., earnings calls and annual reviews) to establish values related to results and long-term stability; and assess executive UICs (e.g., reward systems, financial data, shareholder data) to determine governance.
In terms of risk research, the use of UICs (whether those reported in the current study or novel ones) may facilitate new inquiries, for instance, to study culture prior to a failure (e.g., using unobtrusive data that predates the failure) or to identify the characteristics that lead organisations to be resilient during crises (e.g., the financial crisis, COVID-19). UICs specific to particular industries might be developed, for instance, in finance (e.g., compliance data) or safety-critical domains (e.g., learning from incident reports). UICs using naturally occurring data (e.g., social media) may provide ‘real-time’ insight into culture. Data platforms that provide information on companies and are regularly used by investors, regulators, and companies themselves already contain much of the data required to create a UIC-based analysis of corporate culture. Such data might be useful for regulators and investors, or for organisations to supplement staff surveys.
Given the experimental nature of this study, it has numerous limitations. Data were collected for a single year. Our analysis focused on a limited set of publicly owned companies, and UICs would have to be adapted to other settings (e.g., healthcare, government agencies). The distribution of data within some UICs, particularly those focusing on practices, was skewed. The extent to which all of the UICs generated are conceptually valid indicators of culture is debatable. While the textual measures generally capture definitions of culture that focus on shared values, the validity of those using behavioural or institutional data (e.g., legal cases, executive data) is less clear. For instance, legal cases may represent the values of those raising litigation, and Google Trends data may reflect perceptions of popularity rather than culture. Issues such as impression management remain (e.g., for company reports). We did not weight individual UICs, although this could be done according to associations with outcome data or the size of the data corpus. We also did not associate the UICs with internal culture measurements, which is important for establishing convergent validity. Finally, although we suppose UICs may be used to detect organisational risk, we did not establish this with a specific risk-related outcome variable (e.g., corporate scandals, accidents, compliance breaches); this is a recommendation for future research.
Conclusions
Unobtrusive measures have the potential to advance the risk research literature through utilizing advances in data accessibility and data science to provide an alternative approach to investigating organizational culture. To develop this idea, we generated an experimental battery of UICs, drawn from diverse data sources, to investigate organisational culture. While the battery has the potential to provide insight into the values and practices of different stakeholders and to systematically compare organisations through naturally occurring and dynamic data, we were not able to establish a coherent set of statistically reliable dimensions, as the UICs tended to be clustered by data source. Rather than attempting to develop nomological measurement models using UICs, future research could attempt to structure UICs according to the data sources they are drawn from, the stakeholders and practices they represent, and the types of organisational risk they reveal.
Supplemental Material
Download MS Word (21 KB)Acknowledgments
The authors would like to express gratitude to Julie Hald for study support.
Disclosure statement
No potential conflict of interest was reported by the authors.
Additional information
Funding
References
- Antonsen, S. 2009. “Safety Culture Assessment: A Mission Impossible?” Journal of Contingencies and Crisis Management 17 (4): 242–254. doi:10.1111/j.1468-5973.2009.00585.x.
- Bertels, S., J. Howard-Grenville, and S. Pek. 2016. “Cultural Molding, Shielding, and Shoring at Oilco: The Role of Culture in the Integration of Routines.” Organization Science 27 (3): 573–593. doi:10.1287/orsc.2016.1052.
- Bhaskar, K., and J. Flower. 2019. Financial Failures and Scandals: From Enron to Carillion. New York: Routledge.
- Bolino, M. C., K. M. Kacmar, W. H. Turnley, and J. B. Gilstrap. 2008. “A Multi-Level Review of Impression Management Motives and Behaviors.” Journal of Management 34 (6): 1080–1109. doi:10.1177/0149206308324325.
- Boyce, A. S., L. R. Nieminen, M. A. Gillespie, A. M. Ryan, and D. Denison. 2015. “Which Comes First, Organizational Culture or Performance? A Longitudinal Study of Causal Priority with Automobile Dealerships.” Journal of Organizational Behavior 36 (3): 339–359. doi:10.1002/job.1985.
- Cameron, K., and R. Quinn. 1999. Diagnosing and Changing Organizational Culture: Based on the Competing Values Framework. Reading, MA: Addison-Wesley.
- Chatman, J. A., D. F. Caldwell, C. A. O’Reilly, and B. Doerr. 2014. “Parsing Organizational Culture: How the Norm for Adaptability Influences the Relationship between Culture Consensus and Financial Performance in High Technology Firms.” Journal of Organizational Behavior 35 (6): 785–808. doi:10.1002/job.1928.
- Chatman, J. A., and C. A. O’Reilly. 2016. “Paradigm Lost: Reinvigorating the Study of Organizational Culture.” Research in Organizational Behavior 36: 199–224. doi:10.1111/j.2044-8325.1990.tb00525.
- Cooke, R. A., and D. M. Rousseau. 1988. “Behavioral Norms and Expectations: A Quantitative Approach to the Assessment of Organizational Culture.” Group & Organization Studies 13 (3): 245–273. doi:10.1177/105960118801300302.
- Cottrell, A. 2018. “The UK Banking Standards Board: An Outcome-Based Approach to Assessing Organisational Culture.” Journal of Risk Management in Financial Institutions 11 (1): 47–56.
- Cremer, J., L. Garicano, and A. Prat. 2007. “Language and the Theory of the Firm.” The Quarterly Journal of Economics 122 (1): 373–407. doi:10.1162/qjec.122.1.373.
- Davidson, R., A. Dey, and A. Smith. 2015. “Executives’ “off-the-Job” Behavior, Corporate Culture, and Financial Reporting Risk.” Journal of Financial Economics 117 (1): 5–28. doi:10.1016/j.jfineco.2013.07.004.
- Denison, D., L. Nieminen, and L. Kotrba. 2014. “Diagnosing Organizational Cultures: A Conceptual and Empirical Review of Culture Effectiveness Surveys.” European Journal of Work and Organizational Psychology 23 (1): 145–161. doi:10.1080/1359432X.2012.713173.
- Donaldson, S. I., and E. J. Grant-Vallone. 2002. “Understanding Self-Report Bias in Organizational Behavior Research.” Journal of Business and Psychology 17 (2): 245–260. doi:10.1023/A:1019637632584.
- Edmondson, A. 1999. “Psychological Safety and Learning Behavior in Work Teams.” Administrative Science Quarterly 44 (2): 350–383. doi:10.2307/2666999.
- Ehrenhard, M. L., and T. L. Fiorito. 2018. “Corporate Values of the 25 Largest European Banks: Exploring the Ambiguous Link with Corporate Scandals.” Journal of Public Affairs 18 (1): e1700. doi:10.1002/pa.1700.
- Elahi, M. F., and P. Monachesi. 2012. “An Examination of Cross-Cultural Similarities and Differences from Social Media Data with Respect to Language Use.” Paper Presented at the International Conference on Language Resources and Evaluation.
- Erwin, P. M. 2011. “Corporate Codes of Conduct: The Effects of Code Content and Quality on Ethical Performance.” Journal of Business Ethics 99 (4): 535–548. doi:10.1007/s10551-010-0667-y.
- FCA. 2018. DP18/2: Transforming Culture in Financial Services. https://www.fca.org.uk/publication/discussion/dp18-02.pdf
- Gillespie, M. A., D. R. Denison, S. Haaland, R. Smerek, and W. S. Neale. 2008. “Linking Organizational Culture and Customer Satisfaction: Results from Two Companies in Different Industries.” European Journal of Work and Organizational Psychology 17 (1): 112–132. doi:10.1080/13594320701560820.
- Gilligan, G. 2011. “Jérôme Kerviel the ‘Rogue Trader’of Société Générale: Bad Luck, Bad Apple, Bad Tree or Bad Orchard?” The Company Lawyer 32 (12): 355–362.
- Giorgi, S., C. Lockwood, and M. A. Glynn. 2015. “The Many Faces of Culture: Making Sense of 30 Years of Research on Culture in Organization Studies.” Academy of Management Annals 9 (1): 1–54. doi:10.1080/19416520.2015.1007645.
- Grennan, J. A. 2013. “A Corporate Culture Channel: How Increased Shareholder Governance Reduces Firm Value.” Social Science Research Network. https://ssrn.com/abstract=2345384 doi:10.2139/ssrn.2345384.
- Hill, A. D., M. A. White, and J. C. Wallace. 2014. “Unobtrusive Measurement of Psychological Constructs in Organizational Research.” Organizational Psychology Review 4 (2): 148–174. doi:10.1177/2041386613505613.
- Hofstede, G., B. Neuijen, D. D. Ohayv, and G. Sanders. 1990. “Measuring Organizational Cultures: A Qualitative and Quantitative Study across Twenty Cases.” Administrative Science Quarterly 35 (2): 286–316. doi:10.2307/2393392.
- Hoi, C. K., Q. Wu, and H. Zhang. 2013. “Is Corporate Social Responsibility (CSR) Associated with Tax Avoidance? Evidence from Irresponsible CSR Activities.” The Accounting Review 88 (6): 2025–2059. doi:10.2308/accr-50544.
- Howard-Grenville, J., B. Lahneman, and S. Pek. 2020. “Organizational Culture as a Tool for Change.” Stanford Social Innovation Review 18 (3): 28–33.
- Hutton, I., D. Jiang, and A. Kumar. 2015. “Political Values, Culture, and Corporate Litigation.” Management Science 61 (12): 2905–2925. doi:10.1287/mnsc.2014.2106.
- Jahoda, G. 2012. “Critical Reflections on Some Recent Definitions of “Culture.” Culture & Psychology 18 (3): 289–303. doi:10.1177/1354067X12446229.
- Jung, T., T. Scott, H. T. Davies, P. Bower, D. Whalley, R. McNally, and R. Mannion. 2009. “Instruments for Exploring Organizational Culture: A Review of the Literature.” Public Administration Review 69 (6): 1087–1096. doi:10.1111/j.1540-6210.2009.02066.
- Kaptein, M. 2011. “Understanding Unethical Behavior by Unraveling Ethical Culture.” Human Relations 64 (6): 843–869. doi:10.1177/0018726710390536.
- Knight, A. P. 2018. “Innovations in Unobtrusive Methods.” In Unconventional Methodology in Organization and Management Research, edited by A. Bryman and D. Buchanan, 64–83. Oxford: Oxford University Press.
- Kotrba, L. M., M. A. Gillespie, A. M. Schmidt, R. E. Smerek, S. A. Ritchie, and D. R. Denison. 2012. “Do Consistent Corporate Cultures Have Better Business Performance? Exploring the Interaction Effects.” Human Relations 65 (2): 241–262. doi:10.1177/0018726711426352.
- Leaver, M., and T. Reader. 2019. “Safety Culture in Financial Trading: An Analysis of Trading Misconduct Investigations.” Journal of Business Ethics 154 (2): 461–481. doi:10.1007/s10551-017-3463-0.
- Mannion, R., F. Konteh, and H. Davies. 2009. “Assessing Organisational Culture for Quality and Safety Improvement: A National Survey of Tools and Tool Use.” Quality & Safety in Health Care 18 (2): 153–156. doi:10.1136/qshc.2007.024075.
- Martin, J. 1992. Cultures in Organizations: Three Perspectives. Oxford: Oxford University Press.
- McKenny, A. F., J. C. Short, and G. T. Payne. 2013. “Using Computer-Aided Text Analysis to Elevate Constructs: An Illustration Using Psychological Capital.” Organizational Research Methods 16 (1): 152–184. doi:10.1177/1094428112459910.
- McSweeney, B. 2002. “Hofstede’s Model of National Cultural Differences and Their Consequences: A Triumph of Faith-a Failure of Analysis.” Human Relations 55 (1): 89–118. doi:10.1177/0018726702551004.
- Mearns, K., S. M. Whitaker, and R. Flin. 2001. “Benchmarking Safety Climate in Hazardous Environments: A Longitudinal, Interorganizational Approach.” Risk Analysis : An Official Publication of the Society for Risk Analysis 21 (4): 771–786. doi:10.1111/0272-4332.214149.
- Moniz, A. 2015. “Inferring Employees’ Social Media Perceptions of Goal-Setting Corporate Cultures and the Link to Firm Value.” Unpublished Working Paper.
- Morris, M. W., K. Leung, D. Ames, and B. Lickel. 1999. “Views from inside and outside: Integrating Emic and Etic Insights about Culture and Justice Judgment.” Academy of Management Review 24 (4): 781–796. doi:10.5465/amr.1999.2553253.
- Morrison, E. W., and F. J. Milliken. 2000. “Organizational Silence: A Barrier to Change and Development in a Pluralistic World.” Academy of Management Review 25 (4): 706–725. doi:10.5465/amr.2000.3707697.
- O’Reilly, C. A., J. Chatman, and D. F. Caldwell. 1991. “People and Organizational Culture: A Profile Comparison Approach to Assessing Person-Organization Fit.” Academy of Management Journal 34 (3): 487–516. doi:10.5465/256404.
- Paté‐Cornell, M. E. 1993. “Learning from the Piper Alpha Accident: A Postmortem Analysis of Technical and Organizational Factors.” Risk Analysis 13 (2): 215–232. doi:10.1111/j.1539-6924.1993.tb01071.x.
- Pless, N., and T. Maak. 2004. “Building an Inclusive Diversity Culture: Principles, Processes and Practice.” Journal of Business Ethics 54 (2): 129–147. doi:10.1007/s10551-004-9465-8.
- Ramamoorti, S. 2008. “The Psychology and Sociology of Fraud: Integrating the Behavioral Sciences Component into Fraud and Forensic Accounting Curricula.” Issues in Accounting Education 23 (4): 521–533. doi:10.2308/iace.2008.23.4.521.
- Reader, T., A. Gillespie, J. Hald, and M. Patterson. 2020. “Unobtrusive Indicators of Culture for Organizations: A Systematic Review.” European Journal of Work and Organizational Psychology 29 (5): 633–649. doi:10.1080/1359432X.2020.1764536.
- Reader, T., M. C. Noort, S. Shorrock, and B. Kirwan. 2015. “Safety Sans Frontières: An International Safety Culture Model.” Risk Analysis : An Official Publication of the Society for Risk Analysis 35 (5): 770–789. doi:10.1111/risa.12327.
- Reader, T., and P. O’Connor. 2014. “The Deepwater Horizon Explosion: Non-Technical Skills, Safety Culture, and System Complexity.” Journal of Risk Research 17 (3): 405–424. doi:10.1080/13669877.2013.815652.
- Reason, J. 2000. “Safety Paradoxes and Safety Culture.” Injury Control and Safety Promotion 7 (1): 3–14. doi:10.1076/1566-0974(200003)7:1;1-V;FT003.
- Ring, P. J., C. Bryce, R. McKinney, and R. Webb. 2016. “Taking Notice of Risk Culture–the Regulator’s Approach.” Journal of Risk Research 19 (3): 364–387. doi:10.1080/13669877.2014.983944.
- Schein, E. 1999. The Corporate Culture Survival Guide. San Francisco, CA: John Wiley & sons.
- Schneider, B., M. G. Ehrhart, and W. H. Macey. 2013. “Organizational Climate and Culture.” Annual Review of Psychology 64: 361–388. doi:10.1146/annurev-psych-113011-143809.
- Sechrest, L., and M. Phillips. 1979. “Unobtrusive Measures: An Overview.” In New Directions for Methodology of Behavioral Science, edited by L. Sechrest, 1–17. San Francisco, CA: Jossey-Bass, Inc.
- Short, J. C., A. F. McKenny, and S. W. Reid. 2018. “More than Words? Computer-Aided Text Analysis in Organizational Behavior and Psychology Research.” Annual Review of Organizational Psychology and Organizational Behavior 5 (1): 415–435. doi:10.1146/annurev-orgpsych-032117-104622.
- Sims, R. R., and J. Brinkmann. 2003. “Enron Ethics (or: Culture Matters More than Codes).” Journal of Business Ethics 45 (3): 243–256. doi:10.1023/A:1024194519384.
- Srivastava, S. B., A. Goldberg, V. G. Manian, and C. Potts. 2018. “Enculturation Trajectories: Language, Cultural Adaptation, and Individual Outcomes in Organizations.” Management Science 64 (3): 1348–1364. doi:10.1287/mnsc.2016.2671.
- Tonidandel, S., E. B. King, and J. M. Cortina. 2018. “Big Data Methods: Leveraging Modern Data Analytic Techniques to Build Organizational Science.” Organizational Research Methods 21 (3): 525–547. doi:10.1177/1094428116677299.
- Udell, M., C. Horn, R. Zadeh, and S. Boyd. 2016. “Generalized Low Rank Models. Foundations and Trends.” Machine Learning 9 (1): 1–118.
- Vaughan, D. 1999. “The Dark Side of Organizations: Mistake, Misconduct, and Disaster.” Annual Review of Sociology 25 (1): 271–305. doi:10.1146/annurev.soc.25.1.271.
- Webb, E., D. T. Campbell, R. D. Schwartz, and L. Sechrest. 1966. Unobtrusive Measures: Nonreactive Research in the Social Sciences. Chicago, IL: Rand McNally.
- Webb, E., and K. E. Weick. 1979. “Unobtrusive Measures in Organizational Theory: A Reminder.” Administrative Science Quarterly 24 (4): 650–659. doi:10.2307/2392370.