
Abstract
Objective
To investigate whether routine assessment of free testosterone improves the diagnostic accuracy of functional hypogonadism.
Methods
Total and free testosterone (calculated on SHBG levels) were determined in 188 patients with sexual symptoms and 184 with infertility.
Results
Hypogonadism (calculated free testosterone <63 pg/ml) was found in 47/188 (25.0%) patients with sexual symptoms and in 21/184 (11.4%) with infertility. Total testosterone determination misdiagnosed hypogonadism in 8.4% (12/143) of men with sexual symptoms and in 2% (3/152) with infertility. In subjects with borderline total testosterone, only 24.7% (19/77) had hypogonadism confirmed by free testosterone levels. Free testosterone levels significantly correlated with age, haematocrit, gonadotropins, gynecomastia, BMI, and number of co-morbidities, whereas total testosterone associated only with the latter two. Furthermore, age, haematocrit, BMI, and the presence of erectile dysfunction and of low libido were significantly different between men with normal and low free testosterone, whereas only BMI and low libido were significantly different between patients with normal and low total testosterone.
Conclusion
Routine assessment of free testosterone allows a more accurate diagnosis of functional hypogonadism, especially in men with sexual symptoms. Free testosterone levels associate with clinical and biochemical parameters of androgen deficiency better than total testosterone levels.
Introduction
Male hypogonadism is a clinical syndrome resulting from a failure of the testis to produce physiological concentrations of testosterone (T) and/or a normal number of spermatozoa, due to a testicular impairment (primary hypogonadism) or an alteration at the hypothalamus-pituitary axis (secondary hypogonadism)[Citation1–3]. The main causes of primary hypogonadism are Klinefelter syndrome, cryptorchidism, testicular trauma, anorchia or iatrogenic testicular damage, while some causes of secondary hypogonadism are obesity, use of opioids and pituitary diseases [Citation1]. Moreover, hypogonadism can be classified as organic or functional [Citation2,Citation4]: the organic form is generally an irreversible condition due to pathological perturbations of the hypothalamic-pituitary-testis (HPT) axis, whereas functional hypogonadism is a syndrome occurring in the absence of structural impairment of HPT axis [Citation2]. The latter is frequent in middle-aged or older men (often referred in this case to as late-onset or adult-onset hypogonadism) with co-morbidities [such as obesity [Citation5], metabolic syndrome [Citation6], diabetes mellitus type 2 [Citation7], cardiopathies [Citation2], hepatopathy [Citation2], multi-therapy [Citation2], Human Immunodeficiency Virus (HIV) [Citation8,Citation9]] and it may be potentially reversible if the underlying causes are treated or removed [Citation2].
In adults, the most specific signs of hypogonadism, besides infertility, are sexual symptoms (erectile dysfunction, reduced morning erections, decreased libido), gynecomastia, fatigue, reduced muscle strength and low bone mass [Citation1]. These symptoms result from the reduction below physiological levels of plasma T, given its systemic role and on sexual function [Citation10–12].
Current guidelines from the Endocrine Society and European Academy of Andrology (EAA) recommend a diagnosis of hypogonadism in men with symptoms and signs of T deficiency and low serum T concentrations [Citation1,Citation2]. In particular, for functional hypogonadism the diagnosis can be made with total T (TT) values <2.31 ng/ml [Citation2]. The measurement of free T (FT) is recommended only in men with hypogonadal symptoms and borderline TT levels (2.31–3.50 ng/ml) or with conditions lowering sex hormone binding globulin (SHBG) – such as obesity, type 2 diabetes mellitus or steroids therapy – or increasing SHBG – such as aging, HIV or liver cirrhosis [Citation2,Citation13]. A cut-off value for FT <63 pg/ml has been suggested for diagnosis [Citation2].
Therefore, the current guidelines [Citation1,Citation2] place a preeminent role of the TT assay for the diagnosis of male hypogonadism, limiting the usefulness of the FT only to selected cases.
The aim of the present study is to analyse whether routine assessment of calculated FT (cFT), irrespectively to TT levels, could improve the accuracy of diagnosis of functional hypogonadism, and to correlate cFT and TT levels with clinical and biochemical parameters of androgen deficiency. To this aim we analysed a large cohort of men presenting with sexual symptoms or infertility without organic causes of hypogonadism.
Materials and methods
We studied 372 consecutive men >18 years (yr), presenting with sexual symptoms (erectile dysfunction, reduced morning erections, low libido, n = 188) or infertility (inability to conceive after 1 yr of regular unprotected sexual intercourses [Citation14], n = 184). Sexual symptoms were assessed by clinicians after detailed interview of the patients. The exclusion criteria were: <18 yr, ongoing T replacement therapy or other hormonal therapy (e.g. gonadotropins), known forms of organic hypogonadism (such as Klinefelter syndrome and other chromosomal abnormalities, Kallmann syndrome and other congenital hypogonadotropic hypogonadism, cryptorchidism, testicular trauma and torsion, orchitis, HIV, chemo- and radio-therapy, bone marrow transplant, pituitary disorders, testis cancer).
All subjects performed a complete andrological assessment with history, physical and testicular examination.
All blood samples were obtained between 8.00 and 10.00 am, after a 12-h overnight fast. Blood samples were collected for the following biochemical assays: complete blood count, glycemia, glycated Hb, albumin, PSA, TT (chemiluminescence microparticle immunoassay—CMIA), SHBG (chemiluminescence immunoassay—CLIA), follicle stimulating hormone (FSH) (CMIA), luteinizing hormone (LH) (CMIA), estradiol (CMIA), 25-OH-vitamin D (High-Pressure Liquid Chromatography with UV Detector – HPLC–UV). cFT was calculated based on SHBG and albumin concentration according to the Vermeulen formula [Citation15]. Intra- and inter-assay coefficient of variance for TT, LH and SHBG was < 5%. All blood samples were analysed at the central laboratory at the University Hospital of Brescia.
Hypogonadism was defined on LH and cFT levels. Threshold for low cFT values were set at < 63 pg/ml [Citation2], normal levels of LH were set at ≤9.4 IU/L [Citation16,Citation17]. Hypogonadism was classified in primary (LH > 9.4 IU/L, cFT < 63 pg/mL), normogonadotropic/secondary (LH ≤ 9.4, cFT < 63 pg/mL) and subclinical/compensated (LH > 9.4 IU/L and cFT ≥ 63 pg/L) [Citation1,Citation2]. TT levels were defined according to guidelines for functional hypogonadism [Citation2]: hypogonadism values <2.31 ng/ml, borderline values between 2.31 and 3.50 ng/ml. For 14 patients, LH determination was not available.
Ethical approval for this study was obtained from Local Ethical Committee (Comitato Etico di Brescia, NP 3898) and informed consent was obtained from all participants.
Statistical Package for the Social Sciences software IBM SPSS Statistics, Version 26.0, Armonk, (NY) was used for statistical analysis. Since the variables were not normally distributed (Kolmogorov–Smirnov test was used), comparison between medians of the quantitative variables was performed with non-parametric Kruskal–Wallis H test (followed by post hoc Bonferroni test when a significant difference was found) or Mann–Whitney U test, as appropriate. Comparison between categorial variables was performed with Pearson’s Chi Square. Correlation between TT and cFT values with clinical and biochemical data was performed with Pearson’s correlation for continuous variables and point-biserial correlation for categorical variables. Binary linear logistic regression was performed in order to assess the risk factor/co-morbidities associated with male hypogonadism when using TT vs cFT values. Receiver operating characteristic (ROC) curves were used to analyse the sensitivity and specificity of cFT and TT in diagnosing the presence of sexual symptoms, and to establish the best cut-off levels for TT and cFT in diagnosing these symptoms. Comparison between the area under the curve (AUC) of the ROC curves of cFT and TT was performed with Z-test. A p value <.05 was considered significant.
Results
The study included 372 men, with a median age of 44 yr: 188 (median age 53 yr) presenting with sexual symptoms (erectile dysfunction, reduced libido and morning erection) and 184 (median age 37 yr) with infertility. Clinical and biochemical data of these two groups are presented in .
Table 1. Comparison of clinical and biochemical data of patients presenting for symptoms of hypogonadism or infertility.
Hypogonadism (cFT <63 pg/ml) was found in 68/372 subjects (18.3%) (): 47/188 (25.0%) in men with sexual symptoms and 21/184 (11.4%) in men with infertility. TT <2.31 ng/ml was found in 40/372 (10.7%): 25/188 (13.3%) in men with sexual symptoms and 15/184 (8.1%) in men with infertility. Borderline TT levels (2.31 ng/ml ≤ TT <3.5 ng/ml) was found in 77/372 (20.7%): 45/188 (23.9%) in men with sexual symptoms and 32/184 (17.4%) in men with infertility. shows the classification of hypogonadism in primary and normogonadotropic/secondary for the two groups.
Figure 1. Distribution of cases according to levels of TT and cFT. TT = total testosterone; cFT = calculated free testosterone. The patients are classified in six classes based on low, borderline, normal total testosterone concentrations and low or normal free testosterone concentrations.
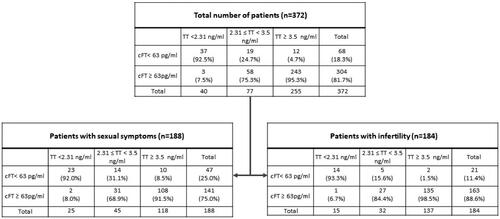
Table 2. Type of hypogonadism based on LH and cFT.
shows that TT determination misdiagnosed hypogonadism (both in term of false positives – low TT but normal cFT, and false negatives – normal TT but low cFT) in 8.4% (12/143) of men with sexual symptoms and in 2% (3/152) of men with infertility. In particular, for patients with sexual symptoms, of 25 with TT <2.31 ng/ml, 2 (8.0%) had normal cFT (false positives), of 118 with TT ≥ 3.5 ng/ml, 10 (8.5%) had low cFT (false negatives); for patients with infertility, of 15 with TT <2.31 ng/ml, 1 (6.7%) had normal cFT (false positives), of 137 with TT ≥ 3.5 ng/ml, 2 (1.5%) had low cFT (false negatives).
The discordant results between TT and cFT values are due to differences in SHBG levels. In fact, patients with normal TT and low cFT (n = 12) had higher SHBG levels compared to those (n = 3) with low TT but normal cFT (66.0 vs 11.0 nmol/L, p < .01, data not shown). Of note, none of these patients with discordant results between TT and cFT had conditions known to alter SHBG, such as obesity, type 2 diabetes mellitus, HIV or liver dysfunction.
In subjects with borderline TT, only 31.1% (14/45) among men with sexual symptoms and 15.6% (5/32) among men with infertility had hypogonadism confirmed by cFT levels.
We then analysed the correlations between cFT and TT values with clinical and biochemical variables of androgenicity (). We found a significant negative correlation between cFT and weight, body mass index (BMI), age, LH, FSH, gynecomastia and number of co-morbidities, and a positive correlation with haematocrit. Conversely, TT showed a negative correlation only with weight, BMI and number of co-morbidities.
Table 3. Pearson’s correlations of TT/cFT with different variables.
reported a comparison between patients with low vs normal cFT values and with low vs borderline vs normal TT levels. Men with low cFT were older, with a higher weight and BMI, more comorbid, had a lower haematocrit and complained more often erectile dysfunction and decreased libido. Instead, when considering TT, we only found that patients with TT <2.31 ng/ml had higher weight and BMI and higher prevalence of low libido compared with men with normal TT, and that patients with TT in the borderline range had higher weight and number of co-morbidities and higher prevalence of low libido compared with men with normal TT.
Table 4. Comparison between patients with low/normal cFT and with low/borderline/normal TT levels.
At a binary linear logistic regression (), we found that BMI was the only factor associated with both low cFT and TT values (considering either TT < 2.31 or < 3.50 ng/ml). In addition, age was an independent risk factor for low cFT.
Table 5. Binary linear logistic regression on the factors associated with low testosterone. Singificant data are in bold.
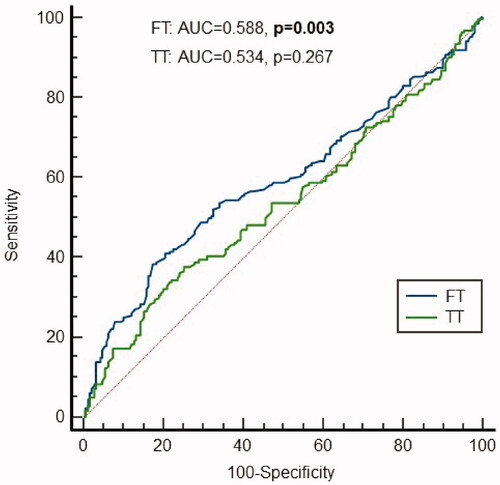
Finally, we analysed the sensitivity and specificity of cFT and TT in diagnosing the presence of sexual symptoms, and the best cut-off levels for TT and cFT in diagnosing them (). ROC curves showed that only cFT values were significantly predictive for the presence of sexual symptoms, with good specificity (87%), but low sensitivity (27%). The AUC for TT and cFT were significantly different (Z-test 2.786, p = .005). In addition, we found that the optimal cFT level would be < 70.0 pg/ml (sensitivity 38%, specificity 83%).
Figure 2. ROC curve of cFT and TT values predictive of sexual symptoms. Analysis of the accuracy of free testosterone and total testosterone in the diagnosis of sexual symptoms.
Discussion
We found that, in cases of suspected functional hypogonadism, routine, first line, assessment of cFT has a more accurate diagnostic performance, especially in men with sexual symptoms, and should not be limited to selected cases, as suggested by guidelines [Citation2]. This is mainly due to individual variations in SHBG that are not always predictable and to a large extent genetically-determined. Importantly, the cases of discordant TT/cFT values are characterized by high or low levels of SHBG that were unpredictable, as none of these patients had conditions known to alter SHBG. Furthermore, cFT levels are associated better than TT levels with clinical and biochemical parameters of androgen deficiency. On the contrary, in the setting of male infertility, its routine clinical usefulness is less evident.
We agree with guidelines that suggest measurement of FT when TT levels are in the borderline range [Citation2], because in these cases, only a small fraction of men will receive a diagnosis of hypogonadism (about 30% of men with sexual symptoms and 15% of men with infertility). Therefore, T replacement therapy could be avoided in more than 70% of men with borderline TT levels if FT is assessed.
We confirmed data in the literature that cFT levels are more specific than TT in identifying patients with androgen deficiency-like symptoms, as for example it has been demonstrated for erectile dysfunction [Citation18,Citation19]. Interestingly, we found that the accuracy of low cFT in the diagnosis of sexual symptoms was significantly higher with respect to low TT. Furthermore, we found that the optimal cut off level for cFT in diagnosing sexual symptoms was slightly higher with respect to that reported in guideline for the diagnosis and treatment of functional hypogonadism (70.0 pg/ml in our study, 63 pg/ml in the EAA guideline [Citation2]). Moreover, we observed that low cFT showed better correlations, compared to patients with borderline/low TT, with age, sexual symptoms (erectile dysfunction), gynecomastia, haematocrit and gonadotropins. Indeed, it is known that age-related increase of SHBG reduces cFT values and it may impair male general health [Citation20].
The prominent role given to TT determination, rather than to FT, in the diagnostic process of male hypogonadism, is not in line with other fields of endocrinology, where assessment of the free fractions of circulating hormones is preferable to have a more accurate diagnosis. Furthermore, besides known conditions able to modify SHBG levels, SHBG plasma concentrations (and therefore FT) are not predictable in most cases and instead are highly genetically determined [Citation21–25]. In agreement with this, SHBG levels have been associated with many clinical manifestations, including type 2 diabetes, metabolic syndrome, and cardiovascular diseases [Citation21,Citation26,Citation27]. As a consequence, the determination only of TT might potentially misdiagnose hypogonadism in conditions where SHBG levels are unpredictable low (false positives) or high (false negatives). In addition, some studies clearly showed that low FT is associated with signs and symptoms of hypogonadism even in men with normal TT values [Citation18].
Although FT represents the active form of the hormone, its routine use in clinical practice is also hampered by analytical problems. The gold standard for measuring FT is the equilibrium dialysis [Citation28] but it is not always available, while direct immunoassays are not reliable [Citation28]. A valid alternative is the calculation of FT (cFT, calculated FT) with the Vermeulen formula, based on values of TT, SHBG and albumin (www.issam.ch) [Citation15]. To this regard, it is important to note that the SHBG measurement is a reliable, easily available and cheap determination [Citation29].
The main limitation of our study is the absence of a control group, namely subjects without sexual symptoms and infertility. However, our primary aim was not the determination of the prevalence of hypogonadism or T levels in symptomatic men with respect to control men, but rather to compare the diagnostic efficiency of cFT vs TT in symptomatic men. Strengths of the study are the relative high number of patients included, and the availability of a complete and proper gonadal hormonal assessment performed in the same laboratory.
Conclusions
This is the first study evaluating the impact of cFT assessment to diagnose functional hypogonadism in men with hypogonadal symptoms or infertility. We provide evidence that routine, first line, assessment of cFT has a more accurate diagnostic performance than reserving its determination only in selected cases, as suggested by guidelines. This is mainly due to individual variations in SHBG that are not always predictable. On the contrary, in the setting of male infertility, its routine clinical usefulness is less evident.
Disclosure statement
No potential conflict of interest was reported by the author(s).
Additional information
Funding
References
- Bhasin S, Brito JP, Cunningham GR, et al. Testosterone therapy in men with hypogonadism: an endocrine society clinical practice guideline. J Clin Endocrinol Metab. 2018;103(5):1715–1744.
- Corona G, Goulis DG, Huhtaniemi I, et al. European academy of andrology (EAA) guidelines on investigation, treatment and monitoring of functional hypogonadism in males: endorsing organization: European society of endocrinology. Andrologia. 2020;8(5):970–987.
- Salonia A, Bettocchi C, Carvalho J, et al. EAU guidelines on sexual and reproductive health. In: European Association of Urology guidelines. Arnhem, The Netherlands: EAU Guidelines Office; 2020. Available at: https://uroweb.org/guideline/sexual-and-reproductive-health/
- Grossmann M, Matsumoto AM. A perspective on Middle-Aged and older men with functional hypogonadism: focus on holistic management. J Clin Endocrinol Metab. 2017;102(3):1067–1075.
- Rastrelli G, Lotti F, Reisman Y, et al. Metabolically healthy and unhealthy obesity in erectile dysfunction and male infertility. Expert Rev Endocrinol Metab. 2019;14(5):321–334.
- Corona G, Maseroli E, Rastrelli G, et al. Is late-onset hypogonadotropic hypogonadism a specific age-dependent disease, or merely an epiphenomenon caused by accumulating disease-burden? Minerva Endocrinol. 2016;41(2):196–210.
- Corona G, Monami M, Rastrelli G, et al. Type 2 diabetes mellitus and testosterone: a meta-analysis study. Int J Androl. 2011;34(6pt1):528–540.
- Pezzaioli LC, Porcelli T, Delbarba A, et al. Impact of hypogonadism on bone mineral density and vertebral fractures in HIV-infected men. J Endocrinol Invest. 2022;45(2):433–443.
- Quiros-Roldan E, Porcelli T, Pezzaioli LC, et al. Hypogonadism and liver fibrosis in HIV-infected patients. J Endocrinol Invest. 2021;44(9):1971–1979.
- Wu FC, Tajar A, Beynon JM, et al. Identification of late-onset hypogonadism in middle-aged and elderly men. N Engl J Med. 2010;363(2):123–135.
- Rastrelli G, Corona G, Maggi M. Testosterone and sexual function in men. Maturitas. 2018;112:46–52.
- Foresta C, Ferlin A, Lenzi A, et al. The great opportunity of the andrological patient: cardiovascular and metabolic risk assessment and prevention. Andrology. 2017;5(3):408–413.
- Pezzaioli LC, Quiros-Roldan E, Paghera S, et al. The importance of SHBG and calculated free testosterone for the diagnosis of symptomatic hypogonadism in HIV-infected men: a single-centre real-life experience. Infection. 2021;49(2):295–303.
- Ferlin A, Foresta C. Infertility: practical clinical issues for routine investigation of the male partner. J Clin Med. 2020;9(6):1644.
- Vermeulen A, Verdonck L, Kaufman JM. A critical evaluation of simple methods for the estimation of free testosterone in serum. J Clin Endocrinol Metab. 1999;84(10):3666–3672. Oct
- Ferlin A, Garolla A, Ghezzi M, et al. Sperm count and hypogonadism as markers of general male health. Eur Urol Focus. 2021;7(1):205–213.
- Tajar A, Forti G, O'Neill TW, et al. Characteristics of secondary, primary, and compensated hypogonadism in aging men: evidence from the European male ageing study. J Clin Endocrinol Metab. 2010;95(4):1810–1818.
- Antonio L, Wu FC, O'Neill TW, et al. Low free testosterone is associated with hypogonadal signs and symptoms in men with normal total testosterone. J Clin Endocrinol Metab. 2016;101(7):2647–2657.
- Boeri L, Capogrosso P, Ventimiglia E, et al. Does calculated free testosterone overcome total testosterone in protecting from sexual symptom impairment? Findings of a cross-sectional study. J Sex Med. 2017;14(12):1549–1557.
- Yeap BB, Almeida OP, Hyde Z, et al. In men older than 70 years, total testosterone remains stable while free testosterone declines with age. The health in men study. Eur J Endocrinol. 2007;156(5):585–594.
- Arathimos R, Millard LAC, Bell JA, et al. Impact of sex hormone-binding globulin on the human phenome. Hum Mol Genet. 2020;29(11):1824–1832.
- Coviello AD, Zhuang WV, Lunetta KL, et al. Circulating testosterone and SHBG concentrations are heritable in women: the Framingham heart study. J Clin Endocrinol Metab. 2011;96(9):E1491–E1495. Sep
- Harris JA, Vernon PA, Boomsma DI. The heritability of testosterone: a study of Dutch adolescent twins and their parents. Behav Genet. 1998;28(3):165–171.
- Coviello AD, Haring R, Wellons M, et al. A genome-wide association meta-analysis of circulating sex hormone-binding globulin reveals multiple loci implicated in sex steroid hormone regulation. PLoS Genet. 2012;8(7):e1002805.
- Ohlsson C, Wallaschofski H, Lunetta KL, et al. Genetic determinants of serum testosterone concentrations in men. PLoS Genet. 2011;7(10):e1002313. Oct
- Li Y, Si S, Hou L, et al. Causal effect of sex hormone-binding globulin and testosterone on coronary heart disease: a multivariable and network Mendelian randomization analysis. Int J Cardiol. 2021;339:179–184.
- Simó R, Sáez-López C, Barbosa-Desongles A, et al. Novel insights in SHBG regulation and clinical implications. Trends Endocrinol Metab. 2015;26(7):376–383.
- Morley JE, Patrick P, Perry HM. Evaluation of assays available to measure free testosterone. Metabolism. 2002;51(5):554–559.
- Shea JL, Wong PY, Chen Y. Free testosterone: clinical utility and important analytical aspects of measurement. Adv Clin Chem. 2014;63:59–84.